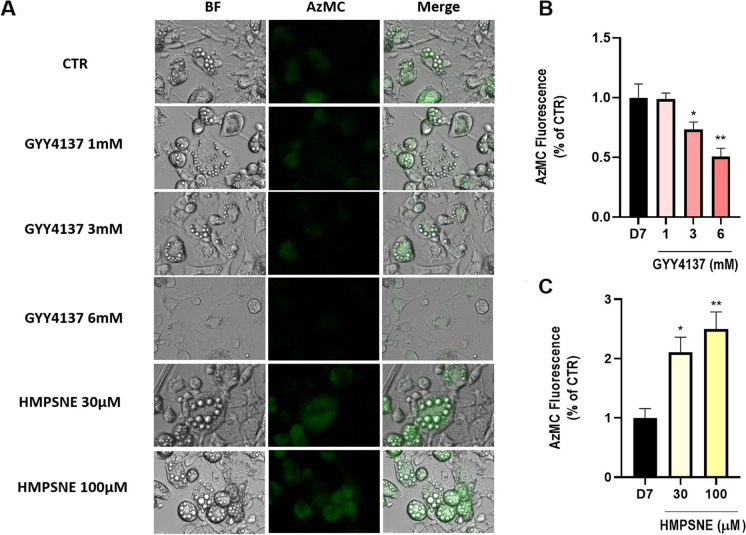
Fig. 6.
Quantification of cellular H2S content of differentiated adipocytes using the AzMC probe. A Bright field (BF) and AzMC fluorescence emitted by mature adipocytes (day 7). Quantification of AzMC signal at increasing concentrations of B GYY4137 and C HMPSNE. Data refer to mean values of N = 5 independent experiments ± SEM. *p < 0.05, **p < 0.01 show significant differences in AzMC fluorescence compared to control values in the absence of pharmacological modulator treatment

