

Abstract
Purpose:
Chemical exchange saturation transfer (CEST) MRI is promising to detect dilute metabolites and microenvironment properties, which has been increasingly adopted in imaging disorders such as acute stroke and cancer. However, in vivo CEST MRI quantification remains challenging because routine asymmetry analysis (MTRasym) or Lorentzian decoupling measures a combined effect of the labile proton concentration and its exchange rate. Therefore, our study aimed to quantify amide proton concentration and exchange rate independently in a cardiac arrest-induced global ischemia rat model.
Methods:
The amide proton CEST (APT) effect was decoupled from tissue water, macromolecular magnetization transfer, nuclear overhauser enhancement, guanidinium, and amine protons using the Image Downsampling Expedited Adaptive Least-squares (IDEAL) fitting algorithm on Z-spectra obtained under multiple RF power levels, before and after global ischemia. Omega plot analysis was applied to determine amide proton concentration and exchange rate simultaneously.
Results:
Global ischemia induces a significant APT signal drop from intact tissue. Using the modified omega plot analysis, we found that the amide proton exchange rate decreased from 29.6 ± 5.6 to 12.1 ± 1.3 s−1 (P < 0.001), while the amide proton concentration showed little change (0.241 ± 0.035 % vs. 0.202 ± 0.034 %, P = 0.074) following global ischemia.
Conclusion:
Our study determined the labile proton concentration and exchange rate underlying the in vivo APT MRI. The significant change in the exchange rate but not the concentration of amide proton demonstrated that the pH effect dominates the APT contrast during tissue ischemia.
Keywords: amide proton transfer (APT), chemical exchange saturation transfer (CEST), global ischemia, Image Downsampling Expedited Adaptive Least-squares (IDEAL) fitting, omega plot
Introduction
Chemical Exchange Saturation Transfer (CEST) MRI is sensitive to the interaction between the labile and bulk tissue water protons, providing an informative imaging contrast (1,2). CEST MRI has been applied to investigate acute stroke (3–6), tumor (7–11), neurological disorders (12–14), osteoarthritis (15), and muscle physiology (16,17), etc. However, the commonly used magnetization transfer (MT) asymmetry analysis (MTRasym) provides a mixed contrast, with contaminations from neighboring exchangeable proton pools, nuclear overhauser enhancement (NOE), and macromolecular MT effects (18–21). Moreover, the CEST measurement depends on radiofrequency (RF) irradiation amplitude and duration, T1 and T2 (22). As such, quantitative CEST (qCEST) analysis that fully characterizes the CEST system helps elucidate the underlying tissue changes. There has been continuous effort to model the CEST MRI through Bloch-McConnell equations (22,23), spinlock solutions (24–26), and saturation time and power dependence analyses (27–29) to determine labile proton ratio and exchange rate (30–35). Notably, Dixon et al. proposed an omega plot approach (36). Sun et al. demonstrated a spillover-corrected omega plot analysis for quantifying diamagnetic CEST (DIACEST) systems (35). The omega plot was further extended with inverse CEST analysis (26) and multi-RF power-based ratiometric analysis (37–39) and also adapted for pulsed saturation as compared to the ideal case of continuous wave saturation (40). Nevertheless, in vivo omega plot is challenging due to multipool contributions (41,42).
Our study aimed to extend the omega plot and quantify the endogenous amide proton transfer (APT) MRI. Specifically, multipool Lorentzian fitting provides accurate CEST quantification, particularly at low irradiation powers (43–47). Recently, we demonstrated an Image Downsampling Expedited Adaptive Least-squares (IDEAL) algorithm, which improves the fitting robustness (47,48). Our current study chose a global ischemia rat model to test the in vivo qCEST analysis. We obtained densely sampled Z-spectra under multiple RF amplitudes and decoupled the multipool CEST effects, particularly the amide proton signal at 3.5 ppm, using the IDEAL algorithm. We then applied the omega plot and determined the labile amide proton concentration and exchange rate before and immediately after global ischemia.
Methods
Animal Stroke Model
The experiments were approved by the Institutional Animal Care and Use Committee. Adult male Wistar rats were anesthetized with 1.5–2.0% isoflurane/air mixture. A global ischemia model was induced by a lethal dose of potassium chloride (KCl) injection through the right femoral artery. MRI scans were performed on six animals (N=6) before and after global cerebral ischemia. Heart rate and blood oxygen content (SpO2) were monitored throughout the experiment. The body temperature was maintained within its physiological range with a circulating warm water jacket positioned around the torso.
MRI
All scans were performed on a 4.7 Tesla small-bore MRI scanner (Bruker Biospec, Erlangen, Germany) with a dual RF coil setup to achieve a homogeneous B1 field and sensitive detection. Multi-slice MRI (5 slices, slice thickness/gap=1.8/0.2 mm, field of view=20×20 mm2, image matrix=48×48) was acquired with echo planar imaging (EPI). Z-spectra were obtained from −6 to 6 ppm with intervals of 0.05 ppm and a continuous wave RF irradiation at power levels of 0.25, 0.35, 0.5, and 1 μT. We set the relaxation time to 2.5 s with the primary RF saturation duration and secondary RF saturation duration being 2.5 s and 0.5 s, respectively, and therefore an equivalent repetition time (TR) = 7.5 s, echo time (TE) = 24 ms, one average, and the scan time was 34 min per Z-spectrum (49). The water saturation shift referencing (WASSR) map was collected with an RF irradiation power level of 0.5 μT (TR/TS=1.5/0.5 s) for frequency offsets ranging between ±0.5 ppm with intervals of 0.05 ppm. Also, T1-weighted images were acquired using inversion recovery EPI, with seven inversion times ranging from 250 ms to 3,000 ms (TR/TE = 6.5 s/15 ms, 4 averages, scan time=3 min); T2-weighted spin echo images were obtained with two TE of 30 and 100 ms (TR = 3.25 s, 16 averages; scan time=2 min) (50).
Data Analysis
Data were analyzed in MATLAB (MathWorks, Natick, MA). The T1 map was obtained with the mono-exponential fitting of the signal as a function of the inversion time , where η is the inversion efficiency and TIi is the ith inversion time (51). T2 map was calculated as , where I(TE1,2) are T2-weighted signals obtained at two echo times (TE= 30 and 100 ms). A series of post-processing steps were performed on the Z-spectral images. Briefly, CEST images were coregistered using SPM12. B0 field inhomogeneity was corrected using the WASSR, and Z-spectral images were normalized by the signal without RF irradiation (I0) (52,53). The Z-spectra at each RF irradiation level was flipped as 1-I/I0 and fitted using the IDEAL fitting approach (47,48), which uses a globally averaged Z-spectrum for initial fitting. The initial fitting results are then used as initial values for subsequent fitting of substantially downsampled images. The resolution of downsampled images is increased iteratively and fitted with the results from the previous downsampled images as new initial values until the desired image resolution is reached. A seven-pool Lorentzian model including water (0 ppm), semisolid macromolecular MT (−2 ppm), amide (3.5 ppm), amine (2.75 ppm), guanidinium (2 ppm), and NOE effects (−1.6 ppm and −3.5 ppm) was applied (46,54–56). The Z-spectrum was described as a sum of multiple Lorentzian functions as
| [1] |
where ω is the frequency offset from the water resonance, Ai, ωi and σi are the amplitude, frequency offset, and linewidth of the CEST peak for the ith proton pool, respectively.
Because the CEST effect is susceptible to direct RF saturation (spillover) (35), the RF spillover effect was accounted for by calculating the inverse CEST difference (26) as,
| [2] |
where Zref is the reference signal. With a 90° excitation pulse, the RF spillover can be described by
| [3] |
where R1ρ is the longitudinal relaxation rate in the rotating frame (R1ρ = R1w · cos2θ + R2w · sin2θ), TR is the repetition time, Ts is the saturation times, R1w and R2w are the experimentally obtained longitudinal and transverse relaxation rates of bulk water, and θ = atan (ω1/Δω) with ω1 and Δω being the RF irradiation level and offset. Based on the modified omega plot analysis (57,58), the relationship between 1/CESTRind and can be described by linear regression as
| [4] |
Both the labile proton exchange rate (ksw) and ratio (fr) can be solved as
| [5.a] |
| [5.b] |
where C0 and C1 are the intercept and slope of the omega plot analysis, respectively, and the transverse relaxation rate of labile protons of amides (R2s) was set to 100 s−1 (59). Due to the strong correlation between T1 and water content (60,61), fr was corrected by normalizing the postmortem fr to the ratio of T1 between postmortem and live brain. The IDEAL approach was implemented for omega plot analysis, where parametric maps of ksw and fr were obtained by two-parameter fitting of the iteratively less downsampled spillover-corrected CEST images using Eq. [4]. Then the measured labile proton exchange rate (ksw) can be used to estimate the pH map by the formula previously derived by Zhou et al. (18):
| [6] |
The ksw and fr were measured from the parametric maps with a region of interest (ROI) over the brain tissue, excluding the ventricles. The statistical analysis was performed using a two-tailed Student’s t-test.
Results
Figure 1 shows Z-spectra averaged across all brain voxels of 6 rats before and after global ischemia at B1 levels of 0.25, 0.35, 0.5, and 1 μT. It has been shown that a moderate B1 level (i.e., ≤ 1 μT) maximizes the APT signal contrast between the ischemic and normal tissue (31). The APT effect at 3.5 ppm downfield from the water resonance (Fig. 1, dashed line) was observed at all B1 levels in the normal brains, which decreased following global ischemia. Also, the guanidinium CEST signal change can be observed after global ischemia, particularly at lower B1 levels (≤ 0.5 μT). The pH-dependency of amide and guanidinium CEST effects are opposite to each other, consistent with that of Jin et al. (62). Because guanidinium is closer to the bulk water resonance, it is more susceptible to B0 field inhomogeneity, particularly when a weak B1 field is used. Hence, our current work focused on quantifying the amide proton signal.
Figure 1.
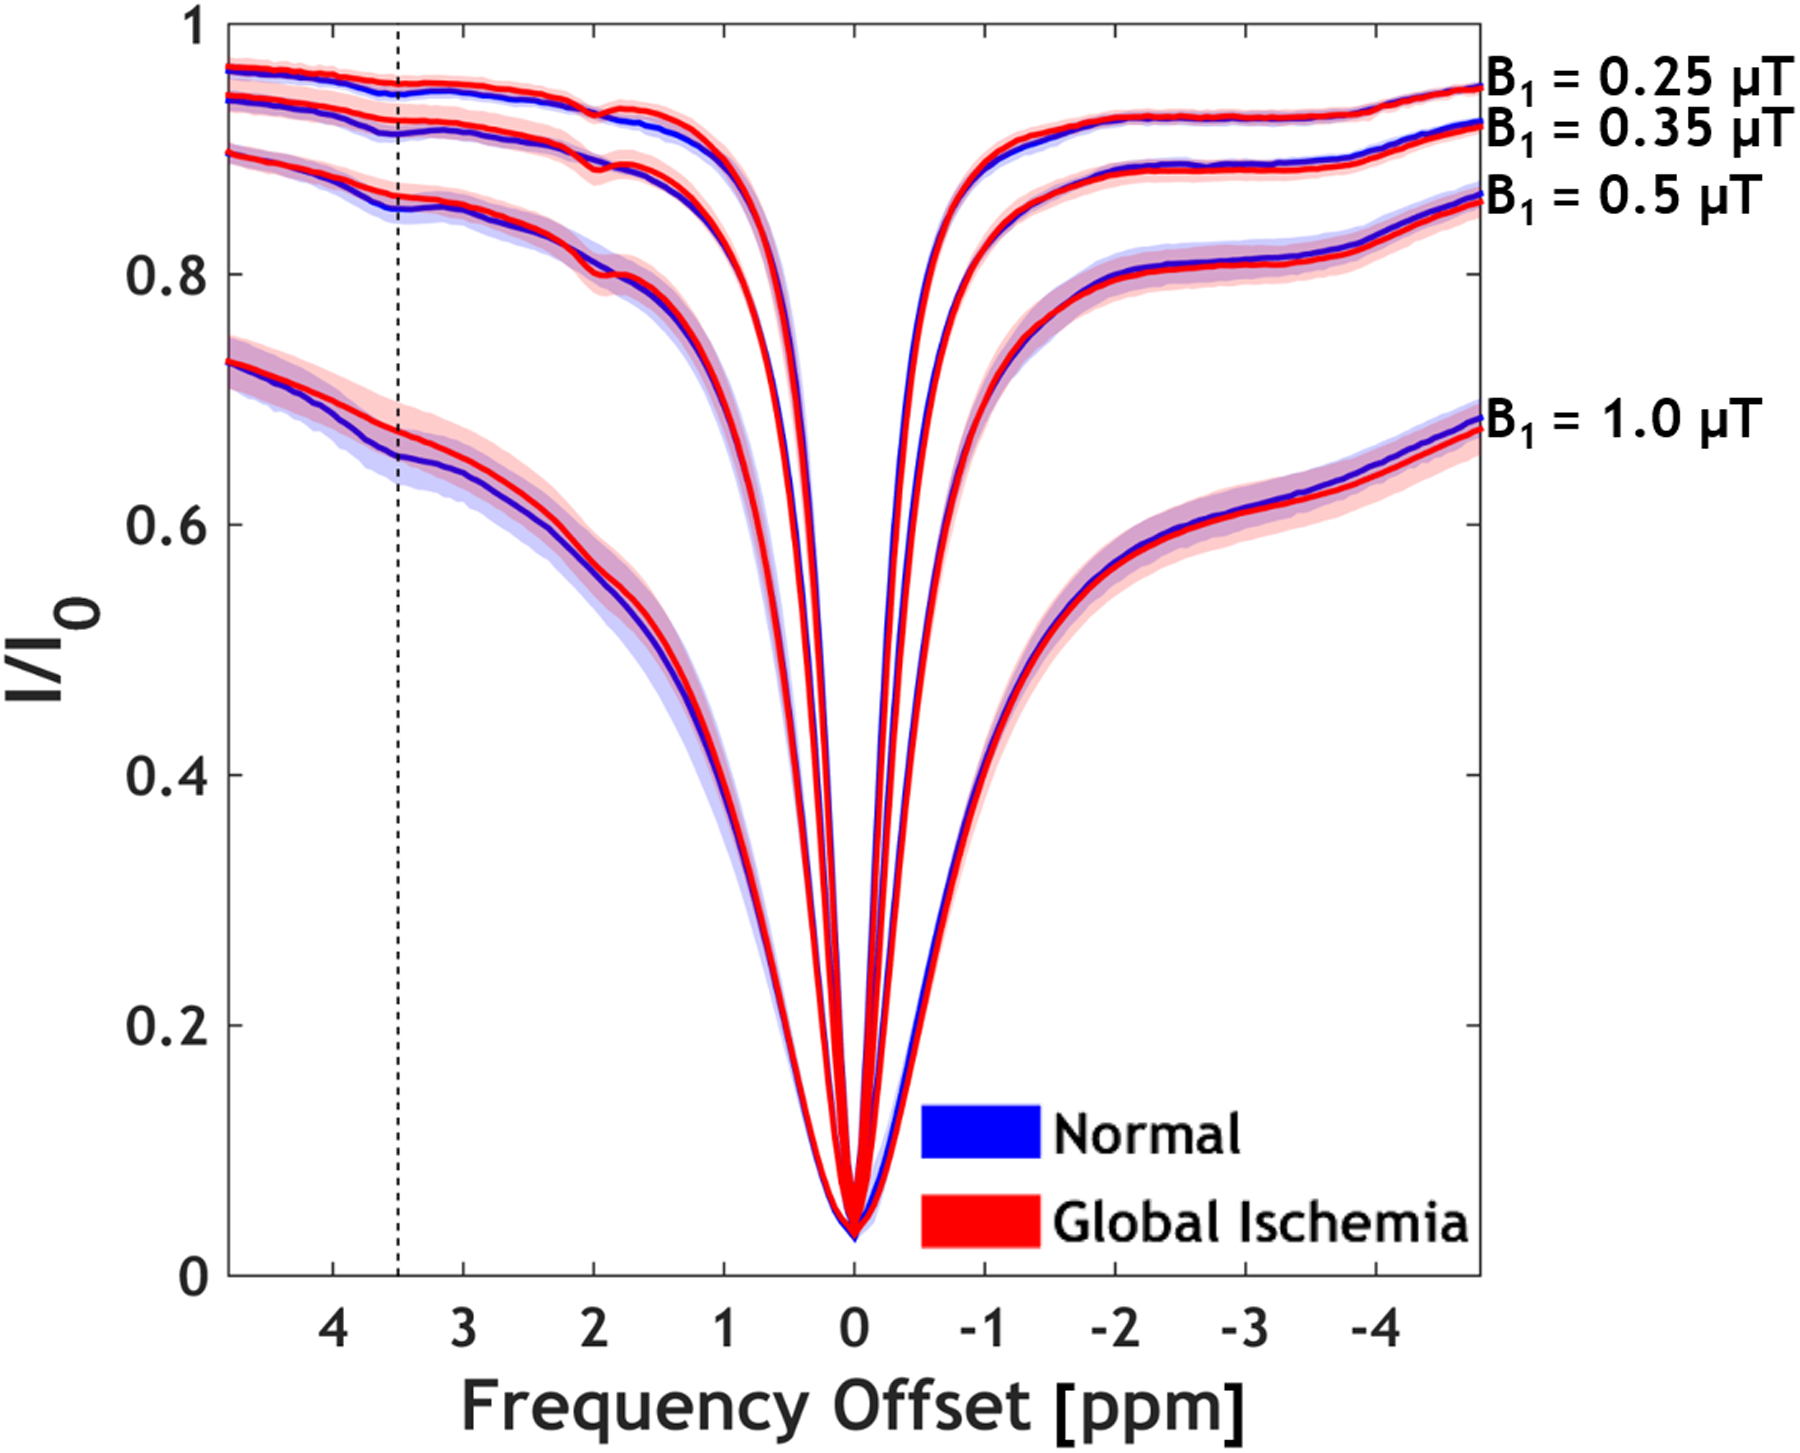
CEST Z-spectra averaged across all brain voxels before and after global ischemia. Mean with shaded standard deviation are shown (N = 6). Most notable are CEST effect changes at 3.5 ppm (APT) and 2 ppm (guanidinium) CEST effects.
Figure 2a shows the multipool Lorentzian fitting of the whole brain-averaged flipped Z-spectra (1-I/I0) at representative B1 levels of 0.25, 0.5, and 1.0 μT, respectively, from a representative rat before (blue) and after global ischemia (red). Figure 2b compares the residual Z-spectra, obtained by subtracting the fitted water and MT curve from the raw flipped Z-spectra, with the decoupled CEST effects of amide, amine, guanidinium, and NOE pools from the normal and ischemic brain. Multi-pool CEST effects were found at 3.5, 2.75, 2, −1.6, and −3.5 ppm of the water- and MT-subtracted Z-spectra. These fitting results of the globally averaged Z-spectra were subsequently used as inputs for the IDEAL fitting. The histograms of the fitted parameters for amide protons from a representative rat were shown in Figure S1.
Figure 2.
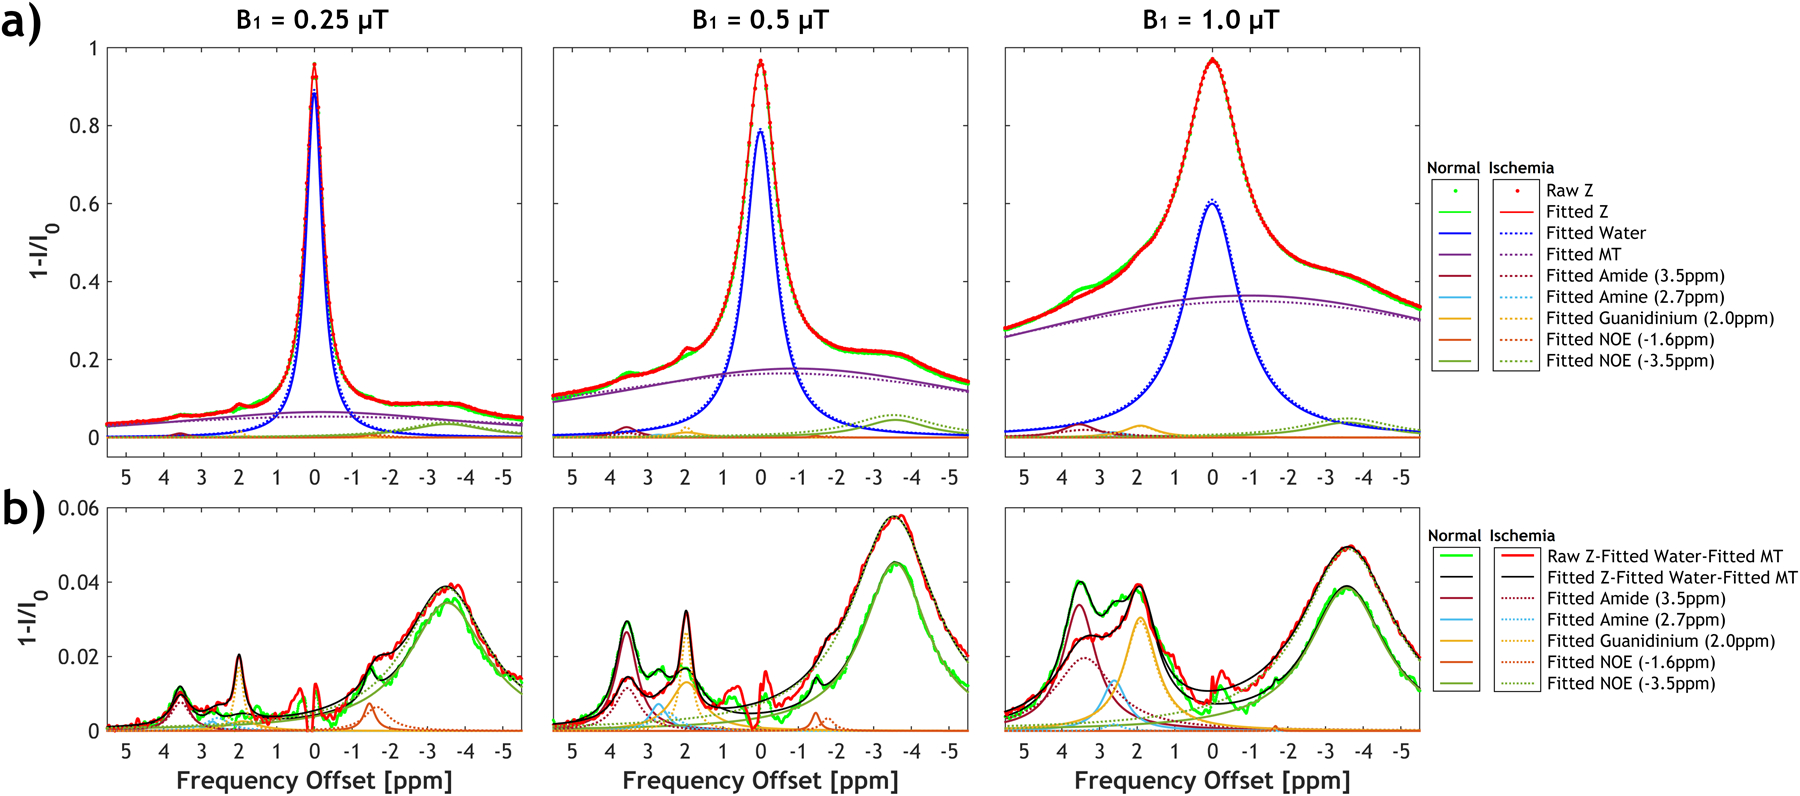
a) Multi-pool Lorentzian fitting of the whole brain-averaged Z-spectra at three representative B1 of 0.25, 0.5, and 1 μT before (solid lines) and after global ischemia (dotted lines). The saturation transfer effect from amide protons (3.5 ppm) can be decoupled from other pools, including amine (2.7 ppm), guanidinium (2.0 ppm), NOE (−1.6 ppm), NOE (−3.5 ppm), as well as direct water saturation and MT. b) The fitted water and MT effects were subtracted from the raw Z-spectra, which shows amide, amine, guanidinium, and NOE signals change between normal and ischemic tissues at different B1 levels.
Figure 3 shows the in vivo omega plots of the inverse of CESTRind vs. . The CESTRind effect was obtained from multipool Lorentzian fitting of the globally averaged Z-spectrum and corrected for RF spillover. The goodness of linear regression (R2) of omega plots was above 0.95 before and after global ischemia. Amide proton ksw and fr were determined from the omega plot (Eqs. 5a and 5b). Table 1 summarizes the T1, ksw, and fr of amide protons from 6 animals. In addition to significantly increased T1 (P=0.007), we found that the amide proton exchange rate calculated from the globally averaged Z-spectrum decreased substantially and significantly from 29.6 ± 5.6 to 12.1 ± 1.3 s−1 (P<0.001) following global ischemia. In comparison, the labile amide proton content did not show significant changes (0.241 ± 0.035% vs. 0.202 ± 0.034%, P=0.074).
Figure 3.
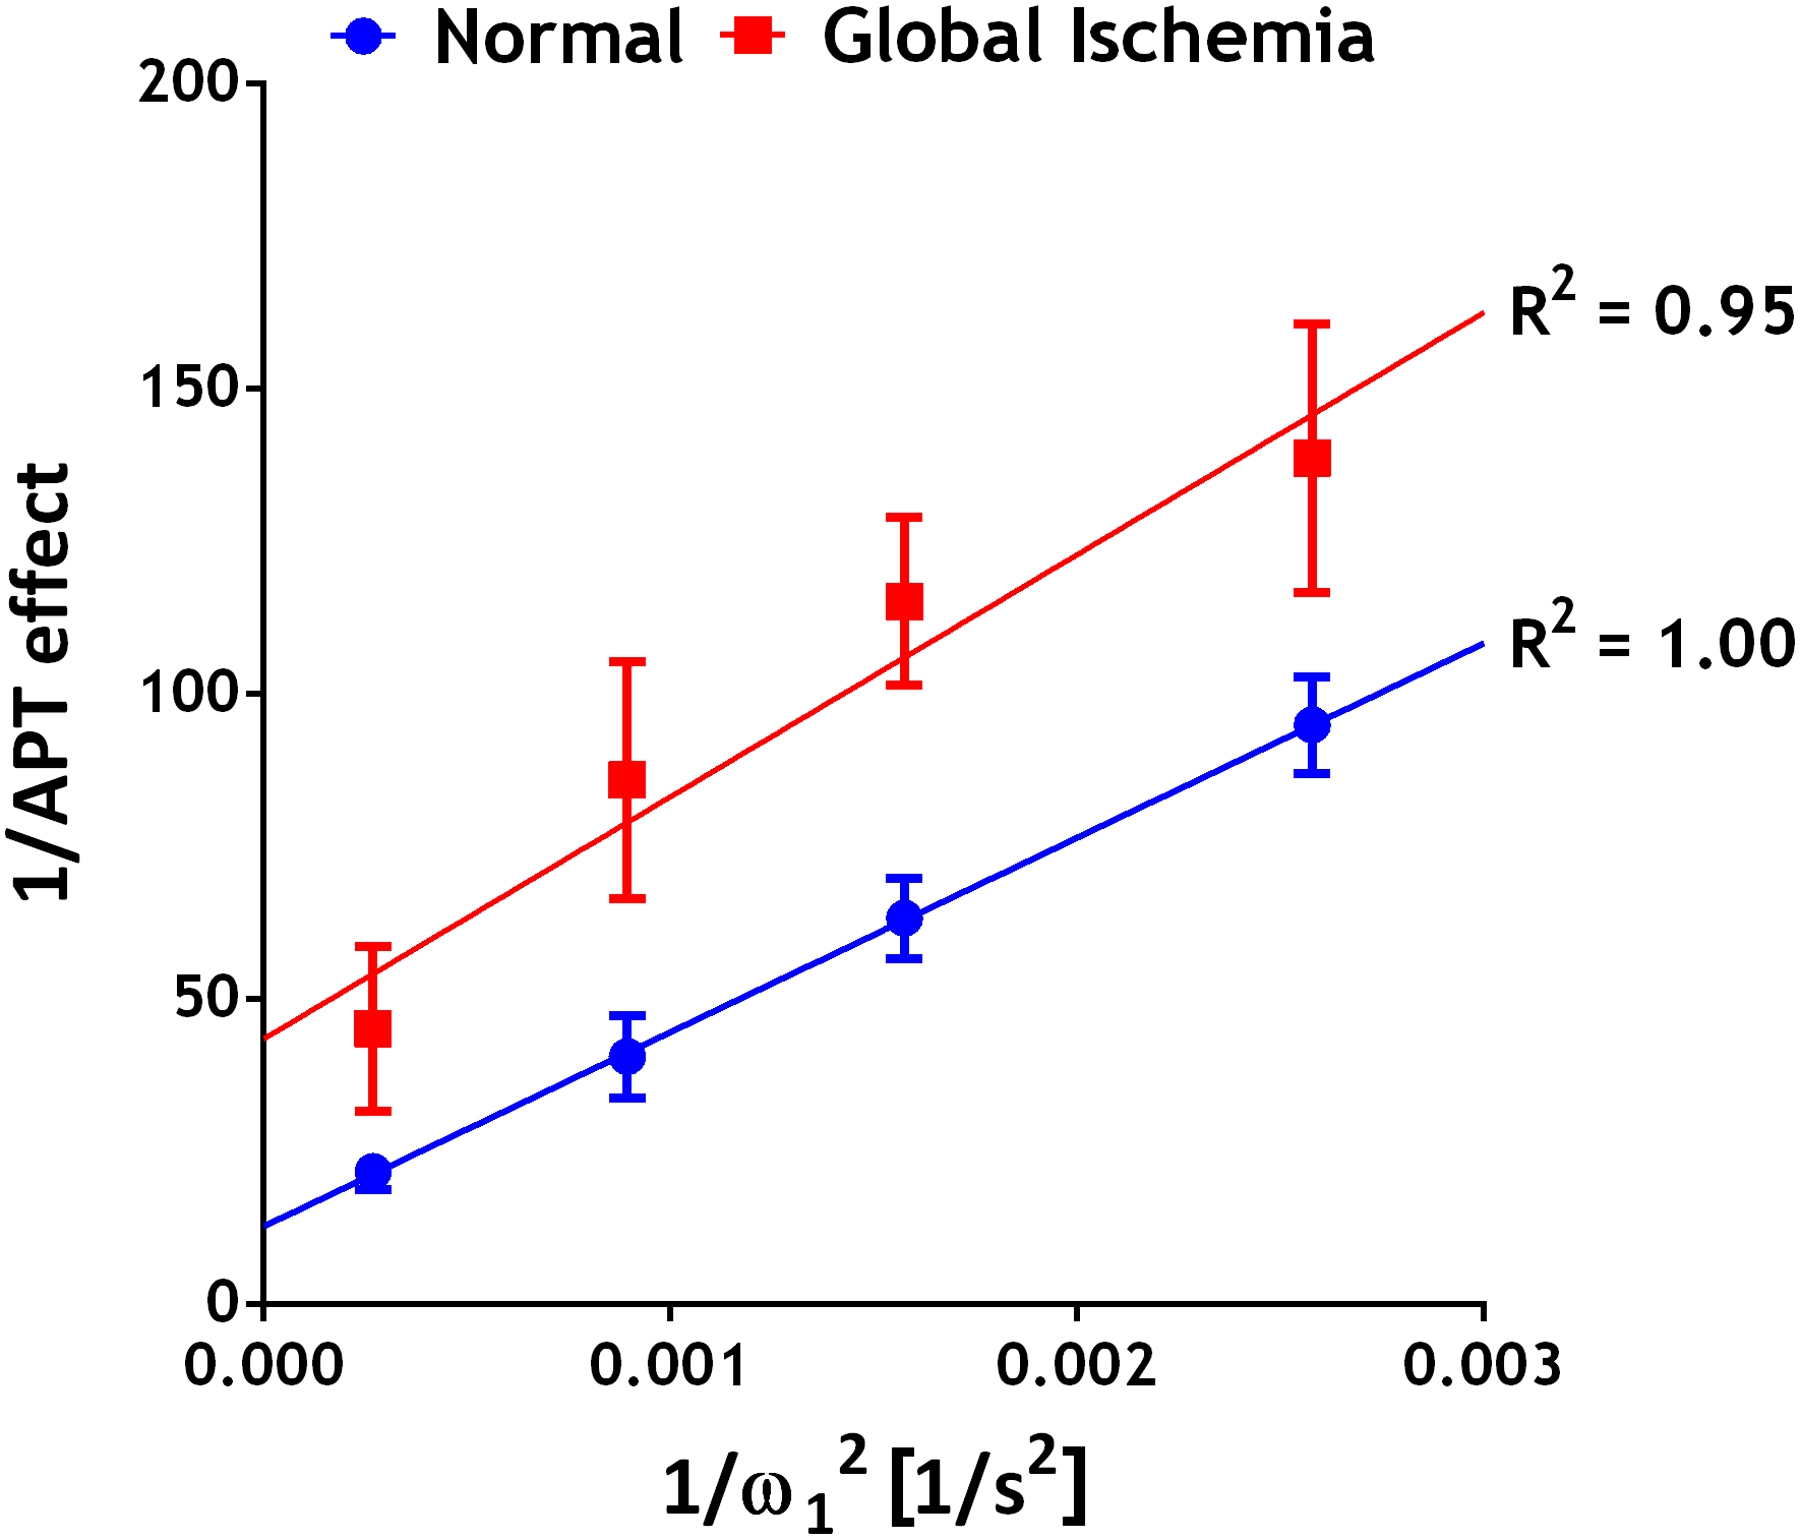
The omega plot analysis of 1/APT effect versus . The APT effect obtained from multipool Lorentzian fitting of the averaged Z-spectrum was corrected for RF spillover before omega plot analysis. Mean ± standard deviation from 6 animals before and after global ischemia was shown. The goodness of fit (R2) from the linear regression was above 95%.
Table 1.
Comparison of T1, the exchange rate (ksw), and the relative labile proton ratio (fr) of amide protons before and after global ischemia (N = 6). ksw and fr values reported were from both omega plot on APT decoupled from globally averaged Z-spectrum and from IDEAL-based omega plot analysis on APT maps fitted using the IDEAL approach. Given a strong correlation between T1 and water content, the contribution of change in water proton towards fr has been normalized by T1. Mean ± standard deviation values were shown. Student’s t-tests were performed between live and postmortem conditions in the same brains with p values <0.05 denotes a statistically significant difference.
| Live | Postmortem | P-value | ||||
|---|---|---|---|---|---|---|
| T1 [s] | 1.56 ± 0.012 | 1.65 ± 0.058 | 0.007 | |||
| Globally averaged APT | IDEAL fitted APT | Globally averaged APT | IDEAL fitted APT | Globally averaged APT | IDEAL fitted APT | |
| ksw [s−1] | 29.6 ± 5.6 | 29.9 ± 14.2 | 12.1 ± 1.3 | 11.2 ± 1.3 | <0.001 | 0.009 |
| fr × 10−3 | 2.42 ± 0.35 | 2.50 ± 0.30 | 2.02 ± 0.34 | 1.90 ± 0.40 | 0.074 | 0.034 |
Figure 4 shows representative maps of the T1, amide proton concentration, exchange rate, goodness of fit (R2) of the omega plot, and pH before (Figs. 4a) and after global ischemia (Figs. 4b). The effect of global ischemia on ksw but not fr can also be observed in Figure 4. Similar to the findings from the omega plot on APT decoupled from globally averaged Z-spectrum (Table 1), parametric fitting maps showed ksw reduced from 29.9 ± 14.2 to 11.2 ± 1.3 s−1 (P=0.009) (Table 1) after global ischemia with a marginal yet significant change in the labile proton concentration (0.25 ± 0.03 vs. 0.19 ± 0.04 %, P=0.034) (Table 1). The averaged R2 values from the goodness of fit maps were 0.89 ± 0.11 and 0.85 ± 0.15 for before and after global ischemia, respectively.
Figure 4.
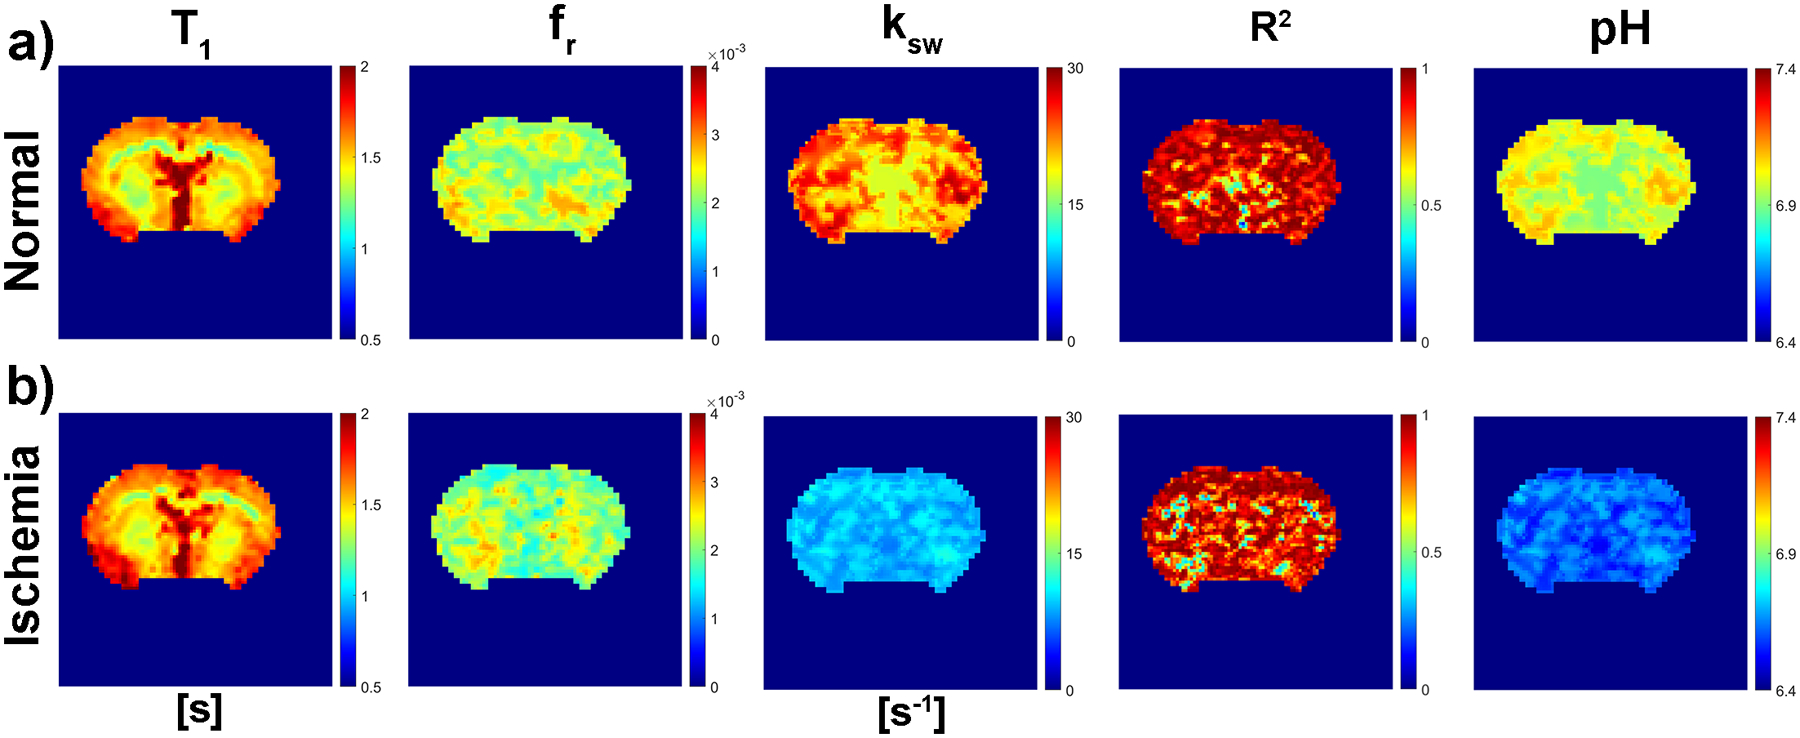
Representative maps of the T1, relative labile proton ratio (fr) of amide protons, exchange rate (ksw) of amide protons, corresponding goodness of fit (R2) of the omega plot analysis, and pH before (Figs. 4a) and after global ischemia (Figs. 4b).
Discussion
Our study combined the omega plot analysis with multipool Lorentzian decoupling and IDEAL fitting algorithms, and solved the brain amide proton concentration and exchange rate following global ischemia. Our results concluded that reduced amide exchange rate, not its concentration, is the dominating factor in APT contrast for ischemia, confirming its pH sensitivity.
The amide proton exchange rates determined from the globally averaged data in our study, which are 29.6 ± 5.6 s−1 and 12.1 ± 1.3 s−1 before and after global ischemia, respectively, are in excellent agreement with those reported by Zhou et al. (28.6 ± 7.4 s−1 and 10.1 ± 2.65 s−1, respectively) (18). It is helpful to point out that Zhou et al. (18) used water exchange spectroscopy while our study used a modified in vivo omega plot analysis. Moreover, they observed no change in amide signal intensity from the exchange spectra in the first 2 hours postmortem. Our study found a negligible/marginal effect of ischemia on amide proton concentration during the initial hours after ischemia. Our study determined an amide concentration of 122 mM, which is in reasonable agreement with 100 ± 8 mM, derived from a dual 2-pool model (31). Although both derived concentrations were higher than that reported by Zhou et al. (i.e., 71.9 mM), this is likely because the original work of Zhou et al. used a pulse-APT MRI scheme (18), which slightly underestimates the APT effect than that of using CW-APT MRI (63,64). Altogether, these multi-site studies have been reasonably consistent results. The global ischemia is a relatively straightforward model, shedding light on the origin of in vivo CEST MRI. The qCEST framework can be further applied to characterize the contrast mechanism in disorders like tumors, which may have significant changes in pH and amide proton concentration.
We maintained animals on a heating pad, and the rectal temperature was monitored and recorded throughout the imaging session. Nevertheless, there might be a gradual brain temperature drop following global ischemia, which could cause a non-uniform T1 change (65). However, we did not perform serial T1 mapping after global ischemia, which might help characterize the extent. It will be helpful to apply the modified omega plot to analyze focal ischemia animal models, in which the tissue temperature variation shall be smaller than global ischemia. It’s worth discussing the effect of the temperature drop after global ischemia on chemical exchange rate. The temperature records showed no more than 3°C dropped following global ischemia under the pad heating condition. It has been reported that a temperature change range of 1–3 °C would not significantly alter the exchange rate compared with the effect of pH, indicating the change of the chemical exchange rate after ischemia is dominated by pH(18). In the brains before global ischemia, a relatively uniform amide proton concentration is found, consistent with our prior study (48). Previously, we found that the T1-normalized CEST effects (6) for the intact brain white matter and grey matter are about equal for APT while significantly different in MT contrast asymmetry and NOE effects (48). Indeed, this magnitude difference between NOE and MTC asymmetry is not pH-specific. Importantly, because the intact white matter and gray matter have little pH difference (within 0.05), the amide proton exchange rate and hence, the labile amide concentration shall be reasonably uniform across the brain (66).
Our study used relatively weak saturation powers for APT MRI of ischemia (0.25 −1 μT), which is desired for fitting multipool CEST effects for subsequent omega plot (21). The four saturation powers were selected so that the corresponding values are reasonably evenly spaced on the omega plot to achieve a robust linear regression. It’s worth mentioning that a systemic B1 calibration was performed to correct systematic B1 error at different power levels in omega plot analysis. Because of the relative size between the rodent brain and RF volume transmit coil, the B1 inhomogeneity is within 5% (67)and hence no pixel wise correction was performed because relatively uniform B1. The good linear relationship from the in vivo omega plot supports adequate B1 homogeneity. In addition to the APT effect, we were able to resolve amine (2.7 ppm) and guanidinium (2.0 ppm) effects (4,22). However, the intermediate to fast exchange rate of amine and guanidinium protons may limit the applicability of the omega plot to quantify them at 4.7 Tesla. Also, the typical range of RF saturation powers optimized for APT MRI may not capture intermediate and fast exchanging protons. On the other hand, the CEST effects overlap significantly when B1 is over 1 μT, making decoupling more difficult. qCEST MRI at the high field may provide improved spectral resolution to fully characterize multipool CEST MRI effects. Finally, we need to point out that the robustness of omega plot analysis relies on the multipool Lorentzian decoupling of the exchanging protons and, therefore, the signal-to-noise ratio (SNR). Thus, the decreased APT effect after global ischemia makes the fitting more susceptible to physiological and thermal noises than normal conditions. Not surprisingly, the goodness of fit (R2) from the omega plot after global ischemia is slightly less than that before ischemia (95% vs. 100%). This fitting uncertainty is likely due to the multipool fitting error propagation. Nevertheless, numerical fitting under the condition of high SNR (e.g., global fitting) provides a more robust quantification of the in vivo APT MRI.
Conclusion
Our study documented the decreased exchange rate but not proton concentration of amide protons after cerebral ischemia. The significant change in amide exchange rate indicates the APT contrast is dominated by pH change during ischemia, suitable for mapping tissue acidosis.
Supplementary Material
Acknowledgments:
This study was supported by grants from the National Institutes of Health R01NS083654 and R21NS085574 (to Sun), K25HL148837 (to Zhou).
References
- 1.Ward KM, Aletras AH, Balaban RS. A new class of contrast agents for MRI based on proton chemical exchange dependent saturation transfer (CEST). Journal of magnetic resonance 2000;143(1):79–87. [DOI] [PubMed] [Google Scholar]
- 2.Ji Y, Zhou IY, Qiu B, Sun PZ. Progress toward quantitative in vivo chemical exchange saturation transfer (CEST) MRI. Israel Journal of Chemistry 2017;57(9):809–824. [Google Scholar]
- 3.Sun PZ, Zhou J, Sun W, Huang J, van Zijl PC. Detection of the ischemic penumbra using pH-weighted MRI. Journal of cerebral blood flow and metabolism: official journal of the International Society of Cerebral Blood Flow and Metabolism 2007;27(6):1129–1136. [DOI] [PubMed] [Google Scholar]
- 4.Sun PZ, Cheung JS, Wang E, Lo EH. Association between pH-weighted endogenous amide proton chemical exchange saturation transfer MRI and tissue lactic acidosis during acute ischemic stroke. Journal of cerebral blood flow and metabolism: official journal of the International Society of Cerebral Blood Flow and Metabolism 2011;31(8):1743–1750. [DOI] [PMC free article] [PubMed] [Google Scholar]
- 5.Tietze A, Blicher J, Mikkelsen IK, Ostergaard L, Strother MK, Smith SA, Donahue MJ. Assessment of ischemic penumbra in patients with hyperacute stroke using amide proton transfer (APT) chemical exchange saturation transfer (CEST) MRI. NMR in biomedicine 2014;27(2):163–174. [DOI] [PMC free article] [PubMed] [Google Scholar]
- 6.Zaiss M, Xu J, Goerke S, Khan IS, Singer RJ, Gore JC, Gochberg DF, Bachert P. Inverse Z-spectrum analysis for spillover-, MT-, and T1 -corrected steady-state pulsed CEST-MRI--application to pH-weighted MRI of acute stroke. NMR in biomedicine 2014;27(3):240–252. [DOI] [PMC free article] [PubMed] [Google Scholar]
- 7.Xu J, Zaiss M, Zu Z, Li H, Xie J, Gochberg DF, Bachert P, Gore JC. On the origins of chemical exchange saturation transfer (CEST) contrast in tumors at 9.4 T. NMR in biomedicine 2014;27(4):406–416. [DOI] [PMC free article] [PubMed] [Google Scholar]
- 8.Desmond KL, Moosvi F, Stanisz GJ. Mapping of amide, amine, and aliphatic peaks in the CEST spectra of murine xenografts at 7 T. Magn Reson Med 2014;71(5):1841–1853. [DOI] [PubMed] [Google Scholar]
- 9.Chen LQ, Howison CM, Jeffery JJ, Robey IF, Kuo PH, Pagel MD. Evaluations of extracellular pH within in vivo tumors using acidoCEST MRI. Magn Reson Med 2014;72(5):1408–1417. [DOI] [PMC free article] [PubMed] [Google Scholar]
- 10.Sagiyama K, Mashimo T, Togao O, Vemireddy V, Hatanpaa KJ, Maher EA, Mickey BE, Pan E, Sherry AD, Bachoo RM, Takahashi M. In vivo chemical exchange saturation transfer imaging allows early detection of a therapeutic response in glioblastoma. Proc Natl Acad Sci U S A 2014;111(12):4542–4547. [DOI] [PMC free article] [PubMed] [Google Scholar]
- 11.Haris M, Singh A, Mohammed I, Ittyerah R, Nath K, Nanga RPR, Debrosse C, Kogan F, Cai K, Poptani H, Reddy D, Hariharan H, Reddy R. In vivo Magnetic Resonance Imaging of Tumor Protease Activity. Sci Rep 2014;4:6081. [DOI] [PMC free article] [PubMed] [Google Scholar]
- 12.Davis KA, Nanga RP, Das S, Chen SH, Hadar PN, Pollard JR, Lucas TH, Shinohara RT, Litt B, Hariharan H, Elliott MA, Detre JA, Reddy R. Glutamate imaging (GluCEST) lateralizes epileptic foci in nonlesional temporal lobe epilepsy. Science translational medicine 2015;7(309):309ra161. [DOI] [PMC free article] [PubMed] [Google Scholar]
- 13.Dula AN, Asche EM, Landman BA, Welch EB, Pawate S, Sriram S, Gore JC, Smith SA. Development of chemical exchange saturation transfer at 7T. Magn Reson Med 2012;66(3):831–838. [DOI] [PMC free article] [PubMed] [Google Scholar]
- 14.Dula AN, Pawate S, Dethrage LM, Conrad BN, Dewey BE, Barry RL, Smith SA. Chemical exchange saturation transfer of the cervical spinal cord at 7 T. NMR in biomedicine 2016;29(9):1249–1257. [DOI] [PMC free article] [PubMed] [Google Scholar]
- 15.Wada T, Togao O, Tokunaga C, Funatsu R, Yamashita Y, Kobayashi K, Nakamura Y, Honda H. Glycosaminoglycan chemical exchange saturation transfer in human lumbar intervertebral discs: Effect of saturation pulse and relationship with low back pain. J Magn Reson Imaging 2017;45(3):863–871. [DOI] [PubMed] [Google Scholar]
- 16.DeBrosse C, Nanga RPR, Wilson N, D’Aquilla K, Elliott M, Hariharan H, Yan F, Wade K, Nguyen S, Worsley D, Parris-Skeete C, McCormick E, Xiao R, Cunningham ZZ, Fishbein L, Nathanson KL, Lynch DR, Stallings VA, Yudkoff M, Falk MJ, Reddy R, McCormack SE. Muscle oxidative phosphorylation quantitation using creatine chemical exchange saturation transfer (CrCEST) MRI in mitochondrial disorders. JCI Insight 2016;1(18):e88207. [DOI] [PMC free article] [PubMed] [Google Scholar]
- 17.Kogan F, Haris M, Debrosse C, Singh A, Nanga RP, Cai K, Hariharan H, Reddy R. In vivo chemical exchange saturation transfer imaging of creatine (CrCEST) in skeletal muscle at 3T. J Magn Reson Imaging 2014;40(3):596–602. [DOI] [PMC free article] [PubMed] [Google Scholar]
- 18.Zhou J, Payen JF, Wilson DA, Traystman RJ, van Zijl PC. Using the amide proton signals of intracellular proteins and peptides to detect pH effects in MRI. Nature medicine 2003;9(8):1085–1090. [DOI] [PubMed] [Google Scholar]
- 19.Hua J, Jones CK, Blakeley J, Smith SA, van Zijl PC, Zhou J. Quantitative description of the asymmetry in magnetization transfer effects around the water resonance in the human brain. Magn Reson Med 2007;58(4):786–793. [DOI] [PMC free article] [PubMed] [Google Scholar]
- 20.van Zijl PCM, Yadav NN. Chemical exchange saturation transfer (CEST): What is in a name and what isn’t? Magn Reson Med 2011;65(4):927–948. [DOI] [PMC free article] [PubMed] [Google Scholar]
- 21.Jin T, Wang P, Zong X, Kim SG. MR imaging of the amide-proton transfer effect and the pH-insensitive nuclear overhauser effect at 9.4 T. Magn Reson Med 2013;69(3):760–770. [DOI] [PMC free article] [PubMed] [Google Scholar]
- 22.Sun PZ, Sorensen AG. Imaging pH using the chemical exchange saturation transfer (CEST) MRI: correction of concomitant RF irradiation effects to quantify CEST MRI for chemical exchange rate and pH. Magn Reson Med 2008;60(2):390–397. [DOI] [PubMed] [Google Scholar]
- 23.Woessner DE, Zhang S, Merritt ME, Sherry AD. Numerical solution of the Bloch equations provides insights into the optimum design of PARACEST agents for MRI. Magn Reson Med 2005;53(4):790–799. [DOI] [PubMed] [Google Scholar]
- 24.Jin T, Autio J, Obata T, Kim S-G. Spin-locking versus chemical exchange saturation transfer MRI for investigating chemical exchange process between water and labile metabolite protons. Magn Reson Med 2011;65(5):1448–1460. [DOI] [PMC free article] [PubMed] [Google Scholar]
- 25.Jin T, Kim SG. Advantages of chemical exchange-sensitive spin-lock (CESL) over chemical exchange saturation transfer (CEST) for hydroxyl- and amine-water proton exchange studies. NMR in biomedicine 2014;27(11):1313–1324. [DOI] [PMC free article] [PubMed] [Google Scholar]
- 26.Wu R, Xiao G, Zhou IY, Ran C, Sun PZ. Quantitative chemical exchange saturation transfer (qCEST) MRI - omega plot analysis of RF-spillover-corrected inverse CEST ratio asymmetry for simultaneous determination of labile proton ratio and exchange rate. NMR in biomedicine 2015;28(3):376–383. [DOI] [PMC free article] [PubMed] [Google Scholar]
- 27.McMahon MT, Gilad AA, Zhou J, Sun PZ, Bulte JW, van Zijl PC. Quantifying exchange rates in chemical exchange saturation transfer agents using the saturation time and saturation power dependencies of the magnetization transfer effect on the magnetic resonance imaging signal (QUEST and QUESP): Ph calibration for poly-L-lysine and a starburst dendrimer. Magn Reson Med 2006;55(4):836–847. [DOI] [PMC free article] [PubMed] [Google Scholar]
- 28.Randtke EA, Chen LQ, Corrales LR, Pagel MD. The Hanes-Woolf linear QUESP method improves the measurements of fast chemical exchange rates with CEST MRI. Magn Reson Med 2014;71(4):1603–1612. [DOI] [PMC free article] [PubMed] [Google Scholar]
- 29.Sun PZ. Simultaneous determination of labile proton concentration and exchange rate utilizing optimal RF power: Radio frequency power (RFP) dependence of chemical exchange saturation transfer (CEST) MRI. Journal of magnetic resonance 2010;202(2):155–161. [DOI] [PMC free article] [PubMed] [Google Scholar]
- 30.Sun PZ, van Zijl PCM, Zhou J. Optimization of the irradiation power in chemical exchange dependent saturation transfer experiments. Journal of magnetic resonance 2005;175(2):193–200. [DOI] [PubMed] [Google Scholar]
- 31.Sun PZ, Zhou J, Huang J, van Zijl P. Simplified quantitative description of amide proton transfer (APT) imaging during acute ischemia. Magn Reson Med 2007;57(2):405–410. [DOI] [PubMed] [Google Scholar]
- 32.Li AX, Hudson RH, Barrett JW, Jones CK, Pasternak SH, Bartha R. Four-pool modeling of proton exchange processes in biological systems in the presence of MRI-paramagnetic chemical exchange saturation transfer (PARACEST) agents. Magn Reson Med 2008;60(5):1197–1206. [DOI] [PubMed] [Google Scholar]
- 33.Murase K, Tanki N. Numerical solutions to the time-dependent Bloch equations revisited. Magn Reson Imaging 2011;29(1):126–131. [DOI] [PubMed] [Google Scholar]
- 34.Sun PZ. Simplified quantification of labile proton concentration-weighted chemical exchange rate (kws) with RF saturation time dependent ratiometric analysis (QUESTRA): Normalization of relaxation and RF irradiation spillover effects for improved quantitative chemical exchange saturation transfer (CEST) MRI. Magnetic Resonance in Medicine 2012;67(4):936–942. [DOI] [PMC free article] [PubMed] [Google Scholar]
- 35.Sun PZ, Wang Y, Dai Z, Xiao G, Wu R. Quantitative chemical exchange saturation transfer (qCEST) MRI--RF spillover effect-corrected omega plot for simultaneous determination of labile proton fraction ratio and exchange rate. Contrast media & molecular imaging 2014;9(4):268–275. [DOI] [PMC free article] [PubMed] [Google Scholar]
- 36.Dixon TW, Ren J, Lubag A,JM, Ratnakar J, Vinogradov E, Hancu I, Lenkinski R,E, Sherry AD. A concentration-independent method to measure exchange rates in PARACEST agents. Magn Reson Med 2010;63(3):625–632. [DOI] [PMC free article] [PubMed] [Google Scholar]
- 37.Wu Y, Zhou IY, Igarashi T, Longo DL, Aime S, Sun PZ. A generalized ratiometric chemical exchange saturation transfer (CEST) MRI approach for mapping renal pH using iopamidol. Magn Reson Med 2018;79(3):1553–1558. [DOI] [PMC free article] [PubMed] [Google Scholar]
- 38.Wu R, Longo DL, Aime S, Sun PZ. Quantitative description of radiofrequency (RF) power-based ratiometric chemical exchange saturation transfer (CEST) pH imaging. NMR in biomedicine 2015;28(5):555–565. [DOI] [PMC free article] [PubMed] [Google Scholar]
- 39.Arena F, Irrera P, Consolino L, Colombo Serra S, Zaiss M, Longo DL. Flip-angle based ratiometric approach for pulsed CEST-MRI pH imaging. Journal of magnetic resonance 2018;287:1–9. [DOI] [PubMed] [Google Scholar]
- 40.Meissner JE, Goerke S, Rerich E, Klika KD, Radbruch A, Ladd ME, Bachert P, Zaiss M. Quantitative pulsed CEST-MRI using Omega-plots. NMR in biomedicine 2015;28(10):1196–1208. [DOI] [PubMed] [Google Scholar]
- 41.Jokivarsi KT, Grohn HI, Grohn OH, Kauppinen RA. Proton transfer ratio, lactate, and intracellular pH in acute cerebral ischemia. Magn Reson Med 2007;57(4):647–653. [DOI] [PubMed] [Google Scholar]
- 42.Sun PZ, Wang E, Cheung JS. Imaging acute ischemic tissue acidosis with pH-sensitive endogenous amide proton transfer (APT) MRI--correction of tissue relaxation and concomitant RF irradiation effects toward mapping quantitative cerebral tissue pH. NeuroImage 2012;60(1):1–6. [DOI] [PMC free article] [PubMed] [Google Scholar]
- 43.Zaiss M, Schmitt B, Bachert P. Quantitative separation of CEST effect from magnetization transfer and spillover effects by Lorentzian-line-fit analysis of z-spectra. Journal of magnetic resonance 2011;211(2):149–155. [DOI] [PubMed] [Google Scholar]
- 44.Jones CK, Huang A, Xu J, Edden RA, Schar M, Hua J, Oskolkov N, Zaca D, Zhou J, McMahon MT, Pillai JJ, van Zijl PC. Nuclear Overhauser enhancement (NOE) imaging in the human brain at 7T. NeuroImage 2013;77:114–124. [DOI] [PMC free article] [PubMed] [Google Scholar]
- 45.Desmond KL, Moosvi F, Stanisz GJ. Mapping of amide, amine, and aliphatic peaks in the CEST spectra of murine xenografts at 7 T. Magn Reson Med 2014;71(5):1841–1853. [DOI] [PubMed] [Google Scholar]
- 46.Zaiss M, Windschuh J, Paech D, Meissner JE, Burth S, Schmitt B, Kickingereder P, Wiestler B, Wick W, Bendszus M, Schlemmer HP, Ladd ME, Bachert P, Radbruch A. Relaxation-compensated CEST-MRI of the human brain at 7T: Unbiased insight into NOE and amide signal changes in human glioblastoma. NeuroImage 2015;112:180–188. [DOI] [PubMed] [Google Scholar]
- 47.Zhou IY, Wang E, Cheung JS, Zhang X, Fulci G, Sun PZ. Quantitative chemical exchange saturation transfer (CEST) MRI of glioma using Image Downsampling Expedited Adaptive Least-squares (IDEAL) fitting. Sci Rep 2017;7(1):84. [DOI] [PMC free article] [PubMed] [Google Scholar]
- 48.Zhou IY, Lu D, Ji Y, Wu L, Wang E, Cheung JS, Zhang XA, Sun PZ. Determination of multipool contributions to endogenous amide proton transfer effects in global ischemia with high spectral resolution in vivo chemical exchange saturation transfer MRI. Magn Reson Med 2019;81(1):645–652. [DOI] [PMC free article] [PubMed] [Google Scholar]
- 49.Sun PZ, Cheung JS, Wang E, Benner T, Sorensen AG. Fast multi-slice pH-weighted chemical exchange saturation transfer (CEST) MRI with unevenly segmented RF irradiation. Magn Reson Med 2011;65(2):588–594. [DOI] [PMC free article] [PubMed] [Google Scholar]
- 50.Cheung JS, Wang E, Zhang X, Mandeville E, Lo EH, Sorensen AG, Sun PZ. Fast radio-frequency enforced steady state (FRESS) spin echo MRI for quantitative T2 mapping: minimizing the apparent repetition time (TR) dependence for fast T2 measurement. NMR in biomedicine 2012;25(2):189–194. [DOI] [PMC free article] [PubMed] [Google Scholar]
- 51.Ji Y, Lu D, Jiang Y, Wang X, Meng Y, Sun PZ. Development of fast multi-slice apparent T1 mapping for improved arterial spin labeling MRI measurement of cerebral blood flow. Magn Reson Med 2021;85(3):1571–1580. [DOI] [PMC free article] [PubMed] [Google Scholar]
- 52.Stancanello J, Terreno E, Castelli DD, Cabella C, Uggeri F, Aime S. Development and validation of a smoothing-splines-based correction method for improving the analysis of CEST-MR images. Contrast media & molecular imaging 2008;3(4):136–149. [DOI] [PubMed] [Google Scholar]
- 53.Kim M, Gillen J, Landman BA, Zhou J, van Zijl PC. Water saturation shift referencing (WASSR) for chemical exchange saturation transfer (CEST) experiments. Magn Reson Med 2009;61(6):1441–1450. [DOI] [PMC free article] [PubMed] [Google Scholar]
- 54.Cai K, Singh A, Poptani H, Li W, Yang S, Lu Y, Hariharan H, Zhou XJ, Reddy R. CEST signal at 2ppm (CEST@2ppm) from Z-spectral fitting correlates with creatine distribution in brain tumor. NMR in biomedicine 2015;28(1):1–8. [DOI] [PMC free article] [PubMed] [Google Scholar]
- 55.Zhang XY, Wang F, Afzal A, Xu J, Gore JC, Gochberg DF, Zu Z. A new NOE-mediated MT signal at around −1.6ppm for detecting ischemic stroke in rat brain. Magn Reson Imaging 2016;34(8):1100–1106. [DOI] [PMC free article] [PubMed] [Google Scholar]
- 56.Zhang XY, Wang F, Jin T, Xu J, Xie J, Gochberg DF, Gore JC, Zu Z. MR imaging of a novel NOE-mediated magnetization transfer with water in rat brain at 9.4 T. Magn Reson Med 2017;78(2):588–597. [DOI] [PMC free article] [PubMed] [Google Scholar]
- 57.Sun PZ, Lu J, Wu Y, Xiao G, Wu R. Evaluation of the dependence of CEST-EPI measurement on repetition time, RF irradiation duty cycle and imaging flip angle for enhanced pH sensitivity. Phys Med Biol 2013;58:N229–N240. [DOI] [PMC free article] [PubMed] [Google Scholar]
- 58.Zaiss M, Bachert P. Exchange-dependent relaxation in the rotating frame for slow and intermediate exchange – modeling off-resonant spin-lock and chemical exchange saturation transfer. NMR in biomedicine 2013;26(5):507–518. [DOI] [PubMed] [Google Scholar]
- 59.Khlebnikov V, van der Kemp WJM, Hoogduin H, Klomp DWJ, Prompers JJ. Analysis of chemical exchange saturation transfer contributions from brain metabolites to the Z-spectra at various field strengths and pH. Sci Rep 2019;9(1):1089. [DOI] [PMC free article] [PubMed] [Google Scholar]
- 60.Saryan LA, Hollis DP, Economou JS, Eggleston JC. Nuclear magnetic resonance studies of cancer. IV. Correlation of water content with tissue relaxation times. J Natl Cancer Inst 1974;52(2):599–602. [DOI] [PubMed] [Google Scholar]
- 61.Venkatesan R, Lin W, Gurleyik K, He YY, Paczynski RP, Powers WJ, Hsu CY. Absolute measurements of water content using magnetic resonance imaging: preliminary findings in an in vivo focal ischemic rat model. Magn Reson Med 2000;43(1):146–150. [DOI] [PubMed] [Google Scholar]
- 62.Jin T, Wang P, Hitchens TK, Kim SG. Enhancing sensitivity of pH-weighted MRI with combination of amide and guanidyl CEST. NeuroImage 2017;157:341–350. [DOI] [PMC free article] [PubMed] [Google Scholar]
- 63.Sun PZ, Wang E, Cheung JS, Zhang X, Benner T, Sorensen AG. Simulation and optimization of pulsed radio frequency (RF) irradiation scheme for chemical exchange saturation transfer (CEST) MRI – demonstration of pH-weighted pulsed-amide proton CEST MRI in an animal model of acute cerebral ischemia. Magnetic Resonance in Medicine 2011;66(4):1042–1048. [DOI] [PMC free article] [PubMed] [Google Scholar]
- 64.Zu Z, Li K, Janve VA, Does MD, Gochberg DF. Optimizing pulsed-chemical exchange saturation transfer imaging sequences. Magn Reson Med 2011;66(4):1100–1108. [DOI] [PMC free article] [PubMed] [Google Scholar]
- 65.Watanabe T, Frahm J, Michaelis T. Amide proton signals as pH indicator for in vivo MRS and MRI of the brain—Responses to hypercapnia and hypothermia. NeuroImage 2016;133:390–398. [DOI] [PubMed] [Google Scholar]
- 66.Zhu XH, Qiao H, Du F, Xiong Q, Liu X, Zhang X, Ugurbil K, Chen W. Quantitative imaging of energy expenditure in human brain. NeuroImage 2012;60(4):2107–2117. [DOI] [PMC free article] [PubMed] [Google Scholar]
- 67.Sun PZ, Farrar CT, Sorensen AG. Correction for artifacts induced by B0 and B1 field inhomogeneities in pH‐sensitive chemical exchange saturation transfer (CEST) imaging. Magnetic Resonance in Medicine: An Official Journal of the International Society for Magnetic Resonance in Medicine 2007;58(6):1207–1215. [DOI] [PubMed] [Google Scholar]
Associated Data
This section collects any data citations, data availability statements, or supplementary materials included in this article.