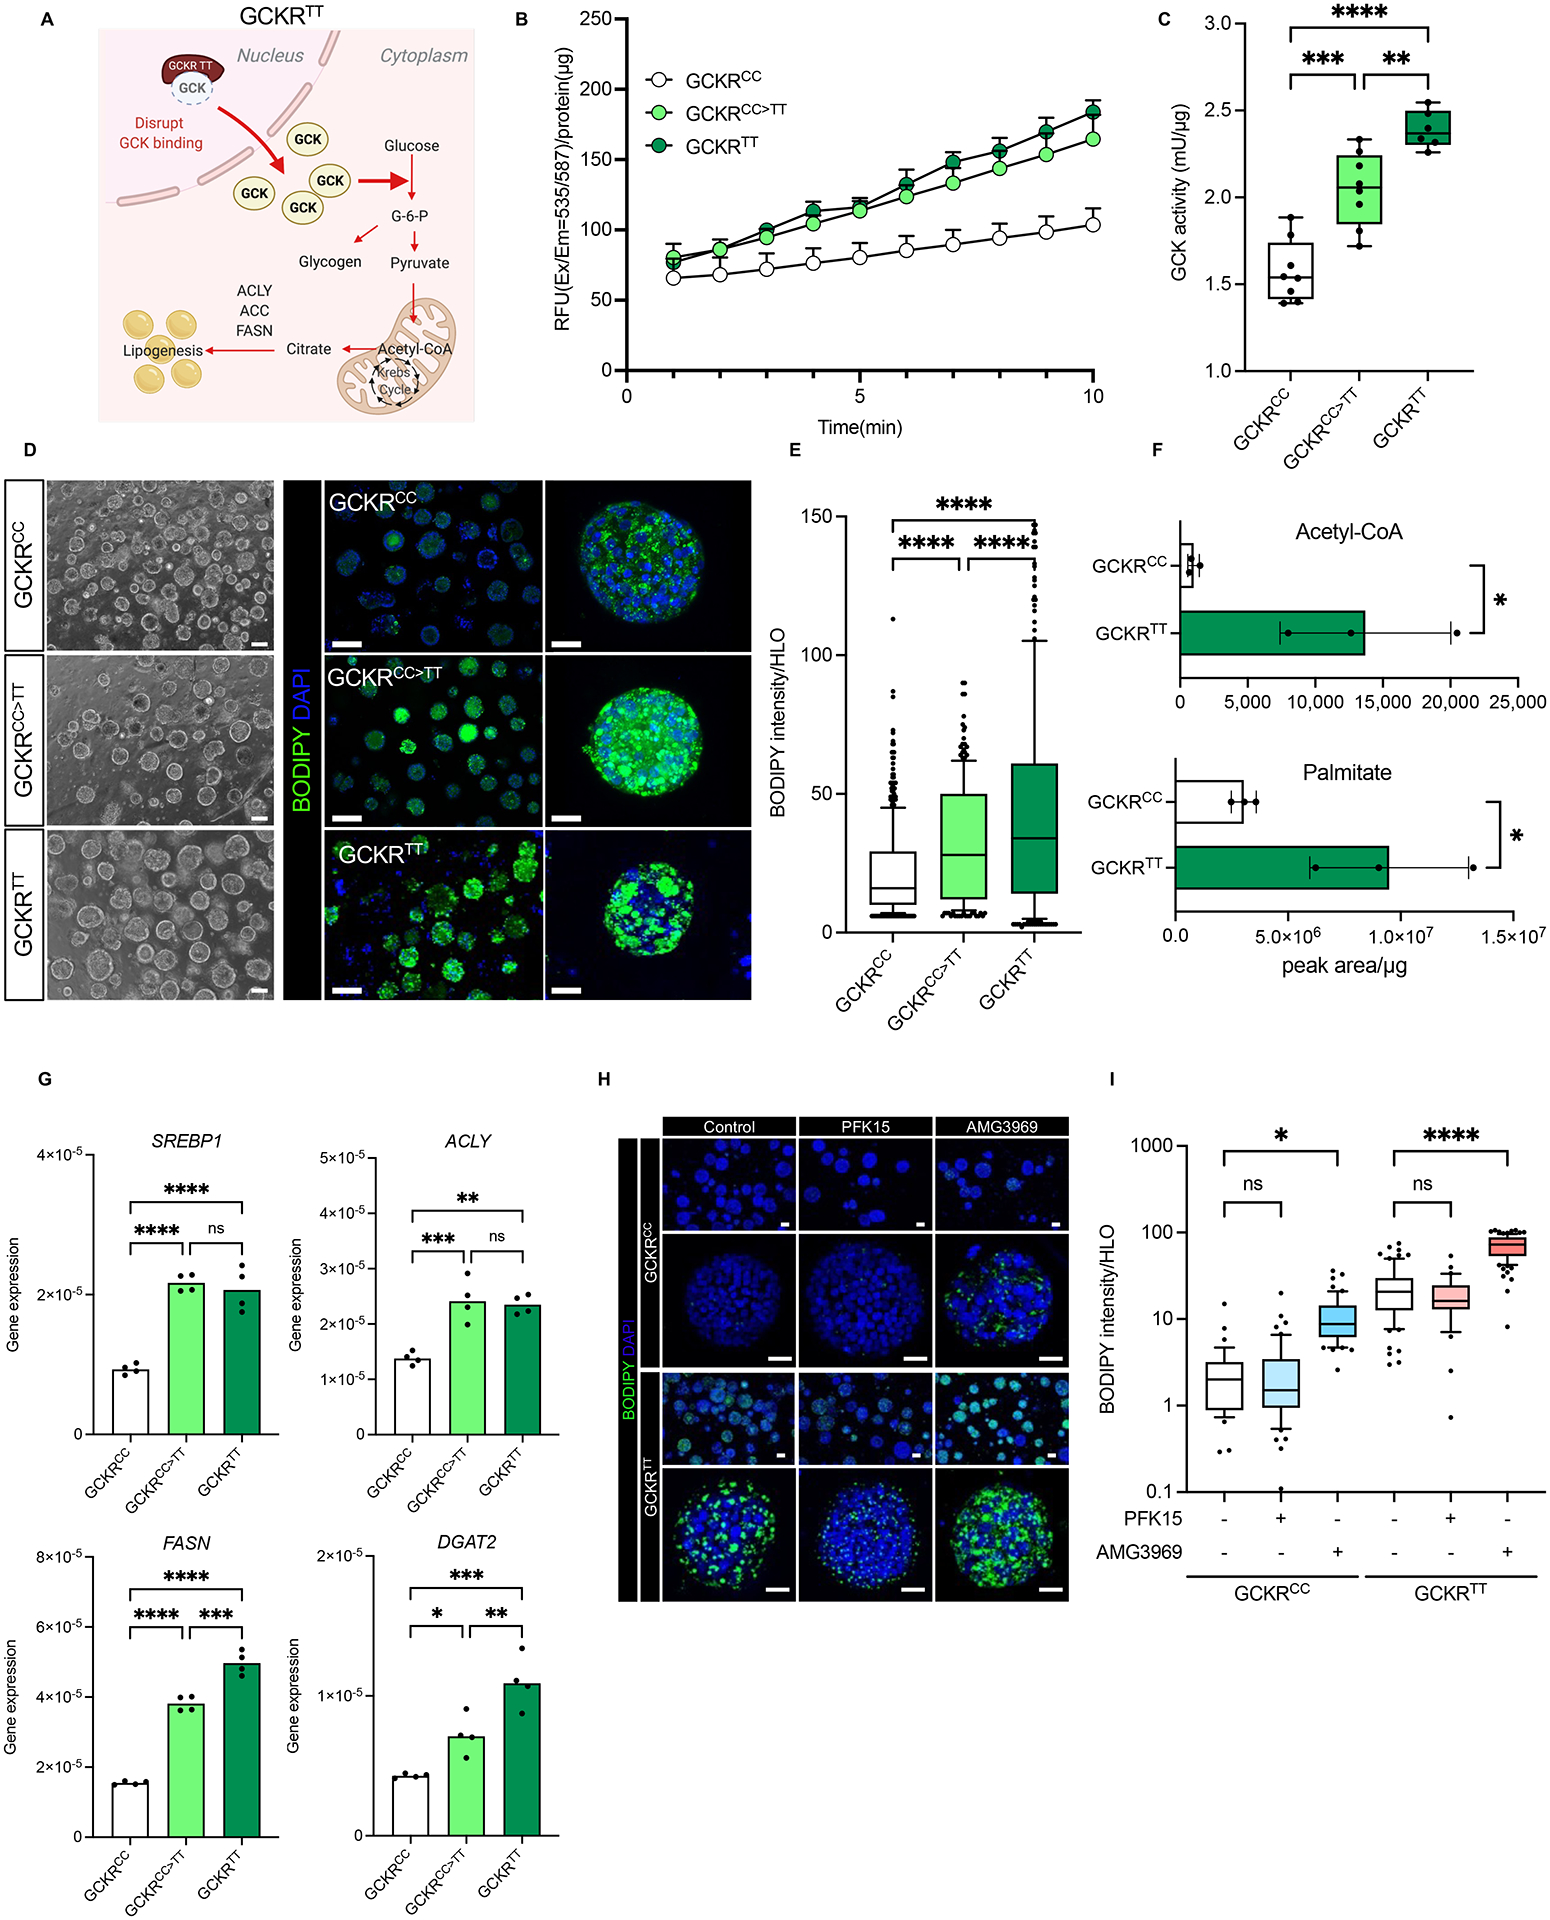
Figure 2. GCKR-rs1260326 TT genotype confers susceptibility to de novo lipid accumulation in HLO.

(A) Schematic diagram of GCKR variant association with glucokinase (GCK). GCKR functions as an inhibitor of GCK in the liver. The TT variant of GCKR-rs1260326 has a reduced ability to bind GCK and is less effective in suppressing GCK activities. (B) The time-course dynamics of GCK activity in HLOs carrying GCKRCC, GCKRCC>TT (gene-edited), GCKRTT. Data are shown as means ± SD (error bars), n=4. (C) Measurement of GCK activity in GCKRCC, GCKRCC>TT, and GCKRTT-HLOs. Data are shown as mean ± SD (Error bars), n=4, in triplicate. Unpaired t-test; **p < 0.01, ***p < 0.001, ****p < 0.0001. (D) Representative images of de novo lipid accumulation in GCKRCC, GCKRCC>TT, and GCKRTT-HLOs. Images were stained with BODIPY for fat accumulation (Green) and Hoechst 33342 for the nucleus (Blue). Scale bars, low magnification: 300μm, high magnification: 50μm. (E) Quantification of de novo lipid accumulation in GCKRCC, GCKRCC>TT, and GCKRTT-HLOs. The intensity of lipid was normalized to nuclear signals (mean ± SD, n = 8 independent experiments). Unpaired t-test; ****p < 0.0001. (F) Mass-spec analysis of protein content-normalized levels of acetyl-CoA and palmitate in HLOs. Data are shown as mean ± SD (Error bars), n=3, Unpaired t-test; *p < 0.05. (G) Comparison of lipogenesis-associated gene expression in GCKRCC, GCKRCC>TT, and GCKRTT-HLOs. Data are shown as means ± SD. (error bars), n=4–8. Unpaired t-test; *p < 0.05, **p < 0.01, ***p < 0.001, ***p < 0.0001. (H) Imaging of de novo lipid accumulation in GCKRCC and GCKRTT-HLOs, treated with PFKFB3 inhibitor (PFK15), and GCK-GCKR disruptor (AMG3969). Images were stained with BODIPY for fat accumulation and Hoechst 33342 for the nucleus. Scale bars, low magnification: 100μm, high magnification: 50μm. (I) Quantification of de novo lipid accumulation in GCKRCC and GCKRTT HLOs treated with PFK15 or AMG3969. The intensity of lipid was normalized to nuclear signals (mean ± SD, n = 8 independent experiments). Unpaired t-test; *p < 0.05, ****p < 0.0001.
