

Summary
Neuroepithelial crosstalk is critical for gut physiology. However, the mechanisms by which sensory neurons communicate with epithelial cells to mediate gut barrier protection at homeostasis and during inflammation are not well understood. Here, we find that Nav1.8+CGRP+ nociceptor neurons are juxtaposed with and signal to intestinal goblet cells to drive mucus secretion and gut protection. Nociceptor ablation led to decreased mucus thickness and dysbiosis, while chemogenetic nociceptor activation or capsaicin treatment induced mucus growth. Mouse and human goblet cells expressed Ramp1, receptor for the neuropeptide CGRP. Nociceptors signal via the CGRP-Ramp1 pathway to induce rapid goblet cell emptying and mucus secretion. Notably, commensal microbes activated nociceptors to control homeostatic CGRP release. In the absence of nociceptors or epithelial Ramp1, mice showed increased epithelial stress and susceptibility to colitis. Conversely, CGRP administration protected nociceptor ablated mice against colitis. Our findings demonstrate a neuron-goblet cell axis that orchestrates gut mucosal barrier protection.
Keywords: Nociceptor, sensory neuron, CGRP, goblet cell, mucus, Ramp1, colitis, gut barrier, gut-brain-axis
ETOC:
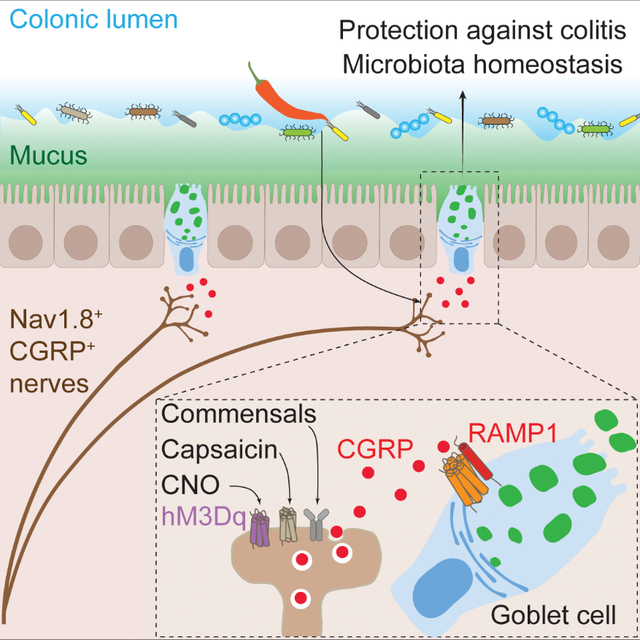
Pain sensory neurons induce mucus release from nearby intestinal goblet cells via a CGRP-RAMP1 axis in response to commensal and dietary cues to orchestrate gut mucosal protection.
Graphical Abstract
Introduction
Neuroepithelial crosstalk is fundamental for sensing and adapting to stimuli in the gastrointestinal (GI) tract (Furness et al., 2013; Kraus et al., 2021). Gut-innervating sensory neurons relay signals originating from epithelial cells to the brainstem and spinal cord through a gut-brain axis (Veiga-Fernandes and Mucida, 2016). Direct gut epithelial signaling to neurons has been described for enteroendocrine cells, which sense luminal signals and relay them to sensory nerves, resulting in metabolic adaptation or development of visceral pain (Bellono et al., 2017; Kaelberer et al., 2018; Ye et al., 2021). The molecular mechanisms underlying sensory neuron signaling to gut epithelial cells are less well understood.
The gut barrier is composed of epithelial cells connected by paracellular junctions and overlaid by a mucus layer, whose essential function is to prevent unregulated passage of luminal contents into underlying tissues (Chelakkot et al., 2018; Turner, 2009). Goblet cells are specialized epithelial cells that produce mucins and associated proteins to form the mucus layer, a loosening structural mucin gradient created by mucus-associated enzymes (Nystrom et al., 2018). The mucus layer defends the tissue against microbial penetration while maintaining commensal homeostasis (Knoop and Newberry, 2018; Pelaseyed and Hansson, 2020). Mucus defects increase susceptibility to pathogens and are associated with development of inflammatory bowel diseases (Bergstrom et al., 2010; van der Post et al., 2019).
Microbial and immune cues are canonical triggers of mucus release from goblet cells (Birchenough et al., 2016; Wlodarska et al., 2014). The neurotransmitter acetylcholine (ACh) also induces mucus secretion from small intestine and colon explants (Halm and Halm, 1999; Specian and Neutra, 1980). Enteric neuron derived IL-18 regulates goblet cell antimicrobial peptide production and host defense against Salmonella infection (Jarret et al., 2020). Few studies have evaluated the role of sensory neuroepithelial signaling in mucus secretion at homeostasis and during inflammation.
The GI tract is densely innervated by intrinsic enteric neurons and gut-extrinsic neurons, which cooperatively regulate diverse aspects of tissue physiology, including intestinal motility, nutrient absorption, sickness behavior, host defense, and pain (Veiga-Fernandes and Mucida, 2016; Yoo and Mazmanian, 2017). Nociceptors, characterized by expression of ion channels such as the voltage-gated sodium channel Nav1.8 and transient receptor potential vanilloid subtype 1 (TRPV1), are specialized sensory neurons that mediate pain, driving withdrawal and avoidance behaviors (Lagomarsino et al., 2021). Gut-innervating nociceptors are extrinsic sensory afferents arising from dorsal root ganglia (DRG), which, upon activation by noxious stimuli, transduce action potentials to the spinal cord to mediate visceral pain (Foster et al., 2017; Jacobson et al., 2021). At nociceptor peripheral nerve terminals, local release of neuropeptides, including calcitonin gene-related peptide (CGRP), can drive neurogenic inflammation through signaling to immune or vascular cells (Baral et al., 2019). The receptor for CGRP is formed by receptor activity modifying protein 1 (Ramp1) and its co-receptor, calcitonin receptor-like receptor (Calcrl) (Moore and Salvatore, 2012). How nociceptors are involved in regulating the gut epithelial barrier at homeostasis and in inflammation is poorly defined.
Here, we demonstrate a critical role for nociceptor neurons and their signaling to goblet cells via a CGRP-Ramp1 axis in gut barrier protection. Nociceptor deficiency in mice led to decreased mucus thickness at homeostasis, while nociceptor activation induced mucus production. The CGRP co-receptors Ramp1 and Calcrl are expressed in goblet cells. In response to commensal and dietary cues, nociceptors released CGRP, which signaled through Ramp1 on goblet cells to induce mucus release. This nociceptor-goblet cell axis protected against colitis-induced immunopathology. Our findings demonstrate an intestinal neuroepithelial axis that orchestrates gut mucosal protection at homeostasis and during colitis pathogenesis.
Results
Nociceptors are juxtaposed with goblet cells and mediate colonic mucus production
We bred Nav1.8-Cre mice with Cre-dependent Rosa26-tdTomato mice to label gut-innervating nociceptors. Nav1.8-tdTomato+ nerves were found in proximity to EpCAM+ epithelial cells in the colon (Fig. S1A). We then bred Nav1.8-Cre mice with Rosa26-DTA mice to generate mice lacking Nav1.8+ nociceptors (Nav1.8DTA mice) (Fig. 1A) (Abrahamsen et al., 2008; Lai et al., 2019). Tyrosine hydroxylase (Th)+ sympathetic nerves were intact in these mice (Fig. S1B–C). Oral gavage of FITC-dextran in Nav1.8DTA mice showed similar barrier permeability compared with control littermates (Fig. S1D).
Figure 1. Nociceptors neighbor goblet cells and regulate colonic mucus production.
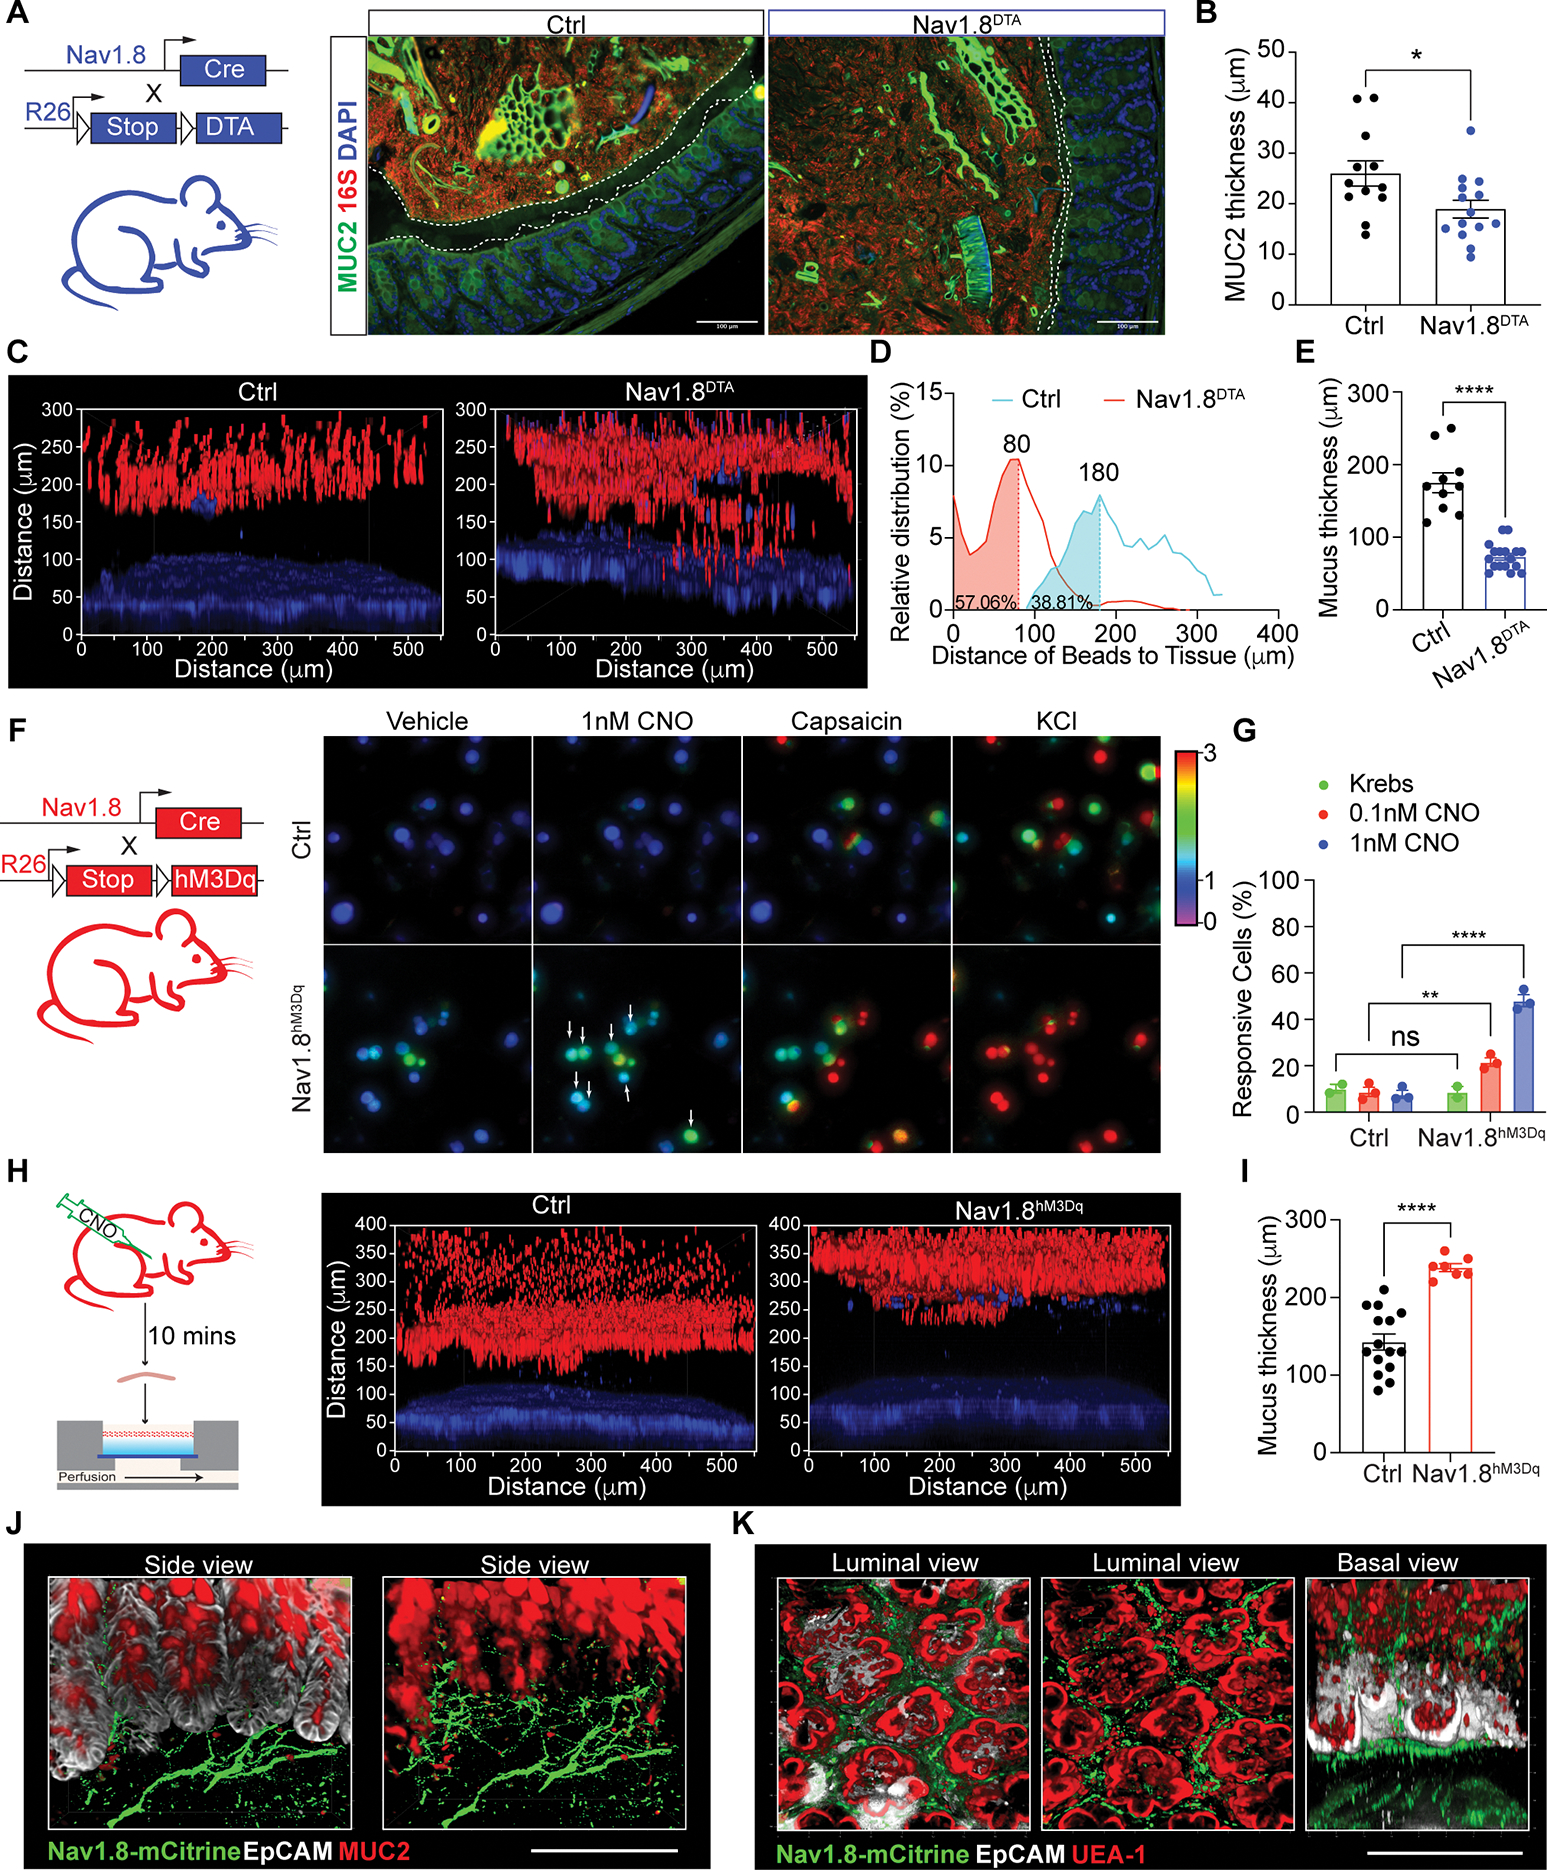
(A) MUC2, 16S rDNA, DAPI staining in Nav1.8DTA and control mouse colons.
(B) MUC2 thickness in Nav1.8DTA and control colons (n=12–14 mice/group).
(C) Colon explants showing epithelium (blue) overlayed with 1-μm beads (red) in Nav1.8DTA and control mice.
(D-E) Bead distribution (D), mucus thickness (E) in Nav1.8DTA and control colon explants (3–5 areas/mouse, 3–4 mice/group); Peak (mode) bead distance shown.
(F-G) Calcium influx in KCl-responsive DRG neurons from Nav1.8hM3Dq and control mice induced by CNO (n=3 per group).
(H-I) Colon explants (H), mucus thickness (I) from Nav1.8hM3Dq and control mice injected i.p. with CNO for 10 min. (n=2–3 areas/mouse; 3–5 mice/group).
(J-K) Whole-mount colon tissue from Nav1.8hM3Dq mice stained for mCitrine, EpCAM, MUC2, UEA-1. EpCAM removed in right (J) and middle (K).
Scale bars, 100 μm. Student’s t-test in B, E, I. Two-way ANOVA in G. Mean±SEM. *p<.05, **p<.01, ***p<.001, ****p<.0001. See also Figure S1.
We next asked if nociceptor ablation led to changes in the mucus layer. Mucin 2 (MUC2) immunostaining revealed that Nav1.8DTA mice had thinner colon mucus layers compared to control mice (Fig. 1A–B and S1E). As mucus thickness can shrink due to fixation conditions, we next used a live colon explant assay overlaid with fluorescent beads to more accurately measure mucus thickness (Fig. S1F) (Gustafsson et al., 2012). Bead distribution analysis showed that Nav1.8DTA mice exhibited a thinner colonic mucus layer with higher bead penetrability compared to control littermates (Fig. 1C–E and S1G).
To investigate whether activating nociceptors is sufficient to promote mucus growth, we bred Nav1.8-Cre mice with hM3Dq reporter mice to drive expression of both mCitrine and hM3Dq, a designer receptor exclusively activated by designer drugs (DREADD) whose ligand is clozapine N-oxide (CNO) (Nav1.8hM3Dq) (Urban and Roth, 2015) (Fig. 1F). CNO treatment induced dose-dependent calcium influx in cultured Nav1.8hM3Dq DRG neurons but not control cells (Fig. 1F–G and S1H–I). CNO treatment of Nav1.8hM3Dq mice rapidly increased mucus thickness compared to control mice (Fig. 1H–I).
We observed Nav1.8-mCitrine+ nerves in close proximity to MUC2+EpCAM+ goblet cells in colonic crypts (Fig. 1J), suggesting they may interact. Nav1.8+ nerves were also juxtaposed with Ulex Europaeous Agglutinin I (UEA1)+EpCAM+ goblet cells in small intestine and colon (Fig. 1K and S1J). We did not detect changes in overall MUC2+ goblet cell numbers between Nav1.8DTA and control mice (Fig. S1K–O). Hence, Nav1.8+ neurons are necessary and sufficient to regulate mucus production and may interact with goblet cells.
CGRP co-receptor Ramp1 is expressed in goblet cells and required for maintaining the mucus barrier
We hypothesized that nociceptors may directly signal to goblet cells via neuropeptides to facilitate mucus production. We performed single-cell RNA-sequencing (scRNA-seq) of colonic and ileal EpCAM+CD45− epithelial cells from control (DTAf/−) mice. Five epithelial cell types, including goblet cells, were identified from coarse clusters, based on expression of canonical marker genes (Fig. 2A and S2A).
Figure 2. The CGRP co-receptor Ramp1 is expressed in goblet cells and maintains mucus barrier.
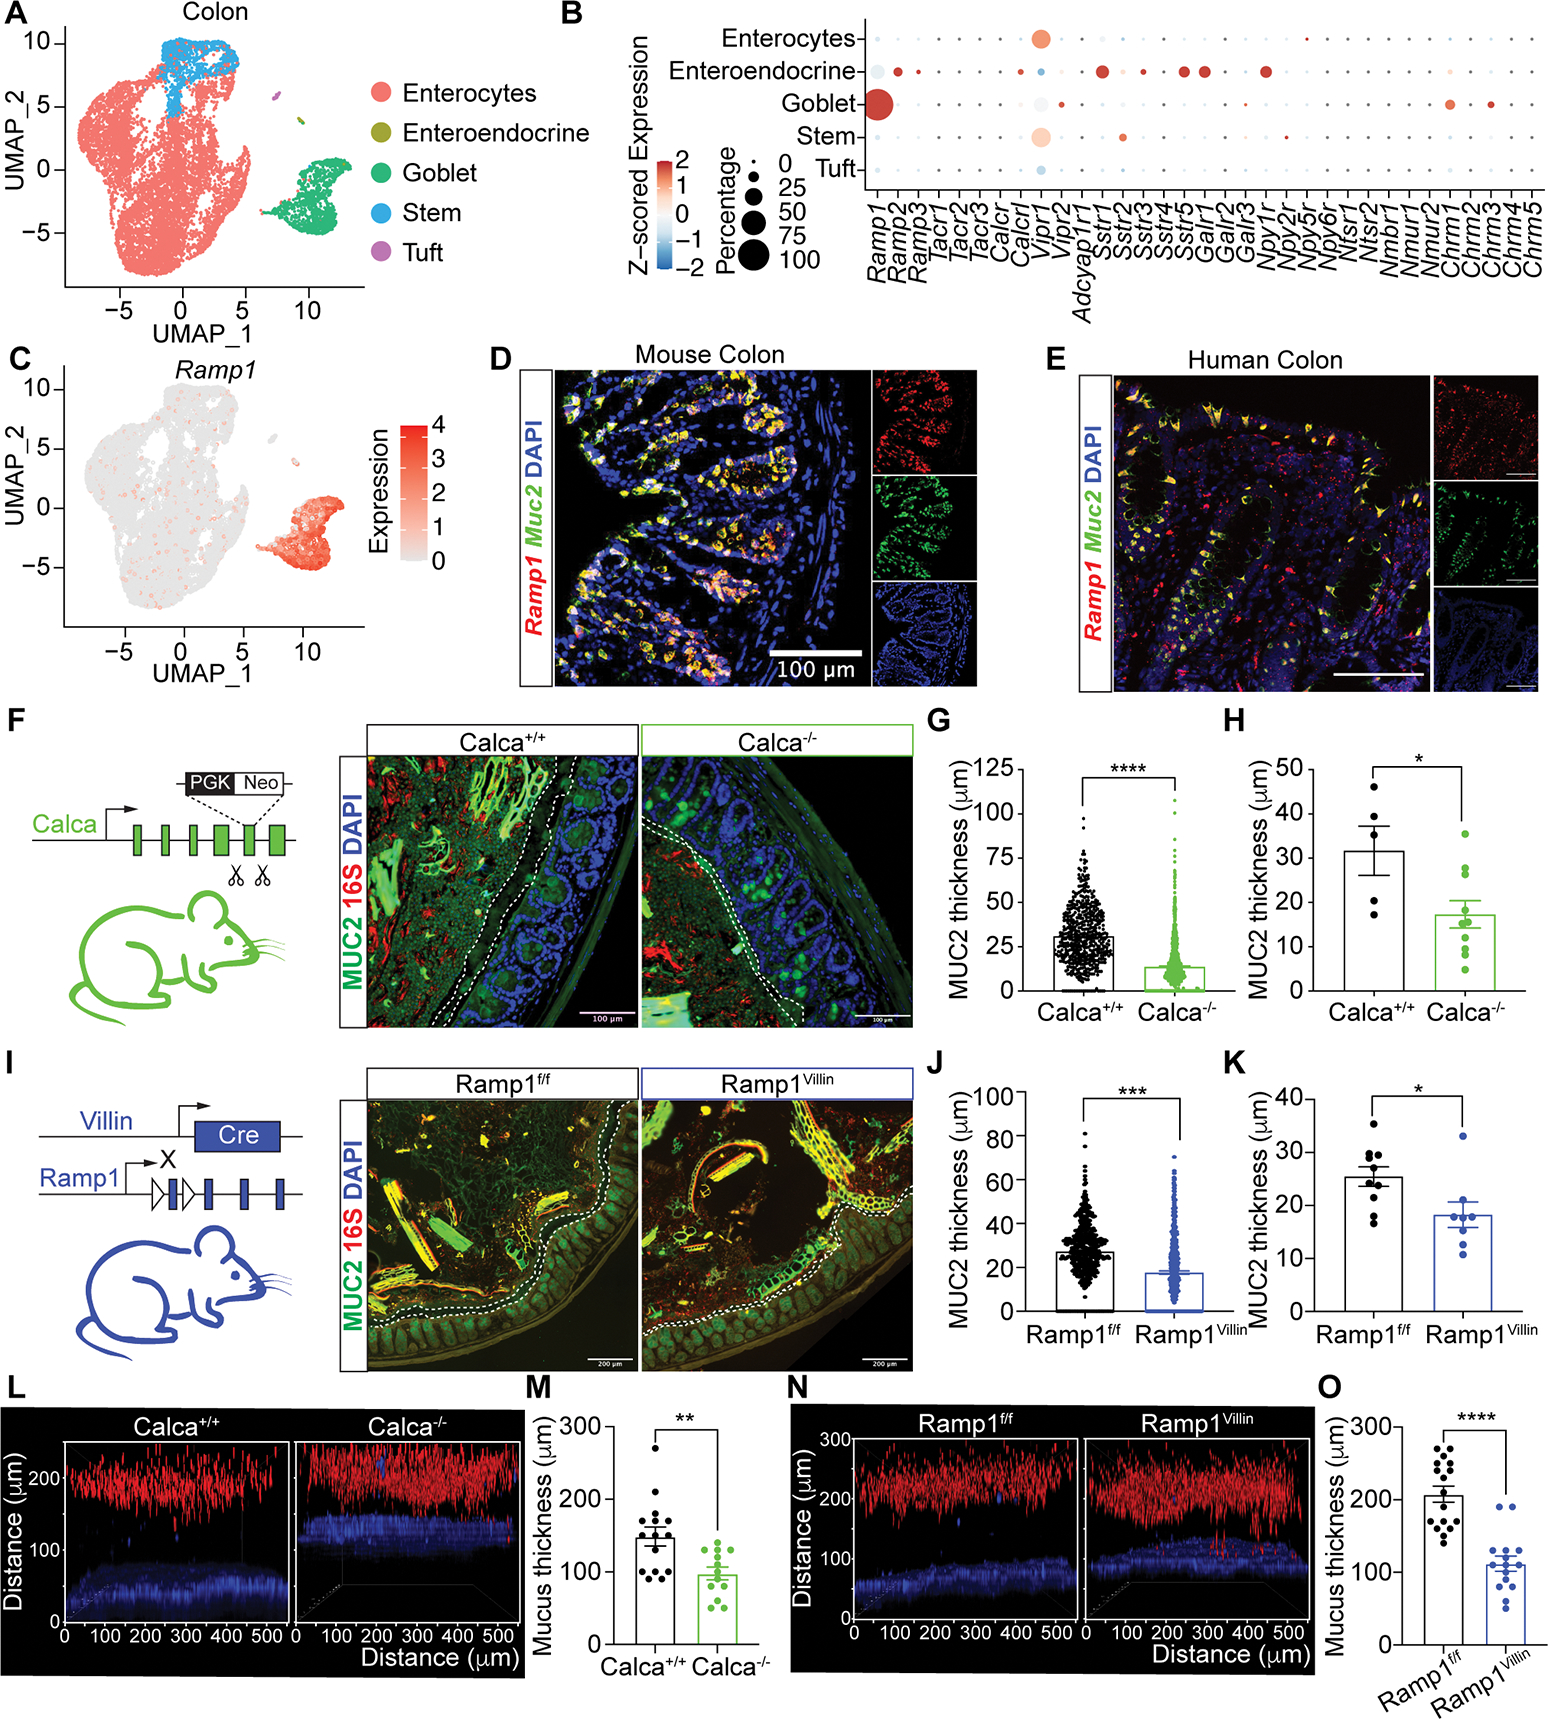
(A) UMAP of scRNA-seq data from colonic epithelial cells, colored by inferred cell type, from control Nav1.8-Cre−DTAfl/− mice.
(B) Dot plot of average z-scored expression of neuropeptide and neurotransmitter receptors in colonic epithelial cell subsets from (A).
(C) UMAP as in (A) showing Ramp1 expression.
(D-E) In situ hybridization of Ramp1, Muc2 in mouse colon (D) and RAMP1, MUC2 in human colon (splenic flexure) (E).
(F-H) MUC2,16S rDNA, DAPI staining (F), MUC2 thickness per measurement (G) and per mouse (H) of colon tissue from Calca+/+ and Calca−/− mice. (n=5–10 mice/group).
(I-K) MUC2, 16S rDNA, DAPI staining (I), MUC2 thickness per measurement (J) and per mouse (K) of colon tissue from Ramp1Villin and Ramp1f/f mice. (n=8–10 mice/group).
(L-M) Colonic explants (L) and mucus thickness (M) from Calca+/+ and Calca−/− mice. (n=3–5 area/mouse, 3–4 mice/group).
(N-O) Colonic explants (N) and mucus thickness (O) from Ramp1Villin and Ramp1f/f mice. (n=3–5 area/mouse, 3–4 mice/group).
Scale bar, 100 μm in D-F, I. Mann-Whitney test in G, J, M, O. Student’s test in H, K. Mean±SEM. *p < .05, **p < .01, ***p < .001, ****p < .0001. See also Figure S2.
We surveyed colonic epithelial cells for expression of neuropeptide receptors (Fig. 2B). Goblet cells uniquely expressed high levels of Ramp1 and low levels of other neuropeptide receptors (Fig. 2B–C). In the small intestine, expression of Ramp1 was similarly high in goblet cells and absent in other epithelial cell types (Fig. S2B–C), consistent with published scRNA-seq data of small intestine epithelial cells (Fig. S2D)(Haber et al., 2017).
We also analyzed expression of Calcrl and calcitonin receptor (Calcr), as both can form a complex with Ramp1 to bind CGRP (McLatchie et al., 1998; Salvatore et al., 2006). Calcrl was expressed in colonic goblet cells, but at lower levels compared to Ramp1 (Fig. 2B and S2E). By contrast, Calcr was not expressed (Fig. S2E). As a comparison, we analyzed expression of muscarinic acetylcholine (ACh) receptors (mAChRs) (Chrm1–5), which play roles in mucus release (Gustafsson et al., 2021). We observed expression of Chrma1 and Chrm3 comparable to that of Calcrl (Fig. 2B and S2E). A recent in-depth analysis of FACS-purified colonic MUC2+ goblet cells (Nystrom et al., 2021) also revealed Ramp1 and Calcrl expression (Fig. S2F–G).
To spatially analyze expression in mouse and human gut tissues, we performed in situ hybridization. We observed colocalization of Muc2 and Ramp1 transcripts in goblet cells in the mouse colon (Fig. 2D), mouse small intestine (Fig. S2H), and colocalization of MUC2 and RAMP1 in human colon (Fig. 2E and S2I). Immunostaining showed that Calcrl protein is expressed in UEA1+ goblet cells and other epithelial cells in the mouse colon (Fig. S2J). These data indicate that both components of the CGRP receptor, Ramp1 and Calcrl, are expressed in goblet cells.
We hypothesized that nociceptor-derived CGRP signals to Ramp1+ goblet cells to maintain mucus levels. CGRP has two isoforms: CGRPα and CGRPβ (Drokhlyansky et al., 2020; Russell et al., 2014). We found that CGRPα deficient mice (Calca−/−) showed significantly decreased mucus thickness compared to Calca+/+ littermates (Fig. 2F–H). By contrast, CGRPβ deficient mice (Calcb−/−) did not show differences in goblet cell numbers or mucus thickness (Fig. S2K–L).
We next asked whether epithelial Ramp1 signaling is required for colonic mucus maintenance. We bred Ramp1f/f mice with Villin1-Cre mice to ablate Ramp1 in gut epithelial cells including goblet cells (Ramp1Villin mice). While there was no difference in goblet cell numbers (Fig. S2M), Ramp1Villin mice had significantly thinner colonic mucus layers than control Ramp1f/f littermates (Fig. 2I–K). Decreased mucus thickness in Calca−/− and Ramp1Villin mice compared to control littermates were confirmed in live colon explants (Fig. 2L–O). Therefore, CGRPα and epithelial expression of Ramp1 are required to maintain colonic mucus layers.
Nociceptors sense commensal microbes and dietary stimuli to release CGRP
Our data suggest that nociceptors communicate with goblet cells via CGRP to maintain the mucus barrier. Consistently, we observed CGRP colocalization with Nav1.8+ nerves in the colon (Fig. S2N), and less CGRP in serum and colon explants from Nav1.8DTA mice compared to control littermates (Fig. 3A). Imaging of gut-innervating mesenteric nerves revealed ablation of CGRP+ nerves in Nav1.8DTA mice, suggesting Nav1.8+ neurons as an important source of intestinal CGRP (Fig. S2O).
Figure 3. Nociceptors are activated by commensal cues and capsaicin to secrete CGRP.
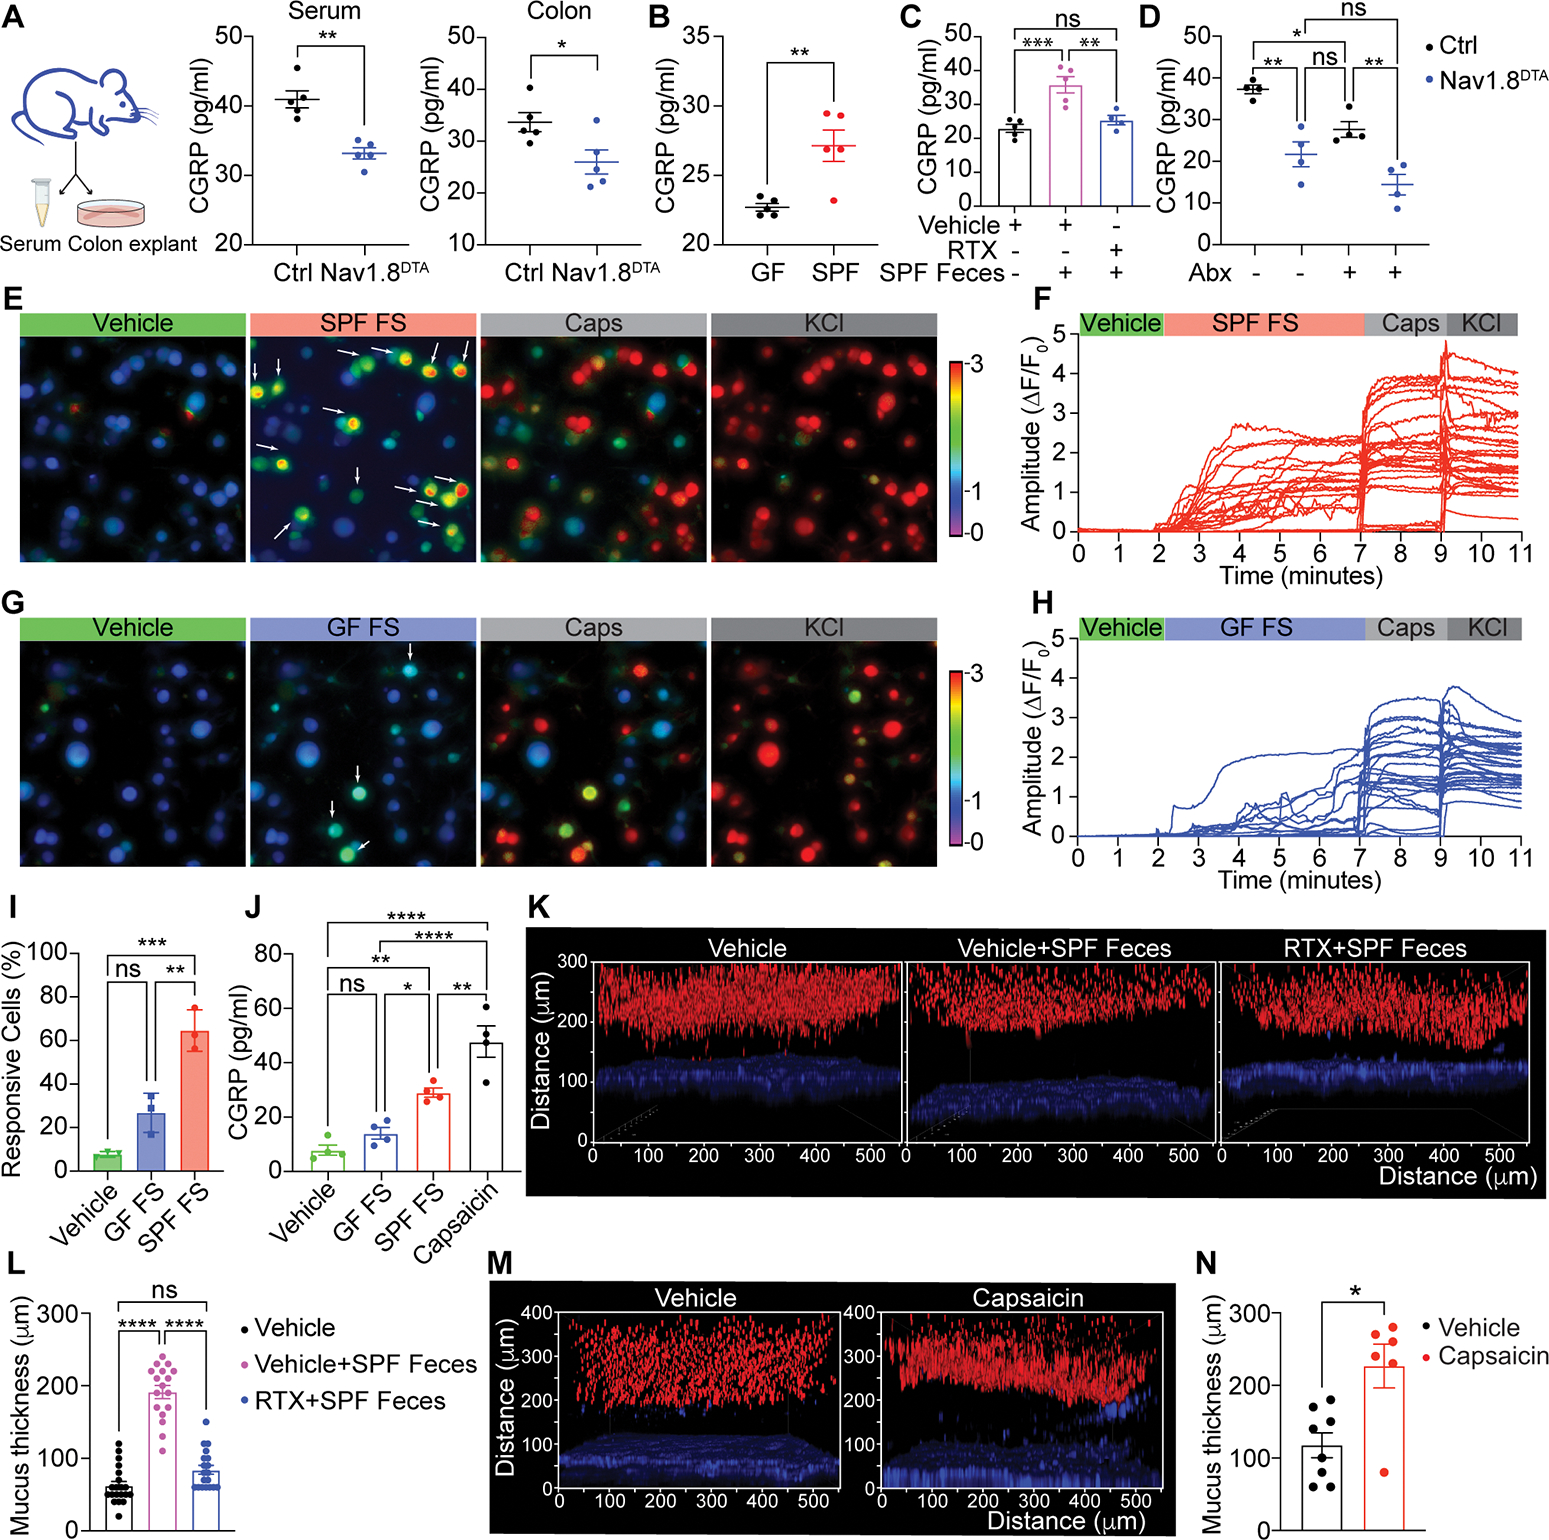
(A) Serum and colon CGRP levels in Nav1.8DTA and control mice. (n=5 mice/group).
(B) Colon CGRP levels in wild-type germ free (GF) and specific pathogen-free (SPF) mice. (n= 5 mice/group).
(C) Colon CGRP levels in vehicle-pretreated GF mice, vehicle- and resiniferatoxin (RTX)-pretreated GF mice transplanted with SPF feces. (n= 4–5 mice/group).
(D) Colon CGRP levels in Nav1.8DTA and control mice treated with or without antibiotics (n=4 mice/group).
(E-I) Calcium influx in KCl-responsive wildtype DRG neurons triggered by SPF fecal supernatant (SPF FS), GF fecal supernatant (GF FS), or capsaicin.
(J) CGRP levels produced by wild type mouse DRG neurons stimulated with vehicle, GF FS, SPF FS or capsaicin.
(K-L) Colonic explants (K) and mucus thickness (L) from mice in (C). (n=3–5 area/mouse, 3–4 mice/group).
(M-N) Colonic explants (M) and mucus thickness (N) from wildtype B6 mice orally treated with vehicle or capsaicin (10mg/kg) for 30 minutes. (n=2 area/mouse, 3–4 mice/group).
Student’s test in A-B. One-way ANOVA in C-D, I-J. Mann-Whitney test in L and N. Mean±SEM. ns=not significant. *p < .05, **p < .01, ***p < .001, ****p < .0001.
Previous work showed that nociceptors can directly sense bacterial pathogens and their products (Baral et al., 2018; Chiu et al., 2013). We hypothesized that gut commensal microbes may trigger homeostatic nociceptor activation and CGRP release. We found significantly higher levels of CGRP in colon explants from specific pathogen free (SPF) mice compared to germ-free (GF) mice (Fig. 3B). Fecal transplantation from SPF mice into GF mice significantly upregulated CGRP release in the colon (Fig. 3C). Treatment of mice with the TRPV1 ligand resiniferatoxin (RTX) leads to chemical ablation of nociceptors, including those that innervate the gut (Lai et al., 2019). RTX pre-treatment blocked the upregulation of CGRP release in conventionalized GF mice (Fig. 3C), suggesting a central role for nociceptors in microbiome-dependent CGRP release. Consistently, treatment of control mice with antibiotics decreased CGRP release (Fig. 3D). However, antibiotics treatment did not reduce CGRP release in Nav1.8DTA mice (Fig. 3D), confirming the role of nociceptors as a CGRP source.
To determine whether commensal-derived products can directly activate nociceptors, we treated cultured DRG neurons with fecal supernatants. We found that fecal supernatant from SPF mice triggered significantly more DRG neuron activation, shown by calcium influx, and CGRP release than that triggered by fecal supernatant from GF mice (Fig. 3E–J). Consistent with the increased CGRP release and previous studies (Johansson et al., 2015), the colonic mucus layer was significantly thicker in GF mice conventionalized with SPF feces compared to control GF mice (Fig. 3K–L). Nociceptors were necessary for microbiome-dependent mucus layer growth, as pre-treatment of conventionalized mice with RTX resulted in a significantly thinner mucus layer (Fig. 3K–L).
In addition to microbes, we hypothesized that dietary factors could trigger nociceptor activation and mucus production. Capsaicin, the active component of chili peppers, is a prototypic TRPV1 ligand that activates nociceptors (Caterina et al., 1997). Capsaicin triggered robust DRG neuron activation and CGRP release in vitro (Fig. 3E–J). Oral gavage of capsaicin also dramatically induced increased colonic mucus thickness (Fig. 3M–N). These results indicate that nociceptors can directly sense intestinal commensal cues and capsaicin to release CGRP.
Nociceptor activation induces goblet cell emptying and mucus growth through CGRP-Ramp1 signaling
We hypothesized that nociceptor activation is coupled to goblet cell emptying. We first confirmed that CNO induced CGRP release from Nav1.8hM3Dq DRG neurons but not control neurons (Fig. S3A). Next, we injected mice with CNO, observing rapid goblet cell emptying in Nav1.8hM3Dq but not control mice as indicated by loss of Periodic acid Schiff (PAS)/Alcian Blue (AB) staining (Fig. 4A–B). We also generated CalcahM3Dq mice to specifically activate CGRP+ neurons (Fig. 4C). CNO treatment induced increased CGRP levels, as well as rapid goblet cell emptying in CalcahM3Dq but not control mice (Fig. 4C–D and Fig. S3B). Pretreatment of mice with the Ramp1 antagonist BIBN4096 significantly reduced goblet cell emptying upon CGRP+ neuron activation (Fig. 4C–D), indicating that nociceptor neuron-dependent goblet cell mucus release relies on Ramp1 signaling. Consistent with goblet cell emptying, colonic mucus thickness in CalcahM3Dq mice rapidly increased following CNO treatment compared to control mice (Fig. S3C–D). As a control, activation of Th+ neurons in Th-Cre-induced hM3Dq DREADD (ThhM3Dq) mice with CNO did not lead to goblet cell emptying (Fig. S3E–F). These data indicate that nociceptor activation facilitates goblet cell emptying and mucus release through CGRP-Ramp1 signaling.
Figure 4. Nociceptor activation promotes goblet cell emptying and mucus secretion through CGRP-Ramp1 axis.
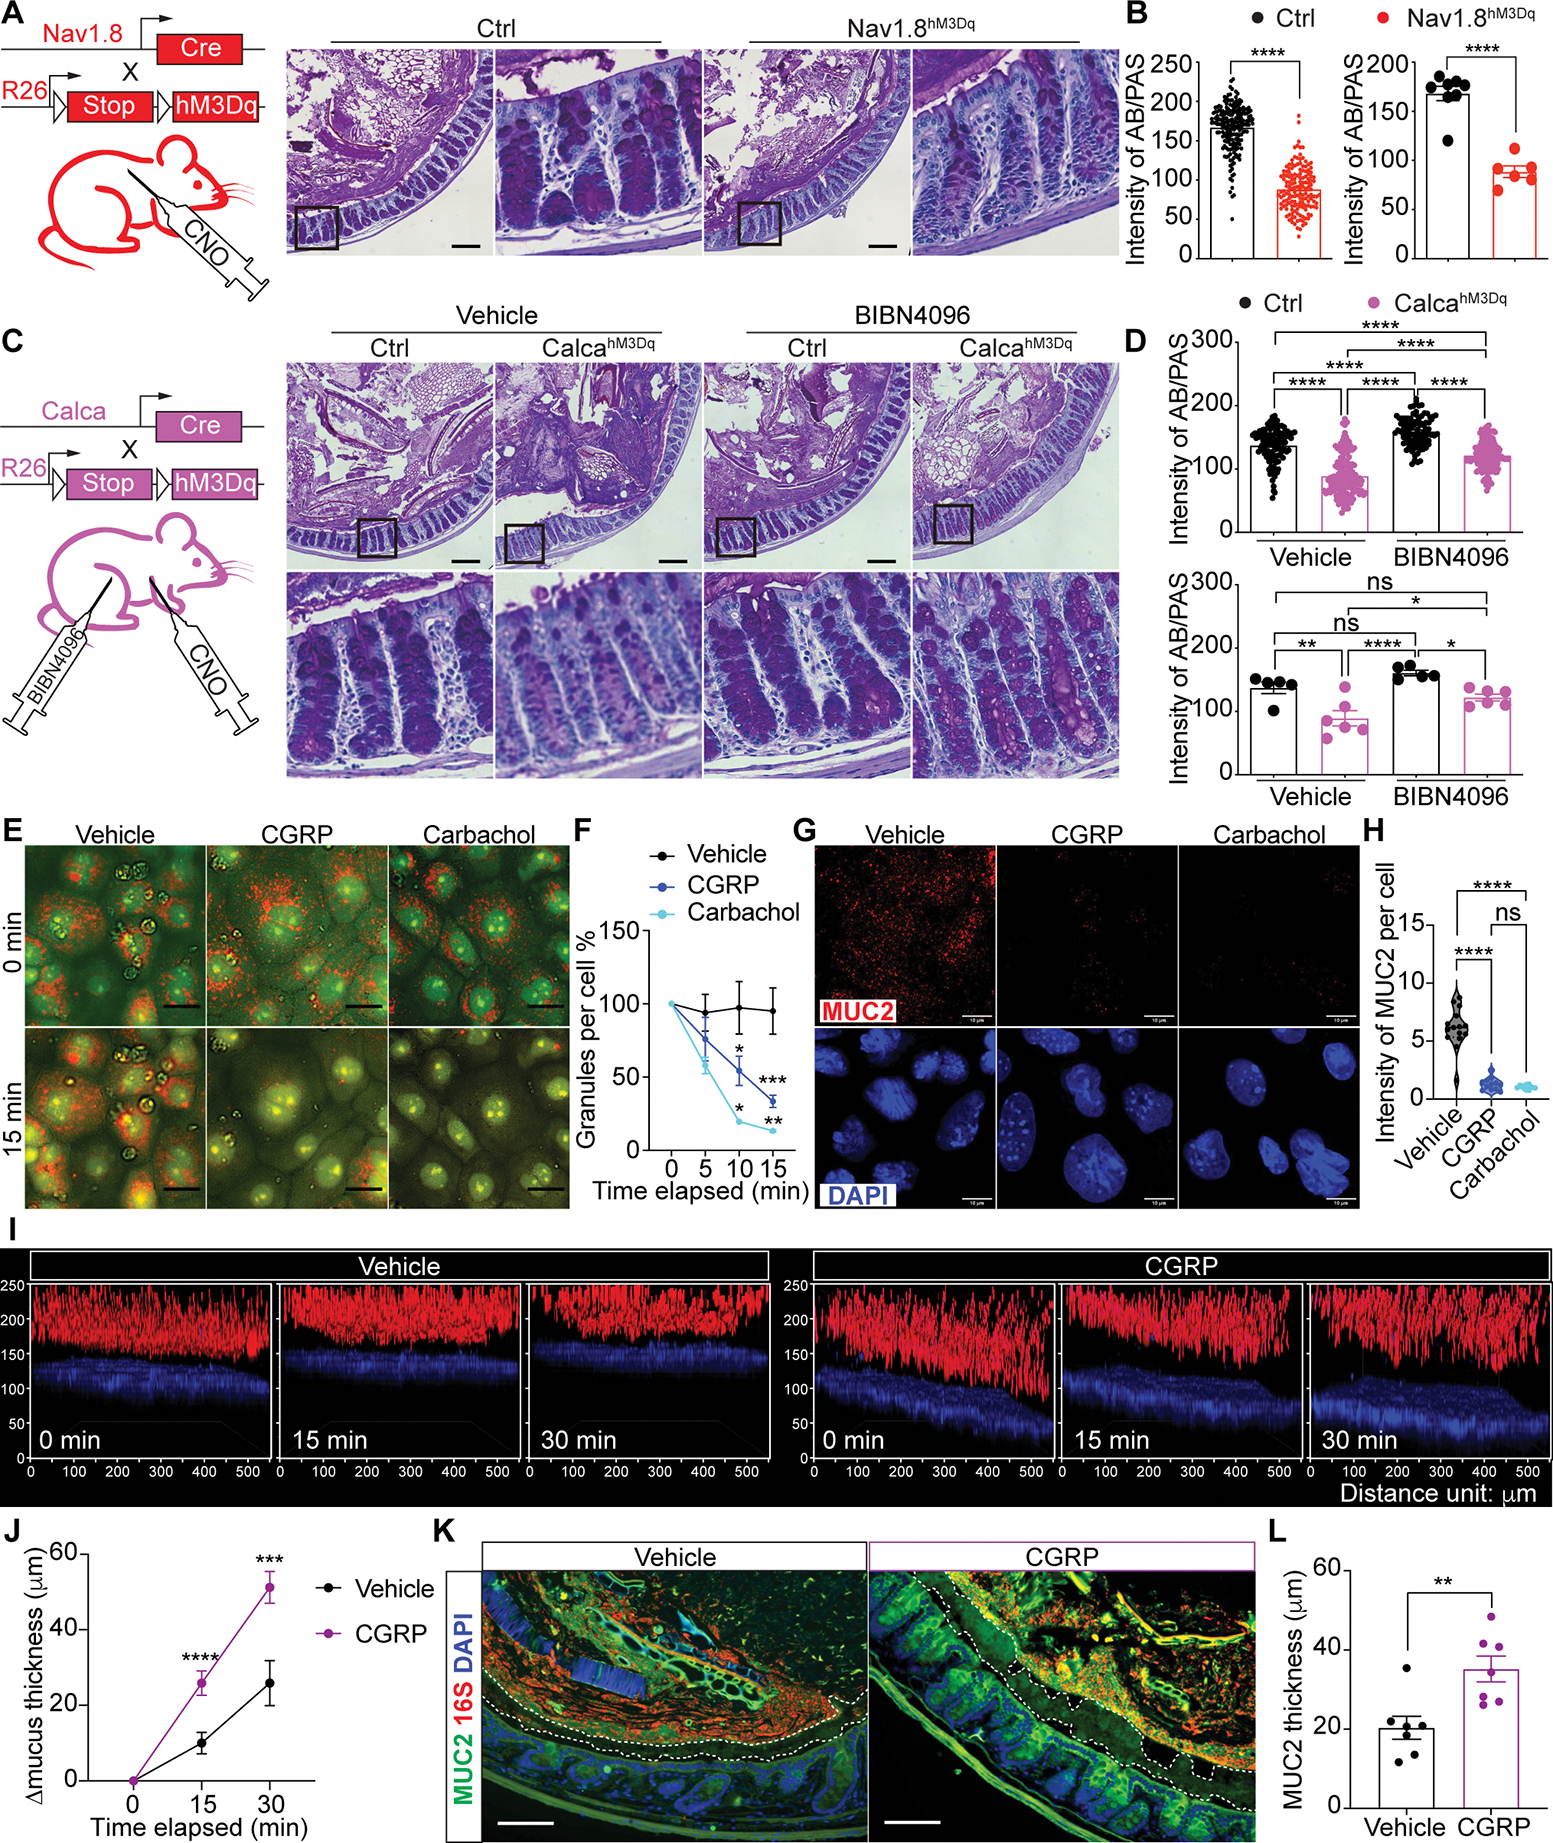
(A-B) AB/PAS (Alcian blue/Periodic acid-Schiff) staining (A), intensity measurement (B) per crypt (left) and per mouse (right) of colon tissue from CNO-treated Nav1.8hM3Dq and control mice. (20–30 crypts/mouse, n=6–8 mice/group).
(C-D) AB/PAS staining (C), intensity measurement (D) per crypt (upper) and per mouse (lower) of colon tissue from vehicle- or BIBN4096-pretreated CalcahM3Dq and control mice after CNO injection (20–30 crypts/mouse, n=5–6 mice/group).
(E-F) Acridine Orange (AO) staining (E) and normalized intensity measurement (F) of 2D organoid-derived wild type primary goblet cell cultures treated with vehicle, CGRP, carbachol for the indicated time points. (n=4–10 areas,100–200 cells/area).
(G-H) MUC2 and DAPI staining (G) and intensity measurement (H) of primary wild type goblet cell cultures treated with vehicle, CGRP, or carbachol for 15 min. (n=8–15 areas, 100–200 cells/area).
(I-J) Wildtype mouse colonic explants (I) and mucus thickness growth (J) with vehicle or CGRP treatment for the indicated time points. (n=3–5 areas/mouse; 4 mice/group).
(K-L) MUC2, 16S rDNA and DAPI staining (K) and MUC2 thickness (L) of colon tissue from wildtype B6 mice 10 minutes after CGRP i.p. injection. (n=7 mice/group).
Scale bar, 100 μm in A, C, K. Scale bar, 10 μm in E, G. Mann-Whitney test in left B, top D. Student’s t-test in right B, L. Two-way ANOVA in bottom D. One-way ANOVA in H. Multiple t-test in F, J. Mean±SEM. ns=not significant. *p < .05, **p < .01, ***p < .001, ****p < .0001. See also Figure S3.
Our data points to nociceptor regulation of goblet cell function via CGRP, which is predicated on proximity between CGRP+ nerves and intestinal goblet cells. We observed close juxtaposition of CGRP-GFP+ nerves with MUC2+ goblet cells and UEA1+ goblet cells in colonic crypts (Fig. S3G–H), by imaging Calca-GFP-DTR mice that express eGFP under the Calca promoter (McCoy et al., 2013). These CGRP+ nerves were depleted by RTX-dependent nociceptor ablation (Fig. S3I).
We next asked if CGRP is sufficient to induce goblet cell emptying. We pre-loaded 2D organoid-derived goblet cell cultures with Acridine Orange, which fluoresces orange when accumulated in secretory cell vesicles (Shumilov et al., 2014). Treatment with CGRP or carbachol, a nonhydrolyzable mimic of Ach, resulted in rapid decrease of Acridine Orange+ granules compared to treatment with vehicle, indicating goblet cell emptying (Fig. 4E–F). Cells treated with CGRP or carbachol also exhibited significantly less intracellular MUC2 staining (Fig. 4G–H). CGRP, but not vehicle treatment, induced a rapid increase of mucus thickness in live colon explants (Fig. 4I–J and S3J). Moreover, CGRP injection into WT mice led to a rapid and significant increase in colonic mucus thickness (Fig. 4K–L and S3K). Taken together, these data show that CGRP is sufficient to mediate goblet cell emptying, resulting in mucus layer growth.
We next determined if CGRP induction of goblet cell emptying depends on Ramp1. CGRP i.p. injection induced goblet cell emptying in control Ramp1fl/fl mice but not in Ramp1Villin mice (Fig. S3L–M). Ramp1 has also been shown to be expressed on intestinal innate lymphoid cells (ILCs) (Nagashima et al., 2019; Wallrapp et al., 2019). However, ILC depletion had no effect on CGRP-induced goblet cell emptying (Fig. S3N–P). Therefore, CGRP is sufficient to induce mucus secretion from goblet cells in a Ramp1-dependent but ILC-independent manner.
Loss of nociceptors induces microbial dysbiosis and gut epithelial transcriptional changes
The colonic mucus barrier is critical for maintenance of gut microbial homeostasis (Paone and Cani, 2020). We found that Nav1.8DTA mice had a significantly different microbial composition in the colonic lumen and mucosa compared to control littermates, measured by Weighted Unifrac β-diversity analysis (Fig. 5A and S4A). Nav1.8DTA lumen communities contained higher abundance of Firmicutes (Bacillota) families Turibacteriaceae and Erysipelotrichaceae compared with controls. Nav1.8DTA mucosal communities displayed slightly lower levels of Bacteroidetes family S24–7 and Firmicutes family Ruminococcaceae compared with controls (Fig. 5B). Among the most abundant genera, Turicibacter (of Turicibacteriaceae family) and Allobaculum (of Erysipelotrichaceae family) were expanded in Nav1.8DTA luminal communities (Fig. 5C), while Nav1.8DTA mucosal communities exhibited lower abundance of S24–7 bacteria and Oscillospira sp. (of Ruminococcaceae family) (Fig. 5D). Turicibacter and Allobaculum could regulate gut inflammation, with the former enhancing colitis pathogenesis in aged mice and latter acting as a human intestinal mucus degrader (Liu et al., 2020; Shang et al., 2021; van Muijlwijk et al., 2021).
Figure 5. Nociceptor deficiency results in intestinal dysbiosis and epithelial stress.
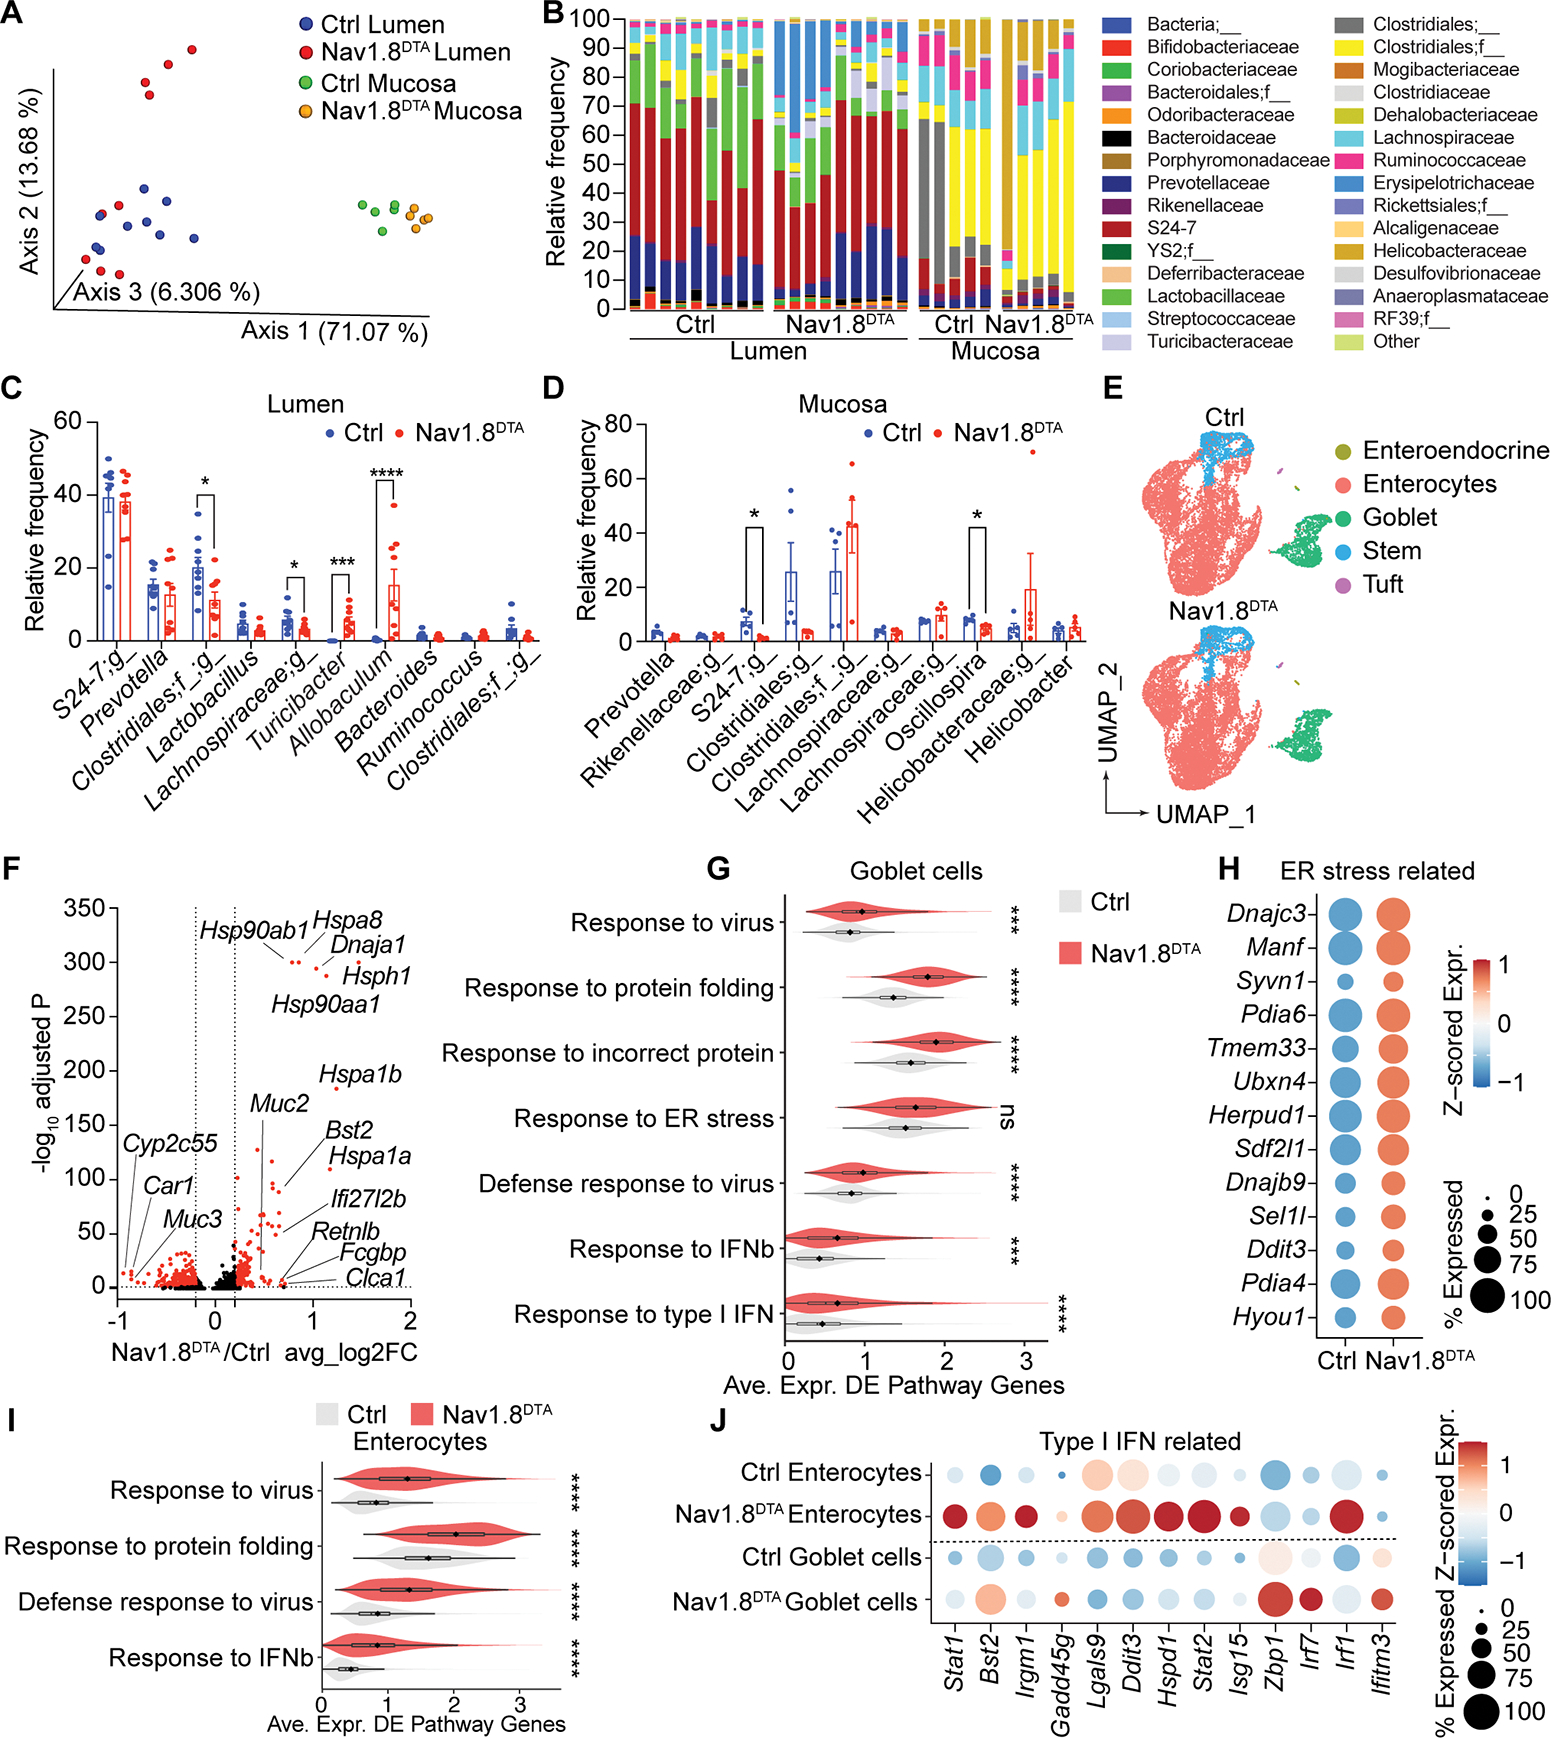
(A-D) Microbiome analysis: Principal coordinates analysis (PCoA) of weighted UniFrac distance measurements (A), and family-level (B) and genus-level (C-D) analysis of the microbiome in colonic lumen contents (Lumen) and mucosal scrapings (Mucosa) of Nav1.8DTA and control mice (n=5–9 mice/group).
(E) UMAP of scRNA-seq profiles of colonic epithelial cells from control (top) and Nav1.8DTA (bottom) mice.
(F) Volcano plot highlights 782 differentially expressed genes (DEGs; in red; |log2 fold change| >0.2, adj. P <0.05) in Nav1.8DTA versus control colonic goblet cells.
(G) Violin plots show distributions across colonic goblet cells in Nav1.8DTA and control mice. of the average expression of the DEGs, as in (F), that intersect with each of the indicated enriched pathways.
(H) Dot plot of average z-scored expression of ER stress-related genes in colonic goblet cells from Nav1.8DTA and control mice.
(I) Violin plot, analogous to G, for DEGs in enterocytes from Nav1.8DTA and control mice.
(J) Dot plot of average z-scored expression of Type I IFN-related genes in enterocytes and goblet cells from Nav1.8DTA and control mice. Multiple t-tests in C. Mann-Whitney test in G and I. ns=not significant. *p < .05, **p < .01, ***p < .001, ****p <.0001. See also Figure S4–5.
We hypothesized that loss of nociceptors could also lead to transcriptional changes in epithelial cells. We performed scRNA-seq analysis of ileal and colonic epithelial cells isolated from Nav1.8DTA mice compared to control littermates. While we found no major changes in cell-type composition (Fig. 5E and S4B), a comparison of colonic goblet cell transcriptional profiles from Nav1.8DTA mice and controls identified 782 differentially expressed genes (DEGs) (Fig. 5F). Gene set enrichment analysis using gene ontology (GO) indicated that goblet cells from Nav1.8DTA mice had increased responses to protein folding, endoplasmic reticulum (ER) stress, and antiviral immunity (Fig. 5G–H). We also observed significant transcriptional changes in enterocytes from Nav1.8DTA mice, with increased responses to protein folding and antiviral immunity (Fig. 5I). Goblet cells and enterocytes from Nav1.8DTA mice showed increased expression of antiviral and type I IFN-induced genes (Fig. 5J). We observed fewer transcriptional changes in ileal goblet cells (Fig. S4C).
In contrast with decreased mucus thicknesses observed in Nav1.8DTA mice, colonic goblet cells in these mice displayed slightly increased transcript levels for some mucus-related genes (Fig. S4D), which was supported at the protein level by a subtle but significantly increased mucin staining intensity within goblet cells (Fig. S4E–F). These results suggest that mucus layer defects in Nav1.8DTA mice are not due to transcriptional downregulation.
We next asked whether nociceptor ablation affects mucus protein composition. We performed mass spectrometry of colon mucus collected from Nav1.8DTA and littermate control mice. Analysis identified only 9 differentially expressed proteins between genotypes, mainly lipoproteins and extracellular matrix proteins (Fig. S4G). MUC2 and MUC13, the two major mucin subtypes captured in the proteomics analysis, showed similar levels in Nav1.8DTA and control mucus, consistent with transcript levels (Fig. S4G–I). Western blot confirmed similar protein levels of MUC2 in Nav1.8DTA and control mucus (Fig. S4J). These data support a role for nociceptors in regulation of mucus thickness and goblet cell emptying, but not of mucus protein composition.
We also aimed to understand how Ramp1 signaling impacts gut epithelial cell transcription by performing scRNA-seq analysis of colonic epithelial cells isolated from Ramp1Villin mice compared to controls. Loss of Ramp1 did not lead to overall changes in epithelial cell composition (Fig. S4K–L). We identified 302 DEGs in colonic goblet cells (Fig. S4M). GO enrichment analysis indicated that Ramp1Villin goblet cells had an enhanced cellular response to ER stress and incorrect protein folding (Fig. S4N, S5A), and enterocytes had an increased protein folding and anti-viral responses (Fig. S5B). We did not observe clear changes in mucus-related gene expression in Ramp1Villin colonic goblet cells compared to controls (Fig. S5C).
To highlight common aspects of the mouse models, we performed an intersectional analysis of both colonic scRNA-seq datasets and identified 108 common DEGs shared by Nav1.8DTA and Ramp1Villin goblet cells (Fig. S5D), with a positive enrichment in genes related to heat shock and protein folding and a negative enrichment in genes related to cholesterol metabolism by GO analysis (Fig. S5E–F). Enterocytes from both Nav1.8DTA and Ramp1Villin mice shared upregulation of cellular stress response pathways (Fig. S5G–H). Taken together, our results indicate that nociceptors maintain gut microbiota composition at homeostasis, and that loss of nociceptors or epithelial Ramp1 signaling leads to epithelial transcriptional changes that may reflect increased stress responses.
Nociceptors and CGRP-Ramp1 signaling regulate host protection against colitis
Despite loss of mucus, microbial dysbiosis, and epithelial changes in nociceptor-deficient mice, these mice displayed no changes at baseline in populations of lamina propria (LP) immune cells or intraepithelial lymphocytes (Fig. S6A–G), nor changes in colon length or histology (Fig. S6H–K). We hypothesized that these mice may be more susceptible to barrier damage. To test this, we treated Nav1.8DTA and control mice with Dextran Sodium Sulfate (DSS) to induce colitis. Pain is a major symptom of colitis. We measured visceromotor responses (VMR) induced by colorectal distension to detect visceral pain-like responses (Larauche et al., 2010). Control mice but not Nav1.8DTA mice showed increased VMR after DSS treatment (Fig. 6A).
Figure 6. Nociceptors and epithelial Ramp1 are necessary for host protection against intestinal colitis.
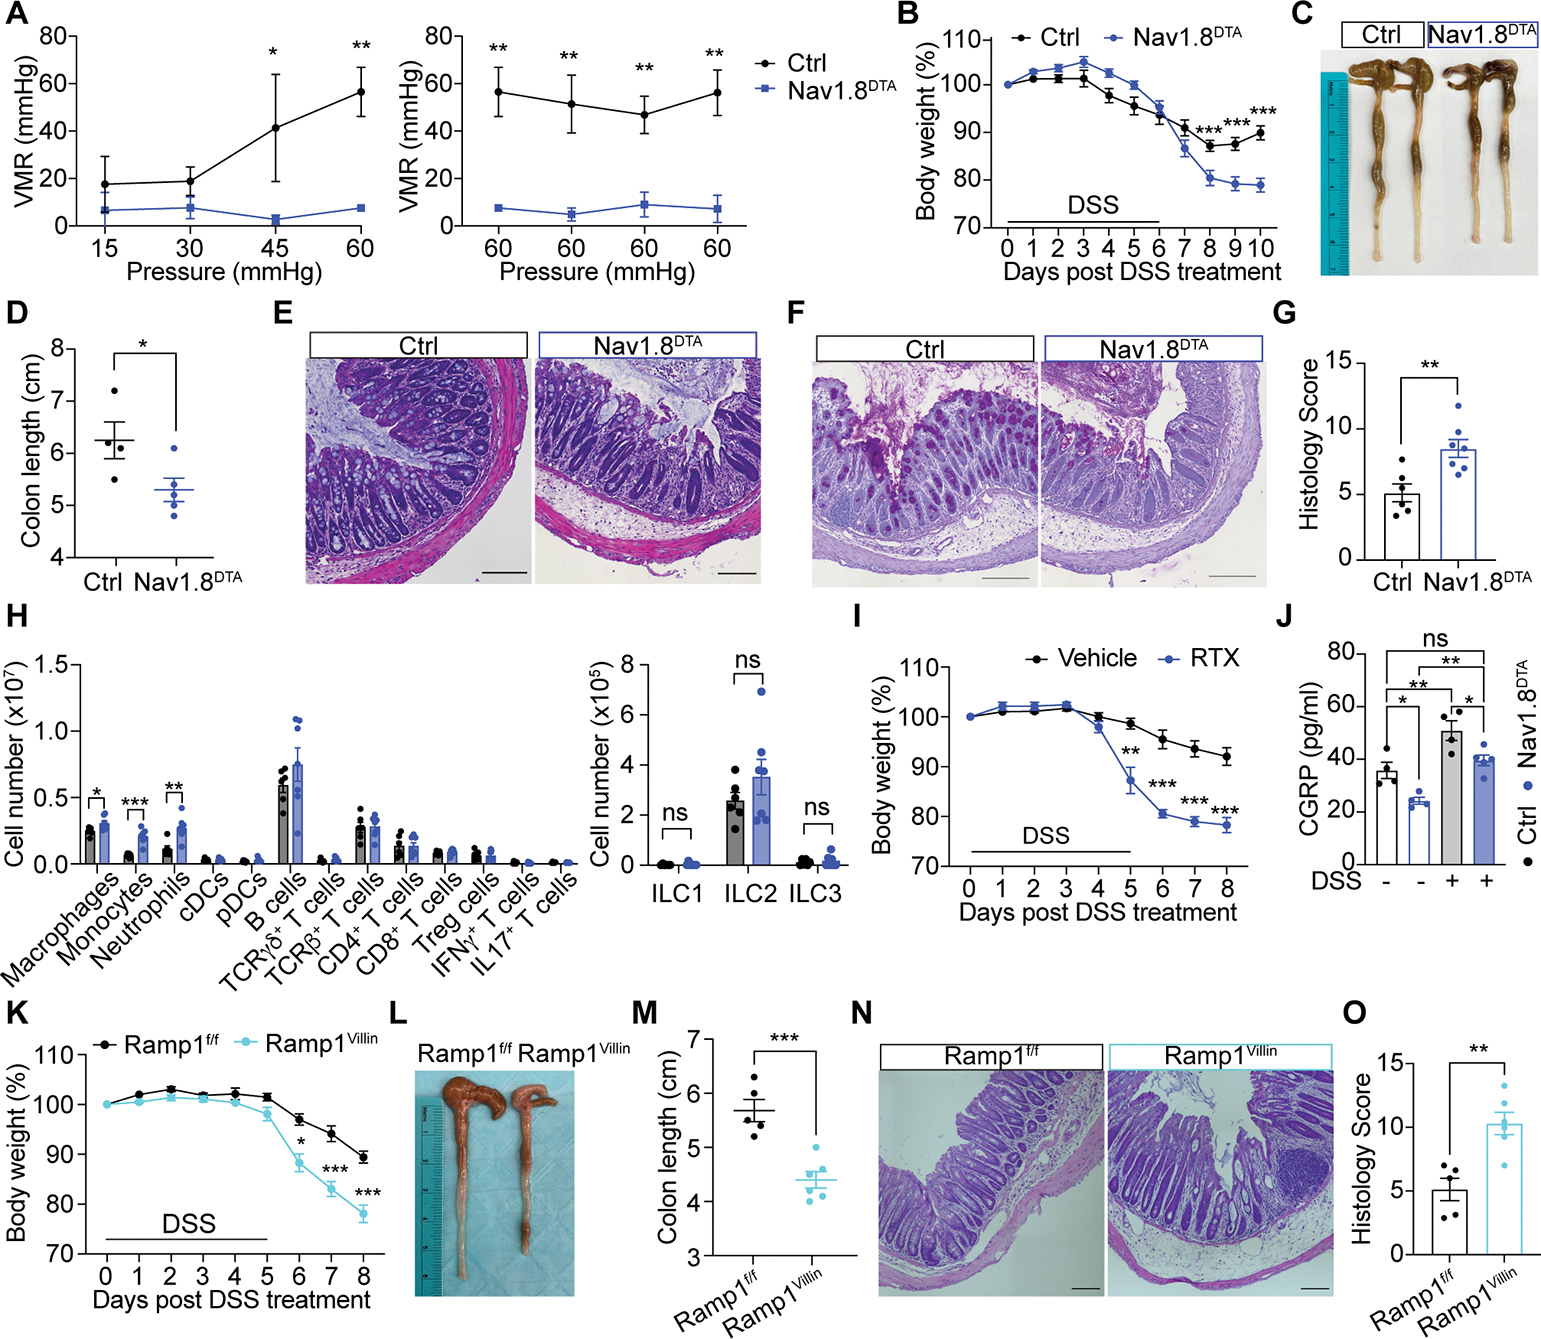
(A) Visceromotor responses (VMR) of Nav1.8DTA and control mice 8 days post DSS treatment (n=3 mice/group).
(B) Body weight of Nav1.8DTA and control mice after DSS treatment (n=9–10 mice/group).
(C-G) Representative colon image (C), colon length (D), H&E staining (E), AB/PAS staining (F), histology scoring per mouse (G) of mice in (B) on day 10 post DSS treatment. (4 areas/mouse, n=4–7 mice/group).
(H) Immune profiling of colonic lamina propria from mice in (B) on day 10 post DSS treatment (n=6–7 mice/group).
(I) Body weight of RTX- and vehicle-pretreated mice post DSS treatment (n=4 mice/group).
(J) Colon CGRP levels from Nav1.8DTA and control mice treated with or without DSS for 5 days (n=4 mice/group).
(K-O) Body weight (K), colon image (L), colon length (M), H&E staining (N), histology scores per mouse (O) of Ramp1Villin and Ramp1f/f mice 8 days post DSS treatment. (4 areas/mouse, n=5–6 mice/group).
Scale bar, 100 μm in E-F, N. Multiple t-test in A-B, H, I, K. Student’s test in D, G, M, O. One-way ANOVA in J. Mean±SEM. ns=not significant. *p < .05, **p < .01, ***p < .001. See also Figure S7.
Nav1.8DTA mice displayed significantly more severe colitis compared to control mice, indicated by greater body weight loss, shorter colon length, worse colonic structure disruption, increased penetration of immune cells and goblet cell loss, and higher histology scores after DSS treatment (Fig. 6B–G and S6L). We also observed a significant increase in LP macrophages, monocytes, and neutrophils in Nav1.8DTA mice (Fig. 6H and S6M). Nav1.8DTA mice and control mice consumed similar amounts of water throughout DSS treatment (Fig. S6N). RTX-treated mice, which lack TRPV1+ nociceptors, also showed increased body weight loss, shorter colon lengths, and increased histology scores compared to control mice after DSS treatment (Fig. 6I and S7A–D). These data indicate that nociceptors protect against pathology induced by DSS-induced colitis.
We observed increased colonic CGRP release after DSS treatment (Fig. 6J). DSS treatment also induced colonic CGRP release in Nav1.8DTA mice (Fig. 6J), indicating that Nav1.8+ nociceptors are not the sole source of CGRP release during DSS colitis. Further analyses revealed a protective role for epithelial Ramp1 during colitis, as Ramp1Villin mice displayed significantly greater body weight loss, shorter colon length, and increased histology scores (Fig. 6K–O and S7E–H). We observed a trend towards increased survival in Ramp1f/f mice compared to Ramp1Villin mice at higher concentrations of DSS treatment (Fig. S7F). Ramp1Villin and littermate control mice exhibited similar colon lengths at baseline (Fig. S7I–J).
To test the role of nociceptor activation during colitis, we treated Nav1.8hM3Dq and control mice simultaneously with DSS and CNO. Of note, Nav1.8hM3Dq mice drank less DSS-containing water during the first and fifth day of DSS treatment (Fig. S7K), which is a caveat that limits our interpretation of these data (see Limitations section). Nav1.8hM3Dq mice displayed less body weight loss, longer colon lengths, and lower histology scores compared with control mice (Fig. 7A–D and S7L–M), indicating a milder colitis pathogenesis. Nociceptor activation also changed the microbiome of Nav1.8hM3Dq mice compared with that of control mice after DSS and CNO treatment (Fig. S7N–P). Taken together, these data demonstrate a critical role for nociceptors and the CGRP-Ramp1 signaling axis in regulating host protection against colitis.
Figure 7. CGRP administration ameliorates intestinal colitis pathology.

(A-D) Body weight (A), colon length (B), colon image (C), H&E staining (D) of Nav1.8hM3Dq and control mice 8 days post DSS plus CNO (0.5μg/ml) treatment. (n=8–9 mice/group).
(E) Nav1.8DTA mice were s.c. implanted with osmotic pumps carrying either vehicle or CGRP. Control mice were s.c. implanted with osmotic pumps carrying vehicle. All mice were subjected to DSS treatment and sacrificed on day 8.
(F-J) Body weight (F), colon length (G), colon image (H), H&E staining (I), histology scores per mouse (J) of mice in (E) (4 areas/mouse, n=4 mice/group).
Scale bar, 200 μm in D, I. Multiple t-test in A, F. Student’s t-test in B. One-way ANOVA in G and J. Mean±SEM. ns=not significant. *p < .05, **p < .01, ***p < .001, ****p < .0001. See also Figure S7.
CGRP administration rescues nociceptor-ablated mice from colitis
Given that Nav1.8DTA mice have decreased intestinal CGRP and more severe colitis, we hypothesized that CGRP treatment could rescue the worsened pathogenesis present in Nav1.8DTA mice. Nav1.8DTA mice were subcutaneously implanted with an osmotic pump containing either CGRP or a vehicle control, facilitating continuous release of CGRP after transplantation. Following implantation, mice were treated with DSS (Fig. 7E). While vehicle-treated Nav1.8DTA mice exhibited worse immunopathology after DSS treatment compared to vehicle-treated control mice, CGRP-treated Nav1.8DTA mice showed significantly less immunopathology from DSS pathogenesis, indicated by less body weight loss, longer colon lengths, and lower histology scores (Fig. 7F–J and S7Q–R). Collectively, these data suggest that CGRP treatment is sufficient to rescue Nav1.8DTA mice from worsened intestinal colitis.
Discussion
The canonical function of nociceptor neurons is to detect harmful stimuli, mediating pain perception and avoidance behaviors. In this study, we identify a role for nociceptors in driving intestinal mucus release through neuron-goblet cell communication. Nociceptor activation leads to release of CGRP, which acts on Ramp1 on intestinal goblet cells to induce rapid mucus secretion. Nociceptors and Ramp1 are required to maintain the mucus layer and microbiome composition at homeostasis. In addition, the nociceptor-CGRP-Ramp1 signaling axis provides protection during intestinal colitis. Therefore, we highlight a critical role of nociceptor-goblet cell communication in gut barrier protection.
Mucin exocytosis is thought to rely on calcium signaling, and cAMP signaling mediates fluid secretion that accompanies mucus granule release (Lee and Foskett, 2014; Yang et al., 2013). CGRP-RAMP1 signaling is known to induce both cAMP increases and calcium influx in neurons (Hosokawa et al., 2010; Russell et al., 2014). The specific signaling pathways within goblet cells required for CGRP-dependent emptying remain to be fully determined.
The CGRP-Ramp1 goblet cell signaling axis described in our study may have relevance for other mucosal tissues including the respiratory tract. Nociceptor nerves are juxtaposed with lung epithelial cells, and optogenetic stimulation of vagal sensory neurons induces increased mucin transcription and release (Talbot et al., 2020b).
While neuroimmune circuitry is well-described in the gut (Cardoso et al., 2021; Gabanyi et al., 2016; Godinho-Silva et al., 2019; Muller et al., 2020; Seillet et al., 2019; Talbot et al., 2020a; Xu et al., 2019), less is known about how neurons and epithelial cells communicate. We previously found that gut-extrinsic nociceptors suppressed microfold (M) cells in small intestine Peyer’s Patches and maintained levels of segmented filamentous bacteria (SFB), thereby limiting Salmonella invasion (Lai et al., 2019). Given that SFB does not colonize the mouse colon (Farkas et al., 2015; Lai et al., 2019), nor are M cells present at baseline in the GI tract (Kimura et al., 2015), we do not expect changes in these factors to affect goblet cell mucus release described in this study. However, it is possible that mucus defects could be upstream of and contribute to the changes observed in our previous study.
Our study adds to the far-reaching role of CGRP in mucosal biology. CGRP regulates macrophages, neutrophils, and group 2 innate lymphoid cells (ILC2s) (Baral et al., 2019; Nagashima et al., 2019; Wallrapp et al., 2019). Our work reveals the broad impact of this neuropeptide on epithelial cells. While our study focuses on CGRP from sensory neurons, enteric neurons and ILC2s have also been shown to produce CGRP (Wallrapp et al., 2019; Xu et al., 2019). Questions remain as to whether these other cells can signal via CGRP to goblet cells.
Calcium influx is sufficient to induce CGRP release from nociceptors, whereas production of pain perception requires high threshold stimulation and action potential transduction to the CNS. We posit that at homeostasis gut microbe-derived factors stimulate nociceptors at a low-level, leading to homoeostatic CGRP release but not pain perception. However, in situations of barrier breach such as during colitis, increased stimuli further enhance nociceptor activation, leading to pain perception. Nociception coupled with mucus production may be a way for the gut to accelerate the removal of harmful substances.
Pain is a major symptom of inflammatory bowel diseases (Bielefeldt et al., 2009). However, acute pain and its accompanying release of CGRP may protect the gut barrier. We confirmed that eliminating nociceptors in DSS-induced colitis leads to worsening of pathology (Kawashima-Takeda et al., 2017; Utsumi et al., 2018), consistent with another study that CGRP and TRPV1 play a protective role during colitis (Engel et al., 2011). Given that pain treatments are often used to treat patients with colitis, it may be important to consider detrimental consequences of blocking pain. Anti-CGRP therapies are widely used to treat or prevent chronic migraine (Cohen et al., 2021). While these therapies are currently lauded as having minimal side effects (Vandervorst et al., 2021), our work reveals potential detrimental side effects in gut barrier tissues. Indeed, recent clinical studies show that anti-CGRP migraine therapeutics caused constipation in patients (Holzer and Holzer-Petsche, 2021). Overall, our findings demonstrate a nociceptor neuron-goblet cell axis that critically orchestrates gut barrier maintenance at homeostasis and protection during intestinal inflammation.
Limitations of Study
While our study indicates that nociceptors mediate mucus production and gut barrier protection, we cannot rule out CGRP-independent mechanisms as Nav1.8+ neurons express other neuropeptides (VIP, substance P) and mediators that could act on goblet cells. The Ramp1 antagonist BIBN4096 did not completely prevent CGRP-dependent goblet cell emptying. Therefore, CGRP may indirectly regulate mucus production via impacting non-goblet epithelial cells, immune or stromal cells that signal to goblet cells. Alternatively, nociceptor activation could regulate other branches of the nervous system (e.g. ChAT+ enteric or parasympathetic neurons), which release mediators (e.g. ACh) that impact goblet cell emptying. A limitation in our DSS colitis studies of Nav1.8hM3Dq mice was that we observed a difference in water consumption during DSS treatment such that Nav1.8hM3Dq mice consumed less water than controls. This limits the conclusions drawn, as activation of pain pathways in Nav1.8hM3Dq mice could have limited DSS intake through avoidance and contributed to the milder disease severity. Future approaches are needed to dissociate pain-induced avoidance behaviors from neuronal activation and epithelial changes.
Materials and Methods
STAR METHODS
RESOURCE AVAILABILITY
Lead Contact
Please direct requests for resources and reagents to Lead Contact, Isaac Chiu (Isaac_Chiu@hms.harvard.edu).
Materials Availability
This study did not generate new unique reagents.
DATA AND CODE AVAILABILITY
The accession number for the 16S sequencing data reported in this paper is: PRJNA803622. The accession numbers for the sc-RNA-seq data of intestinal epithelial cells reported in this paper are GSE208762 and GSE208594.
The code for mucus thickness quantification of ex vivo explant images can be found in the following repository: https://github.com/prajuvikas/Mucus_Quantification_v8_2022Jan. The code has only been tested on the images generated in this study, and optimization will be needed for other image analysis. Any additional information required to reanalyze the data reported in this work paper is available from the Lead Contact upon request.
Experimental Model and Subject Details
Mice
C57BL/6, B6.Rosa26-stop(flox)-DTA, Ai14 strain B6.Rosa26-stop(flox)-tdTomato, B6N;129-Tg(CAG-CHRM3*,-mCitrine)1Ute/J and Villin-Cre mice were purchased from Jackson Laboratories. Nav1.8-Cre mice were provided by J. Wood (University College London). Calca-GFP-DTR (McCoy et al., 2013) were provided by M. Zylka and E. McCoy (University of North Carolina). Calca−/− (Oh-hashi et al., 2001) mice were provided by V. Kuchroo (Harvard Medical School). Calcb−/− (Thompson et al., 2008) mice were provided by M. Rao (Boston Children’s Hospital). Germ-free mice were provided by J. Huh (HMS). Nav1.8-Cre+/+mice were crossed with B6.Rosa26-stop(flox)-tdTomato mice to generate Nav1.8-lineage neuron labeled mice (Nav1.8tdTomato) mice. For Nav1.8-lineage neuron depletion experiments, Nav1.8-Cre+/−mice were crossed with Rosa26-stop(flox)-DTA+/+ mice to generate Nav1.8-lineage neuron-depleted Nav1.8-Cre+/−; DTA+/− (Nav1.8DTA) mice and control Nav1.8-Cre−/−; DTA+/− (Ctrl) littermates. For gut epithelial cell specific Ramp1 depletion experiments, Villin-Cre+/− ;Ramp1fl/fl mice were bred to Ramp1fl/fl mice to generate mice with epithelial-specific depletion of Ramp1 in Villin-Cre+/− ;Ramp1fl/fl (Ramp1Villin) or control (Ramp1fl/fl) littermates. For Calca and Calcb deficient mouse experiments, heterozygous mice were bred together to produce wild-type and knockout littermates. For Nav1.8-lineage neuron activation experiments, Nav1.8-Cre+/−mice were crossed with B6N;129-Tg(CAG-CHRM3*,-mCitrine)1Ute/J mice to generate Nav1.8-lineage neuron activation DREDD Nav1.8-Cre+/−; hM3Dq+/− (Nav1.8hM3Dq) mice and control Nav1.8-Cre−/−; hM3Dq+/− (Ctrl) littermates. For Calca-lineage neuron activation experiments, Calca-Cre+/−mice were crossed with B6N;129-Tg(CAG-CHRM3*,-mCitrine)1Ute/J mice to generate CGRP-lineage neuron activation DREADD Calca-Cre+/−; hM3Dq+/− (CalcahM3Dq) mice and control Calca-Cre−/−; hM3Dq+/− (Ctrl) littermates.
Mice were bred and housed in a specific pathogen-free animal facility at Harvard Medical School (HMS). Age-matched 6- to 12-week-old littermate male and female mice were used for experiments. All animal experiments were approved by the HMS Institutional Animal Use and Care Committee.
Human intestinal tissue samples
Healthy human transverse colon biopsy tissue was obtained from a 20 year old female patient and human splenic flexure biopsy tissue was obtained from a 10 year old male patient, respectively, during diagnostic colonoscopy as part of routine clinical care under approved Boston Children’s Hospital Institutional Review Board Protocol P00027983. Biopsy samples were fixed in 10% Neutral Buffered Formalin, embedded in paraffin, and cut into 5–7μm sections for staining.
Method Details
DRG Isolation and culture
Mice were euthanized and DRGs were dissected and dissociated as previously described (Pinho-Ribeiro et al., 2018). DRG neurons were plated on laminin pre-coated 35mm culture dishes (2,000 cells/dish) in 50 ng/ml NGF in neurobasal media (ThermoFisher) and used for calcium imaging 24–48h after plating. For calcium imaging, cells were pre-loaded with Fura2-AM (5mM) in neurobasal media at 37 °C for 30min. Cells were washed twice and imaged in 2 ml Krebs buffer (Krebs-Ringer solution). After the addition of stimuli described below, images were acquired with alternating 340/380 nm excitation wavelengths, and fluorescence emission was captured using a Nikon Eclipse Ti inverted microscope. Ratio metric analysis of 340/380 signal intensities were processed, background corrected, and analyzed with NIS-elements software (Nikon) by drawing regions of interest (ROIs) around individual cells. Responses were measured as ΔF/F0 = [(F − F0)/F0], where F is the peak fluorescence signal and F0 is the mean fluorescence signal at baseline. Peak responses were included in the analysis if the response was 5 SDs above baseline. The percentage of responsive cells was quantified and plotted for the stimulus in question as a percentage of total (KCl responsive) neurons.
For fecal supernatant induced neuron activation, DRGs from wildtype B6 mice were cultured as above. Two fecal pellets from SPF or GF mice were collected, mashed, and resuspended in 1 ml Krebs-Ringer buffer. After filtering with a 70 μm cell strainer, the fecal mixture was centrifuged at 12000g for 10 minutes at 4 °C and the supernatant was collected for cell stimulation. After 10 min. of fecal supernatant or vehicle treatment, 1 μM capsaicin (Tocris) and 40 mM KCl (Sigma) were applied sequentially to identify TRPV1+ and live neurons, respectively. For Nav1.8+ neuron activation, DRGs from Nav1.8hM3Dq and control mice were cultured as above. Krebs-Ringer solution (vehicle), 0.1nM CNO or 1nM CNO was applied for 2 minutes. After vehicle or CNO application, 1 μM capsaicin and 40 mM KCl were applied sequentially to identify neuron activation as a percentage of live neurons.
CGRP release of DRG neuron cultures, colonic explants, and serum
DRG neurons were cultured as described above in a 96 well plate (5,000 cells per well) for one week. Media was aspirated and replaced with 200 μl fresh neurobasal media prior to stimulation. DRG neurons from wildtype B6 mice were stimulated with 1 μl fecal supernatant or 1 μM capsaicin for 1 hour at 37 °C with 5% CO2. DRG neurons from Nav1.8hM3Dq and control mice were stimulated with 1 nM CNO or vehicle for 1 hour at 37 °C with 5% CO2. 100 μl culture supernatant was collected for CGRP concentration measurement using a CGRP EIA Kit (Cayman Chemicals). For CGRP release from colonic explants, distal colons (3 cm each) from SPF, GF, SPF fecal-transplanted GF mice pre-treated with or without resiniferatoxin (RTX), and antibiotic-treated and untreated Nav1.8DTA and control mice were dissected and transferred into 24 well plate containing 500 μl DMEM. Explants were incubated for 1 hour at 32 °C with gentle shaking at 150 rpm. 100 μl explant culture supernatant was collected for CGRP concentration measurement using a CGRP EIA Kit (Cayman Chemicals). For antibiotic treatment, mice were treated with a cocktail of ampicillin (1 mg/ml), vancomycin (0.5 mg/ml), metronidazole (1 mg/ml), and neomycin (1 mg/ml) in the drinking water for three weeks.
For CGRP release in serum, blood was collected from naïve Nav1.8DTA and control mice, and CNO-treated CalcahM3Dq and control mice and centrifuged at 3000 rpm for 10 min. after coagulation. 50 μl serum was collected for CGRP concentration measurement using a CGRP EIA Kit (Cayman Chemicals).
3D Colonoid and 2D primary epithelial cell culture
Colonic organoids were derived from isolated crypts collected from the large intestine of wildtype C57BL/6J mice as previously described (Sato et al., 2011). Approximately 500 crypts were plated in a 50 μl drop of Matrigel in 24-well plates and overlaid with 500 μl of WENR medium, containing basal crypt media (Advanced DMEM/F12, penicillin/streptomycin, 10 mM HEPES, 2 mM Glutamine), supplemented with 1× B27 (Gibco, 17504–044), 1× N2 (Gibco,17502–048), 50 ng/ml rmEGF (Peprotech, 315–09), 50% L-WRN-CM (conditioned medium) (v/v), 10 μM Rock inhibitor Y-27632 (Sigma, Y0503), 3 μM CHIR99021 (Sigma, SML1046) with a final FBS concentration of 10%. Media was changed every 2 days and colonoids were split every 4 days. Cultures were passaged three times prior to experiments. For 2D monolayer cultures, colonoids were extracted from Matrigel with organoid harvesting solution (R&D system, 3700–100-01), and then digested with undiluted TripLE (Life Technologies, 1265010). Colonoid fragments were suspended in WENR medium and plated on collagen-coated (Sigma, C5533) 35mm glass bottom dishes (Cellvis, D35–20-1.5-N). To enrich primary epithelial cultures toward goblet cells, 12h after seeding, the media was changed into secretory cell differentiation medium containing basal crypt media (Advanced DMEM/F12, penicillin/streptomycin, 10 mM HEPES, 2 mM Glutamine), supplemented with 1× B27 (Gibco, 17504–044), 1× N2 (Gibco,17502–048), 50 ng/ml rmEGF (Peprotech, 315–09), 100ng/ml Noggin (Peprotech 250–38), 10% R-spondin1-CM (conditioned medium) (v/v), 10 μM g-Secretase Inhibitor DAPT (Sigma, D5942), 2 μM Wnt pathway inhibitor IWP-2 (Sigma, I0536) with a final FBS concentration of 10%. Media was changed on day 2 and differentiated cell monolayers were ready for experiments on day 4.
For granule release measurements, the cultured cells were preloaded with 10 mM Acridine Orange (AO) for 10 minutes and then treated with vehicle, CGRP (100ng/ml), or Carbachol (1μM) for 15 minutes and imaged in real-time on a widefield microscope (Thunder 3D Cell Culture, Leica) at 20X every 5 minutes. 2–5 areas from each dish were imaged and each area contained 100–200 cells. The total area of granules per cell was measured using FIJI. For intracellular MUC2 staining, the cultured cells were treated with vehicle, CGRP (100ng/ml), or Carbachol (1μM) for 15 minutes, and then fixed with 4% PFA, permeabilized with 0.1% Triton X-100 and stained for MUC2 as described below. The stained cells were imaged using a confocal microscopy at 63X and the intensity of MUC2 per cell were analyzed in FIJI.
Immunostaining of mucin
In vivo mucus layer thickness analysis was performed as described (Johansson and Hansson, 2012). Briefly, mice were euthanized and tissue from the distal ⅓ of the colon with fecal pellets was removed and fixed for 24–48h in methanol-Carnoy’s fixative at room temperature. Tissues were processed and paraffin-embedded without exposure to water to maintain mucus layer structure and integrity. 5 μm tissue cross-sections were heated at 60 °C for 10 min prior to incubation in xylene twice for 10 min, and then rehydrated with decreasing concentrations of ethanol (100, 95, 70, 50 and 30%) for 5 min each at room temperature. Antigen retrieval was performed by steaming samples in antigen retrieval solution (10 mM citric buffer, pH 6.0) for 15min and leaving samples in warm solution for an additional 20min. Samples were washed in PBS and blocked with 5% FBS in PBS for 30 minutes at 4 °C. Samples were stained for the mucus layer using an anti-MUC2 primary antibody and fluorescent secondary antibody. For FISH staining, sections were stained overnight at 50 °C with either 1 μg/ml nonsense control or eubacterial probe in hybridization buffer (20 mM Tris-HCl pH 7.4, 0.9M NaCl, 0.1% SDS, 0.5% formamide). Slides were incubated in FISH washing buffer (20 mM Tris-HCl pH 7.4, 0.9 M NaCl) at 50 °C for 10 mins, and then washed 3 times in PBS at room temperature. Samples were stained with DAPI, mounted with Prolong Antifade mounting medium, and sealed prior to imaging. Sections were imaged on a widefield microscope and mucus layer thickness was measured using FIJI. At least 20 measurements per tissue cross-section from at least 3 cross-sections were collected to determine average mouse mucus thickness measurements. Analysis was blinded.
Immunostaining of goblet cells
For microscopy analysis of goblet cell numbers and goblet cell maturation, mice were euthanized and ileum or distal colon pieces without fecal content were collected and fixed in either 4% PFA or methanol-Carnoy’s fixative for at least 24 hours at room temperature. Tissues were processed, paraffin-embedded, and cut into 5 μm sections. Tissue sections were processed as above for mucus layer analysis, blocked for 2 hours with 2% normal donkey serum, stained for MUC2 using an anti-MUC2 primary antibody and a fluorescent-conjugated secondary antibody. For goblet cell maturation staining, sections were additionally stained with fluorescent-conjugated UEA-1 (1μg/ml) during the secondary antibody staining. Samples were washed in PBS, stained with DAPI, and mounted prior to imaging. Sections were imaged on a confocal microscope and goblet cells per crypt were counted using FIJI. At least 10 full crypts were measured per to determine goblet cell numbers and maturation. Analysis was blinded.
H&E and AB/PAS staining analysis
For Ramp1 signaling blockade in vivo, the CalcahM3Dq and control mice were pretreated with either vehicle or BIBN4096 (0.3 mg/kg) by i.p. injection for 30 minutes. 10 minutes prior to euthanization, mice were treated with CNO (1 mg/kg) by i.p. injection. For CGRP injection, mice were treated with CGRP (10 μg/mouse) by i.p. injection for 10 minutes. Mice were euthanized and colon tissues were collected and fixed in 4% PFA for at least 24 hours prior to H&E (hematoxylin and eosin) and AB/PAS (Alcian blue/Periodic acid-Schiff) staining. Whole cross sections were scanned and imaged on a widefield microscope at 20X.
For H&E staining, images were analyzed using a scoring system as previously described (Koelink et al., 2018). Briefly, cross-sections were randomly split into 8 sections and 4 random sections were scored qualitatively using a 0–3 point scale for infiltrate, goblet cell loss, crypt density, crypt hyperplasia, muscle thickening, submucosal infiltrate, ulceration, and abscess. Scores from each item were combined for a composite score for each mouse. Scores from each section were averaged for each mouse. Scoring was performed blinded.
For AB/PAS staining intensity analysis, images were loaded into FIJI. After color deconvolution, Periodic acid-Schiff staining was converted to Lut-Grey-scale, inverted, and intensity measurement made. Goblet cell mucus content was determined by measuring the intensity of PAS signal in an individual full crypt in at least 20 crypts per section. Analysis was blinded.
RNAscope
For mouse Muc2 and Ramp1 RNAscope staining, ileums and colons were collected, embedded in OCT and frozen. 14μm sections were fixed with 4% PFA at 4 °C for 15 min and stained for Muc2 and Ramp1 using the RNAscope Multiplex Fluorescent Detection Kit (Advanced Cell Diagnostics) following the manufacturer’s instructions. Entire sections were imaged using a confocal microscopy at 20X and images were analyzed in FIJI.
For human MUC2 and RAMP1 RNAscope staining, 5 μm paraffin-embedded sections were deparaffinized, treated with hydrogen peroxide for 10 minutes, and boiled in RNAscope Target retrieval buffer for 15 minutes. The sections were then stained for MUC2 and RAMP1 using RNAscope Multiplex Fluorescent Assay v2 (Advanced Cell Diagnostics) following the manufacturer’s instructions. Entire sections were imaged using a confocal microscopy at 20X and images were analyzed in FIJI.
Ex vivo mucus analysis
Colon tissues were collected for explant culture and mucus imaging as previously described (Gustafsson et al., 2012). Briefly, the distal colon was collected, flushed with ice-cold oxygenated Kreb’s buffer and opened along the mesenteric border. After removal of the longitudinal muscle layer, the explant was mounted in a custom-made imaging perfusion chamber (https://github.com/mdanderson03/mucus_explant) where the apical chamber filled with Kreb’s buffer containing D-mannitol (10 mM) and the basolateral chamber was perfused with Kreb’s buffer containing D-glucose (10 mM) plus Celltrace Calcein Violet (Thermo Fisher) at a rate of 2 ml/min. 10 μl 1-μm-diameter fluorescent beads were gently added to the apical surface. The beads and explants were imaged in XY stacks (550 μm × 550 μm) using a Stellaris 8 FALCON CFS microscope (Leica) at a step size of 10 μm. Consistent with published studies, our approach relies on flushing the intestinal lumen prior to explant preparation, leading to removal of looser luminal mucus in our studies.
For CGRP-induced mucus growth analysis, the basal mucus layer on the explant surface was gently removed by cotton swabs under a dissection scope before mounting into the chamber. CGRP (100 ng/ml) was added into perfusion buffer, and the mucus growth was recorded for 30 minutes. 3~5 fields from each explant were captured for the following analysis.
The relative distribution of beads to colonic explant surface was measured in ImageJ (https://github.com/prajuvikas/Mucus_Quantification_v8_2022Jan) for mucus thickness analysis. Briefly, the distances of the lowest beads to the surface of explant after tissue smoothening were measured. The mucus thickness of each field was measured by the mode distance of the lowest beads (see Video S1).
Whole mount immunostaining
Mice were euthanized and perfused with 30 ml PBS, and distal colons and distal ileums were collected for staining. Colons with intact mesenteric nerves were dissected for immunostaining of extrinsic innervation. The intestines were opened and fixed in a Silgard dish with 4% PFA at 4°C overnight. After blocking, tissues were dissected into small pieces (3 mm ×3 mm) and incubated with primary antibody (rabbit anti-MUC2, 1:500; rat anti-EpCAM, 1:500; rabbit anti-CGRP, 1:500; goat anti-mCherry, 1:500; chicken anti-GFP, 1:500; rabbit anti-Tyrosine Hydroxylase, 1:500; UEA-1, 1:1000) in PBST (1% Triton-X100/PBS) for 3 days followed by secondary antibody staining in PBST for 2 days. After dehydration with serial (50%, 80%, 100%) methanol solution and clearing in BABB buffer (1 volume Benzyl Alcohol to 2 volume Benzyl Benzoate), the pieces were mounted on glass slides using vacuum grease for imaging. Three different fields of each tissue were imaged with a 1 μm z-stack step size and 3D image was built in Stellaris 8 FALCON CFS system (Leica).
Intestinal epithelial cell and immune cell isolation
Intestinal epithelial cells were isolated as previously described (Jarret et al., 2020). Briefly, distal colon and distal ileum were collected from euthanized mice and flushed with ice cold PBS. Colons and ileums were cut into 0.5cm pieces and incubated on ice for 5 min in 10 mL of PBS containing 5 mM EDTA and 1 mM DTT. After shaking, the intestinal pieces were incubated at 37 °C for 10 minutes in PBS containing 5 mM EDTA and 2% FBS. After vigorous shaking, the wash containing crypts was collected. This step was performed three times in total for colonic pieces and two times for ileal pieces with the epithelial fraction collected at the end of each wash. The crypt cells were pelleted and digested with 10 ml HBSS containing 8 mg Dispase II (Sigma) for 10 minutes at 37 °C. Single epithelial cells were collected in PBS containing 2% FBS for flow cytometry staining. For lamina propria immune cell isolation, colonic pieces after removal of crypts as described above were digested in 10 mL of RPMI containing 2% FBS, 1 mg/ml Collagenase VIII (Sigma) and 100 U/ml DNase I (Sigma) for approximately 60 min at 37 °C with shaking. The digested tissue was filtered by a 40 μm strainer and subjected to Percoll (GE) separation using an 80% and 40% gradient. Immune cells were harvested from the interphase of the Percoll gradient after a spin at 2500 rpm for 20 min at 4 °C. Cells were resuspended in PBS containing 2% FBS for flow cytometry staining.
For intraepithelial lymphocytes (IELs) isolation, the wash containing crypts and IELs as described above was pelleted and subjected to Percoll gradient. IELs were collected from the interphase after centrifuge. Cells were resuspended in PBS containing 2% FBS for flow cytometry staining.
Flow cytometry
Cells isolated above were stained with surface antibody at 1:250 on ice for 20 minutes in flow buffer (2% FBS, 2 mM EDTA in PBS) and washed twice with flow buffer. For intracellular staining (mouse anti-IL17A PE, mouse anti-IFN gamma APC or rabbit anti-MUC2), cells were permeabilized and stained using a Fixation/Permeabilization kit (BD) according to the manufacturer’s instructions. For transcription factor staining (mouse anti-FOXP3 Alexa Fluor 488, mouse anti-RORgt APC, mouse anti-GATA3 PE), a Transcription factor staining buffer set (eBioscience) was used according to the manufacturer’s instructions. Data were acquired on a Cytoflex S flow cytometer (Beckman Coulter) and analyzed in Flowjo v10. Single epithelial cells (CD45−EpCAM+) were sorted by FACSAria (BD) and resuspended HBSS containing 0.01% BSA (Ambion #AM2616) for downstream single cell sequencing.
ILC depletion
ILCs were depleted as previously reported (Sonnenberg et al., 2012). Briefly, mice were treated twice with anti-CD90.2 mAb (BioXCell) every three days at a dose of 300 μg/mouse and used for the following experiments one week after injection.
10X scRNA-seq of colon
scRNA-seq of colonic epithelial cells isolated from Nav1.8DTA, Ramp1Villin and littermate control mice was performed using 10x Genomics Chromium Next GEM Single Cell 3’ Reagent Kit v3.1 (10X genomics) following the user guide. Briefly, cells were counted on the LUNA-FX7 Automated Cell Counter (Logos Biosystems) using fluorescence detection for viability with an acridine orange/propidium iodide stain (Logos Biosystems). All samples had viability greater than 88% with concentration ranges from ~700–900 cells/μL. After counting, all samples were loaded into Chip G per the user guide from 10x Genomics. GEMs (Gel Beads-in-emulsions) were formed targeting 10,000 cells for each sample followed by immediate reverse transcription. The cDNA was cleaned from the GEM reagents, amplified for a total of 11 cycles and verified via TapeStation (Agilent Technologies). Amplified cDNA was diluted 1:6 and run on the 4200 TapeStation instrument using High Sensitivity D5000 tape and reagents (Agilent Technologies). The amplified cDNA was fragmented, end repaired, and A-tailed followed by adaptor ligation, and PCR amplification was run for a total of 11 cycles with each sample receiving a unique set of dual indices. Final libraries were diluted 1:10 and ran using the High Sensitivity D5000 tape and reagents on the 4200 TapeStation (Agilent Technologies). Libraries were quantified via Kapa qPCR using the Complete Universal Kit (Roche Sequencing Solutions) and the CFX96 Touch Real-Time PCR Detection System (Bio-Rad Laboratories). Libraries were sequenced on an Illumina NovaSeq S4 flow cell across one single lane (estimated reads per cell ~55,000) using the parameters outlined in the user guide (Read1: 28 bp, i7 index: 10 bp, i5 index: 10 bp, Read2: 90 bp). After sequencing, Cell Ranger count QC summary report identified between 12,000–14,000 single cells in the samples.
inDrops scRNA-seq of ileum
scRNA-seq of ileal epithelial cells isolated from Nav1.8DTA (three mice pooled together) and their littermate control (three mice pooled together) mice was performed using inDrops single cell sequencing following the user guide. Briefly, cells were encapsulated in droplets following a previously described protocol (Klein et al., 2015; Zilionis et al., 2017), with the following modifications in the primer sequences. RT primers on hydrogel beads-5’CGATTGATCAACGTAATACGACTCACTATAGGGTGTCGGGTGCAG [bc1,8nt] GTCTCGTGGGCTCGGAGATGTGTATAAGAGACAG[bc2,8nt]NNNNNNTTTTTTTTTTTTTTTTTTTV- 3’ PCR primer sequences (steps 157 and 160 in the library prep protocol in (Zilionis et al., 2017))-5’-AATGATACGGCGACCACCGAGATCTACACXXXXXXXXTCGTCGGCAGCGTC-3’, where XXXXXX is an index sequence for multiplexing libraries. 5’- CAAGCAGAAGACGGCATACGAGATGGGTGTCGGGTGCAG-3’ With these modifications in the primer sequences, custom sequencing primers are no longer required. The library prep protocol used here was based on Smart-seq2 (Picelli et al., 2014) with modifications. The workflow of the library preparation can be summarized as follows: Reverse transcription with Maxima H minus RTase at 50°C for 60 min -> cleanup with SILANE beads -> template switching reaction with Maxima H minus RTase -> SPRI purification -> cDNA amplification -> SPRI purification -> DNA fragmentation, end repair and A-tailing -> adapter ligation -> SPRI purification -> library enrichment PCR -> double-sided SPRI purification. Referring to the detailed protocol in (Picelli et al., 2014), the following modifications were made to the protocol: Reverse transcription and template-switching were decoupled, where reverse transcription occurred within the droplet, while template-switching was not. cDNA was fragmented enzymatically here followed by adapter ligation, as opposed to tagmentation in (Picelli et al., 2014). Sequence of the adapters are as follows- 5’-CTGTCTCTTATACACATCTGACGCTGCCGACGA- 3’ (with 5’ phosphorylation) 5’-AGATGTGTATAAGAGACAG*T- 3’ (with phosphorothioate bond on the 3’ terminal nucleotide). The barcoded library was sequenced as described above.
TRPV1 nociceptor neuron ablation
Systemic nociceptor neuron was ablated as previously described (Lai et al., 2019). Briefly, 4-week-old C57BL/6 mice were anesthetized with isoflurane and injected subcutaneously in the flank with escalating doses (30, 70, 100 μg/kg on consecutive days) of resiniferatoxin (RTX, Alomone Lab) or vehicle (2% DMSO/0.15% Tween-80/PBS). Mice were allowed to rest for 4 weeks before experiments. Loss of nociceptor neurons was confirmed by reduced thermal responses to noxious heat during hot plate tests (55 °C).
DSS induced colitis
Briefly, 6- to 12- week-old gender-matched mice were given dextran sodium sulfate (DSS) (MP Biomedicals) in drinking water for the indicated days, followed with regular water. All mice were treated with 3.5% DSS, with exception of Ramp1Villin and their littermate control mice which were treated with 2.5% (Fig. 6K–O, Fig. S7G–H) and 3.5% DSS (Fig. S7E–F). The mice were weighed daily and sacrificed on the indicated time points. Colon tissues were obtained for histopathological analysis.
Gut permeability assay
A gut permeability assay was performed as previously described (Nalle et al., 2019). Briefly, mice were fasted for 3 hours before oral gavage of 600 mg/kg FITC–4-kDa dextran (Sigma). Serum was collected 4 hours after gavage and analyzed using a Synergy HT plate reader (Bio-Tek) with 485 nm excitation and 528 nm emission.
Osmotic pump implantation
Mice were anesthetized by isoflurane and the skin between the scapulae was shaved. A small incision (0.5 cm in length) was made in the skin between the scapulae, and a small pocket was formed by spreading the subcutaneous connective tissue apart using a forceps. The osmotic pump (Alzet) filled with CGRP (10 μg/day) or vehicle was inserted into the pocket. Following implantation, the skin incision was closed with surgical glue.
Visceromotor response (VMR) assay
Visceral pain was measured by visceromotor response to colorectal distension (CRD) as previously described (Larauche et al., 2010). Briefly, a miniaturized pressure sensor and a custom-made balloon (1 cm × 2 cm) was tied together with a pressure transducer catheter (825–0101 Mikro-Cath; Millar Instruments) to form a “balloon-pressure sensor”. After calibration under certain pressures and lubrication, the “balloon-pressure sensor” was inserted into the colorectum of anesthetized mice placed in a mouse restrainer. Three rounds of serial pressures (15, 30, 45, and 60 mmHg, 10 s duration, 4 min interval) was administered to each mouse followed by three repeated noxious colorectal distensions at 60 mmHg (10 s duration, 4 min interval) using a barostat (Distender Series IIR; G&J Electronics Inc), and voltage output was then converted to pressure using the digital analog convertor (Micro 3–1401; Cambridge Electronic Design) and Spike 2 software (CED, Ltd.). The VMR was calculated by the increase of intraluminal colonic pressure in response to CRD in Spike 2.
16S rDNA sequencing and data analysis
To analyze the microbiome of colon lumen contents, 2–3 colon pellets from each mouse were collected and frozen at −20 °C until use. To collect colonic mucosal scrapings, colons were longitudinally opened in a sterile dish and scraped with 1 ml PBS. Bacterial genomic DNA from frozen stool samples was extracted using QIAamp DNA Stool Mini Kit (QIAGEN). Purified DNA was quantified by Qubit dsDNA HS Assay (Thermo Fisher Cat# Q32854) and normalized. Amplicons were purified and quantified by Qubit dsDNA HS Assay and combined with equal mass to make a pooled library. The pooled library was multiplexed sequenced (Illumina MiSeq, 251 nt × 2 pair-end reads with 12 nt index reads) through the Harvard Biopolymer’s Facility. Raw sequencing data were processed with QIIME2. In brief, raw sequencing data were imported to QIIME2 and demultiplexed, then DADA2 was used for sequence quality control and feature table construction. The feature table was used for beta diversity analysis, taxonomic analysis, and differential abundance testing using QIIME2. Beta group significance was determined by permutational analysis of variance (PERMANOVA). Identification of taxa associated with different groups was determined using Analysis of Composition of Microbiomes (ANCOM).
Western blot of MUC2
Mucus samples were collected by scraping as described above. After quantification by BCA protein assay (Thermo Scientific cat#23227), equal amounts of protein were enriched by methanol and chloroform precipitation and resuspended with 1X Laemmli buffer (Bio-Rad) followed by incubation on a 95° heat block for 10 minutes. Samples were loaded on Bolt 4–12% Bis-Tris-Plus gels (Thermo Scientific cat# NW04125BOX), and gels were transferred to nitrocellulose iBlot 2 membranes (Fisher Scientific cat# IB23001), blocked with 5% Pierce Clear Milk Blocking Buffer (Thermo Scientific cat# 37587) for 30 minutes, washed 3x with TBST (TBS, 0.05% Tween-20), and incubated in blocking buffer containing MUC2 antibody (1:500) at 4° overnight. After washing 3x with TBST for 10 min, membranes were incubated with IR-fluorophore conjugated secondary antibody (LI-COR Biosciences cat# 926–32213) for 1h at RT, followed by three additional 10 min washes with TBST and imaged on a Li-COR imaging system.
QUANTIFICATION AND STATISTICAL ANALYSIS
For all quantifications, the exact value of n is described in detail in the Figure legends, where n indicates biological replicates, either number of mice, number of wells containing cells or number of areas containing cells. For all microscopy analysis, images were blinded prior to scoring and quantification. All statistical analyses were performed using Microsoft Excel and GraphPad Prism software. Data were represented as mean ± standard error (SEM) throughout the Figures and the level of significance was indicated by asterisks for the following corresponding p-values: *p < .05, **p < .01, ***p <.001, ****p < .0001. The specific statistical test used to for each experiment is described in detail in the Figure legends. For comparisons between two groups, we performed student’s two-sided t-tests, except for non-parametric analysis of mucus thickness per measurement, where we utilized Mann-Whitney tests. For comparisons that have more than two groups or two conditions, One-way ANOVA and Two-way ANOVA were utilized. Multiple t-tests were used to determine the significance of water consumption and body weight analysis. For survival data, Log-rank test was used. No specific methods were utilized to determine whether data met assumptions of specific statistical approaches. Sample sizes for all experiments were chosen according to standard practice in the field.
Single-cell RNA-seq data analysis
Quality control & normalization of scRNA-seq data
The unique molecular identifier (UMI) count matrices obtained from the Cell Ranger output were imported into R (v.4.0.3) and processed with the R package Seurat (v. 4.1.0) (Hao et al., 2021). Low-quality cells were removed based on the following criteria. (i) Cells with relatively high mitochondrial percentage were removed. For the colonic epithelial cell data (i.e., Nav1.8DTA, Ramp1Villin), all the cells with mitochondrial reads > 25% were excluded. For the Ileum data (Nav1.8DTA), all the cells with mitochondrial reads > 10% were removed. (ii) The thresholds for acceptable numbers of detected genes and UMIs per cell were determined by outliers in the joint distribution of unique UMIs and detected genes across cells. For the Nav1.8DTA colon data, cells with < 1200 or > 7400 detected genes were discarded. For the Ramp1Villin colon data, cells with < 3000 or >7500 detected genes were discarded. For the ileum data, cells with < 500 or > 3000 detected genes were discarded. For the Nav1.8DTA colon data, cells with < 4000 or > 70000 detected UMIs were discarded. For the Ramp1Villin colon data, cells with < 14000 or > 50000 detected UMIs were discarded. For the Ileum data, cells with < 650 or > 9500 detected UMIs were discarded. To account for differences in sequencing depth across cells, UMI counts were normalized and scaled using regularized negative binomial regression via Seurat’s sctransform() function (Hafemeister and Satija, 2019). In the case of the Ileum data, the batch effect for the three replicates was removed using the “vars.to.regress” argument as part of the sctransform() function. The resulting corrected counts were used for visualization and clustering downstream analysis.
Clustering and identification of cell type markers
We performed principal component analysis (PCA) using the top 3000 highly variable genes. The top 15 principal components for each dataset were used to construct a shared nearest neighbor (SNN) graph and modularity-based clustering using the Louvain algorithm and a cluster resolution of 0.1 as part of the FindClusters() function from the R package Seurat. Uniform manifold approximation and projection (UMAP) visualization was calculated using 15 nearest neighbors for the local approximation of the manifold structure. To annotate the cell types of each cluster, FindAllMarkers() was run with the option “test.use = LR”, which identifies marker genes by comparing expression of each gene in a cluster against its expression in the rest of the cells using a logistic regression test. Only genes significantly and strongly up-regulated in the cluster were considered as potential markers. Potential markers were then intersected with canonical markers from the literature for intestinal epithelial cells (Haber et al., 2017), and the results were used to annotate the clusters of the colon and ileum samples (Figure S2A–B and S4L, Table S1).
Differential expression analysis
To test whether genes were statistically differentially expressed (DE) between mouse genotypes within specific cell types, a negative binomial generalized linear model in the DESeq2 (v.1.30.1) R package was used via the Seurat wrapper function FindMarkers() with option “test.use=DESeq2”. For each cell type being tested, the input consisted of the subset of the count matrix containing the cells annotated by that cell type. Size factors and dispersions were estimated prior to fitting the model. Wald statistics were used to determine the significance and the LFC of the fit for each gene. Benjamini-Hochberg method was used to control the false discovery rate (FDR). The differentially expressed genes used in subsequent analysis was determined using an FDR threshold of < 0.05 and an absolute log2 fold change (LFC) of > 0.2 (Table S2–4). P values reported in figures are FDR adjusted (Figure 5F and S4C and G).
Gene set enrichment analysis
DE genes in each cell type were subject to gene set enrichment analysis using the “biological processes” set from the gene ontology database (GO). Specifically, enrichment analysis was performed using the enrichGO() function from the R package clusterprofiler (Yu et al., 2012), with the universe defined as the set of genes expressed in each respective dataset. Further, the upregulated and downregulated pathways were calculated using upregulated and downregulated DE genes respectively. Enriched pathways (i.e., P < 0.05) were collapsed to independent pathways to avoid repetition using clusterprofiler’s simplify() function (Fig. S5E and G, Table S5–6). For plots of enriched pathways of interest (Fig. 5G, 5I, S4N, Fig. S5B), the average expression shown for a given cell type and mouse model is computed as the average expression of the genes that are DE between mouse genotypes in that cell type and contained in the enriched pathway.
Single-cell data visualization
All plots illustrating gene expression levels use SCT transformed expression. Dot plots (Fig. 5H, 5J, S5A, S5F, S5H) show the z-scored expression across conditions; any values outside the range shown in the numerical legend were squished towards the maximum or minimum values shown. Violin plots (Fig. 5G, 5I, S4D, S4I, S4N, S5B, S5C) use a multiplicate bandwidth adjustment of 1.5.
Mass spectrometry-based mucus proteomics
Mucus sample preparation
The mucus proteins were prepared as described above and loaded onto a Bolt 4–12% Bis-Tris-Plus gels (Thermo Scientific) to run for 10 minutes. Gel pieces containing proteins were cut for digestion. The mucus proteins were in-gel digested according to a previous published protocol with modifications (Shevchenko et al., 2006). Briefly, gel pieces containing proteins were transferred to Eppendorf tubes and mashed into small pieces. The pieces were incubated in 500 μL of acetonitrile for 10 min until shrunk. The shrunk pieces were incubated in 50 mM dithiothreitol (Roche) in 50 mM ammonium bicarbonate at 56 °C for 30 min, washed with 500 μL acetonitrile, incubated in 100 mM iodoacetamide in the dark at room temperature for 20 min, and washed with 500 μL acetonitrile. The gel pieces were then incubated with 60 μL of 50 mM ammonium bicarbonate solution of trypsin/LysC (MS grade, Promega) at 4 °C for 90 min and 37 °C overnight. The protease to protein ratio was roughly 1:50. The liquid in the tubes were collected before gel pieces were eluted by 100 μL of 66.6% acetonitrile in 0.1% formic acid. The solutions were combined and concentrated with a SpeedVac (Sigma).
Mass spectrometry
The concentrated solutions were diluted to roughly 30 μL by 0.1% formic acid and 2 μL of the solution was injected into an Ultimate 3500 series nanoLC coupled to an Q Exactive mass spectrometer. A two-solution (solution A: 0.1% formic acid; solution B: 80% acetonitrile, 0.1% formic acid) nanoLC gradient (300 nL/min flow rate) was used to elute an Acclaim™ PepMap™ C18 column (2 μM, 75 μM, 15 cm, Thermo fisher): 1% B until 8 min, 1–9% B in 1 min, 9–11.5% B in 30 min, 11.5–23% B in 50 min, 23–30% B in 15 min, 30–35% B in 5 min, 50–80% B in 1 min and B was kept at 80% for 2 min before dropping back to 1% in 1 min and B was kept at 1% for 7 min. The mass spectrometer was operated under the positive mode. The spray voltage was 1850 V. The ion transfer line temperature was 275 °C. MS resolution was set to 70 K and the mass range was 375–1500 Da. The maximum injection time was 60 ms. The AGC target was 1e6. S-lens RF level was 50. MSMS resolution was 17.5 K. The maximum injection time was 45 ms. The AGC target was 1e5. The HCD collision energy was 28%. MS was active from 8 to 120 min.
Proteomics Data analysis
MS Raw data were processed by MaxQuant (Version 2.0.3.0). The peptide and protein identification were determined by the MaxQuant built-in Andromeda engine (Cox et al., 2011). that searches raw data against an Uniprot mouse proteome. False discovery rate threshold was set to 1%. The MaxLFQ algorithm (Cox et al., 2014) was used for label-free proteome quantification. The minimum ratio count for quantification was set to 1, while the final list of protein quantifications was filtered for proteins with a minimum of two peptides for each protein. The “Match Between Runs” feature was enabled. All statistics and bioinformatics were done by using Perseus (Version 1.6.15.0) (Tyanova et al., 2016). For the two-sample test, we performed a student t-test with a P value threshold of 5%. Missing values were replaced based on a normal distribution (width, 0.3; downshift, 1.8).
16S rDNA sequencing data analysis
16S rDNA sequencing raw data were processed with QIIME2. In brief, raw sequencing data were imported to QIIME2 and demultiplexed, then DADA2 was used for sequence quality control and feature table construction. The feature table was used for beta diversity analysis, taxonomic analysis, and differential abundance testing using QIIME2. Beta group significance was determined by permutational analysis of variance (PERMANOVA). Identification of taxa associated with different groups was determined using Analysis of Composition of Microbiomes (ANCOM).
Analysis of published single-cell data
For the violin plot gene expression profiles of scRNA-seq data of small intestinal epithelial cells (Haber et al., 2017), we plotted Ramp1 expression using their analysis tool (https://singlecell.broadinstitute.org/single_cell/study/SCP44/small-intestinal-epithelium). For the tSNE plot gene expression profiles of scRNA-seq data of purified goblet cells from small intestine and colon (Nystrom et al., 2021), we plotted Ramp1 expression with the authors’ help.
Supplementary Material
(A) Whole-mount image of colonic tissue from Nav1.8tdTomato mice stained for Nav1.8-tdTomato and EpCAM.
(B) Whole-mount image of colonic tissue from Nav1.8DTA and control mice stained for EpCAM and Tyrosine hydroxylase (Th).
(C) Quantification of Th+ neuronal innervation as %Th+ area in maximal projection images (MPI) shown in (B) (1 MPI per mouse; 3 mice/group).
(D) Fluorescence (OD 528/20) measurement of serum collected from Nav1.8DTA and control mice orally gavaged with FITC-dextran or vehicle (n=4–7 mice/group).
(E) Quantification of MUC2 thickness per measurement from Nav1.8DTA and control mice (20–30 measurements/mouse; n=12–14 mice/group).
(F) Schematic of live colonic explant system for mucus thickness measurement.
(G) Pooled distribution (in black and blue) of fluorescent beads on colonic explants from Nav1.8DTA and control mice (3–5 area/mouse; 3–4 mice/group). Smoothed curves (in cyan and red) were generated by averaging four neighbors of each distance.
(H-I) Traces (H) and quantification (I) of CNO (1 nM)- and vehicle (Krebs buffer)-induced calcium influx amplitude in KCl (40 mM)-responsive DRG neurons from Nav1.8hM3Dq and control mice (n=3/group).
(J) Whole-mount image of ileal tissue from Nav1.8hM3Dq mice stained for Nav1.8-mCitrine, EpCAM, and UEA-1.
(K-L) Flow cytometry plot (K) and quantification (L) of EpCAM+ epithelial cells showing % colonic MUC2+ goblet cells from Nav1.8DTA and control mice (n=4 mice/group).
(M) MUC2 and DAPI immunostaining for goblet cells in colon tissue from wildtype B6 mice.
(N-O) Quantification of colonic goblet cells per crypt (N) and per mouse (O) by MUC2 immunostaining from Nav1.8DTA and control mice (20–30 crypts/mouse; n=8–10 mice/group).
Scale bar=100 μm. One-way ANOVA in (D and I). Mann-Whitney test in (E and N). Student’s test in (C, L and O). Mean±SEM. ns=not significant, *p < .05, **p < .01, ***p < .001, ****p < .0001.
(A-B) Dot plot of average z-scored expression (color) of marker genes (rows) in each inferred cell type in colonic (A) and ileal (B) epithelial cells from control Nav1.8-Cre−DTAfl/− mice. (Dot size: percentage of cells in subset with positive expression of gene.)
(C) UMAP of scRNA-seq profiles of ileal epithelial cells from Nav1.8-Cre−DTAfl/− mice, colored by inferred cell type (left) or Ramp1 expression (right).
(D) Violin plot of Ramp1 expression in ileal epithelial cell subsets, based on published scRNA-seq data (Haber et al., 2017).
(E) UMAP of scRNA-seq profiles of colonic goblet cells from Nav1.8-Cre−DTAfl/− mice, colored by expression of the indicated receptors.
(F) t-distributed stochastic neighbor embedding (tSNE) plot of goblet cells (dots) sorted from the colon showing Ramp1 expression (left) and Calcrl expression (right) (Nystrom et al., 2021).
(G) Quantification of Ramp1 and Calcrl expression in goblet cells (red) and non-goblet epithelial cells (black) sorted from colon (Nystrom et al., 2021).
(H-I) In situ hybridization of Ramp1, Muc2 in mouse ileum (H) and RAMP1, MUC2 in human colon (transverse colon) (I).
(J) EpCAM, UEA1, and Calcrl staining of colon tissue from wild type mice.
(K) Quantification of colonic MUC2 thickness per mouse from Calcb+/+ and Calcb−/− mice (n=4–5 mice/group).
(L) Colonic goblet cell number per crypt per mouse from Calcb+/+ and Calcb−/− mice (10–20 crypts/mouse; n=4 mice/group).
(M) Colonic goblet cell number per crypt per mouse from Ramp1f/f and Ramp1Villin mice (10–20 crypts/mouse; n=5–8 mice/group).
(N) Nav1.8-tdTomato and CGRP staining of colon tissue from Nav1.8tdTomato mice.
(O) Tuj1 and CGRP staining of myenteric nerve preparations from Nav1.8DTA and control mice.
Scale bar=100 μm in H-J, N-O. Student’s t-test in (K-M). Mean±SEM. n.s.=not significant.
(A) CGRP levels released by cultured Nav1.8hM3Dq and control DRG neurons treated with CNO and vehicle.(n=4).
(B) CGRP levels in serum from CalcahM3Dq and control mice treated with CNO (1mg/kg) by i.p. injection for 10 minutes (n=9 per group).
(C) MUC2, 16S rDNA and DAPI staining of colon tissue from CalcahM3Dq and control mice treated with CNO (1mg/kg) i.p. for 10 minutes.
(D) Quantification of colonic MUC2 thickness per measurement (left) and per mouse (right) from mice in (C) (20–30 measurement/mouse, n=4–6 mice/group).
(E) AB/PAS staining of colon tissue from ThhM3Dq and control mice treated with CNO (1mg/kg) i.p. for 10 minutes.
(F) Quantification of colonic goblet cell mucus granule emptying by measurement of AB/PAS staining intensity per crypt (left) and per mouse (right) in mice from (E) (20–30 crypts/mouse, n=6–7 mice/ group).
(G-H) Whole-mount image of colonic tissue from Calca-GFP-DTR mice stained for CGRP-GFP and (G) MUC2 or (H) UEA-1.
(I) Whole-mount image of colonic tissue from vehicle or resiniferatoxin (RTX) pretreated Calca-GFP-DTR mice stained for CGRP-GFP, Tuj1, and UEA1.
(J) Quantification of mucus growth rate per area from wildtype colonic explants treated with vehicle or CGRP (100ng/ml) (n=3–5 area/mouse, 4 mice/ group).
(K) Quantification of colonic mucus thickness per measurement in wildtype B6 mice 10 minutes after CGRP (10μg/mouse) i.p. injection (20–30 measurements/mouse; n=7 mice/group).
(L) AB/PAS staining of colon tissue from Ramp1Villin and Ramp1f/f mice treated with either vehicle or CGRP (10μg/mouse) by i.p. injection for 10 minutes.
(M) Quantification of colonic goblet cell mucus granule emptying by AB/PAS staining intensity per crypt in mice from (L) (20–30 crypts/ mouse, n=3 mice/ group).
(N) AB/PAS staining of colon tissues from isotype or anti-CD90.2 antibody pretreated wild type mice followed by i.p. injection with vehicle or CGRP (10μg/mouse) for 10 minutes.
(O-P) Quantification of colonic goblet cell mucus granule emptying by AB/PAS staining intensity per mouse (O) or per crypt (P) in mice from (N) (20–30 crypts/ mouse, n=4–5 mice/ group).
Scale bar=100 μm in C, E, G, H, I, L, and N. One-way ANOVA in A, M, O and P. Mann-Whitney test in D (left panel, F (left panel) and K. Student’s test in B, D (right panel), F (right panel), and J. Mean±SEM. ns=not significant, *p < .05, **p < .01, ***p < .001, ****p < .0001.
(A) Pairwise weighted UniFrac distance analysis of the composition of bacterial communities in colon lumen contents (Lumen) and mucosal scrapings (Mucosa) within control group, and samples from Nav1.8DTA mice compared to control group (n=5–9 mice/group, PERMANOVA, ** q-values<0.005).
(B) UMAP plot of ileal epithelial cells, colored by inferred cell type, from Nav1.8DTA and control mice.
(C) Volcano plot highlights 172 differentially expressed genes (red) in ileal goblet cells from Nav1.8DTA versus control mice, based on thresholds (dotted lines) of |log2 fold change| > 0.2 and adj. P < 0.05.
(D) Violin plot of expression (y axis) of mucus machinery-related genes (x axis) in colonic goblet cells from Nav1.8DTA and control mice.
(E) AB/PAS staining of colon tissues from Nav1.8DTA and control mice.
(F) Quantification of colonic goblet cell mucus levels by measurement of AB/PAS staining intensity per crypt in mice from (E) (20–30 crypts/ mouse; n=3 mice/group).
(G) Mass spectrometry analysis of colonic mucus samples from Nav1.8DTA and control mice. 9 differentially expressed proteins (red) are identified (absolute value of log2 FC > 0.1 and adj. P < 0.05). Mucin genes Muc2 and Muc13 are highlighted in green.
(H) Mass spectrometry quantification of MUC2 and MUC13 protein levels from colonic mucus layers from Nav1.8DTA versus control mice (n=4 mice/group).
(I) Violin plot of expression (y axis) of mucin genes (x axis) in colonic goblet cells from Nav1.8DTA (red) and control (grey) mice.
(J) Western blot (top) and quantification (bottom) of MUC2 protein in colonic mucus layers from Nav1.8DTA and control mice (n=5 mice/group). Equal amount of total mucus protein from each sample was loaded.
(K) UMAP plot of colonic epithelial cells, colored by inferred cell type, from Ramp1Villin and Ramp1f/f mice.
(L) Dot plot shows average z-scored expression (color) of marker genes (columns) in each cluster (rows) of colonic epithelial cells from Ramp1Villin and Ramp1f/f mice.
(M) Volcano plot highlights 302 differentially expressed genes (DEGs, in red) in colonic goblet cells from Ramp1Villin and Ramp1f/f mice, identified based on thresholds (dotted lines) of |log2 fold change| >0.2 and adj. P < 0.05.
(N) Violin plot shows the distribution across colonic goblet cells of the average expression (x axis) of the DEGs, as in M, that intersect with each of the indicated enriched pathways (y axis, GO biological processes), for Ramp1Villin and Ramp1f/f mice.
Scale bar=100 μm in E. Mann-Whitney test in D, F, I and N. Student’s test in J (bottom). ns = not significant, *p < .05, ****p < .0001.
(A) Dot plot showing average z-scored expression of ER stress-related genes in goblet cells from Ramp1Villin and Ramp1f/f mice.
(B) Violin plot, analogous to Fig. S4N, for associated enriched pathways in enterocytes from Ramp1Villin and Ramp1f/f mice.
(C) Violin plot of expression (y axis) of mucus machinery-related genes (x axis) in colonic goblet cells from Ramp1Villin and Ramp1f/f mice.
(D) Venn diagram showing overlap in DEGs in goblet cells from Nav1.8DTA and Ramp1Villin mice compared to their respective controls.
(E) GO biological processes enriched in the subsets of the 108 shared DEGs (as in D) that are up- or down-regulated in goblet cells from Nav1.8DTA and Ramp1Villin compared to their controls.
(F) Dot plot showing average z-scored expression (color) for genes that are differentially expressed in both Nav1.8DTA and Ramp1Villin goblet cells, compared to their controls.
(G) Analogous to E, but for enterocytes from Nav1.8DTA and Ramp1Villin mice compared to control mice.
(H) Dot plot, analogous to F, for enterocytes from Nav1.8DTA and Ramp1Villin mice compared to control mice.
Mann-Whitney test in B and C. ns=not significant, *p < .05, ****p < .0001.
(A-D) Flow cytometry gating of colonic lamina propria immune cells (A-C) and intraepithelial lymphocytes (D).
(E) Immune profiling (% of CD45+ cells) of colonic lamina propria cells from Nav1.8DTA and control mice (n=9 mice/group).
(F) Immune profiling (% of CD45+ cells) of colonic lamina propria ILCs from Nav1.8DTA and control mice (n=9 mice/group).
(G) Immune profiling (% of CD45+ cells) of colonic intraepithelial lymphocytes from Nav1.8DTA and control mice (n=7 mice/ group).
(H) Image of colons from Nav1.8DTA and control mice at baseline.
(I) Colon length measurement of Nav1.8DTA and control mice at baseline (n=5 mice/group).
(J) H&E staining images of colons from Nav1.8DTA and control mice at baseline.
(K) Histology scoring per mouse of colon tissues from Nav1.8DTA and control mice at baseline (n=5 mice/group).
(L) Histology scoring per area of colon tissues from Nav1.8DTA and control mice 10 days after DSS treatment as in Figure 6B (4 areas/ mouse, n=4 mice/ group).
(M) Immune profiling of colonic lamina propria from mice (as in Fig. 6H) on day 10 post DSS treatment (n=6–7 mice/group) shown as %CD45+ cells. Left panel shows myeloid and adaptive cell populations. Right panel shows ILCs.
(N) Daily water consumption per mouse of Nav1.8DTA and control mice during 3.5% DSS treatment (n=7–9 mice/group).
Scale bar 100 μm in J. Multiple t-test in E-G, M-N. Mann-Whitney test in L. Student’s t-test in I and K. Mean±SEM. ns=not significant, **p < .01, ***p <.001.
(A) Colon length of RTX- and vehicle-pretreated mice treated with 2.5% DSS for 5 days (n=4 mice/group). Measurement on day 8 post DSS treatment.
(B) Image of colons from mice in (A).
(C) H&E staining images of colons from mice in (A).
(D) Histology scoring per area (left) and per mouse (right) of colon tissues from mice in (A) (4 areas/mouse, n=4–5 mice/group).
(E) Body weight of Ramp1Villin and Ramp1f/f mice treated with 3.5% DSS in drinking water for 5 days (n=5 mice/group).
(F)% Survival of Ramp1Villin and Ramp1f/f mice treated with 3.5% DSS in drinking water for 5 days (n=5 mice/group).
(G) AB/PAS staining images of colons from Ramp1Villin and control mice 8 days post 2.5% DSS treatment.
(H) Histology scoring per area of colon tissues from Ramp1Villin and control mice 8 days post 2.5% DSS treatment from Figure 6K. (4 areas/mouse, n=4 mice/group).
(I) Representative image of colons from Ramp1Villin and control mice at baseline.
(J) Colon length of Ramp1Villin and control mice at baseline (n=3 mice/group).
(K) Daily water consumption per mouse in Nav1.8hm3Dq and control mice during 3.5% DSS treatment (n=6 mice/group).
(L) AB/PAS staining images of colons from Nav1.8hm3Dq or control mice 8 days post 3.5% DSS treatment.
(M) Histology scoring per area (left) and per mouse (right) of colon tissues from mice in (K) (4 areas/mouse, n=6–9 mice/group).
(N) Principal coordinates analysis (PCoA) of weighted UniFrac distance measurements of colonic luminal microbiomes from Nav1.8hM3Dq and control mice 8 days after treatment with DSS (3.5%) plus CNO (0.5μg/ml) or vehicle (n=4–5 mice/group).
(O-P) Nav1.8hM3Dq and control mice were treated or untreated with DSS (3.5%) plus CNO (0.5μg/ml) in drinking water for 6 days and colon luminal contents were collected on day 8 for 16s rDNA sequencing analysis at family level (E) and genus level (F) (n=4–5 mice/group).
(Q) AB/PAS staining images of colons from Nav1.8DTA and control mice treated with CGRP (10μg/day) or vehicle during DSS colitis. Images from 8 days post 3.5% DSS treatment.
(R) Histology scoring per area of colon tissues from Nav1.8DTA and control mice treated with CGRP (10μg/day) or vehicle on day 8 post DSS treatment. (4 areas mouse, n=4 mice/group).
Scale bars: 100 μm in C and G; 200 μm in L and Q. Student’s t-test in A, D (right panel), J, and M (right panel). Mann-Whitney test in D (left panel), H, and M (left panel). Multiple t-test in E and K. Log-rank test in F. Two-way ANOVA in P. One-way ANOVA in R. Mean±SEM. ns=not significant, *p < .05, **p < .01, ***p <.001, ****p < .0001.
Table S1 Epithelial_cluster_de_markers_LR, related to STAR Methods
Table S2 DE_Genes_Nav1.8_DTA_Colon_per Cell Type(DESeq2) , related to STAR Methods
Table S3 DE_Genes_VillinRamp1_Colon_per Cell Type(DESeq2) , related to STAR Methods
Table S4 DE_Genes_Nav1.8_DTA_Ileum_per Cell Type (DESeq2) , related to STAR Methods
Table S5 Nav1.8_DTA and VillinRamp1_Colon_Enrichment, related to STAR Methods
Table S6 Common_VillinRamp1_Nav1.8_DTA_Colon LFC.2_UP_DOWN_Enrichment, related to STAR Methods
Video S1: Flowchart of mucus quantification, related to STAR Methods
Key Resources Table.
| REAGENT or RESOURCE | SOURCE | IDENTIFIER |
|---|---|---|
| Antibodies | ||
| Rabbit anti-Muc2 polyclonal antibody | Santa Cruz Biotechnology | No longer available RRID: AB_2146667 |
| Rabbit anti-Muc2 polyclonal antibody | Genetex | Cat# GTX100664 RRID: AB_1950958 |
| Rabbit anti-CALCRL polyclonal antibody | Thermo fisher | Cat# PA5-50644 RRID: AB_2636097 |
| Rat anti-mouse CD90.2 (30H12) | Bio X Cell | Cat# BP0066 RRID: AB_1107682 |
| Rat anti-EpCAM Monoclonal antibody | eBioscience | Cat# 17-5791-82 RRID: AB_2716944 |
| Rabbit anti-Calcitonin Gene Related Peptide (CGRP) polyclonal antibody | ImmunoStar | Cat# 24112 RRID: AB_572217 |
| Goat anti-mCherry polyclonal antibody | OriGene Technologies | Cat# AB0040-200 RRID: AB_2333093 |
| Chicken anti-GFP polyclonal antibody | Novus Biologicals | Cat# NB100-1614 RRID: AB_10001164 |
| Rabbit anti-Tyrosine Hydroxylase Antibody | EMD Millipore | Cat# AB152 RRID: AB_390204 |
| Donkey anti-rabbit DyLight 488 | Abcam | Cat# ab98488 RRID: AB_10676096 |
| Donkey anti-rabbit Alexa 594 | Abcam | Cat# ab150076 RRID: AB_2782993 |
| Goat anti-chicken Alexa 488 | Abcam | Cat# ab150173 RRID: AB_2827653 |
| Donkey anti-rat Alexa 647 | Abcam | Cat# ab150155 RRID: AB_2813835 |
| Mouse anti-CD45 Pacific Blue | BioLegend | Cat# 103126 RRID: AB_493535 |
| Mouse anti-TCR-b chain PE/Cy7 | BioLegend | Cat# 109221 RRID: AB_893627 |
| Mouse anti-TCR gamma/delta Brilliant Violet 605 | BioLegend | Cat# 118129 RRID: AB_2563356 |
| Mouse anti-mouse CD4 Brilliant Violet 650 | BioLegend | Cat# 100469 RRID: AB_2783035 |
| Mouse anti-mouse CD8a PerCP/Cy5.5 | BioLegend | Cat# 100733 RRID: AB_2075239 |
| Mouse anti-FOXP3 Alexa Fluor 488 | BioLegend | Cat# 126405 RRID: AB_1089114 |
| Mouse anti-IL17A PE | Biolegend | Cat# 506904 RRID: AB_315464 |
| Mouse anti-IFN gamma APC | eBioscience | Cat# 17-7311-81 RRID: AB_469503 |
| Mouse anti-CD19 Brilliant Violet 650 | BioLegend | Cat# 115541 RRID: AB_11204087 |
| Mouse anti- CD11b Brilliant Violet 605 | BioLegend | Cat# 101237 RRID: AB_11126744 |
| Mouse anti-CD11c FITC | Biolegend | Cat# 117305 RRID: AB_313774 |
| Mouse anti-mouse Ly-6G PE/Cy7 | BioLegend | Cat# 127617 RRID: AB_1877262 |
| Mouse anti-mouse F4/80 PerCP/Cy5.5 | BioLegend | Cat# 123127 RRID: AB_893496 |
| Mouse anti-Ly-6C Alexa Fluor 700 | BioLegend | Cat# 128024 RRID: AB_893496 |
| Mouse anti-PDCA-1 APC | BioLegend | Cat# 127015 RRID: AB_1967101 |
| Mouse anti-mouse CD103 PE | BioLegend | Cat# 121405 RRID: AB_535948 |
| Mouse anti-mouse Lineage Cocktail with Isotype Ctrl FITC | BioLegend | Cat# 133301 RRID: AB_10697030 |
| Mouse anti-CD90.2 PerCP-Cyanine5.5 | Tonbo Biosciences | Cat# 65-0903 RRID:N/A |
| Mouse anti-CD127 Brilliant Violet 605 | BioLegend | Cat# 135025 RRID: AB_2562114 |
| Mouse anti-RORgt APC | eBioscience | Cat# 17-6981-80 RRID: AB_2573253 |
| Mouse anti-GATA3 PE | BioLegend | Cat# 653803 RRID: AB_2562722 |
| Mouse anti-mouse NK-1.1 FITC | BioLegend | Cat# 156507 RRID: AB_2876526 |
| Mouse anti-mouse CD8b FITC | Biolegend | Cat# 126605 RRID: AB_961293 |
| Biological samples | ||
| Healthy human colon biopsy | Boston children’s hospital | N/A |
| Chemicals, peptides, and recombinant proteins | ||
| Calcitonin Gene Related Peptide (CGRP) | GeneScript | Cat# 96827-03-1 |
| Clozapine-N-Oxide | Tocris | Cat# 4936 |
| recombinant mouse NGF | Thermo Fisher Scientific | Cat# A42627 |
| Capsaicin | Tocris | Cat# 0462 |
| Fura-2 AM | Thermo Fisher Scientific | Cat # F1221 |
| Opal 520 | Akoya Biosciences | Cat# FP1487001KT |
| Opal 570 | Akoya Biosciences | Cat# FP1488001KT |
| Resiniferatoxin (RTX) | Alomone Lab | Cat #R400 |
| BIBN 4096 | Tocris | Cat #4561 |
| Ultrapure BSA | Invitrogen | Cat #AM2616 |
| Ulex Europaeus Agglutinin I (UEA I) Rhodamine | Vector Laboratories | Cat# RL-1062 |
| Celltrace Calcein Violet | Thermo Fisher Scientific | Cat# C34858 |
| Collagenase VIII | Sigma-Aldrich | Cat# C2139 |
| Deoxyribonuclease I | Sigma-Aldrich | Cat# D5025 |
| Fluospheres™ Polystyrene Microspheres, 1.0 μm, red fluorescent | Thermo Fisher Scientific | Cat# F13083 |
| ALZET Osmotic Pump | Alzet | Cat# 1007d |
| Krebs-Ringer Solution | Alfa Aesar | Cat# J67795 |
| DAPT | Sigma-Aldrich | Cat# D5942 |
| IWP-2 | Sigma-Aldrich | Cat# I0536 |
| rmEGF | Peprotech | Cat# 31509 |
| Collagen | Sigma-Aldrich | Cat# C5533 |
| TripLE | Life technology | Cat# 1265010 |
| Carbachol | Sigma-Aldrich | Cat# Y0000113 |
| Acridine Orange | Sigma-Aldrich | Cat# A6014 |
| Critical commercial assays | ||
| CGRP rat Enzyme Linked Immunosorbent Kit | Cayman Chemical | Cat# 589001 |
| LIVE/DEAD™ Fixable Near-IR Dead Cell Stain Kit | Thermo Fisher Scientific | Cat# L34975 |
| RNAscope® Probe- Hs-MUC2 | Advanced Cell Diagnostics | Cat# 312871 |
| RNAscope® Probe- Hs-RAMP1-C2 | Advanced Cell Diagnostics | Cat# 483051-C2 |
| RNAscope® Probe- Mm-Muc2-C2 | Advanced Cell Diagnostics | Cat# 315451-C2 |
| RNAscope® Probe- Mm-Ramp1-O1 | Advanced Cell Diagnostics | Cat# 532681 |
| RNAscope Multiplex Fluorescent Assay v2 | Advanced Cell Diagnostics | Cat# 323110 |
| RNAscope Multiplex Fluorescent Detection Kit | Advanced Cell Diagnostics | Cat# 320851 |
| QIAamp DNA Stool Mini Kit | QIAGEN | Cat# 51504 |
| Fixation/Permeabilization kit | BD | Cat# 554714 |
| Transcription factor staining buffer set | eBioscience | Cat# 00-5523-00 |
| Chromium Next GEM Single Cell 3’ Reagent Kit v3.1 | 10X Genomics | Cat# CG000315 |
| Chromium Next GEM Single Cell 3’ Kit v3.1 | 10X Genomics | Cat# 1000268 |
| Chromium Next GEM Chip G Single Cell Kit | 10X Genomics | Cat# 1000120 |
| Dual Index Kit TT Set A | 10X Genomics | Cat# 1000215 |
| Acridine Orange/Propidium Iodide stain | Logos Biosystems | Cat# F23011 |
| Kapa qPCR Library Quantification Kit | Roche Sequencing Solutions | Cat# 07960140001 |
| High Sensitivity D5000 Tape | Agilent Technologies | Cat#5067-5592 |
| High Sensitivity D5000 Reagents | Agilent Technologies | Cat# 5067-5593 |
| Deposited data | ||
| Raw 16S sequencing | BioProject | PRJNA803622 |
| Nav1.8DTA colonic epithelial cells | This paper | GSE208762 |
| Ramp1Villin colonic epithelial cells | This paper | GSE208762 |
| Nav1.8DTA ileal epithelial cells | This paper | GSE208594 |
| Experimental models: Mouse strains | ||
| Mouse: C57BL/6 | Jackson Laboratory | Stock #000664 |
| Mouse: B6.Rosa26-stop(flox)-DTA | Jackson Laboratory | Stock #009669 |
| Mouse: B6.Rose26-stop(flox)-tdTomato | Jackson Laboratory | Stock #007914 |
| Mouse: Calca-GFP-DTR | Provided by M. Zylca | (McCoy et al., 2013) |
| Mouse: B6.Cg-Calcatm1.1(cre/EGFP)Rpa/J | Jackson Laboratory | Stock #033168 |
| Mouse: Nav1.8-Cre | Provided by J. Wood | (Abrahamsen et al., 2008) |
| Mouse: Calca−/− | Provided by V. Kurchroo | (Oh-hashi et al., 2001) |
| Mouse: Calcb−/− | Provided by M. Rao | (Thompson et al., 2008) |
| Mouse: C57BL/6N Ramp1tm1a(EUCOMM)Wtsi/H | EMMA | Stock #07401 |
| Mouse: Villin1-Cre | Jackson Laboratory | Stock #018963 |
| Mouse: B6N;129-Tg(CAG-CHRM3*,mCitrine)1Ute/J | Jackson Laboratory | Stock #026220 |
| Mouse: Germ free C57BL/6 | Provided by J. Huh | N/A |
| Oligonucleotides | ||
| EUB338 pan-eubacterial Cy-3 conjugated FISH probe | IDT | (5’-GCTGCCTCCCGTAGGAGT’3’) |
| Nonsense Cy-3 conjugated FISH probe | IDT | (5’-CGACGGAGGGCATCCTCA-3’) |
| Software and algorithms | ||
| FlowJo V10 | Treestar | www.flowjo.com |
| FIJI Is Just Image J version 2 | ImageJ | https://fiji.sc |
| QIIME version 1.9.1 | (Kuczynski et al., 2012) | qiime.org |
| Intestine Explant Perfusion system | This paper | https://github.com/mdanderson03/mucus_explant |
| Mucus Quantification v8 | This paper | https://github.com/prajuvikas/Mucus_Quantification_v8_2022Jan |
| Other | ||
| Cytoflex S flow cytometer | Beckman Coulter | N/A |
| FACSAria | BD | N/A |
| Stellaris 8 FALCON CFS | Leica | N/A |
| Thunder 3D Cell Culture | Leica | N/A |
| Eclipse Ti-S/L100 inverted microscope | Nikon | N/A |
Highlights.
Nav1.8+CGRP+ nociceptors neighbor goblet cells and induce rapid mucus secretion
Commensals trigger CGRP release, which signals to RAMP1 expressed by goblet cells
Nociceptor or RAMP1 ablation led to decreased mucus levels and microbial dysbiosis
Neuron-goblet cell signaling via a CGRP-RAMP1 axis protects against colitis
Acknowledgments
We thank Himanish Basu, Felipe Pinho-Ribeiro, Antonia Wallrapp, Nicole Almanzar, Chambit Paik, Alos Diallo, Eunha Kim, Valentina Lagomarsino, Paula Montero Llopis, Beatriz Martinez Abad (U. Gothenburg), Nicole Lai (Kallyope), and Muriel Larauche (UCLA) for technical help. We thank Gunnar Hansson (U. Gothenburg) and Wayne Lencer (Boston Children’s Hospital) for helpful discussions. We thank Meenakshi Rao (Boston Children’s Hospital) for Calcb−/− mice. We thank HDDC Microscopy and Histopathology Core (NIDDK P30DK034854) and BIDMC Histology Core for histology; MicRoN Core at HMS for imaging analysis; Bauer Core, HMS Single Cell Core, and Harvard Chan Bioinformatics Core for scRNA-seq. This work was supported by National Institutes of Health (NIH) R01DK127257, FASI, Kenneth Rainin Foundation to I.M.C.; NIH T32 in pediatric gastroenterology (T32 DK007447) to A.J.; R35GM142683 (NIGMS) to J.R.T. and P30DK034854 (J.R.T. and M.A); Digestive Diseases Research Core Center P30 DK42086 at University of Chicago to B.J.
Diversity and Inclusion Statement
We worked to ensure sex balance in the selection of non-human subjects. One or more of the authors of this paper self-identifies as a gender minority in their field of research.
Footnotes
Declaration of interests
A.J. is an employee of Genentech, Inc. I.M.C. serves on scientific advisory boards of GSK Pharmaceuticals and Limm Therapeutics. His lab receives research support from Moderna Inc. and Abbvie/Allergan Pharmaceuticals.
Publisher's Disclaimer: This is a PDF file of an unedited manuscript that has been accepted for publication. As a service to our customers we are providing this early version of the manuscript. The manuscript will undergo copyediting, typesetting, and review of the resulting proof before it is published in its final form. Please note that during the production process errors may be discovered which could affect the content, and all legal disclaimers that apply to the journal pertain.
References
- Abrahamsen B, Zhao J, Asante CO, Cendan CM, Marsh S, Martinez-Barbera JP, Nassar MA, Dickenson AH, and Wood JN (2008). The cell and molecular basis of mechanical, cold, and inflammatory pain. Science 321, 702–705. [DOI] [PubMed] [Google Scholar]
- Baral P, Udit S, and Chiu IM (2019). Pain and immunity: implications for host defence. Nat Rev Immunol 19, 433–447. [DOI] [PMC free article] [PubMed] [Google Scholar]
- Baral P, Umans BD, Li L, Wallrapp A, Bist M, Kirschbaum T, Wei Y, Zhou Y, Kuchroo VK, Burkett PR, et al. (2018). Nociceptor sensory neurons suppress neutrophil and gammadelta T cell responses in bacterial lung infections and lethal pneumonia. Nat Med 24, 417–426. [DOI] [PMC free article] [PubMed] [Google Scholar]
- Bellono NW, Bayrer JR, Leitch DB, Castro J, Zhang C, O’Donnell TA, Brierley SM, Ingraham HA, and Julius D (2017). Enterochromaffin Cells Are Gut Chemosensors that Couple to Sensory Neural Pathways. Cell 170, 185–198 e116. [DOI] [PMC free article] [PubMed] [Google Scholar]
- Bergstrom KS, Kissoon-Singh V, Gibson DL, Ma C, Montero M, Sham HP, Ryz N, Huang T, Velcich A, Finlay BB, et al. (2010). Muc2 protects against lethal infectious colitis by disassociating pathogenic and commensal bacteria from the colonic mucosa. PLoS Pathog 6, e1000902. [DOI] [PMC free article] [PubMed] [Google Scholar]
- Bielefeldt K, Davis B, and Binion DG (2009). Pain and inflammatory bowel disease. Inflammatory bowel diseases 15, 778–788. [DOI] [PMC free article] [PubMed] [Google Scholar]
- Birchenough GM, Nystrom EE, Johansson ME, and Hansson GC (2016). A sentinel goblet cell guards the colonic crypt by triggering Nlrp6-dependent Muc2 secretion. Science 352, 1535–1542. [DOI] [PMC free article] [PubMed] [Google Scholar]
- Cardoso F, Klein Wolterink RGJ, Godinho-Silva C, Domingues RG, Ribeiro H, da Silva JA, Mahu I, Domingos AI, and Veiga-Fernandes H (2021). Neuro-mesenchymal units control ILC2 and obesity via a brain-adipose circuit. Nature 597, 410–414. [DOI] [PMC free article] [PubMed] [Google Scholar]
- Caterina MJ, Schumacher MA, Tominaga M, Rosen TA, Levine JD, and Julius D (1997). The capsaicin receptor: a heat-activated ion channel in the pain pathway. Nature 389, 816–824. [DOI] [PubMed] [Google Scholar]
- Chelakkot C, Ghim J, and Ryu SH (2018). Mechanisms regulating intestinal barrier integrity and its pathological implications. Exp Mol Med 50, 1–9. [DOI] [PMC free article] [PubMed] [Google Scholar]
- Chiu IM, Heesters BA, Ghasemlou N, Von Hehn CA, Zhao F, Tran J, Wainger B, Strominger A, Muralidharan S, Horswill AR, et al. (2013). Bacteria activate sensory neurons that modulate pain and inflammation. Nature 501, 52–57. [DOI] [PMC free article] [PubMed] [Google Scholar]
- Cohen JM, Ning X, Kessler Y, Rasamoelisolo M, Campos VR, Seminerio MJ, Krasenbaum LJ, Shen H, and Stratton J (2021). Immunogenicity of biologic therapies for migraine: a review of current evidence. J Headache Pain 22, 3. [DOI] [PMC free article] [PubMed] [Google Scholar]
- Cox J, Hein MY, Luber CA, Paron I, Nagaraj N, and Mann M (2014). Accurate proteome-wide label-free quantification by delayed normalization and maximal peptide ratio extraction, termed MaxLFQ. Mol Cell Proteomics 13, 2513–2526. [DOI] [PMC free article] [PubMed] [Google Scholar]
- Cox J, Neuhauser N, Michalski A, Scheltema RA, Olsen JV, and Mann M (2011). Andromeda: a peptide search engine integrated into the MaxQuant environment. J Proteome Res 10, 1794–1805. [DOI] [PubMed] [Google Scholar]
- Drokhlyansky E, Smillie CS, Van Wittenberghe N, Ericsson M, Griffin GK, Eraslan G, Dionne D, Cuoco MS, Goder-Reiser MN, Sharova T, et al. (2020). The Human and Mouse Enteric Nervous System at Single-Cell Resolution. Cell. [DOI] [PMC free article] [PubMed] [Google Scholar]
- Engel MA, Leffler A, Niedermirtl F, Babes A, Zimmermann K, Filipovic MR, Izydorczyk I, Eberhardt M, Kichko TI, Mueller-Tribbensee SM, et al. (2011). TRPA1 and substance P mediate colitis in mice. Gastroenterology 141, 1346–1358. [DOI] [PubMed] [Google Scholar]
- Farkas AM, Panea C, Goto Y, Nakato G, Galan-Diez M, Narushima S, Honda K, and Ivanov II (2015). Induction of Th17 cells by segmented filamentous bacteria in the murine intestine. Journal of immunological methods 421, 104–111. [DOI] [PMC free article] [PubMed] [Google Scholar]
- Foster SL, Seehus CR, Woolf CJ, and Talbot S (2017). Sense and Immunity: Context-Dependent Neuro-Immune Interplay. Frontiers in immunology 8, 1463. [DOI] [PMC free article] [PubMed] [Google Scholar]
- Furness JB, Rivera LR, Cho HJ, Bravo DM, and Callaghan B (2013). The gut as a sensory organ. Nature reviews Gastroenterology & hepatology 10, 729–740. [DOI] [PubMed] [Google Scholar]
- Gabanyi I, Muller PA, Feighery L, Oliveira TY, Costa-Pinto FA, and Mucida D (2016). Neuro-immune Interactions Drive Tissue Programming in Intestinal Macrophages. Cell 164, 378–391. [DOI] [PMC free article] [PubMed] [Google Scholar]
- Godinho-Silva C, Cardoso F, and Veiga-Fernandes H (2019). Neuro-Immune Cell Units: A New Paradigm in Physiology. Annual review of immunology 37, 19–46. [DOI] [PubMed] [Google Scholar]
- Gustafsson JK, Davis JE, Rappai T, McDonald KG, Kulkarni DH, Knoop KA, Hogan SP, Fitzpatrick JA, Lencer WI, and Newberry RD (2021). Intestinal goblet cells sample and deliver lumenal antigens by regulated endocytic uptake and transcytosis. Elife 10. [DOI] [PMC free article] [PubMed] [Google Scholar]
- Gustafsson JK, Ermund A, Johansson ME, Schutte A, Hansson GC, and Sjovall H (2012). An ex vivo method for studying mucus formation, properties, and thickness in human colonic biopsies and mouse small and large intestinal explants. Am J Physiol Gastrointest Liver Physiol 302, G430–438. [DOI] [PMC free article] [PubMed] [Google Scholar]
- Haber AL, Biton M, Rogel N, Herbst RH, Shekhar K, Smillie C, Burgin G, Delorey TM, Howitt MR, Katz Y, et al. (2017). A single-cell survey of the small intestinal epithelium. Nature 551, 333–339. [DOI] [PMC free article] [PubMed] [Google Scholar]
- Hafemeister C, and Satija R (2019). Normalization and variance stabilization of single-cell RNA-seq data using regularized negative binomial regression. Genome Biol 20, 296. [DOI] [PMC free article] [PubMed] [Google Scholar]
- Halm DR, and Halm ST (1999). Secretagogue response of goblet cells and columnar cells in human colonic crypts. The American journal of physiology 277, C501–522. [DOI] [PubMed] [Google Scholar]
- Hao Y, Hao S, Andersen-Nissen E, Mauck WM 3rd, Zheng S, Butler A, Lee MJ, Wilk AJ, Darby C, Zager M, et al. (2021). Integrated analysis of multimodal single-cell data. Cell 184, 3573–3587 e3529. [DOI] [PMC free article] [PubMed] [Google Scholar]
- Holzer P, and Holzer-Petsche U (2021). Constipation Caused by Anti-calcitonin Gene-Related Peptide Migraine Therapeutics Explained by Antagonism of Calcitonin Gene-Related Peptide’s Motor-Stimulating and Prosecretory Function in the Intestine. Frontiers in physiology 12, 820006. [DOI] [PMC free article] [PubMed] [Google Scholar]
- Hosokawa S, Endoh T, Shibukawa Y, Tsumura M, Ichikawa H, Tazaki M, and Furusawa M (2010). Calcitonin gene-related peptide- and adrenomedullin-induced facilitation of calcium current by different signal pathways in nucleus tractus solitarius. Brain research 1327, 47–55. [DOI] [PubMed] [Google Scholar]
- Jacobson A, Yang D, Vella M, and Chiu IM (2021). The intestinal neuro-immune axis: crosstalk between neurons, immune cells, and microbes. Mucosal immunology. [DOI] [PMC free article] [PubMed] [Google Scholar]
- Jarret A, Jackson R, Duizer C, Healy ME, Zhao J, Rone JM, Bielecki P, Sefik E, Roulis M, Rice T, et al. (2020). Enteric Nervous System-Derived IL-18 Orchestrates Mucosal Barrier Immunity. Cell 180, 50–63.e12. [DOI] [PMC free article] [PubMed] [Google Scholar]
- Johansson ME, and Hansson GC (2012). Preservation of mucus in histological sections, immunostaining of mucins in fixed tissue, and localization of bacteria with FISH. Methods in molecular biology 842, 229–235. [DOI] [PubMed] [Google Scholar]
- Johansson ME, Jakobsson HE, Holmen-Larsson J, Schutte A, Ermund A, Rodriguez-Pineiro AM, Arike L, Wising C, Svensson F, Backhed F, et al. (2015). Normalization of Host Intestinal Mucus Layers Requires Long-Term Microbial Colonization. Cell host & microbe 18, 582–592. [DOI] [PMC free article] [PubMed] [Google Scholar]
- Kaelberer MM, Buchanan KL, Klein ME, Barth BB, Montoya MM, Shen X, and Bohorquez DV (2018). A gut-brain neural circuit for nutrient sensory transduction. Science 361. [DOI] [PMC free article] [PubMed] [Google Scholar]
- Kawashima-Takeda N, Ito Y, Nishizawa N, Kawashima R, Tanaka K, Tsujikawa K, Watanabe M, and Majima M (2017). RAMP1 suppresses mucosal injury from dextran sodium sulfate-induced colitis in mice. Journal of gastroenterology and hepatology 32, 809–818. [DOI] [PubMed] [Google Scholar]
- Kimura S, Yamakami-Kimura M, Obata Y, Hase K, Kitamura H, Ohno H, and Iwanaga T (2015). Visualization of the entire differentiation process of murine M cells: suppression of their maturation in cecal patches. Mucosal immunology 8, 650–660. [DOI] [PubMed] [Google Scholar]
- Klein AM, Mazutis L, Akartuna I, Tallapragada N, Veres A, Li V, Peshkin L, Weitz DA, and Kirschner MW (2015). Droplet barcoding for single-cell transcriptomics applied to embryonic stem cells. Cell 161, 1187–1201. [DOI] [PMC free article] [PubMed] [Google Scholar]
- Knoop KA, and Newberry RD (2018). Goblet cells: multifaceted players in immunity at mucosal surfaces. Mucosal immunology 11, 1551–1557. [DOI] [PMC free article] [PubMed] [Google Scholar]
- Koelink PJ, Wildenberg ME, Stitt LW, Feagan BG, Koldijk M, van ‘t Wout AB, Atreya R, Vieth M, Brandse JF, Duijst S, et al. (2018). Development of Reliable, Valid and Responsive Scoring Systems for Endoscopy and Histology in Animal Models for Inflammatory Bowel Disease. J Crohns Colitis 12, 794–803. [DOI] [PMC free article] [PubMed] [Google Scholar]
- Kraus A, Buckley KM, and Salinas I (2021). Sensing the world and its dangers: An evolutionary perspective in neuroimmunology. Elife 10. [DOI] [PMC free article] [PubMed] [Google Scholar]
- Lagomarsino VN, Kostic AD, and Chiu IM (2021). Mechanisms of microbial-neuronal interactions in pain and nociception. Neurobiol Pain 9, 100056. [DOI] [PMC free article] [PubMed] [Google Scholar]
- Lai NY, Musser MA, Pinho-Ribeiro FA, Baral P, Jacobson A, Ma P, Potts DE, Chen Z, Paik D, Soualhi S, et al. (2019). Gut-Innervating Nociceptor Neurons Regulate Peyer’s Patch Microfold Cells and SFB Levels to Mediate Salmonella Host Defense. Cell. [DOI] [PMC free article] [PubMed] [Google Scholar]
- Larauche M, Gourcerol G, Million M, Adelson DW, and Tache Y (2010). Repeated psychological stress-induced alterations of visceral sensitivity and colonic motor functions in mice: influence of surgery and postoperative single housing on visceromotor responses. Stress 13, 343–354. [DOI] [PMC free article] [PubMed] [Google Scholar]
- Lee RJ, and Foskett JK (2014). Ca(2)(+) signaling and fluid secretion by secretory cells of the airway epithelium. Cell calcium 55, 325–336. [DOI] [PubMed] [Google Scholar]
- Liu A, Lv H, Wang H, Yang H, Li Y, and Qian J (2020). Aging Increases the Severity of Colitis and the Related Changes to the Gut Barrier and Gut Microbiota in Humans and Mice. J Gerontol A Biol Sci Med Sci 75, 1284–1292. [DOI] [PubMed] [Google Scholar]
- McCoy ES, Taylor-Blake B, Street SE, Pribisko AL, Zheng J, and Zylka MJ (2013). Peptidergic CGRPalpha primary sensory neurons encode heat and itch and tonically suppress sensitivity to cold. Neuron 78, 138–151. [DOI] [PMC free article] [PubMed] [Google Scholar]
- McLatchie LM, Fraser NJ, Main MJ, Wise A, Brown J, Thompson N, Solari R, Lee MG, and Foord SM (1998). RAMPs regulate the transport and ligand specificity of the calcitonin-receptor-like receptor. Nature 393, 333–339. [DOI] [PubMed] [Google Scholar]
- Moore EL, and Salvatore CA (2012). Targeting a family B GPCR/RAMP receptor complex: CGRP receptor antagonists and migraine. British journal of pharmacology 166, 66–78. [DOI] [PMC free article] [PubMed] [Google Scholar]
- Muller PA, Schneeberger M, Matheis F, Wang P, Kerner Z, Ilanges A, Pellegrino K, Del Marmol J, Castro TBR, Furuichi M, et al. (2020). Microbiota modulate sympathetic neurons via a gut-brain circuit. Nature. [DOI] [PMC free article] [PubMed] [Google Scholar]
- Nagashima H, Mahlakoiv T, Shih HY, Davis FP, Meylan F, Huang Y, Harrison OJ, Yao C, Mikami Y, Urban JF Jr., et al. (2019). Neuropeptide CGRP Limits Group 2 Innate Lymphoid Cell Responses and Constrains Type 2 Inflammation. Immunity 51, 682–695 e686. [DOI] [PMC free article] [PubMed] [Google Scholar]
- Nalle SC, Zuo L, Ong M, Singh G, Worthylake AM, Choi W, Manresa MC, Southworth AP, Edelblum KL, Baker GJ, et al. (2019). Graft-versus-host disease propagation depends on increased intestinal epithelial tight junction permeability. The Journal of clinical investigation 129, 902–914. [DOI] [PMC free article] [PubMed] [Google Scholar]
- Nystrom EEL, Birchenough GMH, van der Post S, Arike L, Gruber AD, Hansson GC, and Johansson MEV (2018). Calcium-activated Chloride Channel Regulator 1 (CLCA1) Controls Mucus Expansion in Colon by Proteolytic Activity. EBioMedicine 33, 134–143. [DOI] [PMC free article] [PubMed] [Google Scholar]
- Nystrom EEL, Martinez-Abad B, Arike L, Birchenough GMH, Nonnecke EB, Castillo PA, Svensson F, Bevins CL, Hansson GC, and Johansson MEV (2021). An intercrypt subpopulation of goblet cells is essential for colonic mucus barrier function. Science 372. [DOI] [PMC free article] [PubMed] [Google Scholar]
- Oh-hashi Y, Shindo T, Kurihara Y, Imai T, Wang Y, Morita H, Imai Y, Kayaba Y, Nishimatsu H, Suematsu Y, et al. (2001). Elevated sympathetic nervous activity in mice deficient in alphaCGRP. Circulation research 89, 983–990. [DOI] [PubMed] [Google Scholar]
- Paone P, and Cani PD (2020). Mucus barrier, mucins and gut microbiota: the expected slimy partners? Gut 69, 2232–2243. [DOI] [PMC free article] [PubMed] [Google Scholar]
- Pelaseyed T, and Hansson GC (2020). Membrane mucins of the intestine at a glance. Journal of cell science 133. [DOI] [PMC free article] [PubMed] [Google Scholar]
- Picelli S, Faridani OR, Bjorklund AK, Winberg G, Sagasser S, and Sandberg R (2014). Full-length RNA-seq from single cells using Smart-seq2. Nature protocols 9, 171–181. [DOI] [PubMed] [Google Scholar]
- Pinho-Ribeiro FA, Baddal B, Haarsma R, O’Seaghdha M, Yang NJ, Blake KJ, Portley M, Verri WA, Dale JB, Wessels MR, et al. (2018). Blocking Neuronal Signaling to Immune Cells Treats Streptococcal Invasive Infection. Cell 173, 1083–1097 e1022. [DOI] [PMC free article] [PubMed] [Google Scholar]
- Russell FA, King R, Smillie SJ, Kodji X, and Brain SD (2014). Calcitonin gene-related peptide: physiology and pathophysiology. Physiological reviews 94, 1099–1142. [DOI] [PMC free article] [PubMed] [Google Scholar]
- Salvatore CA, Mallee JJ, Bell IM, Zartman CB, Williams TM, Koblan KS, and Kane SA (2006). Identification and pharmacological characterization of domains involved in binding of CGRP receptor antagonists to the calcitonin-like receptor. Biochemistry 45, 1881–1887. [DOI] [PubMed] [Google Scholar]
- Sato T, Stange DE, Ferrante M, Vries RG, Van Es JH, Van den Brink S, Van Houdt WJ, Pronk A, Van Gorp J, Siersema PD, et al. (2011). Long-term expansion of epithelial organoids from human colon, adenoma, adenocarcinoma, and Barrett’s epithelium. Gastroenterology 141, 1762–1772. [DOI] [PubMed] [Google Scholar]
- Seillet C, Luong K, Tellier J, Jacquelot N, Shen RD, Hickey P, Wimmer VC, Whitehead L, Rogers K, Smyth GK, et al. (2019). The neuropeptide VIP confers anticipatory mucosal immunity by regulating ILC3 activity. Nature immunology. [DOI] [PubMed] [Google Scholar]
- Shang L, Liu H, Yu H, Chen M, Yang T, Zeng X, and Qiao S (2021). Core Altered Microorganisms in Colitis Mouse Model: A Comprehensive Time-Point and Fecal Microbiota Transplantation Analysis. Antibiotics (Basel) 10. [DOI] [PMC free article] [PubMed] [Google Scholar]
- Shevchenko A, Tomas H, Havlis J, Olsen JV, and Mann M (2006). In-gel digestion for mass spectrometric characterization of proteins and proteomes. Nature protocols 1, 2856–2860. [DOI] [PubMed] [Google Scholar]
- Shumilov D, Popov A, Fudala R, Akopova I, Gryczynski I, Borejdo J, Gryczynski Z, and Grygorczyk R (2014). Real-time imaging of exocytotic mucin release and swelling in Calu-3 cells using acridine orange. Methods 66, 312–324. [DOI] [PMC free article] [PubMed] [Google Scholar]
- Sonnenberg GF, Monticelli LA, Alenghat T, Fung TC, Hutnick NA, Kunisawa J, Shibata N, Grunberg S, Sinha R, Zahm AM, et al. (2012). Innate lymphoid cells promote anatomical containment of lymphoid-resident commensal bacteria. Science 336, 1321–1325. [DOI] [PMC free article] [PubMed] [Google Scholar]
- Specian RD, and Neutra MR (1980). Mechanism of rapid mucus secretion in goblet cells stimulated by acetylcholine. J Cell Biol 85, 626–640. [DOI] [PMC free article] [PubMed] [Google Scholar]
- Talbot J, Hahn P, Kroehling L, Nguyen H, Li D, and Littman DR (2020a). Feeding-dependent VIP neuron-ILC3 circuit regulates the intestinal barrier. Nature 579, 575–580. [DOI] [PMC free article] [PubMed] [Google Scholar]
- Talbot S, Doyle B, Huang J, Wang JC, Ahmadi M, Roberson DP, Yekkirala A, Foster SL, Browne LE, Bean BP, et al. (2020b). Vagal sensory neurons drive mucous cell metaplasia. The Journal of allergy and clinical immunology. [DOI] [PMC free article] [PubMed] [Google Scholar]
- Thompson BJ, Washington MK, Kurre U, Singh M, Rula EY, and Emeson RB (2008). Protective roles of alpha-calcitonin and beta-calcitonin gene-related peptide in spontaneous and experimentally induced colitis. Digestive diseases and sciences 53, 229–241. [DOI] [PubMed] [Google Scholar]
- Turner JR (2009). Intestinal mucosal barrier function in health and disease. Nature reviews Immunology 9, 799–809. [DOI] [PubMed] [Google Scholar]
- Tyanova S, Albrechtsen R, Kronqvist P, Cox J, Mann M, and Geiger T (2016). Proteomic maps of breast cancer subtypes. Nature communications 7, 10259. [DOI] [PMC free article] [PubMed] [Google Scholar]
- Urban DJ, and Roth BL (2015). DREADDs (designer receptors exclusively activated by designer drugs): chemogenetic tools with therapeutic utility. Annu Rev Pharmacol Toxicol 55, 399–417. [DOI] [PubMed] [Google Scholar]
- Utsumi D, Matsumoto K, Tsukahara T, Amagase K, Tominaga M, and Kato S (2018). Transient receptor potential vanilloid 1 and transient receptor potential ankyrin 1 contribute to the progression of colonic inflammation in dextran sulfate sodium-induced colitis in mice: Links to calcitonin gene-related peptide and substance P. Journal of pharmacological sciences 136, 121–132. [DOI] [PubMed] [Google Scholar]
- van der Post S, Jabbar KS, Birchenough G, Arike L, Akhtar N, Sjovall H, Johansson MEV, and Hansson GC (2019). Structural weakening of the colonic mucus barrier is an early event in ulcerative colitis pathogenesis. Gut 68, 2142–2151. [DOI] [PMC free article] [PubMed] [Google Scholar]
- van Muijlwijk GH, van Mierlo G, Jansen P, Vermeulen M, Bleumink-Pluym NMC, Palm NW, van Putten JPM, and de Zoete MR (2021). Identification of Allobaculum mucolyticum as a novel human intestinal mucin degrader. Gut microbes 13, 1966278. [DOI] [PMC free article] [PubMed] [Google Scholar]
- Vandervorst F, Van Deun L, Van Dycke A, Paemeleire K, Reuter U, Schoenen J, and Versijpt J (2021). CGRP monoclonal antibodies in migraine: an efficacy and tolerability comparison with standard prophylactic drugs. J Headache Pain 22, 128. [DOI] [PMC free article] [PubMed] [Google Scholar]
- Veiga-Fernandes H, and Mucida D (2016). Neuro-Immune Interactions at Barrier Surfaces. Cell 165, 801–811. [DOI] [PMC free article] [PubMed] [Google Scholar]
- Wallrapp A, Burkett PR, Riesenfeld SJ, Kim S-J, Christian E, Abdulnour R-EE, Thakore PI, Schnell A, Lambden C, Herbst RH, et al. (2019). Calcitonin Gene-Related Peptide Negatively Regulates Alarmin-Driven Type 2 Innate Lymphoid Cell Responses. Immunity. [DOI] [PMC free article] [PubMed] [Google Scholar]
- Wlodarska M, Thaiss, Christoph A, Nowarski R, Henao-Mejia J, Zhang J-P, Brown, Eric M, Frankel G, Levy M, Katz, Meirav N, Philbrick, William M, et al. (2014). NLRP6 Inflammasome Orchestrates the Colonic Host-Microbial Interface by Regulating Goblet Cell Mucus Secretion. Cell 156, 1045–1059. [DOI] [PMC free article] [PubMed] [Google Scholar]
- Xu H, Ding J, Porter CBM, Wallrapp A, Tabaka M, Ma S, Fu S, Guo X, Riesenfeld SJ, Su C, et al. (2019). Transcriptional Atlas of Intestinal Immune Cells Reveals that Neuropeptide alpha-CGRP Modulates Group 2 Innate Lymphoid Cell Responses. Immunity 51, 696–708 e699. [DOI] [PMC free article] [PubMed] [Google Scholar]
- Yang N, Garcia MA, and Quinton PM (2013). Normal mucus formation requires cAMP-dependent HCO3- secretion and Ca2+-mediated mucin exocytosis. The Journal of physiology 591, 4581–4593. [DOI] [PMC free article] [PubMed] [Google Scholar]
- Ye L, Bae M, Cassilly CD, Jabba SV, Thorpe DW, Martin AM, Lu HY, Wang J, Thompson JD, Lickwar CR, et al. (2021). Enteroendocrine cells sense bacterial tryptophan catabolites to activate enteric and vagal neuronal pathways. Cell host & microbe 29, 179–196 e179. [DOI] [PMC free article] [PubMed] [Google Scholar]
- Yoo BB, and Mazmanian SK (2017). The Enteric Network: Interactions between the Immune and Nervous Systems of the Gut. Immunity 46, 910–926. [DOI] [PMC free article] [PubMed] [Google Scholar]
- Yu G, Wang LG, Han Y, and He QY (2012). clusterProfiler: an R package for comparing biological themes among gene clusters. OMICS 16, 284–287. [DOI] [PMC free article] [PubMed] [Google Scholar]
- Zilionis R, Nainys J, Veres A, Savova V, Zemmour D, Klein AM, and Mazutis L (2017). Single-cell barcoding and sequencing using droplet microfluidics. Nature protocols 12, 44–73. [DOI] [PubMed] [Google Scholar]
Associated Data
This section collects any data citations, data availability statements, or supplementary materials included in this article.
Supplementary Materials
(A) Whole-mount image of colonic tissue from Nav1.8tdTomato mice stained for Nav1.8-tdTomato and EpCAM.
(B) Whole-mount image of colonic tissue from Nav1.8DTA and control mice stained for EpCAM and Tyrosine hydroxylase (Th).
(C) Quantification of Th+ neuronal innervation as %Th+ area in maximal projection images (MPI) shown in (B) (1 MPI per mouse; 3 mice/group).
(D) Fluorescence (OD 528/20) measurement of serum collected from Nav1.8DTA and control mice orally gavaged with FITC-dextran or vehicle (n=4–7 mice/group).
(E) Quantification of MUC2 thickness per measurement from Nav1.8DTA and control mice (20–30 measurements/mouse; n=12–14 mice/group).
(F) Schematic of live colonic explant system for mucus thickness measurement.
(G) Pooled distribution (in black and blue) of fluorescent beads on colonic explants from Nav1.8DTA and control mice (3–5 area/mouse; 3–4 mice/group). Smoothed curves (in cyan and red) were generated by averaging four neighbors of each distance.
(H-I) Traces (H) and quantification (I) of CNO (1 nM)- and vehicle (Krebs buffer)-induced calcium influx amplitude in KCl (40 mM)-responsive DRG neurons from Nav1.8hM3Dq and control mice (n=3/group).
(J) Whole-mount image of ileal tissue from Nav1.8hM3Dq mice stained for Nav1.8-mCitrine, EpCAM, and UEA-1.
(K-L) Flow cytometry plot (K) and quantification (L) of EpCAM+ epithelial cells showing % colonic MUC2+ goblet cells from Nav1.8DTA and control mice (n=4 mice/group).
(M) MUC2 and DAPI immunostaining for goblet cells in colon tissue from wildtype B6 mice.
(N-O) Quantification of colonic goblet cells per crypt (N) and per mouse (O) by MUC2 immunostaining from Nav1.8DTA and control mice (20–30 crypts/mouse; n=8–10 mice/group).
Scale bar=100 μm. One-way ANOVA in (D and I). Mann-Whitney test in (E and N). Student’s test in (C, L and O). Mean±SEM. ns=not significant, *p < .05, **p < .01, ***p < .001, ****p < .0001.
(A-B) Dot plot of average z-scored expression (color) of marker genes (rows) in each inferred cell type in colonic (A) and ileal (B) epithelial cells from control Nav1.8-Cre−DTAfl/− mice. (Dot size: percentage of cells in subset with positive expression of gene.)
(C) UMAP of scRNA-seq profiles of ileal epithelial cells from Nav1.8-Cre−DTAfl/− mice, colored by inferred cell type (left) or Ramp1 expression (right).
(D) Violin plot of Ramp1 expression in ileal epithelial cell subsets, based on published scRNA-seq data (Haber et al., 2017).
(E) UMAP of scRNA-seq profiles of colonic goblet cells from Nav1.8-Cre−DTAfl/− mice, colored by expression of the indicated receptors.
(F) t-distributed stochastic neighbor embedding (tSNE) plot of goblet cells (dots) sorted from the colon showing Ramp1 expression (left) and Calcrl expression (right) (Nystrom et al., 2021).
(G) Quantification of Ramp1 and Calcrl expression in goblet cells (red) and non-goblet epithelial cells (black) sorted from colon (Nystrom et al., 2021).
(H-I) In situ hybridization of Ramp1, Muc2 in mouse ileum (H) and RAMP1, MUC2 in human colon (transverse colon) (I).
(J) EpCAM, UEA1, and Calcrl staining of colon tissue from wild type mice.
(K) Quantification of colonic MUC2 thickness per mouse from Calcb+/+ and Calcb−/− mice (n=4–5 mice/group).
(L) Colonic goblet cell number per crypt per mouse from Calcb+/+ and Calcb−/− mice (10–20 crypts/mouse; n=4 mice/group).
(M) Colonic goblet cell number per crypt per mouse from Ramp1f/f and Ramp1Villin mice (10–20 crypts/mouse; n=5–8 mice/group).
(N) Nav1.8-tdTomato and CGRP staining of colon tissue from Nav1.8tdTomato mice.
(O) Tuj1 and CGRP staining of myenteric nerve preparations from Nav1.8DTA and control mice.
Scale bar=100 μm in H-J, N-O. Student’s t-test in (K-M). Mean±SEM. n.s.=not significant.
(A) CGRP levels released by cultured Nav1.8hM3Dq and control DRG neurons treated with CNO and vehicle.(n=4).
(B) CGRP levels in serum from CalcahM3Dq and control mice treated with CNO (1mg/kg) by i.p. injection for 10 minutes (n=9 per group).
(C) MUC2, 16S rDNA and DAPI staining of colon tissue from CalcahM3Dq and control mice treated with CNO (1mg/kg) i.p. for 10 minutes.
(D) Quantification of colonic MUC2 thickness per measurement (left) and per mouse (right) from mice in (C) (20–30 measurement/mouse, n=4–6 mice/group).
(E) AB/PAS staining of colon tissue from ThhM3Dq and control mice treated with CNO (1mg/kg) i.p. for 10 minutes.
(F) Quantification of colonic goblet cell mucus granule emptying by measurement of AB/PAS staining intensity per crypt (left) and per mouse (right) in mice from (E) (20–30 crypts/mouse, n=6–7 mice/ group).
(G-H) Whole-mount image of colonic tissue from Calca-GFP-DTR mice stained for CGRP-GFP and (G) MUC2 or (H) UEA-1.
(I) Whole-mount image of colonic tissue from vehicle or resiniferatoxin (RTX) pretreated Calca-GFP-DTR mice stained for CGRP-GFP, Tuj1, and UEA1.
(J) Quantification of mucus growth rate per area from wildtype colonic explants treated with vehicle or CGRP (100ng/ml) (n=3–5 area/mouse, 4 mice/ group).
(K) Quantification of colonic mucus thickness per measurement in wildtype B6 mice 10 minutes after CGRP (10μg/mouse) i.p. injection (20–30 measurements/mouse; n=7 mice/group).
(L) AB/PAS staining of colon tissue from Ramp1Villin and Ramp1f/f mice treated with either vehicle or CGRP (10μg/mouse) by i.p. injection for 10 minutes.
(M) Quantification of colonic goblet cell mucus granule emptying by AB/PAS staining intensity per crypt in mice from (L) (20–30 crypts/ mouse, n=3 mice/ group).
(N) AB/PAS staining of colon tissues from isotype or anti-CD90.2 antibody pretreated wild type mice followed by i.p. injection with vehicle or CGRP (10μg/mouse) for 10 minutes.
(O-P) Quantification of colonic goblet cell mucus granule emptying by AB/PAS staining intensity per mouse (O) or per crypt (P) in mice from (N) (20–30 crypts/ mouse, n=4–5 mice/ group).
Scale bar=100 μm in C, E, G, H, I, L, and N. One-way ANOVA in A, M, O and P. Mann-Whitney test in D (left panel, F (left panel) and K. Student’s test in B, D (right panel), F (right panel), and J. Mean±SEM. ns=not significant, *p < .05, **p < .01, ***p < .001, ****p < .0001.
(A) Pairwise weighted UniFrac distance analysis of the composition of bacterial communities in colon lumen contents (Lumen) and mucosal scrapings (Mucosa) within control group, and samples from Nav1.8DTA mice compared to control group (n=5–9 mice/group, PERMANOVA, ** q-values<0.005).
(B) UMAP plot of ileal epithelial cells, colored by inferred cell type, from Nav1.8DTA and control mice.
(C) Volcano plot highlights 172 differentially expressed genes (red) in ileal goblet cells from Nav1.8DTA versus control mice, based on thresholds (dotted lines) of |log2 fold change| > 0.2 and adj. P < 0.05.
(D) Violin plot of expression (y axis) of mucus machinery-related genes (x axis) in colonic goblet cells from Nav1.8DTA and control mice.
(E) AB/PAS staining of colon tissues from Nav1.8DTA and control mice.
(F) Quantification of colonic goblet cell mucus levels by measurement of AB/PAS staining intensity per crypt in mice from (E) (20–30 crypts/ mouse; n=3 mice/group).
(G) Mass spectrometry analysis of colonic mucus samples from Nav1.8DTA and control mice. 9 differentially expressed proteins (red) are identified (absolute value of log2 FC > 0.1 and adj. P < 0.05). Mucin genes Muc2 and Muc13 are highlighted in green.
(H) Mass spectrometry quantification of MUC2 and MUC13 protein levels from colonic mucus layers from Nav1.8DTA versus control mice (n=4 mice/group).
(I) Violin plot of expression (y axis) of mucin genes (x axis) in colonic goblet cells from Nav1.8DTA (red) and control (grey) mice.
(J) Western blot (top) and quantification (bottom) of MUC2 protein in colonic mucus layers from Nav1.8DTA and control mice (n=5 mice/group). Equal amount of total mucus protein from each sample was loaded.
(K) UMAP plot of colonic epithelial cells, colored by inferred cell type, from Ramp1Villin and Ramp1f/f mice.
(L) Dot plot shows average z-scored expression (color) of marker genes (columns) in each cluster (rows) of colonic epithelial cells from Ramp1Villin and Ramp1f/f mice.
(M) Volcano plot highlights 302 differentially expressed genes (DEGs, in red) in colonic goblet cells from Ramp1Villin and Ramp1f/f mice, identified based on thresholds (dotted lines) of |log2 fold change| >0.2 and adj. P < 0.05.
(N) Violin plot shows the distribution across colonic goblet cells of the average expression (x axis) of the DEGs, as in M, that intersect with each of the indicated enriched pathways (y axis, GO biological processes), for Ramp1Villin and Ramp1f/f mice.
Scale bar=100 μm in E. Mann-Whitney test in D, F, I and N. Student’s test in J (bottom). ns = not significant, *p < .05, ****p < .0001.
(A) Dot plot showing average z-scored expression of ER stress-related genes in goblet cells from Ramp1Villin and Ramp1f/f mice.
(B) Violin plot, analogous to Fig. S4N, for associated enriched pathways in enterocytes from Ramp1Villin and Ramp1f/f mice.
(C) Violin plot of expression (y axis) of mucus machinery-related genes (x axis) in colonic goblet cells from Ramp1Villin and Ramp1f/f mice.
(D) Venn diagram showing overlap in DEGs in goblet cells from Nav1.8DTA and Ramp1Villin mice compared to their respective controls.
(E) GO biological processes enriched in the subsets of the 108 shared DEGs (as in D) that are up- or down-regulated in goblet cells from Nav1.8DTA and Ramp1Villin compared to their controls.
(F) Dot plot showing average z-scored expression (color) for genes that are differentially expressed in both Nav1.8DTA and Ramp1Villin goblet cells, compared to their controls.
(G) Analogous to E, but for enterocytes from Nav1.8DTA and Ramp1Villin mice compared to control mice.
(H) Dot plot, analogous to F, for enterocytes from Nav1.8DTA and Ramp1Villin mice compared to control mice.
Mann-Whitney test in B and C. ns=not significant, *p < .05, ****p < .0001.
(A-D) Flow cytometry gating of colonic lamina propria immune cells (A-C) and intraepithelial lymphocytes (D).
(E) Immune profiling (% of CD45+ cells) of colonic lamina propria cells from Nav1.8DTA and control mice (n=9 mice/group).
(F) Immune profiling (% of CD45+ cells) of colonic lamina propria ILCs from Nav1.8DTA and control mice (n=9 mice/group).
(G) Immune profiling (% of CD45+ cells) of colonic intraepithelial lymphocytes from Nav1.8DTA and control mice (n=7 mice/ group).
(H) Image of colons from Nav1.8DTA and control mice at baseline.
(I) Colon length measurement of Nav1.8DTA and control mice at baseline (n=5 mice/group).
(J) H&E staining images of colons from Nav1.8DTA and control mice at baseline.
(K) Histology scoring per mouse of colon tissues from Nav1.8DTA and control mice at baseline (n=5 mice/group).
(L) Histology scoring per area of colon tissues from Nav1.8DTA and control mice 10 days after DSS treatment as in Figure 6B (4 areas/ mouse, n=4 mice/ group).
(M) Immune profiling of colonic lamina propria from mice (as in Fig. 6H) on day 10 post DSS treatment (n=6–7 mice/group) shown as %CD45+ cells. Left panel shows myeloid and adaptive cell populations. Right panel shows ILCs.
(N) Daily water consumption per mouse of Nav1.8DTA and control mice during 3.5% DSS treatment (n=7–9 mice/group).
Scale bar 100 μm in J. Multiple t-test in E-G, M-N. Mann-Whitney test in L. Student’s t-test in I and K. Mean±SEM. ns=not significant, **p < .01, ***p <.001.
(A) Colon length of RTX- and vehicle-pretreated mice treated with 2.5% DSS for 5 days (n=4 mice/group). Measurement on day 8 post DSS treatment.
(B) Image of colons from mice in (A).
(C) H&E staining images of colons from mice in (A).
(D) Histology scoring per area (left) and per mouse (right) of colon tissues from mice in (A) (4 areas/mouse, n=4–5 mice/group).
(E) Body weight of Ramp1Villin and Ramp1f/f mice treated with 3.5% DSS in drinking water for 5 days (n=5 mice/group).
(F)% Survival of Ramp1Villin and Ramp1f/f mice treated with 3.5% DSS in drinking water for 5 days (n=5 mice/group).
(G) AB/PAS staining images of colons from Ramp1Villin and control mice 8 days post 2.5% DSS treatment.
(H) Histology scoring per area of colon tissues from Ramp1Villin and control mice 8 days post 2.5% DSS treatment from Figure 6K. (4 areas/mouse, n=4 mice/group).
(I) Representative image of colons from Ramp1Villin and control mice at baseline.
(J) Colon length of Ramp1Villin and control mice at baseline (n=3 mice/group).
(K) Daily water consumption per mouse in Nav1.8hm3Dq and control mice during 3.5% DSS treatment (n=6 mice/group).
(L) AB/PAS staining images of colons from Nav1.8hm3Dq or control mice 8 days post 3.5% DSS treatment.
(M) Histology scoring per area (left) and per mouse (right) of colon tissues from mice in (K) (4 areas/mouse, n=6–9 mice/group).
(N) Principal coordinates analysis (PCoA) of weighted UniFrac distance measurements of colonic luminal microbiomes from Nav1.8hM3Dq and control mice 8 days after treatment with DSS (3.5%) plus CNO (0.5μg/ml) or vehicle (n=4–5 mice/group).
(O-P) Nav1.8hM3Dq and control mice were treated or untreated with DSS (3.5%) plus CNO (0.5μg/ml) in drinking water for 6 days and colon luminal contents were collected on day 8 for 16s rDNA sequencing analysis at family level (E) and genus level (F) (n=4–5 mice/group).
(Q) AB/PAS staining images of colons from Nav1.8DTA and control mice treated with CGRP (10μg/day) or vehicle during DSS colitis. Images from 8 days post 3.5% DSS treatment.
(R) Histology scoring per area of colon tissues from Nav1.8DTA and control mice treated with CGRP (10μg/day) or vehicle on day 8 post DSS treatment. (4 areas mouse, n=4 mice/group).
Scale bars: 100 μm in C and G; 200 μm in L and Q. Student’s t-test in A, D (right panel), J, and M (right panel). Mann-Whitney test in D (left panel), H, and M (left panel). Multiple t-test in E and K. Log-rank test in F. Two-way ANOVA in P. One-way ANOVA in R. Mean±SEM. ns=not significant, *p < .05, **p < .01, ***p <.001, ****p < .0001.
Table S1 Epithelial_cluster_de_markers_LR, related to STAR Methods
Table S2 DE_Genes_Nav1.8_DTA_Colon_per Cell Type(DESeq2) , related to STAR Methods
Table S3 DE_Genes_VillinRamp1_Colon_per Cell Type(DESeq2) , related to STAR Methods
Table S4 DE_Genes_Nav1.8_DTA_Ileum_per Cell Type (DESeq2) , related to STAR Methods
Table S5 Nav1.8_DTA and VillinRamp1_Colon_Enrichment, related to STAR Methods
Table S6 Common_VillinRamp1_Nav1.8_DTA_Colon LFC.2_UP_DOWN_Enrichment, related to STAR Methods
Video S1: Flowchart of mucus quantification, related to STAR Methods
Data Availability Statement
The accession number for the 16S sequencing data reported in this paper is: PRJNA803622. The accession numbers for the sc-RNA-seq data of intestinal epithelial cells reported in this paper are GSE208762 and GSE208594.
The code for mucus thickness quantification of ex vivo explant images can be found in the following repository: https://github.com/prajuvikas/Mucus_Quantification_v8_2022Jan. The code has only been tested on the images generated in this study, and optimization will be needed for other image analysis. Any additional information required to reanalyze the data reported in this work paper is available from the Lead Contact upon request.
Experimental Model and Subject Details
Mice
C57BL/6, B6.Rosa26-stop(flox)-DTA, Ai14 strain B6.Rosa26-stop(flox)-tdTomato, B6N;129-Tg(CAG-CHRM3*,-mCitrine)1Ute/J and Villin-Cre mice were purchased from Jackson Laboratories. Nav1.8-Cre mice were provided by J. Wood (University College London). Calca-GFP-DTR (McCoy et al., 2013) were provided by M. Zylka and E. McCoy (University of North Carolina). Calca−/− (Oh-hashi et al., 2001) mice were provided by V. Kuchroo (Harvard Medical School). Calcb−/− (Thompson et al., 2008) mice were provided by M. Rao (Boston Children’s Hospital). Germ-free mice were provided by J. Huh (HMS). Nav1.8-Cre+/+mice were crossed with B6.Rosa26-stop(flox)-tdTomato mice to generate Nav1.8-lineage neuron labeled mice (Nav1.8tdTomato) mice. For Nav1.8-lineage neuron depletion experiments, Nav1.8-Cre+/−mice were crossed with Rosa26-stop(flox)-DTA+/+ mice to generate Nav1.8-lineage neuron-depleted Nav1.8-Cre+/−; DTA+/− (Nav1.8DTA) mice and control Nav1.8-Cre−/−; DTA+/− (Ctrl) littermates. For gut epithelial cell specific Ramp1 depletion experiments, Villin-Cre+/− ;Ramp1fl/fl mice were bred to Ramp1fl/fl mice to generate mice with epithelial-specific depletion of Ramp1 in Villin-Cre+/− ;Ramp1fl/fl (Ramp1Villin) or control (Ramp1fl/fl) littermates. For Calca and Calcb deficient mouse experiments, heterozygous mice were bred together to produce wild-type and knockout littermates. For Nav1.8-lineage neuron activation experiments, Nav1.8-Cre+/−mice were crossed with B6N;129-Tg(CAG-CHRM3*,-mCitrine)1Ute/J mice to generate Nav1.8-lineage neuron activation DREDD Nav1.8-Cre+/−; hM3Dq+/− (Nav1.8hM3Dq) mice and control Nav1.8-Cre−/−; hM3Dq+/− (Ctrl) littermates. For Calca-lineage neuron activation experiments, Calca-Cre+/−mice were crossed with B6N;129-Tg(CAG-CHRM3*,-mCitrine)1Ute/J mice to generate CGRP-lineage neuron activation DREADD Calca-Cre+/−; hM3Dq+/− (CalcahM3Dq) mice and control Calca-Cre−/−; hM3Dq+/− (Ctrl) littermates.
Mice were bred and housed in a specific pathogen-free animal facility at Harvard Medical School (HMS). Age-matched 6- to 12-week-old littermate male and female mice were used for experiments. All animal experiments were approved by the HMS Institutional Animal Use and Care Committee.
Human intestinal tissue samples
Healthy human transverse colon biopsy tissue was obtained from a 20 year old female patient and human splenic flexure biopsy tissue was obtained from a 10 year old male patient, respectively, during diagnostic colonoscopy as part of routine clinical care under approved Boston Children’s Hospital Institutional Review Board Protocol P00027983. Biopsy samples were fixed in 10% Neutral Buffered Formalin, embedded in paraffin, and cut into 5–7μm sections for staining.
Method Details
DRG Isolation and culture
Mice were euthanized and DRGs were dissected and dissociated as previously described (Pinho-Ribeiro et al., 2018). DRG neurons were plated on laminin pre-coated 35mm culture dishes (2,000 cells/dish) in 50 ng/ml NGF in neurobasal media (ThermoFisher) and used for calcium imaging 24–48h after plating. For calcium imaging, cells were pre-loaded with Fura2-AM (5mM) in neurobasal media at 37 °C for 30min. Cells were washed twice and imaged in 2 ml Krebs buffer (Krebs-Ringer solution). After the addition of stimuli described below, images were acquired with alternating 340/380 nm excitation wavelengths, and fluorescence emission was captured using a Nikon Eclipse Ti inverted microscope. Ratio metric analysis of 340/380 signal intensities were processed, background corrected, and analyzed with NIS-elements software (Nikon) by drawing regions of interest (ROIs) around individual cells. Responses were measured as ΔF/F0 = [(F − F0)/F0], where F is the peak fluorescence signal and F0 is the mean fluorescence signal at baseline. Peak responses were included in the analysis if the response was 5 SDs above baseline. The percentage of responsive cells was quantified and plotted for the stimulus in question as a percentage of total (KCl responsive) neurons.
For fecal supernatant induced neuron activation, DRGs from wildtype B6 mice were cultured as above. Two fecal pellets from SPF or GF mice were collected, mashed, and resuspended in 1 ml Krebs-Ringer buffer. After filtering with a 70 μm cell strainer, the fecal mixture was centrifuged at 12000g for 10 minutes at 4 °C and the supernatant was collected for cell stimulation. After 10 min. of fecal supernatant or vehicle treatment, 1 μM capsaicin (Tocris) and 40 mM KCl (Sigma) were applied sequentially to identify TRPV1+ and live neurons, respectively. For Nav1.8+ neuron activation, DRGs from Nav1.8hM3Dq and control mice were cultured as above. Krebs-Ringer solution (vehicle), 0.1nM CNO or 1nM CNO was applied for 2 minutes. After vehicle or CNO application, 1 μM capsaicin and 40 mM KCl were applied sequentially to identify neuron activation as a percentage of live neurons.
CGRP release of DRG neuron cultures, colonic explants, and serum
DRG neurons were cultured as described above in a 96 well plate (5,000 cells per well) for one week. Media was aspirated and replaced with 200 μl fresh neurobasal media prior to stimulation. DRG neurons from wildtype B6 mice were stimulated with 1 μl fecal supernatant or 1 μM capsaicin for 1 hour at 37 °C with 5% CO2. DRG neurons from Nav1.8hM3Dq and control mice were stimulated with 1 nM CNO or vehicle for 1 hour at 37 °C with 5% CO2. 100 μl culture supernatant was collected for CGRP concentration measurement using a CGRP EIA Kit (Cayman Chemicals). For CGRP release from colonic explants, distal colons (3 cm each) from SPF, GF, SPF fecal-transplanted GF mice pre-treated with or without resiniferatoxin (RTX), and antibiotic-treated and untreated Nav1.8DTA and control mice were dissected and transferred into 24 well plate containing 500 μl DMEM. Explants were incubated for 1 hour at 32 °C with gentle shaking at 150 rpm. 100 μl explant culture supernatant was collected for CGRP concentration measurement using a CGRP EIA Kit (Cayman Chemicals). For antibiotic treatment, mice were treated with a cocktail of ampicillin (1 mg/ml), vancomycin (0.5 mg/ml), metronidazole (1 mg/ml), and neomycin (1 mg/ml) in the drinking water for three weeks.
For CGRP release in serum, blood was collected from naïve Nav1.8DTA and control mice, and CNO-treated CalcahM3Dq and control mice and centrifuged at 3000 rpm for 10 min. after coagulation. 50 μl serum was collected for CGRP concentration measurement using a CGRP EIA Kit (Cayman Chemicals).
3D Colonoid and 2D primary epithelial cell culture
Colonic organoids were derived from isolated crypts collected from the large intestine of wildtype C57BL/6J mice as previously described (Sato et al., 2011). Approximately 500 crypts were plated in a 50 μl drop of Matrigel in 24-well plates and overlaid with 500 μl of WENR medium, containing basal crypt media (Advanced DMEM/F12, penicillin/streptomycin, 10 mM HEPES, 2 mM Glutamine), supplemented with 1× B27 (Gibco, 17504–044), 1× N2 (Gibco,17502–048), 50 ng/ml rmEGF (Peprotech, 315–09), 50% L-WRN-CM (conditioned medium) (v/v), 10 μM Rock inhibitor Y-27632 (Sigma, Y0503), 3 μM CHIR99021 (Sigma, SML1046) with a final FBS concentration of 10%. Media was changed every 2 days and colonoids were split every 4 days. Cultures were passaged three times prior to experiments. For 2D monolayer cultures, colonoids were extracted from Matrigel with organoid harvesting solution (R&D system, 3700–100-01), and then digested with undiluted TripLE (Life Technologies, 1265010). Colonoid fragments were suspended in WENR medium and plated on collagen-coated (Sigma, C5533) 35mm glass bottom dishes (Cellvis, D35–20-1.5-N). To enrich primary epithelial cultures toward goblet cells, 12h after seeding, the media was changed into secretory cell differentiation medium containing basal crypt media (Advanced DMEM/F12, penicillin/streptomycin, 10 mM HEPES, 2 mM Glutamine), supplemented with 1× B27 (Gibco, 17504–044), 1× N2 (Gibco,17502–048), 50 ng/ml rmEGF (Peprotech, 315–09), 100ng/ml Noggin (Peprotech 250–38), 10% R-spondin1-CM (conditioned medium) (v/v), 10 μM g-Secretase Inhibitor DAPT (Sigma, D5942), 2 μM Wnt pathway inhibitor IWP-2 (Sigma, I0536) with a final FBS concentration of 10%. Media was changed on day 2 and differentiated cell monolayers were ready for experiments on day 4.
For granule release measurements, the cultured cells were preloaded with 10 mM Acridine Orange (AO) for 10 minutes and then treated with vehicle, CGRP (100ng/ml), or Carbachol (1μM) for 15 minutes and imaged in real-time on a widefield microscope (Thunder 3D Cell Culture, Leica) at 20X every 5 minutes. 2–5 areas from each dish were imaged and each area contained 100–200 cells. The total area of granules per cell was measured using FIJI. For intracellular MUC2 staining, the cultured cells were treated with vehicle, CGRP (100ng/ml), or Carbachol (1μM) for 15 minutes, and then fixed with 4% PFA, permeabilized with 0.1% Triton X-100 and stained for MUC2 as described below. The stained cells were imaged using a confocal microscopy at 63X and the intensity of MUC2 per cell were analyzed in FIJI.
Immunostaining of mucin
In vivo mucus layer thickness analysis was performed as described (Johansson and Hansson, 2012). Briefly, mice were euthanized and tissue from the distal ⅓ of the colon with fecal pellets was removed and fixed for 24–48h in methanol-Carnoy’s fixative at room temperature. Tissues were processed and paraffin-embedded without exposure to water to maintain mucus layer structure and integrity. 5 μm tissue cross-sections were heated at 60 °C for 10 min prior to incubation in xylene twice for 10 min, and then rehydrated with decreasing concentrations of ethanol (100, 95, 70, 50 and 30%) for 5 min each at room temperature. Antigen retrieval was performed by steaming samples in antigen retrieval solution (10 mM citric buffer, pH 6.0) for 15min and leaving samples in warm solution for an additional 20min. Samples were washed in PBS and blocked with 5% FBS in PBS for 30 minutes at 4 °C. Samples were stained for the mucus layer using an anti-MUC2 primary antibody and fluorescent secondary antibody. For FISH staining, sections were stained overnight at 50 °C with either 1 μg/ml nonsense control or eubacterial probe in hybridization buffer (20 mM Tris-HCl pH 7.4, 0.9M NaCl, 0.1% SDS, 0.5% formamide). Slides were incubated in FISH washing buffer (20 mM Tris-HCl pH 7.4, 0.9 M NaCl) at 50 °C for 10 mins, and then washed 3 times in PBS at room temperature. Samples were stained with DAPI, mounted with Prolong Antifade mounting medium, and sealed prior to imaging. Sections were imaged on a widefield microscope and mucus layer thickness was measured using FIJI. At least 20 measurements per tissue cross-section from at least 3 cross-sections were collected to determine average mouse mucus thickness measurements. Analysis was blinded.
Immunostaining of goblet cells
For microscopy analysis of goblet cell numbers and goblet cell maturation, mice were euthanized and ileum or distal colon pieces without fecal content were collected and fixed in either 4% PFA or methanol-Carnoy’s fixative for at least 24 hours at room temperature. Tissues were processed, paraffin-embedded, and cut into 5 μm sections. Tissue sections were processed as above for mucus layer analysis, blocked for 2 hours with 2% normal donkey serum, stained for MUC2 using an anti-MUC2 primary antibody and a fluorescent-conjugated secondary antibody. For goblet cell maturation staining, sections were additionally stained with fluorescent-conjugated UEA-1 (1μg/ml) during the secondary antibody staining. Samples were washed in PBS, stained with DAPI, and mounted prior to imaging. Sections were imaged on a confocal microscope and goblet cells per crypt were counted using FIJI. At least 10 full crypts were measured per to determine goblet cell numbers and maturation. Analysis was blinded.
H&E and AB/PAS staining analysis
For Ramp1 signaling blockade in vivo, the CalcahM3Dq and control mice were pretreated with either vehicle or BIBN4096 (0.3 mg/kg) by i.p. injection for 30 minutes. 10 minutes prior to euthanization, mice were treated with CNO (1 mg/kg) by i.p. injection. For CGRP injection, mice were treated with CGRP (10 μg/mouse) by i.p. injection for 10 minutes. Mice were euthanized and colon tissues were collected and fixed in 4% PFA for at least 24 hours prior to H&E (hematoxylin and eosin) and AB/PAS (Alcian blue/Periodic acid-Schiff) staining. Whole cross sections were scanned and imaged on a widefield microscope at 20X.
For H&E staining, images were analyzed using a scoring system as previously described (Koelink et al., 2018). Briefly, cross-sections were randomly split into 8 sections and 4 random sections were scored qualitatively using a 0–3 point scale for infiltrate, goblet cell loss, crypt density, crypt hyperplasia, muscle thickening, submucosal infiltrate, ulceration, and abscess. Scores from each item were combined for a composite score for each mouse. Scores from each section were averaged for each mouse. Scoring was performed blinded.
For AB/PAS staining intensity analysis, images were loaded into FIJI. After color deconvolution, Periodic acid-Schiff staining was converted to Lut-Grey-scale, inverted, and intensity measurement made. Goblet cell mucus content was determined by measuring the intensity of PAS signal in an individual full crypt in at least 20 crypts per section. Analysis was blinded.
RNAscope
For mouse Muc2 and Ramp1 RNAscope staining, ileums and colons were collected, embedded in OCT and frozen. 14μm sections were fixed with 4% PFA at 4 °C for 15 min and stained for Muc2 and Ramp1 using the RNAscope Multiplex Fluorescent Detection Kit (Advanced Cell Diagnostics) following the manufacturer’s instructions. Entire sections were imaged using a confocal microscopy at 20X and images were analyzed in FIJI.
For human MUC2 and RAMP1 RNAscope staining, 5 μm paraffin-embedded sections were deparaffinized, treated with hydrogen peroxide for 10 minutes, and boiled in RNAscope Target retrieval buffer for 15 minutes. The sections were then stained for MUC2 and RAMP1 using RNAscope Multiplex Fluorescent Assay v2 (Advanced Cell Diagnostics) following the manufacturer’s instructions. Entire sections were imaged using a confocal microscopy at 20X and images were analyzed in FIJI.
Ex vivo mucus analysis
Colon tissues were collected for explant culture and mucus imaging as previously described (Gustafsson et al., 2012). Briefly, the distal colon was collected, flushed with ice-cold oxygenated Kreb’s buffer and opened along the mesenteric border. After removal of the longitudinal muscle layer, the explant was mounted in a custom-made imaging perfusion chamber (https://github.com/mdanderson03/mucus_explant) where the apical chamber filled with Kreb’s buffer containing D-mannitol (10 mM) and the basolateral chamber was perfused with Kreb’s buffer containing D-glucose (10 mM) plus Celltrace Calcein Violet (Thermo Fisher) at a rate of 2 ml/min. 10 μl 1-μm-diameter fluorescent beads were gently added to the apical surface. The beads and explants were imaged in XY stacks (550 μm × 550 μm) using a Stellaris 8 FALCON CFS microscope (Leica) at a step size of 10 μm. Consistent with published studies, our approach relies on flushing the intestinal lumen prior to explant preparation, leading to removal of looser luminal mucus in our studies.
For CGRP-induced mucus growth analysis, the basal mucus layer on the explant surface was gently removed by cotton swabs under a dissection scope before mounting into the chamber. CGRP (100 ng/ml) was added into perfusion buffer, and the mucus growth was recorded for 30 minutes. 3~5 fields from each explant were captured for the following analysis.
The relative distribution of beads to colonic explant surface was measured in ImageJ (https://github.com/prajuvikas/Mucus_Quantification_v8_2022Jan) for mucus thickness analysis. Briefly, the distances of the lowest beads to the surface of explant after tissue smoothening were measured. The mucus thickness of each field was measured by the mode distance of the lowest beads (see Video S1).
Whole mount immunostaining
Mice were euthanized and perfused with 30 ml PBS, and distal colons and distal ileums were collected for staining. Colons with intact mesenteric nerves were dissected for immunostaining of extrinsic innervation. The intestines were opened and fixed in a Silgard dish with 4% PFA at 4°C overnight. After blocking, tissues were dissected into small pieces (3 mm ×3 mm) and incubated with primary antibody (rabbit anti-MUC2, 1:500; rat anti-EpCAM, 1:500; rabbit anti-CGRP, 1:500; goat anti-mCherry, 1:500; chicken anti-GFP, 1:500; rabbit anti-Tyrosine Hydroxylase, 1:500; UEA-1, 1:1000) in PBST (1% Triton-X100/PBS) for 3 days followed by secondary antibody staining in PBST for 2 days. After dehydration with serial (50%, 80%, 100%) methanol solution and clearing in BABB buffer (1 volume Benzyl Alcohol to 2 volume Benzyl Benzoate), the pieces were mounted on glass slides using vacuum grease for imaging. Three different fields of each tissue were imaged with a 1 μm z-stack step size and 3D image was built in Stellaris 8 FALCON CFS system (Leica).
Intestinal epithelial cell and immune cell isolation
Intestinal epithelial cells were isolated as previously described (Jarret et al., 2020). Briefly, distal colon and distal ileum were collected from euthanized mice and flushed with ice cold PBS. Colons and ileums were cut into 0.5cm pieces and incubated on ice for 5 min in 10 mL of PBS containing 5 mM EDTA and 1 mM DTT. After shaking, the intestinal pieces were incubated at 37 °C for 10 minutes in PBS containing 5 mM EDTA and 2% FBS. After vigorous shaking, the wash containing crypts was collected. This step was performed three times in total for colonic pieces and two times for ileal pieces with the epithelial fraction collected at the end of each wash. The crypt cells were pelleted and digested with 10 ml HBSS containing 8 mg Dispase II (Sigma) for 10 minutes at 37 °C. Single epithelial cells were collected in PBS containing 2% FBS for flow cytometry staining. For lamina propria immune cell isolation, colonic pieces after removal of crypts as described above were digested in 10 mL of RPMI containing 2% FBS, 1 mg/ml Collagenase VIII (Sigma) and 100 U/ml DNase I (Sigma) for approximately 60 min at 37 °C with shaking. The digested tissue was filtered by a 40 μm strainer and subjected to Percoll (GE) separation using an 80% and 40% gradient. Immune cells were harvested from the interphase of the Percoll gradient after a spin at 2500 rpm for 20 min at 4 °C. Cells were resuspended in PBS containing 2% FBS for flow cytometry staining.
For intraepithelial lymphocytes (IELs) isolation, the wash containing crypts and IELs as described above was pelleted and subjected to Percoll gradient. IELs were collected from the interphase after centrifuge. Cells were resuspended in PBS containing 2% FBS for flow cytometry staining.
Flow cytometry
Cells isolated above were stained with surface antibody at 1:250 on ice for 20 minutes in flow buffer (2% FBS, 2 mM EDTA in PBS) and washed twice with flow buffer. For intracellular staining (mouse anti-IL17A PE, mouse anti-IFN gamma APC or rabbit anti-MUC2), cells were permeabilized and stained using a Fixation/Permeabilization kit (BD) according to the manufacturer’s instructions. For transcription factor staining (mouse anti-FOXP3 Alexa Fluor 488, mouse anti-RORgt APC, mouse anti-GATA3 PE), a Transcription factor staining buffer set (eBioscience) was used according to the manufacturer’s instructions. Data were acquired on a Cytoflex S flow cytometer (Beckman Coulter) and analyzed in Flowjo v10. Single epithelial cells (CD45−EpCAM+) were sorted by FACSAria (BD) and resuspended HBSS containing 0.01% BSA (Ambion #AM2616) for downstream single cell sequencing.
ILC depletion
ILCs were depleted as previously reported (Sonnenberg et al., 2012). Briefly, mice were treated twice with anti-CD90.2 mAb (BioXCell) every three days at a dose of 300 μg/mouse and used for the following experiments one week after injection.
10X scRNA-seq of colon
scRNA-seq of colonic epithelial cells isolated from Nav1.8DTA, Ramp1Villin and littermate control mice was performed using 10x Genomics Chromium Next GEM Single Cell 3’ Reagent Kit v3.1 (10X genomics) following the user guide. Briefly, cells were counted on the LUNA-FX7 Automated Cell Counter (Logos Biosystems) using fluorescence detection for viability with an acridine orange/propidium iodide stain (Logos Biosystems). All samples had viability greater than 88% with concentration ranges from ~700–900 cells/μL. After counting, all samples were loaded into Chip G per the user guide from 10x Genomics. GEMs (Gel Beads-in-emulsions) were formed targeting 10,000 cells for each sample followed by immediate reverse transcription. The cDNA was cleaned from the GEM reagents, amplified for a total of 11 cycles and verified via TapeStation (Agilent Technologies). Amplified cDNA was diluted 1:6 and run on the 4200 TapeStation instrument using High Sensitivity D5000 tape and reagents (Agilent Technologies). The amplified cDNA was fragmented, end repaired, and A-tailed followed by adaptor ligation, and PCR amplification was run for a total of 11 cycles with each sample receiving a unique set of dual indices. Final libraries were diluted 1:10 and ran using the High Sensitivity D5000 tape and reagents on the 4200 TapeStation (Agilent Technologies). Libraries were quantified via Kapa qPCR using the Complete Universal Kit (Roche Sequencing Solutions) and the CFX96 Touch Real-Time PCR Detection System (Bio-Rad Laboratories). Libraries were sequenced on an Illumina NovaSeq S4 flow cell across one single lane (estimated reads per cell ~55,000) using the parameters outlined in the user guide (Read1: 28 bp, i7 index: 10 bp, i5 index: 10 bp, Read2: 90 bp). After sequencing, Cell Ranger count QC summary report identified between 12,000–14,000 single cells in the samples.
inDrops scRNA-seq of ileum
scRNA-seq of ileal epithelial cells isolated from Nav1.8DTA (three mice pooled together) and their littermate control (three mice pooled together) mice was performed using inDrops single cell sequencing following the user guide. Briefly, cells were encapsulated in droplets following a previously described protocol (Klein et al., 2015; Zilionis et al., 2017), with the following modifications in the primer sequences. RT primers on hydrogel beads-5’CGATTGATCAACGTAATACGACTCACTATAGGGTGTCGGGTGCAG [bc1,8nt] GTCTCGTGGGCTCGGAGATGTGTATAAGAGACAG[bc2,8nt]NNNNNNTTTTTTTTTTTTTTTTTTTV- 3’ PCR primer sequences (steps 157 and 160 in the library prep protocol in (Zilionis et al., 2017))-5’-AATGATACGGCGACCACCGAGATCTACACXXXXXXXXTCGTCGGCAGCGTC-3’, where XXXXXX is an index sequence for multiplexing libraries. 5’- CAAGCAGAAGACGGCATACGAGATGGGTGTCGGGTGCAG-3’ With these modifications in the primer sequences, custom sequencing primers are no longer required. The library prep protocol used here was based on Smart-seq2 (Picelli et al., 2014) with modifications. The workflow of the library preparation can be summarized as follows: Reverse transcription with Maxima H minus RTase at 50°C for 60 min -> cleanup with SILANE beads -> template switching reaction with Maxima H minus RTase -> SPRI purification -> cDNA amplification -> SPRI purification -> DNA fragmentation, end repair and A-tailing -> adapter ligation -> SPRI purification -> library enrichment PCR -> double-sided SPRI purification. Referring to the detailed protocol in (Picelli et al., 2014), the following modifications were made to the protocol: Reverse transcription and template-switching were decoupled, where reverse transcription occurred within the droplet, while template-switching was not. cDNA was fragmented enzymatically here followed by adapter ligation, as opposed to tagmentation in (Picelli et al., 2014). Sequence of the adapters are as follows- 5’-CTGTCTCTTATACACATCTGACGCTGCCGACGA- 3’ (with 5’ phosphorylation) 5’-AGATGTGTATAAGAGACAG*T- 3’ (with phosphorothioate bond on the 3’ terminal nucleotide). The barcoded library was sequenced as described above.
TRPV1 nociceptor neuron ablation
Systemic nociceptor neuron was ablated as previously described (Lai et al., 2019). Briefly, 4-week-old C57BL/6 mice were anesthetized with isoflurane and injected subcutaneously in the flank with escalating doses (30, 70, 100 μg/kg on consecutive days) of resiniferatoxin (RTX, Alomone Lab) or vehicle (2% DMSO/0.15% Tween-80/PBS). Mice were allowed to rest for 4 weeks before experiments. Loss of nociceptor neurons was confirmed by reduced thermal responses to noxious heat during hot plate tests (55 °C).
DSS induced colitis
Briefly, 6- to 12- week-old gender-matched mice were given dextran sodium sulfate (DSS) (MP Biomedicals) in drinking water for the indicated days, followed with regular water. All mice were treated with 3.5% DSS, with exception of Ramp1Villin and their littermate control mice which were treated with 2.5% (Fig. 6K–O, Fig. S7G–H) and 3.5% DSS (Fig. S7E–F). The mice were weighed daily and sacrificed on the indicated time points. Colon tissues were obtained for histopathological analysis.
Gut permeability assay
A gut permeability assay was performed as previously described (Nalle et al., 2019). Briefly, mice were fasted for 3 hours before oral gavage of 600 mg/kg FITC–4-kDa dextran (Sigma). Serum was collected 4 hours after gavage and analyzed using a Synergy HT plate reader (Bio-Tek) with 485 nm excitation and 528 nm emission.
Osmotic pump implantation
Mice were anesthetized by isoflurane and the skin between the scapulae was shaved. A small incision (0.5 cm in length) was made in the skin between the scapulae, and a small pocket was formed by spreading the subcutaneous connective tissue apart using a forceps. The osmotic pump (Alzet) filled with CGRP (10 μg/day) or vehicle was inserted into the pocket. Following implantation, the skin incision was closed with surgical glue.
Visceromotor response (VMR) assay
Visceral pain was measured by visceromotor response to colorectal distension (CRD) as previously described (Larauche et al., 2010). Briefly, a miniaturized pressure sensor and a custom-made balloon (1 cm × 2 cm) was tied together with a pressure transducer catheter (825–0101 Mikro-Cath; Millar Instruments) to form a “balloon-pressure sensor”. After calibration under certain pressures and lubrication, the “balloon-pressure sensor” was inserted into the colorectum of anesthetized mice placed in a mouse restrainer. Three rounds of serial pressures (15, 30, 45, and 60 mmHg, 10 s duration, 4 min interval) was administered to each mouse followed by three repeated noxious colorectal distensions at 60 mmHg (10 s duration, 4 min interval) using a barostat (Distender Series IIR; G&J Electronics Inc), and voltage output was then converted to pressure using the digital analog convertor (Micro 3–1401; Cambridge Electronic Design) and Spike 2 software (CED, Ltd.). The VMR was calculated by the increase of intraluminal colonic pressure in response to CRD in Spike 2.
16S rDNA sequencing and data analysis
To analyze the microbiome of colon lumen contents, 2–3 colon pellets from each mouse were collected and frozen at −20 °C until use. To collect colonic mucosal scrapings, colons were longitudinally opened in a sterile dish and scraped with 1 ml PBS. Bacterial genomic DNA from frozen stool samples was extracted using QIAamp DNA Stool Mini Kit (QIAGEN). Purified DNA was quantified by Qubit dsDNA HS Assay (Thermo Fisher Cat# Q32854) and normalized. Amplicons were purified and quantified by Qubit dsDNA HS Assay and combined with equal mass to make a pooled library. The pooled library was multiplexed sequenced (Illumina MiSeq, 251 nt × 2 pair-end reads with 12 nt index reads) through the Harvard Biopolymer’s Facility. Raw sequencing data were processed with QIIME2. In brief, raw sequencing data were imported to QIIME2 and demultiplexed, then DADA2 was used for sequence quality control and feature table construction. The feature table was used for beta diversity analysis, taxonomic analysis, and differential abundance testing using QIIME2. Beta group significance was determined by permutational analysis of variance (PERMANOVA). Identification of taxa associated with different groups was determined using Analysis of Composition of Microbiomes (ANCOM).
Western blot of MUC2
Mucus samples were collected by scraping as described above. After quantification by BCA protein assay (Thermo Scientific cat#23227), equal amounts of protein were enriched by methanol and chloroform precipitation and resuspended with 1X Laemmli buffer (Bio-Rad) followed by incubation on a 95° heat block for 10 minutes. Samples were loaded on Bolt 4–12% Bis-Tris-Plus gels (Thermo Scientific cat# NW04125BOX), and gels were transferred to nitrocellulose iBlot 2 membranes (Fisher Scientific cat# IB23001), blocked with 5% Pierce Clear Milk Blocking Buffer (Thermo Scientific cat# 37587) for 30 minutes, washed 3x with TBST (TBS, 0.05% Tween-20), and incubated in blocking buffer containing MUC2 antibody (1:500) at 4° overnight. After washing 3x with TBST for 10 min, membranes were incubated with IR-fluorophore conjugated secondary antibody (LI-COR Biosciences cat# 926–32213) for 1h at RT, followed by three additional 10 min washes with TBST and imaged on a Li-COR imaging system.