Significance
Multiple sclerosis (MS) is a debilitating autoimmune disease that can lead to paralysis. We demonstrate that an antigen-specific microparticle treatment can reverse hind limb paralysis when administered in advanced experimental autoimmune encephalomyelitis (EAE). Single-cell RNA sequencing and flow cytometry analysis provide evidence that the treatment acts by diminishing antigen (Ag) presentation in antigen presenting cells (APCs), including B cells in the central nervous system (CNS) and the draining lymph nodes. Thus, the antigen-specific dual-sized microparticle treatment is a promising therapy even in advanced EAE and potentially MS.
Keywords: immunotherapy, PLGA microparticles, multiple sclerosis, single-cell transcriptomics, antigen specific
Abstract
Antigen-specific therapies hold promise for treating autoimmune diseases such as multiple sclerosis while avoiding the deleterious side effects of systemic immune suppression due to delivering the disease-specific antigen as part of the treatment. In this study, an antigen-specific dual-sized microparticle (dMP) treatment reversed hind limb paralysis when administered in mice with advanced experimental autoimmune encephalomyelitis (EAE). Treatment reduced central nervous system (CNS) immune cell infiltration, demyelination, and inflammatory cytokine levels. Mechanistic insights using single-cell RNA sequencing showed that treatment impacted the MHC II antigen presentation pathway in dendritic cells, macrophages, B cells, and microglia, not only in the draining lymph nodes but also strikingly in the spinal cord. CD74 and cathepsin S were among the common genes down-regulated in most antigen presenting cell (APC) clusters, with B cells also having numerous MHC II genes reduced. Efficacy of the treatment diminished when B cells were absent, suggesting their impact in this therapy, in concert with other immune populations. Activation and inflammation were reduced in both APCs and T cells. This promising antigen-specific therapeutic approach advantageously engaged essential components of both innate and adaptive autoimmune responses and capably reversed paralysis in advanced EAE without the use of a broad immunosuppressant.
Multiple sclerosis (MS) is an autoimmune disease where infiltrating immune cells destroy the myelin sheath surrounding axons, leading to defunct neuronal signaling (1, 2). Proinflammatory T helper type 1 (Th1) and Th17 cells are two of the critical drivers of disease pathology via the production of neurotoxic cytokines. These cytokines include granulocyte-macrophage colony-stimulating factor (GM-CSF) and interleukin-17α (IL-17α) (3–5). This pathology is consistent in both human disease and a mouse model of MS, known as experimental autoimmune encephalomyelitis (EAE) (6). The model used in this study is informative for primary progressive EAE and is commonly conducted for ∼30 d post-EAE induction (7).
MS does not have a cure, and treatments are largely ineffective or involve systemic immune suppression. Broad-spectrum immunosuppressants are not viable for long-term disease management due to off-target effects, inconsistent disease control, and vulnerability to opportunistic infections (8–10). Other treatments such as glatiramer acetate and interferon-β (IFN-β) are not broadly immunosuppressive but do not slow disease progression (11, 12). B cell depletion with anti-CD20 therapy (ocrelizumab) is the only current treatment that slows disease progression (13), despite MS pathology being generally believed to be T cell mediated. Thus, MS has a complex pathology with multiple potential therapeutic targets.
To alleviate concerns related to generalized immune suppression, biomaterials fabricated as nano- and microparticles (MPs) can coencapsulate or codeliver immunomodulatory factors together with specific antigens (Ags) and provide a peripheral tissue–localized targeted therapeutic. Particle-based approaches for EAE have been reviewed (14), with several formulations delivering auto-Ag to reprogram the immune response in autoimmune diseases (15–17). To this end, we employed a dual-sized MP (dMP) system to treat EAE in an Ag-specific manner using disease Ag–loaded MPs in combination with MPs encapsulating factors for immune cell recruitment and induction of a suppressive phenotype (18–23). The dMP system utilizes four different polylactic–coglycolic acid MPs of two different sizes, capitalizing on the size limit of phagocytosis to direct the targeted localization of immunomodulatory factors. The two nonphagocytosable MPs (∼50 µm) encapsulate GM-CSF and transforming growth factor-beta one (TGF-β1), while the two phagocytosable (∼1 µm) MPs encapsulate Vitamin D3 (VD3) and the disease-relevant Ag, myelin oligodendrocyte glycoprotein35–55 (MOG). The control formulation contains the nonspecific peptide Ag ovalbumin323–339 (OVA). When used in the dMP formulation and injected into peripheral tissue, GM-CSF acts as a recruitment chemokine and dendritic cell (DC) growth factor, while TGF-β1 and VD3 create a suppressive phenotype in recruited cells (24–27). Our previous work showed that subcutaneous injection of dMP treatment before disease onset blocks EAE progression, partly due to a reduction in pathogenic T cells in the central nervous system (CNS).
The present study employs the dMP MOG therapy administered in advanced EAE, with complete hind limb paralysis. Treatment with dMP MOG reversed paralysis, but the nonspecific Ag dMP OVA failed to have therapeutic efficacy. The dMP MOG treatment resulted in reduced demyelination and cellular infiltration in the CNS and lowered levels of proinflammatory cytokines, including GM-CSF, IL-1β, IL-6, TNF-α, and IL-17α. Mechanistic transcriptomic analysis by single-cell RNA sequencing (scRNAseq) revealed a decrease in MHC II processing and presentation by antigen presenting cells (APCs), including by B cells, both in the draining LNs and in the spinal cord, and additionally by microglia in the spinal cord.
Results
MP Characterization.
MP sizes were appropriate for MPs with intracellular receptors to be delivered intracellularly and factors with extracellular receptors to be delivered extracellularly (SI Appendix, Fig. S1A). VD3, OVA, and MOG MPs had diameters of 1.6 ± 0.93, 0.80 ± 0.41, and 2.5± 1.2 μm, respectively (SI Appendix, Fig. S1 A and C), while TGF-β and GM-CSF MPs had diameters of 30 ± 13 and 36 ± 18, respectively (SI Appendix, Fig. S1 A and C). Of note, the polydispersity index (SD/mean quantity squared) for all MPs was below 0.4, showing that size distributions were not bimodal (SI Appendix, Fig. S1C). The encapsulation efficiencies are consistent with previous work with VD3, OVA, and MOG MPs having values of 76 ± 1.6, 48 ± 7.1, and 38 ± 3.5, respectively (SI Appendix, Fig. S1C). The nonphagocytosable MPs were in a similar range, with TGF-β MPs having an encapsulation efficiency of 44 ± 9.3 and GM-CSF MPs having a value of 69 ± 7.8 (SI Appendix, Fig. S1C). Release kinetics of these MPs were consistent with previous work from with the dMP formulation (20). The VD3, OVA, GM-CSF, and TGF-β MPs released 64%, 56%, 63%, and 56%, respectively (SI Appendix, Fig. S1B), while MOG MPs released 34% of factor over 30 d (SI Appendix, Fig. S1B).
Ag-Specific dMP MOG Formulation Administered in Mice with Advanced EAE Reversed Hind Limb Paralysis.
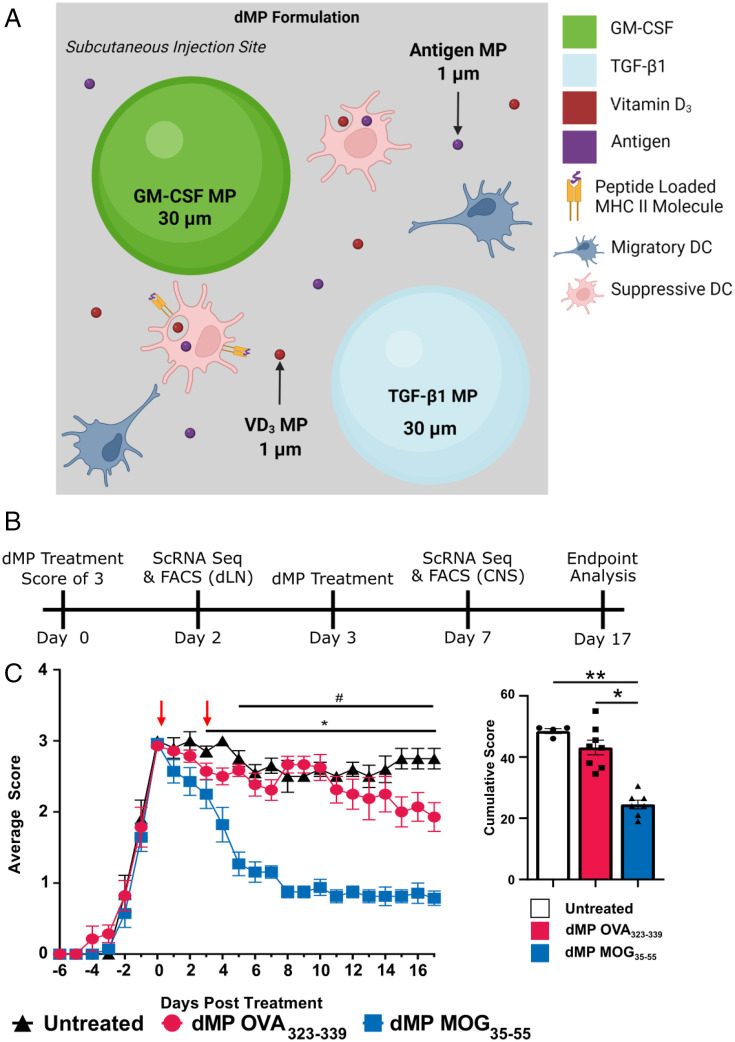
Given the success of the Ag-specific dMP MOG treatment before disease onset (18), we administered subcutaneously two doses of the dMP treatment in advanced EAE, namely, the first when mice reached complete hind limb paralysis (score of 3) and the second 3 d later (Fig. 1B). Ag-specific dMP MOG formulation, but not dMP OVA treatment, reversed disease progression to an average score of 1 (limp tail) for over 10 d posttreatment initiation and overall diminished cumulative scores (Fig. 1C), demonstrating the requirement for disease-relevant Ag. The dMP OVA-treated group scores were consistent with untreated EAE mice (Fig. 1C), indicating no impact on disease by the immunomodulatory factors when coadministered with irrelevant Ag, emphasizing the importance of specific Ag in the treatment. Notably, treatment was only administered twice, thus providing a significant value over other EAE treatments that require more frequent, often daily, administration for prolonged periods (28–32). Thus, dMP MOG treatment, but not a nonspecific Ag formulation, is highly effective at reversing hind limb paralysis when administered in advanced EAE.
Fig. 1.
dMP MOG subcutaneous treatment in advanced EAE reverses hind limb paralysis and shows lasting efficacy. (A) dMP schematic showing the MPs at the subcutaneous injection site. (B) Timeline of treatments and analysis. (C) EAE score curve and cumulative scores following subcutaneous dMP injection initiated at a score of 3 (complete hind limb paralysis) with a second injection 3 d later. Clinical scores from 0 to 4 are as follows: 1, limp tail; 2, weak hind limbs; 3, hind limb paralysis; and 4, complete hind limb paralysis and partial hind limb paralysis. Scoring took place every other day until the first mice showed scores, at which point scoring took place daily. The cumulative score took the sum of the scores following treatment and represents the disease severity over the course of the experiment. Score curves were representative of three experiments. n = 4 to 5/group in each experiment; *P < 0.05, comparing untreated and dMP MOG–treated mice. #P < 0.05, comparing dMP OVA and dMP MOG–treated mice. **P < 0.01.
dMP MOG Treatment Reduced Immune Cell Infiltration, Demyelination, and Inflammatory Cytokines in Mice with Advanced EAE.
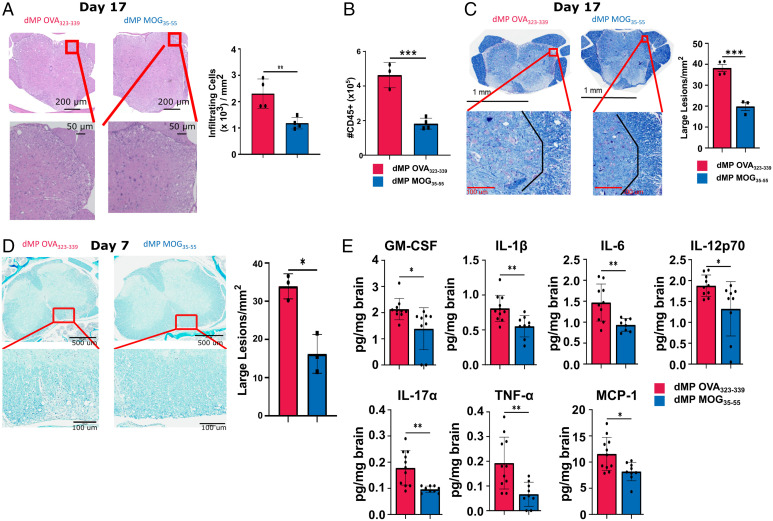
Histopathology and flow cytometry analyses of the lumbar spinal cord on day 17 posttreatment showed reduced immune cell infiltration in mice treated with dMP MOG compared to dMP OVA (Fig. 2 A and B). In addition, demyelination and large lesions were concomitantly decreased on both days 7 and 17 following dMP MOG treatment compared to dMP OVA (Fig. 2 C and D).
Fig. 2.
dMP MOG treatment in advanced EAE reduced demyelination, immune infiltration, and inflammatory cytokine levels in the CNS. Mice were induced with EAE and treated at a score of 3, as indicated in Fig. 1B with a second injection 3 d later. (A) Representative images of hematoxylin and eosin–stained sections, and quantification of infiltrating immune cells in the lumbar spinal cord on day 17 posttreatment. Cells were counted and normalized to the area to calculate cells/mm2. n = 4/group. (B) Quantification of CD45+ CNS infiltrates by flow cytometry on day 17 posttreatment. n = 3 to 4/group. (C) Representative images, and quantification of demyelination using luxol fast blue staining in the lumbar spinal cord on day 17 posttreatment. Lesions were counted and those with an area >400 µm2 were classified as a large. n = 3 to 4/group. (D) Representative images and quantification of demyelination using luxol fast blue staining in the lumbar spinal cord on day 7 posttreatment. n = 3. (E) Luminex xMAP technology for multiplexed quantification of mouse cytokines, chemokines, and growth factors from complete brain homogenate at a concentration of 4 mg/mL on day 7 post treatment. n = 8 to 11. d, days post treatment; *P < 0.05; **P < 0.01.
Further evaluation of CNS inflammatory cytokines, known to be associated with MS or pathogenic Th17 cells (1, 3–5), revealed reduced levels of GM-CSF, IL-1β, IL-6, IL-12p70, IL17α, TNF-α, and MCP-1 (CCL2) in dMP MOG–treated mice (Fig. 2E). Notably, GM-CSF, IL-17α, and TNF-α are produced by Th17 and Th1 cells, which are the primary pathogenic T cells in MS (33, 34), while IL-6 and IL-1β promote Th17 cell differentiation (35). Increased MCP-1 is known to promote trafficking to the CNS (36). Other cytokines, including IFN-γ or anti-inflammatory IL-10, did not show differences (SI Appendix, Fig. S2). Thus, the dMP MOG formulation administered in advanced EAE greatly reduced the hallmarks of MS pathology, namely, demyelination, immune cell infiltration, and inflammatory cytokine levels in the CNS.
Common and Distinct Immune Cell Clusters Were Identified in the dLNs and Spinal Cord of Mice with Advanced EAE Treated with dMP MOG versus dMP OVA.
To further determine the mechanisms of action of the dMP MOG treatment, scRNAseq was conducted in the draining inguinal lymph nodes (dLNs) and the spinal cord on day 2 and day 7, respectively, posttreatment initiation (Fig. 1B). Sequencing was conducted on total CD45.2 cells from the spinal cord. However, given the reduced frequencies of CD11b+ CD11c+ and CD11b+ CD11c− populations in the dLNs, in order to improve the sensitivity for these two groups, immune cells were sorted into four populations, as follows: 1) TCR-β+, 2) CD19+ , 3) CD11b+ CD11c+, and 4) CD11b+ CD11c−. They were further recombined to a 1:1:2 ratio with approximately equal proportions of population 3 and 4. When there were not enough cells from population 3 additional cells from population 4 were added so that 50% of the cells were a combination of population 3 and 4.
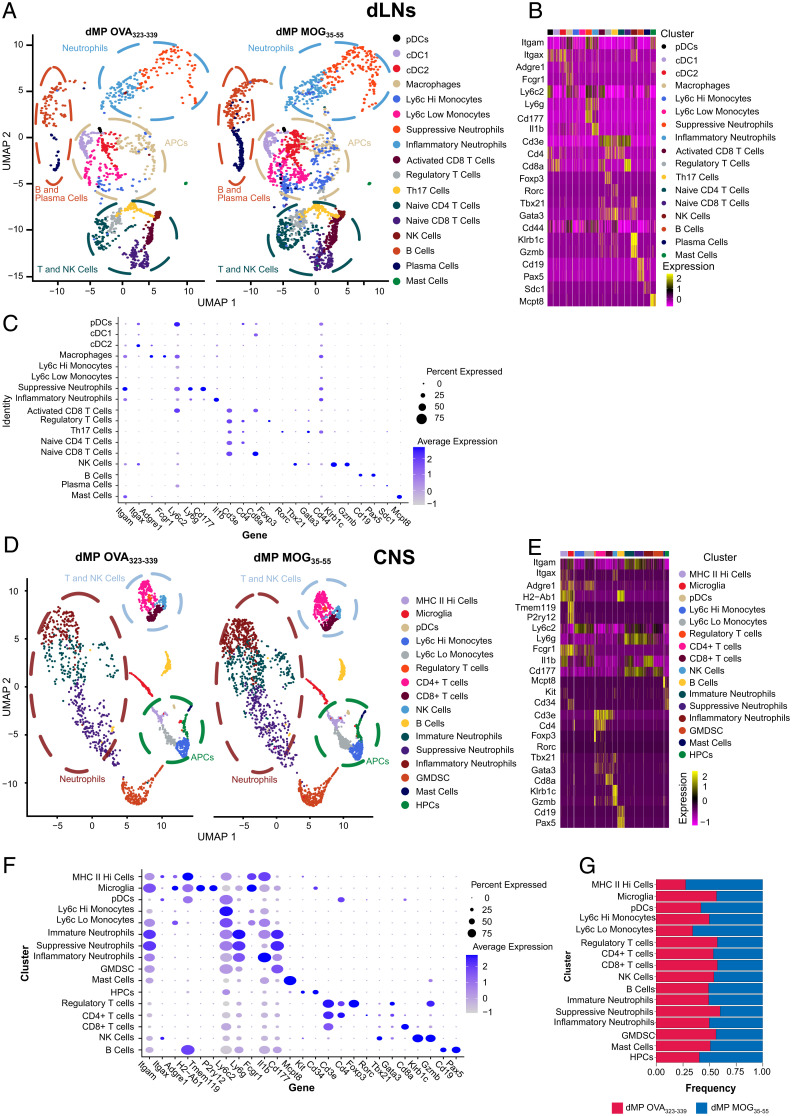
Cluster definition using Seurat analysis (37) and transcriptomic signatures of hallmark genes identified 18 distinct immune cell clusters in the dLNs and 16 in the spinal cord (Fig. 3 A and D). Many clusters overlapped between the dLNs and spinal cord, with tissue-specific clusters as well. APCs in the dLNs included one macrophage and three DC clusters (pDCs, cDC1s, cDC2s), while the spinal cord had pDCs, microglia, and MHC IIHigh cells (Fig. 3 B, C, E, and F). MHC IIHigh cells comprised both Itgaxhi Adgre1lo or - (DCs) and Adgre1hi cells, primarily macrophages (Fig. 3 E and F). Tmem119 and P2ry12 defined the microglial cluster (Fig. 3 E and F). Additionally, both the dLNs and spinal cord had Ly6cHi and Ly6cLo monocytic clusters (Fig. 3 B, C, E, and F). However, dLNs comprised only inflammatory and suppressive neutrophils, identified by the hallmark genes IL-1β and Cd177, respectively, while the spinal cord contained an additional cluster, namely, an immature neutrophil cluster (Fig. 3 B, C, E, and F).
Fig. 3.
dLNs and CNS scRNAseq cluster identification in mice with advanced EAE treated with dMP MOG versus dMP OVA subcutaneously. (A) Side-by-side uMAP plot showing clusters in dLNs of dMP OVA and dMP MOG spinal cord on day 2. Each dot represents an individual cell where ∼10,000 cells were analyzed per group with plots down-sampled to present more distinct clusters. Circles highlight the location of distinct cell types including cDC1s, cDC2s, neutrophils, T cells, and natural killer (NK) cells. Clustering utilized Seurat for initial clustering and then hallmark genes to remove nonbiologically relevant clusters. (B, C) Hallmark genes used to identify each cluster. (D) Side-by-side uMAP plot showing clusters in dMP OVA and dMP MOG spinal cord. Cells were collected from one mouse in each treatment group on day 7 at a score of 3 (Fig. 1B). Each dot represents an individual cell where ∼10,000 cells were analyzed per group with plots down-sampled to clusters more distinctly. Circles highlight the location of distinct cell types including MHC IIhigh cells, microglia, neutrophils and T cells, and NK cells. Clustering utilized Seurat for initial clustering and then hallmark genes to remove over clustering. (E, F) Hallmark genes used to identify each cluster. (G) Fractions of each cluster following post–sort recombination as a comparison between dMP OVA and dMP MOG35–55. GenesI are grouped to form a diagonal of cell type and hallmark genes on the dot plot. GMDSC, granulocytic myeloid derived suppressor cells; HPC, hematopoietic precursor cells.
Within the T cell clusters, dLNs contained both activated (Cd44+) and naive CD8+ T cells (Fig. 3 A–D), while in the spinal cord, all CD8+ T cells were Cd44+ (Fig. 3 E and F). The dLN CD4+ T cell clusters comprised naive CD4+, Th17, and T regulatory (Treg) cells (Fig. 3 B and C), while in the spinal cord, only CD4+ and Treg cells were identified (Fig. 3 E and F). The spinal cord CD4+ T cell cluster contained cells that expressed either Rorc, Tbx21, or Gata3 (Fig. 3 E and F).
Cd19 and Pax5 expression defined B cells (Fig. 3 B, C, E, and F), while plasma cells, classified by the expression of Cd138 (syndecan1), were present only in the dLNs but not in the spinal cord (Fig. 3 B and C). In addition to these populations, Cd34 expression identified a hematopoietic precursor population present in the spinal cord but not the dLNs (Fig. 3 E and F).
Genes Associated with Ag Presentation Are Down-Regulated Both in the dLNs and Spinal Cord APCs of Mice with Advanced EAE Treated with dMP MOG35–55.
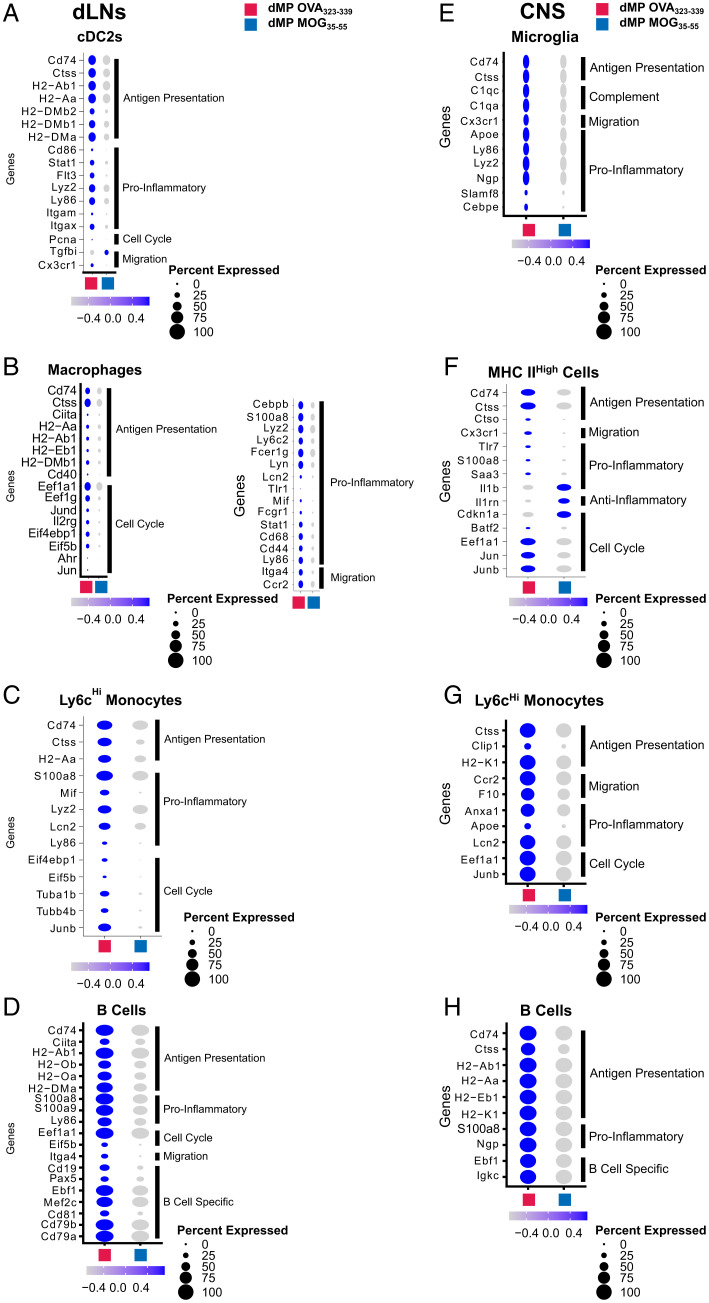
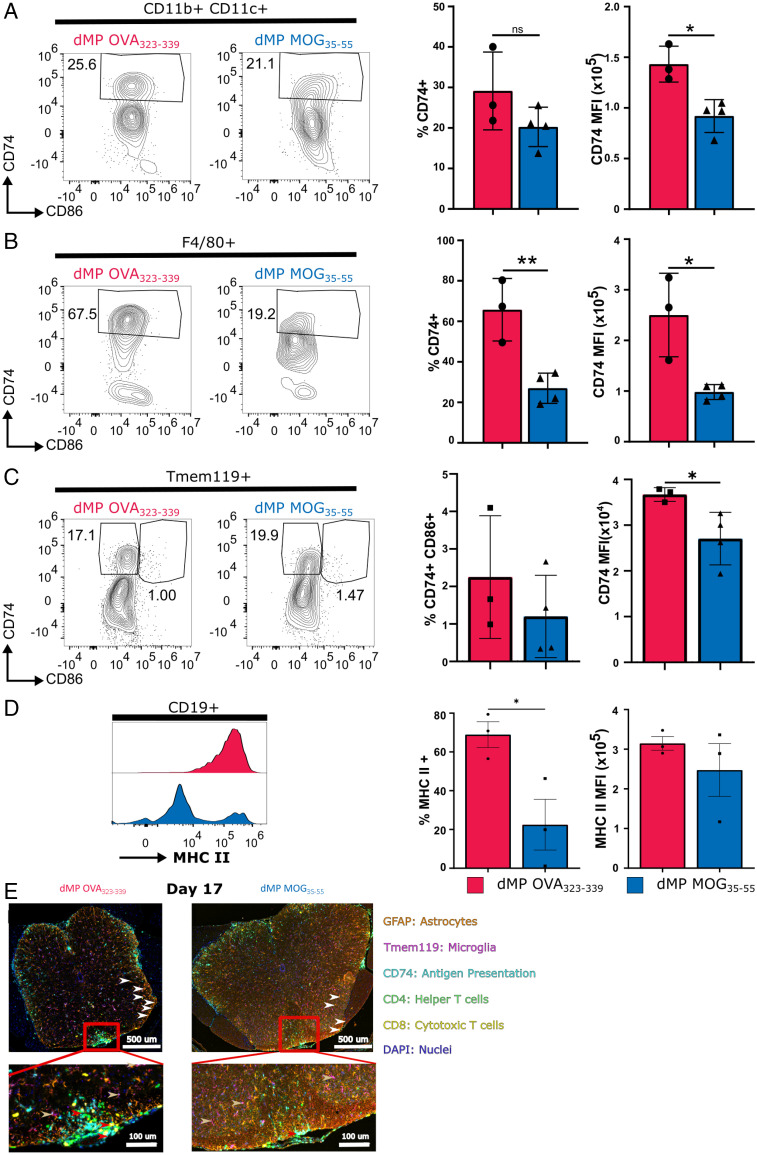
Differential expression analysis of the spinal cord and dLN APC clusters, including B cells and microglia (in the spinal cord), revealed common down-regulation of the MHC II Ag presentation pathway (SI Appendix, Fig. S3 A, C–E, G, and H). Cd74, a critical MHC II chaperone protein (38) and cathepsin S (Ctss), an enzyme involved in the processing of the MHC II invariant chain (39), were down-regulated in numerous dLN and spinal cord APCs, including B cells and microglia (CNS) (Fig. 4 A–H). Flow cytometry analysis confirmed a significant CD74 down-regulation in the spinal cord DCs (CD11b+CD11c+), macrophages (F4/80+), and microglia (Tmem119+) (Fig. 5 A–C). Numerous MHC II genes were down-regulated in B cell clusters from both spinal cord and dLNs, in addition to CD74 and Ctss (Fig. 4 D and H). Flow cytometry analysis confirmed the reduction in the B cell MHC IIhigh population on day 7 posttreatment (Fig. 5D). Given that there are no differences in frequency or CD74 mean fluorescence intensity between mice with EAE treated with dMP OVA or untreated mice (SI Appendix, Fig. S4), the untreated control group was omitted from subsequent studies. Multiplex immunofluorescent staining further confirmed a significant reduction in immune cell infiltration (Fig. 5E). In addition, fewer T cells colocalized with APCs, defined as CD74+ (Fig. 5E). In contrast to dMP OVA–treated mice, the microglia of dMP MOG–treated mice did not show a retraction of processes or expression of CD74 (Fig. 5E), suggesting a less active state (40, 41). Furthermore, in agreement with reduced lesion burden (Fig. 2 C and D), astrocytes (GFAP+), known to be numerically elevated in association with larger lesions (42), had reduced numbers in the spinal cord of dMP MOG–treated mice compared to dMP OVA control mice (Fig. 5E). Thus, these results altogether demonstrate that the dMP MOG treatment in mice with advanced EAE results in reduced MHC II Ag presentation both in dLN and spinal cord APCs, including microglia and B cells.
Fig. 4.
APCs in the dLNs and CNS show a reduction in MHCII Ag presentation and inflammatory gene signature following dMP MOG treatment in mice with advanced EAE. Dot plots highlight Ag presentation, proinflammatory, cell cycle, and migration genes differentially expressed in (A) cDC2s, (B) macrophages, (C) Ly6cHi monocytes, and (D) B cells in the dLNs on day 7. Dot plots highlighting Ag presentation, proinflammatory, cell cycle, and migration genes differentially expressed in (E) microglia, (F) MHC IIHigh cells, (G) Ly6cHi monocytes, and (H) B cells in the spinal cord on day 7. Of note are Ag presentation, proinflammatory, anti-inflammatory, cell cycle, and migration genes. Genes with a padjusted of <0.1 were considered significant. n = 2 mice per group in the dLNs and n = 1 mouse per group in the CNS.
Fig. 5.
dMP MOG treatment in mice with advanced EAE results in reduction in MHCII components in microglia and CNS DCs, macrophages, and B cells. Representative flow plots and quantification of CD74 in the spinal cord on day 7 in (A) DCs, (B) macrophages, and (C) microglia. (D) Representative flow cytometry plots and quantification of MHC II expression by B cells on day 7. (E) Multiplex immunofluorescence image of the lumbar spinal cord on day 17. Markers are as follows: CD4 (T helper cells) in green, CD8 (cytotoxic T cells) in yellow, CD74 (MHC II chaperone protein) in cyan, Ki67 (proliferation marker) in red, GFAP (astrocytes) in orange, and Tmem119 (microglia) in magenta. Red arrows show APCs interacting with T cells, white arrows point to astrocytes, and gold arrows point to microglia. The dorsal column in the red box is magnified in the Bottom image. All populations were pregated on live CD45+ DCs and macrophages. B cells were negative for Tmem119 and CD3e. Macrophages and DCs were negative for B220/CD19, and macrophages were negative for CD11c. n = 3 to 4/group; *P < 0.05; ** P < 0.01.
B Cells Are Partially Responsible for dMP MOG Treatment Efficacy.
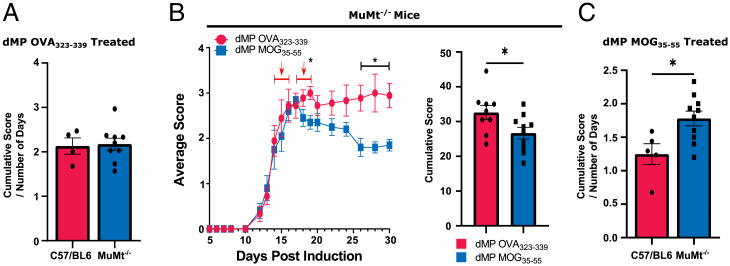
Given the numerous changes in the B cell clusters and the recent success with anti-CD20 therapy in MS, we further investigated the impact of B cells on dMP MOG treatment efficacy in MuMt−/− mice, which are deficient in B cells (43, 44). Previous publications showed that B cell absence had no significant impact on EAE scores (44). Our results show that normalized cumulative scores following the dMP OVA treatment were comparable between C57BL/6 and MuMt−/− mice (Fig. 6A). Thus, consistent with the previous observation that the absence of B cells does not impact EAE in C57BL/6 induced with MOG35–55 (44). MuMt−/− mice induced with EAE and treated with dMP MOG had lower scores than dMP OVA and overall lower cumulative scores (Fig. 6B). However, when comparing normalized cumulative scores, C57BL/6 mice treated with dMP MOG outperformed MuMt−/− mice treated with dMP MOG (Fig. 6C), suggesting that B cells are an essential component of the dMP MOG efficacy, with the B cell Ag-presentation pathway likely implicated (Figs. 4 D and H and 5D). Given that the scores were still reduced, comparing dMP MOG– versus dMP OVA–treated MuMt−/− mice, this suggests that other immune populations also play a major role in addition to B cells.
Fig. 6.
B cells are partially responsible for dMP MOG treatment efficacy. (A) Comparison of the cumulative score normalized by the number of days post–treatment initiation in EAE C57BL6 and EAE MuMt−/− mice administered with dMP OVA. (B) EAE score curve and cumulative scores following treatment initiated at a score of 3 in MuMt−/− mice as in Fig. 1B, with a second injection 3 d later. (C) Comparison of cumulative score normalized by the number of days post–treatment initiation in C57BL6 and MuMt−/− mice administered with dMP MOG. n= 5 to 9 per group and represents 2 independent experiments; *P < 0.05.
Genes Associated with Inflammation Are Down-Regulated in APCs and T Cells of EAE Mice Treated with dMP MOG.
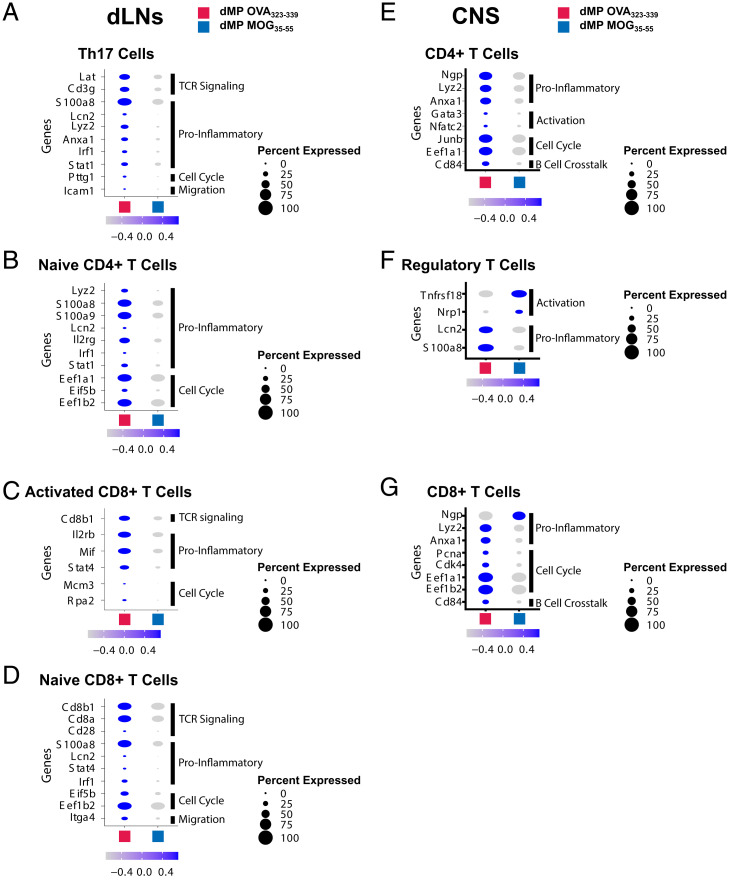
Both APCs and T cells in the spinal cord and dLNs showed reduced messenger RNA belonging to inflammatory pathways following dMP MOG treatment (SI Appendix, Figs. S3 and S5). Although not all changes were present in all APC clusters, key genes associated with inflammation, activation, maturation, and cytokine production (20, 38, 45, 46) were down-regulated in the dLNs and spinal cord, including Lyz2, Lcn2, Ly86, S100a8, S100a9, Fcer1g, Mif, Stat1, Cebpb, Cd44, Cd68, Cd86, Cd40, Itgam, Itgax, and Flt3 and Ly6c2 following dMP MOG treatment (Fig. 4 A–D). Interestingly, several genes associated with dysfunctional microglia, including Cebpe, Lyz2, Cx3cr1, and Apoe (38, 47) or lesion-associated microglia, such as complement genes (48–50), were down-regulated in the microglia of dMP MOG–treated mice (Fig. 4E). T cells in the dLNs and spinal cord on days 2 and 7 posttreatment down-regulated a similar gene signature with some distinct genes, including S100a8, S100a9, Lcn2, Lyz2, Ngp, and Anxa1 (Fig. 7 A–G).
Fig. 7.
T cells in dLNs and CNS show a reduction in inflammatory genes following dMP MOG treatment in mice with advanced EAE. (B) Dot plots highlighting genes of interest differentially expressed in (A) Th17 cells, (B) naive CD4+ T cells, (C) activated CD8+ T cells, and (D) naive CD8+ T cells in the dLNs on day 2, specifically TCR signaling, proinflammatory, cell cycle, and migration genes. Dot plots showing proinflammatory, activation, and cell cycle genes in (E) CD4+ T cells, (F) Treg cells, and (G) CD8+ T cells in the spinal cord on day 7. Genes with a padjusted of <0.1 were considered significant. n = 2 mice per group in the dLNs and n = 1 mouse per group in the CNS.
In addition to a decreased expression of proinflammatory genes, Th17 cells and CD8+ T cell clusters in the dLNs showed down-regulation of TCR signaling genes (Fig. 7 A, C, and D). In conjunction with reduced Ag presentation by APCs, this suggests a concomitant mechanism contributing to treatment efficacy (Figs. 4 A–H and 7 A, C, and D and SI Appendix, S5 A and C). Additionally, Treg cells in the spinal cord also down-regulated the inflammatory genes S100a8 and Lcn2 and showed an increased expression of Tnfsf18 (encodes for Gitr) and Nrp1 (Fig. 7F), known to be associated with Treg cell activation (51–55). Altogether, results show that dMP MOG treatment reduced proinflammatory signature genes in numerous APCs and T cell clusters in the dLNs and spinal cord, which corresponded with reduced production of proinflammatory cytokines in the CNS.
Expression of Genes Involved Cell Cycle, DNA Replication, and Translation Was Down-Regulated in Diverse Immune Populations of EAE Mice Treated with dMP MOG.
Cell cycle, DNA replication, and ribosome pathways were down-regulated following dMP MOG treatment (SI Appendix, Figs. S3 A–C, F, and G, S5 B and E–G, S6, and S7). Specifically, dMP MOG–treated mice down-regulated cell cycle genes including Mcm3 and Cdk4 (Fig. 7 C and F) along with DNA replication and repair genes such as Rpa2, Pcna, and Pttg1 (Figs. 4A and 7 A, C, and G). Furthermore, translation genes were also down-regulated in the dLNs and spinal cord following dMP MOG treatment. These included Eif5b, Eef1b2, and Eef1a1 (Figs. 4 C, D, and F–H, 7 B and D–F). Additionally, proliferation-related genes Jun, Junb, and Jund (56–58) were reduced in dLNs and spinal cord (Figs. 4 B, C, F, and G and 7E). The down-regulation of these genes and pathways is consistent with a reduction in immune cell activation following dMP MOG treatment.
Discussion
Our results show that Ag-specific dMP MOG treatment administered subcutaneously in advanced EAE effectively reversed paralysis, an improvement over many other preclinical treatments, which are typically initiated before EAE induction or at the onset of disease (16, 17, 28, 59–64). Interestingly, despite the administration of the same dose of recruitment and suppressive factors, namely, GM-CSF, TGF-β1, and VD3, only the formulation with disease-specific MOG Ag has efficacy, demonstrating that disease-specific Ag is necessary for efficacy. Although the treatment is only administered twice, it remains efficient over 17 d posttreatment and thus it is superior to other treatments that need repeated administrations (28–32).
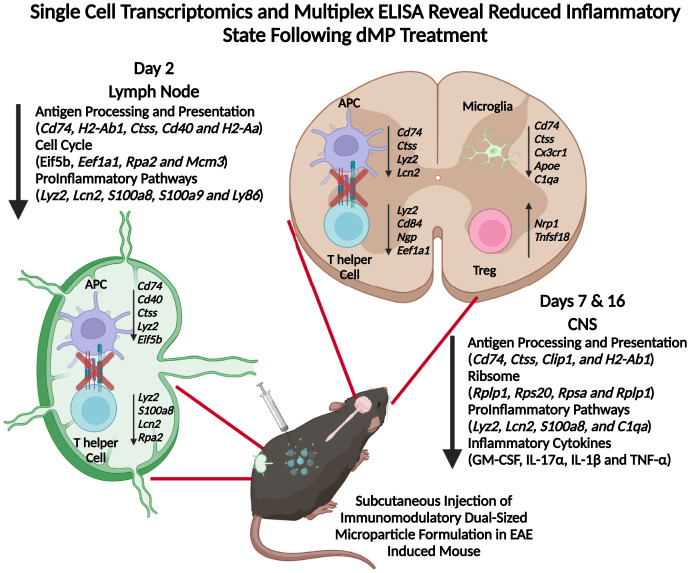
Mechanistically, the dMP subcutaneous injection depot has been shown to recruit and favor DC differentiation with a suppressive phenotype (18, 20). Previous work has shown that dMP trafficking is dependent on factor and Ag loading, as the cells recruited to the injection site subsequently traffic to dLN carrying more phagocytosable MPs from the dMP group compared with unloaded MPs (18, 20). Our results show that the treatment has a pronounced effect on APCs. Following the trafficking of APCs to the dLNs, dMP MOG, but not dMP OVA treatment, reduced MHC II presentation, which may promote Ag-specific suppression of T cells. Subsequent down-regulation of inflammatory gene signatures could involve potential mechanisms such as bystander effects or suppressive lymphocyte feedback to reinforce the APC phenotype. Importantly not all cells in the dLN are modulated by treatment, given the presence of naive T cells, suggesting that dMP MOG treatment is potentially affecting primarily disease-relevant cells. Both APCs and T cells have a less proinflammatory phenotype in the spinal cord, through the down-regulation of genes such as S100a8 and Lcn2. Notably, less MHC II Ag presentation in the spinal cord following dMP MOG treatment compared to dMP OVA treatment provides a conserved mechanism between the periphery and primary tissue. Furthermore, we report reduced Ag presentation and activation in resident microglia and astrocytes in dMP MOG–treated mice compared to dMP OVA–treated mice. In conjunction with these changes, reduced levels of the neurotoxic cytokines GM-CSF and IL-17α and reduced demyelination suggest a return toward homeostasis in the CNS. A twin study in MS revealed that genes including Ccr2 and Ciita were elevated in the twin with MS, and interestingly, these two genes are down-regulated following dMP MOG treatment (65). In addition to DCs, B cells show a decrease in MHC II Ag presentation and inflammation in the dLNs and the spinal cord. dMP MOG treatment in C57BL/6 mice outperformed MuMt−/− mice, demonstrating the important contribution of B cells in the treatment, even though disease progression in this model is not B cell dependent. Given the fact that the dMP MOG still had an impact versus dMP OVA on EAE scores in MuMt−/− mice demonstrates the importance of other immune populations in mediating the effect of the treatment. Modulation of B cells provides another prong to the mechanism of dMP efficacy that has not been noted in previous work. Overall, we propose a mechanism by which the Ag-specific dMP treatment halts pathogenesis by decreasing the MHC II Ag presentation pathway and immune activation, reducing immune cell infiltration in the CNS and hallmark inflammatory cytokine signature (Fig. 8). Wholly, these changes indicate an environment less prone to maintaining Ag-specific T cell activation and overall inflammation, including in the CNS. Delivering treatment in advanced disease shows promise for dMP use as a therapeutic, and substituting MOG with other MS-specific Ags or combinations could improve translational capabilities. Altogether, this work highlights the promise of an Ag-specific dMP therapy to reverse paralysis through the targeted suppression of autoimmune responses.
Fig. 8.
dMP MOG immunotherapy highlighting reprogramming in both the lymph node and CNS.
Materials and Methods
Particle Formulation and Characterization.
MPs were made using emulsion and solvent evaporation techniques, and particle sizing utilized dynamic light scattering and loading used spectrometry or 3-(4-carboxybenzoyl) quinoline -2- carboxaldehyde (SI Appendix, Extended Methods).
Mice, EAE Induction, and Treatment.
Pathogen-free conditions at the University of Florida housed C57BL/6 mice (B6NTac) following purchase from Taconic Biosciences, and MuMt−/− mice were purchased from Jackson Laboratory. EAE induction utilized 9- to 13-wk-old female mice. All experiments were approved by the University of Florida Institutional Animal Care and Use Committee.
EAE induction utilized kits from Hooke Laboratories (Hooke Laboratories Inc., EK-2110). Subcutaneous injections at both the scruff of the neck and the base of the tail contained 100 μL of MOG35–55/Complete Freund's Adjuvant, resulting in 200 μL total injected. At 2 and 24 h following injection of emulsion, 100 μL of pertussis toxin (4 μg/mL) was injected intraperitoneally. Following 7 d of incubation, clinical scores were evaluated as follows: score 1, flaccid tail; score 2, weak hind limbs; score 3, hind limb paralysis; and score 4, quadriplegia.
Treatment consisted of an injection of a mixture of GM-CSF, TGF-β1, VD3, and Ag-loaded MPs. Untreated mice received injection of sterile phosphate-buffered saline. Subcutaneous MP administration in the center of the back took place at a score of 3, with a second injection 3 d later.
Staining and Flow Cytometry.
Following fragment crystalizable blocking for 15 min, staining used surface markers (SI Appendix, Extended Methods) and fixable viability dye (Affymetrix, Life Technologies) for 30 min at 4 °C followed by 2% paraformaldehyde fixation for 10 min at room temperature. Flow cytometry used a BD LSR II instrument with BD FACS DIVA software for data acquisition (BD Biosciences) or Cytek Aurora (Cytek Biosciences) for spectral cytometry. All data analysis used FlowJo (BD Biosciences).
Histological Analysis.
Briefly, spinal cords were harvested with the surrounding vertebrae and placed in 10% neutral buffered formalin overnight. Samples were then decalcified for 4 h before processing and embedding. Following processing and embedding, samples were sectioned at 4 µm and stained (SI Appendix, Extended Methods).
Multiplex Cytokine Analysis.
Brains were harvested on day 7 posttreatment and homogenized using gentlemacs dissociation. Samples were then centrifuged at 400 G for 5 min and then resuspended in 1% Nonidet P-40 lysis buffer. This solution was placed in a 2-mL blast tube with 500 µL of 800-µm glass beads. A bead blaster lysed the cells and homogenized the tissue. Samples were spun down at 10,000 G for 10 min, and a bicinchoninic acid assay (Thermo Fisher) quantified the protein level. Protein levels were normalized to 4 mg/mL protein before analysis. Eve Technologies used Luminex xMAP technology to conduct cytokine analysis using a Luminex 200 system (Luminex). Eve’s 18-Plex Discovery Assay (Millipore Sigma) evaluated GM-CSF, IFNγ, IL-1α, IL-1β, IL-2, IL-4, IL-5, IL-6, IL-7, IL-10, IL-12 (p70), IL-13, IL-17A, KC/CXCL1, LIX, MCP-1, MIP-2, and TNF-α according to the manufacturer’s protocol. Sensitivity ranged from 0.06 to 9.06 pg/mL.
Single-Cell RNA Sequencing.
scRNAseq used cells from the spinal cords of mice with treatment initiated at a score of 3. After cells were harvested from the spinal cord as previously described, fixed viability dye and CD45.2 staining took place. Following staining, cells sorting collected live CD45.2+ cells before processing from scRNAseq. The analysis used CellRanger (10× genomics) in Mobaxterm, and Seurat (Satija Lab) in Rstudio conducted cluster analysis and differential expression (SI Appendix, Extended Methods).
Fraction calculation involved normalizing the frequency of each cluster to the total number of cells from that mouse followed by comparing the frequencies between groups—a threshold of 65% determined differences in frequency. Hallmark genes include known defining genes including Cd3e for T cells; Tmem119 for microglia; Itgam, Itgax, and Adgre1 for MHC IIhigh cells; and Ly6c2, Ly6g, Cd177, and Il-1b for neutrophils. Further genes defined the phenotype, including T cell transcription factors Rorc, tbx21, Foxp3, and Cd177 and Il-1b for neutrophils.
Statistical Analysis.
The Mann-Whitney U test determined differences in EAE score. Two-tailed Student’s t tests evaluated changes in histological and flow cytometry data. GraphPad Prism 8 was used for analyses.
Supplementary Material
Acknowledgments
We acknowledge our funding sources R01 AI33623 to D.A. and B.G.K., R21 NS123596 to B.G.K., R01 AI067846 and R01 AI161845 to D.A,. and T32 DK108736 to A.J.K. We also thank also grant P30CA076292 to the Moffit Cancer Center. The graphical abstract was created with BioRender.com. We also acknowledge Dr. Daryoush Saeed-Vafa, Dr. Carlos Morán-Segura, Neale Lopez-Blanco, and Jonathan Nguyen of the Advanced Analytical and Digital Laboratory for assistance with multiplex immunofluorescence staining and imaging. Specifically we thank, Carlos Moran Segura for antibody panel design and multispectral scanning, Jonathan Nguyen for image quantification within HALO software (Indica Labs), and Dr. Daryoush Saeed-Vafa for laboratory direction. Also we thank, Noel Clark of the tissue core for assistance with tissue processing and sectioning.
Footnotes
Competing interest statement: B.G.K. is a founder, holds stock, and serves on the scientific advisory board of Inspira Therapeutics, Inc. The University of Florida has filed patents related to the technology reported in this paper.
This article is a PNAS Direct Submission.
See online for related content such as Commentaries.
This article contains supporting information online at https://www.pnas.org/lookup/suppl/doi:10.1073/pnas.2205417119/-/DCSupplemental.
Data, Materials, and Software Availability
All study data are included in the article and/or SI Appendix.
References
- 1.Filippi M., et al. , Multiple sclerosis. Nat. Rev. Dis. Primers 4, 43 (2018). [DOI] [PubMed] [Google Scholar]
- 2.Dulamea A. O., The contribution of oligodendrocytes and oligodendrocyte progenitor cells to central nervous system repair in multiple sclerosis: Perspectives for remyelination therapeutic strategies. Neural Regen. Res. 12, 1939–1944 (2017). [DOI] [PMC free article] [PubMed] [Google Scholar]
- 3.Milovanovic J., et al. , Interleukin-17 in chronic inflammatory neurological diseases. Front. Immunol. 11, 947 (2020). [DOI] [PMC free article] [PubMed] [Google Scholar]
- 4.Duncker P. C., Stoolman J. S., Huber A. K., Segal B. M., GM-CSF promotes chronic disability in experimental autoimmune encephalomyelitis by altering the composition of central nervous system-infiltrating cells, but is dispensable for disease induction. J. Immunol. 200, 966–973 (2018). [DOI] [PMC free article] [PubMed] [Google Scholar]
- 5.El-Behi M., et al. , The encephalitogenicity of T(H)17 cells is dependent on IL-1- and IL-23-induced production of the cytokine GM-CSF. Nat. Immunol. 12, 568–575 (2011). [DOI] [PMC free article] [PubMed] [Google Scholar]
- 6.Bettelli E., et al. , Loss of T-bet, but not STAT1, prevents the development of experimental autoimmune encephalomyelitis. J. Exp. Med. 200, 79–87 (2004). [DOI] [PMC free article] [PubMed] [Google Scholar]
- 7.Krienke C., et al. , A noninflammatory mRNA vaccine for treatment of experimental autoimmune encephalomyelitis. Science 371, 145–153 (2021). [DOI] [PubMed] [Google Scholar]
- 8.Wingerchuk D. M., Carter J. L., Multiple sclerosis: Current and emerging disease-modifying therapies and treatment strategies. Mayo Clin. Proc. 89, 225–240 (2014). [DOI] [PubMed] [Google Scholar]
- 9.Roach C. A., Cross A. H., Anti-CD20 B cell treatment for relapsing multiple sclerosis. Front. Neurol. 11, 595547 (2021). [DOI] [PMC free article] [PubMed] [Google Scholar]
- 10.Wattjes M. P., et al. ; Dutch-Belgian Natalizumab-Associated PML Study Group, Inflammatory natalizumab-associated PML: Baseline characteristics, lesion evolution and relation with PML-IRIS. J. Neurol. Neurosurg. Psychiatry 89, 535–541 (2018). [DOI] [PubMed] [Google Scholar]
- 11.Weinstock-Guttman B., Nair K. V., Glajch J. L., Ganguly T. C., Kantor D., Two decades of glatiramer acetate: From initial discovery to the current development of generics. J. Neurol. Sci. 376, 255–259 (2017). [DOI] [PubMed] [Google Scholar]
- 12.Hauser S. L., et al. ; OPERA I and OPERA II Clinical Investigators, Ocrelizumab versus interferon beta-1a in relapsing multiple sclerosis. N. Engl. J. Med. 376, 221–234 (2017). [DOI] [PubMed] [Google Scholar]
- 13.Ancau M., Berthele A., Hemmer B., CD20 monoclonal antibodies for the treatment of multiple sclerosis: Up-to-date. Expert Opin. Biol. Ther. 19, 829–843 (2019). [DOI] [PubMed] [Google Scholar]
- 14.Kwiatkowski A. J., Stewart J. M., Cho J. J., Avram D., Keselowsky B. G., Nano and microparticle emerging strategies for treatment of autoimmune diseases: Multiple sclerosis and type 1 diabetes. Adv. Healthc. Mater. 9, e2000164 (2020). [DOI] [PMC free article] [PubMed] [Google Scholar]
- 15.Tostanoski L. H., et al. , Reprogramming the local lymph node microenvironment promotes tolerance that is systemic and antigen specific. Cell Rep. 16, 2940–2952 (2016). [DOI] [PMC free article] [PubMed] [Google Scholar]
- 16.Casey L. M., et al. , Conjugation of transforming growth factor beta to antigen-loaded poly(lactide- co-glycolide) nanoparticles enhances efficiency of antigen-specific tolerance. Bioconjug. Chem. 29, 813–823 (2018). [DOI] [PMC free article] [PubMed] [Google Scholar]
- 17.Pearson R. M., et al. , Controlled delivery of single or multiple antigens in tolerogenic nanoparticles using peptide-polymer bioconjugates. Mol. Ther. 25, 1655–1664 (2017). [DOI] [PMC free article] [PubMed] [Google Scholar]
- 18.Cho J. J., et al. , An antigen-specific semi-therapeutic treatment with local delivery of tolerogenic factors through a dual-sized microparticle system blocks experimental autoimmune encephalomyelitis. Biomaterials 143, 79–92 (2017). [DOI] [PMC free article] [PubMed] [Google Scholar]
- 19.Allen R., Chizari S., Ma J. A., Raychaudhuri S., Lewis J. S., Combinatorial, microparticle-based delivery of immune modulators reprograms the dendritic cell phenotype and promotes remission of collagen-induced arthritis in mice. ACS Appl. Bio Mater. 2, 2388–2404 (2019). [DOI] [PubMed] [Google Scholar]
- 20.Lewis J. S., et al. , Dual-sized microparticle system for generating suppressive dendritic cells prevents and reverses type 1 diabetes in the nonobese diabetic mouse model. ACS Biomater. Sci. Eng. 5, 2631–2646 (2019). [DOI] [PMC free article] [PubMed] [Google Scholar]
- 21.Lewis J. S., et al. , A combination dual-sized microparticle system modulates dendritic cells and prevents type 1 diabetes in prediabetic NOD mice. Clin. Immunol. 160, 90–102 (2015). [DOI] [PMC free article] [PubMed] [Google Scholar]
- 22.Yoon Y. M., et al. , A combination hydrogel microparticle-based vaccine prevents type 1 diabetes in non-obese diabetic mice. Sci. Rep. 5, 13155 (2015). [DOI] [PMC free article] [PubMed] [Google Scholar]
- 23.Lewis J. S., Zaveri T. D., Crooks C. P. II, Keselowsky B. G., Microparticle surface modifications targeting dendritic cells for non-activating applications. Biomaterials 33, 7221–7232 (2012). [DOI] [PMC free article] [PubMed] [Google Scholar]
- 24.Esebanmen G. E., Langridge W. H. R., The role of TGF-beta signaling in dendritic cell tolerance. Immunol. Res. 65, 987–994 (2017). [DOI] [PubMed] [Google Scholar]
- 25.Ferreira G. B., et al. , Vitamin D3 induces tolerance in human dendritic cells by activation of intracellular metabolic pathways. Cell Rep. 10, 711–725 (2015). [DOI] [PubMed] [Google Scholar]
- 26.Vanherwegen A.-S., et al. , Vitamin D controls the capacity of human dendritic cells to induce functional regulatory T cells by regulation of glucose metabolism. J. Steroid Biochem. Mol. Biol. 187, 134–145 (2019). [DOI] [PubMed] [Google Scholar]
- 27.Calton E. K., Keane K. N., Soares M. J., Rowlands J., Newsholme P., Prevailing vitamin D status influences mitochondrial and glycolytic bioenergetics in peripheral blood mononuclear cells obtained from adults. Redox Biol. 10, 243–250 (2016). [DOI] [PMC free article] [PubMed] [Google Scholar]
- 28.Gammon J. M., Tostanoski L. H., Adapa A. R., Chiu Y. C., Jewell C. M., Controlled delivery of a metabolic modulator promotes regulatory T cells and restrains autoimmunity. J. Control. Release 210, 169–178 (2015). [DOI] [PubMed] [Google Scholar]
- 29.Xu L., et al. , Rapamycin combined with MCC950 to treat multiple sclerosis in experimental autoimmune encephalomyelitis. J. Cell. Biochem. 120, 5160–5168 (2019). [DOI] [PubMed] [Google Scholar]
- 30.Zhang J., et al. , Erythropoietin treatment improves neurological functional recovery in EAE mice. Brain Res. 1034, 34–39 (2005). [DOI] [PubMed] [Google Scholar]
- 31.Varrin-Doyer M., et al. , Treatment of spontaneous EAE by laquinimod reduces Tfh, B cell aggregates, and disease progression. Neurol. Neuroimmunol. Neuroinflamm. 3, e272 (2016). [DOI] [PMC free article] [PubMed] [Google Scholar]
- 32.Aizman E., Mor A., Chapman J., Assaf Y., Kloog Y., The combined treatment of Copaxone and Salirasib attenuates experimental autoimmune encephalomyelitis (EAE) in mice. J. Neuroimmunol. 229, 192–203 (2010). [DOI] [PubMed] [Google Scholar]
- 33.McGinley A. M., Edwards S. C., Raverdeau M., Mills K. H. G., Th17 cells, γδ T cells and their interplay in EAE and multiple sclerosis. J. Autoimmun. 87, 97–108 (2018). [DOI] [PubMed] [Google Scholar]
- 34.McGinley A. M., et al. , Interleukin-17A serves a priming role in autoimmunity by recruiting IL-1β-producing myeloid cells that promote pathogenic T cells. Immunity 52, 342–356.e6 (2020). [DOI] [PubMed] [Google Scholar]
- 35.Zhao M., et al. , IL-6/STAT3 pathway induced deficiency of RFX1 contributes to Th17-dependent autoimmune diseases via epigenetic regulation. Nat. Commun. 9, 583 (2018). [DOI] [PMC free article] [PubMed] [Google Scholar]
- 36.Mahad D. J., Ransohoff R. M., The role of MCP-1 (CCL2) and CCR2 in multiple sclerosis and experimental autoimmune encephalomyelitis (EAE). Semin. Immunol. 15, 23–32 (2003). [DOI] [PubMed] [Google Scholar]
- 37.Hao Y., et al. , Integrated analysis of multimodal single-cell data. Cell 184, 3573–3587.e29 (2021). [DOI] [PMC free article] [PubMed] [Google Scholar]
- 38.Jordão M. J. C., et al. , Single-cell profiling identifies myeloid cell subsets with distinct fates during neuroinflammation. Science 363, eaat7554 (2019). [DOI] [PubMed] [Google Scholar]
- 39.Riese R. J., et al. , Cathepsin S activity regulates antigen presentation and immunity. J. Clin. Invest. 101, 2351–2363 (1998). [DOI] [PMC free article] [PubMed] [Google Scholar]
- 40.Fan C., et al. , MIF intersubunit disulfide mutant antagonist supports activation of CD74 by endogenous MIF trimer at physiologic concentrations. Proc. Natl. Acad. Sci. U.S.A. 110, 10994–10999 (2013). [DOI] [PMC free article] [PubMed] [Google Scholar]
- 41.Schröder B., The multifaceted roles of the invariant chain CD74—More than just a chaperone. Biochim. Biophys. Acta 1863, 1269–1281 (2016). [DOI] [PubMed] [Google Scholar]
- 42.Jukkola P., Guerrero T., Gray V., Gu C., Astrocytes differentially respond to inflammatory autoimmune insults and imbalances of neural activity. Acta Neuropathol. Commun. 1, 70 (2013). [DOI] [PMC free article] [PubMed] [Google Scholar]
- 43.Kitamura D., Roes J., Kühn R., Rajewsky K., A B cell-deficient mouse by targeted disruption of the membrane exon of the immunoglobulin mu chain gene. Nature 350, 423–426 (1991). [DOI] [PubMed] [Google Scholar]
- 44.Hjelmström P., Juedes A. E., Fjell J., Ruddle N. H., B-cell-deficient mice develop experimental allergic encephalomyelitis with demyelination after myelin oligodendrocyte glycoprotein sensitization. J. Immunol. 161, 4480–4483 (1998). [PubMed] [Google Scholar]
- 45.Kim M. K., Kim J., Properties of immature and mature dendritic cells: Phenotype, morphology, phagocytosis, and migration. RSC Advances 9, 11230–11238 (2019). [DOI] [PMC free article] [PubMed] [Google Scholar]
- 46.Karsunky H., Merad M., Cozzio A., Weissman I. L., Manz M. G., Flt3 ligand regulates dendritic cell development from Flt3+ lymphoid and myeloid-committed progenitors to Flt3+ dendritic cells in vivo. J. Exp. Med. 198, 305–313 (2003). [DOI] [PMC free article] [PubMed] [Google Scholar]
- 47.Krasemann S., et al. , The TREM2-APOE pathway drives the transcriptional phenotype of dysfunctional microglia in neurodegenerative diseases. Immunity 47, 566–581.e9 (2017). [DOI] [PMC free article] [PubMed] [Google Scholar]
- 48.van Beek J., Morgan B. P., “The role of complement in EAE” in Experimental Models of Multiple Sclerosis, Lavi E., Constantinescu C. S., Eds. (Springer US, Boston, MA, 2005), pp. 245–267. [Google Scholar]
- 49.Mendiola A. S., et al. , Transcriptional profiling and therapeutic targeting of oxidative stress in neuroinflammation. Nat. Immunol. 21, 513–524 (2020). [DOI] [PMC free article] [PubMed] [Google Scholar]
- 50.Chen A., et al. , Human T cells express specific binding sites for C1q. Role in T cell activation and proliferation. J. Immunol. 153, 1430–1440 (1994). [PubMed] [Google Scholar]
- 51.Campos-Mora M., et al. , CD4+Foxp3+T regulatory cells promote transplantation tolerance by modulating effector CD4+ T cells in a neuropilin-1-dependent manner. Front. Immunol. 10, 882 (2019). [DOI] [PMC free article] [PubMed] [Google Scholar]
- 52.Delgoffe G. M., et al. , Stability and function of regulatory T cells is maintained by a neuropilin-1-semaphorin-4a axis. Nature 501, 252–256 (2013). [DOI] [PMC free article] [PubMed] [Google Scholar]
- 53.Glinka Y., Prud’homme G. J., Neuropilin-1 is a receptor for transforming growth factor β-1, activates its latent form, and promotes regulatory T cell activity. J. Leukoc. Biol. 84, 302–310 (2008). [DOI] [PMC free article] [PubMed] [Google Scholar]
- 54.Liao G., et al. , GITR engagement preferentially enhances proliferation of functionally competent CD4+CD25+FoxP3+ regulatory T cells. Int. Immunol. 22, 259–270 (2010). [DOI] [PMC free article] [PubMed] [Google Scholar]
- 55.Ermann J., Fathman C. G., Costimulatory signals controlling regulatory T cells. Proc. Natl. Acad. Sci. U.S.A. 100, 15292–15293 (2003). [DOI] [PMC free article] [PubMed] [Google Scholar]
- 56.Fontana M. F., et al. , JUNB is a key transcriptional modulator of macrophage activation. J. Immunol. 194, 177–186 (2015). [DOI] [PMC free article] [PubMed] [Google Scholar]
- 57.Wisdom R., Johnson R. S., Moore C., c-Jun regulates cell cycle progression and apoptosis by distinct mechanisms. EMBO J. 18, 188–197 (1999). [DOI] [PMC free article] [PubMed] [Google Scholar]
- 58.Piechaczyk M., Farràs R., Regulation and function of JunB in cell proliferation. Biochem. Soc. Trans. 36, 864–867 (2008). [DOI] [PubMed] [Google Scholar]
- 59.Hunter Z., et al. , A biodegradable nanoparticle platform for the induction of antigen-specific immune tolerance for treatment of autoimmune disease. ACS Nano 8, 2148–2160 (2014). [DOI] [PMC free article] [PubMed] [Google Scholar]
- 60.Yeste A., et al. , Tolerogenic nanoparticles inhibit T cell-mediated autoimmunity through SOCS2. Sci. Signal. 9, ra61 (2016). [DOI] [PubMed] [Google Scholar]
- 61.Al-Ghobashy M. A., et al. , Development and pre-clinical evaluation of recombinant human myelin basic protein nano therapeutic vaccine in experimental autoimmune encephalomyelitis mice animal model. Sci. Rep. 7, 46468 (2017). [DOI] [PMC free article] [PubMed] [Google Scholar]
- 62.Kuo R., Saito E., Miller S. D., Shea L. D., Peptide-conjugated nanoparticles reduce positive co-stimulatory expression and T cell activity to induce tolerance. Mol. Ther. 25, 1676–1685 (2017). [DOI] [PMC free article] [PubMed] [Google Scholar]
- 63.Elliott D. M., Singh N., Nagarkatti M., Nagarkatti P. S., Cannabidiol attenuates experimental autoimmune encephalomyelitis model of multiple sclerosis through induction of myeloid-derived suppressor cells. Front. Immunol. 9, 1782 (2018). [DOI] [PMC free article] [PubMed] [Google Scholar]
- 64.Sun H., et al. , The combined treatment of NAD+ and atorvastatin ameliorates the development of experimental autoimmune encephalomyelitis in C57BL/6 mice. J. Neuroimmunol. 350, 577429 (2020). [DOI] [PubMed] [Google Scholar]
- 65.Ingelfinger F., et al. , Twin study reveals non-heritable immune perturbations in multiple sclerosis. Nature 603, 152–158 (2022). [DOI] [PMC free article] [PubMed] [Google Scholar]
Associated Data
This section collects any data citations, data availability statements, or supplementary materials included in this article.
Supplementary Materials
Data Availability Statement
All study data are included in the article and/or SI Appendix.


