Abstract
Introduction:
Subject head motion is an ongoing challenge in functional magnetic resonance imaging, particularly in the estimation of functional connectivity. Infants (1-month old) scanned during nonsedated sleep often have occasional but large movements of several millimeters separated by periods with relatively little movement. This results in residual signal changes even after image realignment and can distort estimates of functional connectivity. A new motion correction technique, JumpCor, is introduced to reduce the effects of this motion and compared to other existing techniques.
Methods:
Different approaches for reducing residual motion artifacts after image realignment were compared both in actual and simulated data: JumpCor, regressing out the estimated subject motion, and regressing out the average white matter, cerebrospinal fluid (CSF), and global signals and their temporal derivatives.
Results:
Motion-related signal changes resulting from infrequent large motion were significantly reduced both by regressing out the estimated motion parameters and by JumpCor. Furthermore, JumpCor significantly reduced artifacts and improved the quality of functional connectivity estimates when combined with typical preprocessing approaches.
Discussion:
Motion-related signal changes resulting from occasional large motion can be effectively corrected using JumpCor and to a certain extent also by regressing out the estimated motion. This technique should reduce the data loss in studies where participants exhibit this type of motion, such as sleeping infants.
Impact statement
Functional magnetic resonance imaging scans from 1-month-old infants scanned during nonsedated sleep often show occasional but large head motion. Data from subjects that move this much are commonly discarded in functional connectivity studies. However, this study introduces a new motion correction technique, JumpCor, that can effectively reduce this type of motion artifact and compares this to other existing motion correction techniques. The ability to retain valuable subject data despite large motion will be highly important for the study of brain connectivity, particularly in neurodevelopmental studies where this type of motion is common.
Keywords: connectivity, fMRI, infants, motion
Introduction
Subject head motion is an ongoing challenge in functional magnetic resonance imaging (fMRI), leading to an increased number of both false positive and false negative activation, as well as the loss of usable data (Friston et al., 1996; Power et al., 2012; Satterthwaite et al., 2012; Van Dijk et al., 2012). This is particularly true in developmental studies, where motion is more likely to occur (Satterthwaite et al., 2013; Vanderwal et al., 2020), and for the estimation of functional connectivity, which is highly sensitive to motion (Power et al., 2012; Van Dijk et al., 2012).
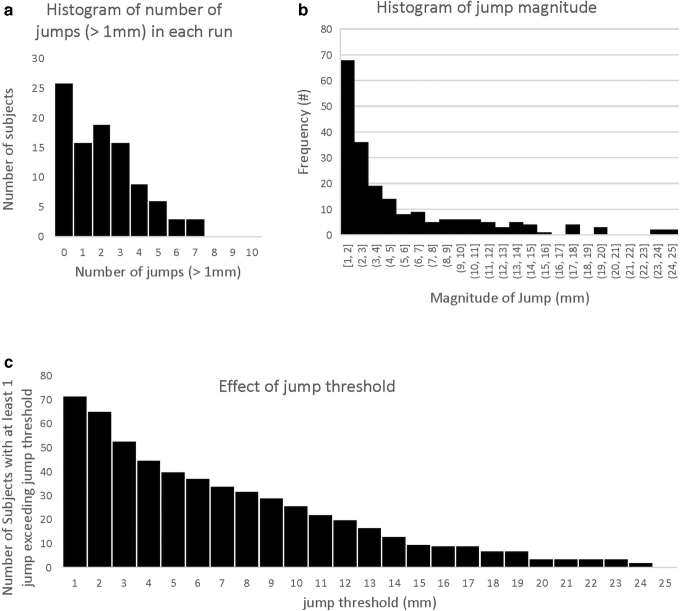
Our research group recently completed acquisition of fMRI data from a large cohort of infants at 1 month of age, in which infants were scanned during nonsedated sleep (Dean et al., 2018a, 2018b). During the fMRI scans, the infants were generally motionless. However, despite our best efforts to immobilize their head and body, many of the infants had occasional large head motions of several millimeters (1–24 mm, median 3.0 mm) during the acquisition, interspersed with relatively quiet periods of very little movement (<0.2 mm frame-to-frame displacement computed as the Euclidean norm of the temporal difference in the six realignment parameters; Fig. 1). Significant signal changes sometimes remained even after realignment and after censoring time points occurring during the motion.
FIG. 1.
Prevalence and magnitudes of volume-to-volume movements (“jumps”) in the sample of 98 infants. (a) Prevalence of jumps: histogram showing the number of subjects that had a certain total number of jumps >1 mm (26 subjects had no jumps, 16 subjects had only 1 jump, etc.). (b) Histogram of jump magnitude: the number of jumps of a certain magnitude across all runs within the sample. (c) Effect of jump threshold: the number of subjects with at least one jump exceeding the jump threshold, for different thresholds (e.g., 72 subjects had at least 1 jump exceeding 1 mm, 40 subjects had at least 1 jump exceeding 5 mm, and so on).
Prior studies often exclude participants with large or “gross” motion, that is, if any frame-to-frame displacement exceeds a predefined threshold, such as 0.55 mm (Satterthwaite et al., 2012, 2013) or 5 mm (Parkes et al., 2018). However, such a criterion would eliminate a large proportion of participants in our infant study who, in general, exhibited only a few large movements in each imaging run. This motivated the search for alternative solutions. In this study, we propose and examine different strategies to reduce this motion artifact.
Residual head-motion related signal changes remaining after image realignment can occur due to at least five different mechanisms—errors in estimating the motion; errors due to interpolation (Grootoonk et al., 2000); spin-history effects (Friston et al., 1996); B0-field changes (Jezzard and Clare, 1999); or movement into different parts of a nonuniform radio-frequency (RF) coil sensitivity. Spatially nonuniform sensitivity profiles are particularly common in RF coils with higher number of channels, such as the 32-channel coil used in the current study.
Visual inspection of our infant fMRI data after realignment indicated that the residual signal changes were likely due to the head moving into a different part of the (nonuniform) coil sensitivity. More specifically, the images before and after large jumps showed changes in signal intensity without any change in image shape (e.g., distortions in the phase encoding direction), which would be expected from B0-field changes. Furthermore, these signal changes were generally prolonged unlike the more transient signal changes that would be associated with spin-history effects.
The problem encountered with this large occasional motion is similar to that faced when combining data from multiple imaging runs, where the participant may have moved in between runs. We therefore adopted a similar approach to reduce the influence of large head motion, or “jumps,” that occur during the imaging run, a technique we call “JumpCor.” To evaluate JumpCor, we compared it to other motion reduction approaches.
Methods
JumpCor
A common approach to account for between-run signal changes when combining data across runs is to model a separate baseline, and optionally linear drift and lower order polynomials, for each imaging run. The idea behind JumpCor is to extend this approach to deal with large motions that occur during an imaging run. First, large jumps, where the volume-to-volume displacement exceeds a user-defined threshold, were identified (Fig. 2). This displacement was computed using the Euclidean norm (square-root of the sum of squares) of the temporal difference of the six realignment parameters (“Enorm”). For most analyses presented below, a 1 mm threshold was used. We also investigated the impact of changing this threshold. Next, regressors were generated for every segment between the large jumps with a value of 1 during the segment and a value of 0 outside of the segment (Fig. 2). These JumpCor regressors are then used as additional nuisance regressors in a general linear model, optionally together with any other nuisance regressors that are removed in the preprocessing of resting-state fMRI data (e.g., average white matter, cerebrospinal fluid [CSF], and possibly global signal changes). Segments consisting of only one time point between large movement jumps were censored.
FIG. 2.
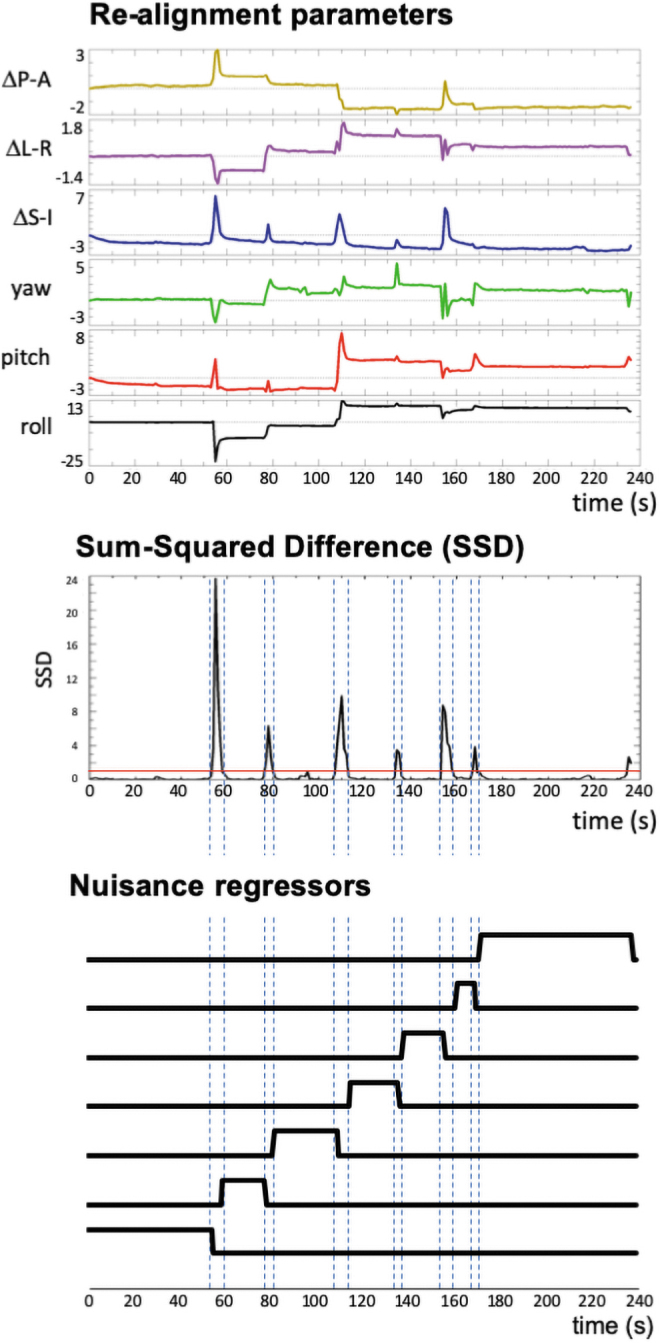
Illustration showing how JumpCor regressors are created for one subject. Data are realigned to correct for motion using rigid-body six-parameter registration. The square root of the sum of the squares of the volume-to-volume (temporal) difference (Euclidean norm, Enorm) of the six realignment parameters is computed. Time points exceeding the jump threshold, in this case 1 mm (red line), are considered a jump. Constant regressors (a value of 1 during the segment and a value of 0 outside of the segment) were generated for every segment between the large jumps. These were then included in a multiple linear regression model to model and thus remove jumps in the signal between the segments. Segments of only one time point were not included in the JumpCor regressors, and time points with Enorm >0.2 mm were censored in this regression and not included in any further analysis. Color images are available online.
Participants
All study procedures were in accordance with the Institutional Review Board (IRB) policies at the University of Wisconsin-Madison, and written informed consent was obtained from each participating family. One hundred forty nine mother and infant dyads took part in a longitudinal study of the association between early-life experience and infant brain development. The infant sample consisted of 77 females and 72 males who were brought to the MRI facility for imaging at ∼1-month of age (34.1 ± 7.7 days, corrected to a 40-week gestational period). Additional sample details can be found in the study (Dean et al., 2018b) and in the Supplementary Data.
Imaging procedure
Scanning occurred during natural nonsedated sleep (Dean et al., 2014). As previously, A MedVac vacuum immobilization bag (CFI Medical Solutions) and foam cushions were used to limit intrascan motion (Dean et al., 2017, 2018b). Acoustic noise from the scanner was reduced by derating gradient amplitudes and slew rates and using a sound attenuating bore insert, malleable ear plugs, and neonatal ear covers (MiniMuff; Natus Medical, Inc.). Electrodynamic headphones (MR Confon) played white noise during image acquisition.
MRI data were acquired on a 3T General Electric (GE) MR750 MRI scanner (Waukesha, WI) using a 32-channel receive-only RF coil (Nova Medical, Wilmington, MA). A series of sagittal T2*-weighted functional MR images were acquired using an echo-planar imaging (EPI) pulse sequence. Functional MR imaging parameters included the following: repetition time (TR): 2000 ms; echo time: 25 ms; flip angle: 60°; 36 slices; slice thickness: 3.5 mm; in-plane field of view (FOV): 22.4 × 22.4 cm2; matrix: 64 × 64; and 240 volumes for a total acquisition time of 8 min. Structural T2-weighted images were obtained using GE's CUBE imaging pulse sequence (TR: 2500 ms; FOV: 25.6 × 25.6 × 16.0 cm; echo train length: 65; and an acquisition time of 5 min and 36 sec). To reduce the acoustic noise produced during the scan, the gradient slew rates were reduced by ∼67% of their nominal value.
Of the 149 infants, fMRI data were missing from 11 infants, who did not sleep through the entire fMRI scan. Data from 15 infants were excluded from further analysis because large head motion resulted in a large shift and aliasing of the image in the phase encoding direction, caused by a failure of the dynamic phase correction applied by the scanner during reconstruction. Data from an additional 20 infants were excluded because they had <5 min of data left after motion censoring (Enorm >0.2 mm, see Data Analysis section below). Data from four more infants were excluded because the T1- and T2-weighted structural scans were unusable; and one infant's data were excluded because the motion was so large that the brain moved outside the FOV. This left a final sample of 98 infants, of which 72 (73%) exhibited occasional large head movements of several mm (1–24 mm, median 3.0 mm), separated by periods with relatively little motion (Fig. 1).
Data analysis
All data analysis was performed using the analysis of functional neuroimages (AFNI) analysis package, unless otherwise specified (Cox, 1996). The first three time points of the fMRI time series were removed to allow the magnetization to reach steady state, and the data were corrected for slice timing differences (3dTshift). FMRI time series data were then corrected for motion using six-parameter (rigid-body) realignment with a least-square difference of signal intensity cost function (3dvolreg). Regressors to model large jumps in motion (JumpCor) were computed from the volume-to-volume motion (Enorm), as described in JumpCor section above. Data where the Enorm exceeded 0.2 mm were censored and excluded from further analyses. The fMRI time series were then aligned to the T2-weighted structural scan.
A population-specific template was constructed from the infant T2-weighted images using a multivariate image registration approach with the advanced normalization tool software suite (Avants et al., 2011; Dean et al., 2018b). The T2-weighted structural scan was subsequently aligned to the group template using nonlinear warping (AFNI's auto_warp.py). The fMRI-to-structural and structural-to-template transformations were concatenated and applied to the fMRI data, and the fMRI data were resampled to 2 mm isotropic resolution.
The group average T2-weighted template was segmented into white matter, gray matter, and CSF using the FMRIB Software Library's (FSL's) program fast. The T2-weighted image was used for segmentation because the T1-weighted contrast is reversed at 1 month of age with gray matter being brighter than white matter and overall lower gray/white matter contrast than the T2-weighted image. The group template was used for segmentation because the gray/white matter contrast-to-noise ratio in each individual subject's T2 image was too low to perform accurate segmentation. A lateral ventricle mask was defined from the CSF mask using spatial clustering. Ventricular CSF and white-matter masks were then resampled to 2 mm, and the white matter mask was eroded by one voxel.
Motion artifact reduction strategies and evaluation
The strategy for reducing the effects of head motion was to regress out a set of “nuisance” regressors that likely represent motion and other non-neuronal signal variations (“noise”), using AFNI's 3dTproject. Five different sets of nuisance regressors were compared in addition to a “no nuisance regression” control: (1) JumpCor regressors; (2) average eroded white matter, ventricular CSF, realignment parameters, and their derivatives; (3) same as no. 2 but including the JumpCor regressors; (4) same as no. 2 but including the global signal; (5) same as no. 2 but including both the global signal and JumpCor regressors (Table 2).
Table 2.
List of Processing Methods (Different Combinations of Nuisance Regressors) That Were Evaluated in This Study
| Code | Nuisance regressors |
|---|---|
| 0 | None |
| J | JumpCor |
| M | Estimated realignment parameters (Motion) |
| W, C | Average white matter, CSF, and their temporal derivatives |
| W, C, G | Average white matter, CSF, global, and their temporal derivatives |
| M, W, C | Motion, avg. white matter, CSF, and derivatives |
| M, W, C, G | Motion, avg. white matter, CSF, global, and derivatives |
| J, M, W, C | JumpCor, Motion, avg. white matter, CSF, and derivatives |
| J, M, W, C, G | JumpCor, Motion, avg white matter, CSF, global, and derivatives |
0, none; C, average CSF signal and derivative; CSF, cerebrospinal fluid; G, average global signal and derivative; J, JumpCor; M, estimated head motion (six parameters); W, average white matter and temporal derivative.
The mean signal intensity over time was also removed from each voxel's time series as part of this nuisance regression (equivalent to adding a constant as an additional nuisance regressor). The same time point censoring and the same transformation matrices from original to template space were used for all of these strategies. To determine the impact of different choices for the threshold of what level of motion to consider a “jump,” five different thresholds were evaluated (1, 5, 10, 15, 20 mm). Finally, to evaluate the potential influence of spin-history effects that could result in prolonged signal changes after a jump, the above analyses were repeated by excluding an additional five time points (10 sec) of data following each jump. Data were then spatially smoothed using a Gaussian kernel with a full-width at half maximum of 4 mm.
Functional connectivity maps were computed by averaging the preprocessed signal over a seed region of interest and then computing the correlation of this time course with all other voxel time series (3dDeconvolve). Several different seed regions were evaluated: 4 mm spheres placed in motor cortex, auditory cortex, visual cortex, or the posterior cingulate. The coordinates of the center of these spheres relative to the University of North Carolina 1-year brain template (Shi et al., 2011) are provided in Table 1. A constant and linear signal drift over time were included as additional nuisance regressors in this connectivity calculation. Group estimates of functional connectivity were determined using a 1-sample t-test (3dttest++) of the Fisher Z-transformed correlation (connectivity) maps for each seed region.
Table 1.
Seed Regions Used for Functional Connectivity of the Motor Network, Auditory Network, Visual Network, and Default Mode Network
| ROI | Coordinates (LPI) |
|---|---|
| Motor cortex (right) | 22, −18, 44 |
| Auditory cortex (right) | 36, −30, 4 |
| Visual cortex (right) | 8, −80, −18 |
| Posterior cingulate (left) | −4, 40, 24 |
Coordinates are based on the UNC 1 year template, LPI orientation (LPI having negative values). Seed regions consisted of 4 mm radius spheres with the center at the given coordinates.
LPI, left, posterior, inferior; ROI, region-of-interest; UNC, University of North Carolina.
The rationale for examining seed-based functional connectivity maps was that the spatial patterns of the expected functional connectivity, particularly in motor, visual, auditory, and default mode networks, are well known, and the sources of potential artifacts can be more easily identified by their impact on the spatial pattern of estimated functional connectivity (e.g., patterns matching the slice acquisition, alternating positive and negative connectivity in neighboring voxels, strong correlations at edges, and so on).
To investigate the effectiveness of different processing strategies on connectivity throughout the brain, a connectivity matrix was created by first defining 230 regions-of-interest (ROIs) based on a study (Eggebrecht et al., 2017). We then averaged the preprocessed data over these ROIs and computed all possible pairwise Pearson correlations of the ROI time series.
The degree that the data are corrupted by motion, and the effectiveness of different strategies at reducing this noise, was evaluated by computing the Spearman rank correlation between the mean Enorm and the absolute value of the Fisher Z-transformed functional connectivity, across subjects, for each connection in the connectivity matrix (Ciric et al., 2017, 2018; Satterthwaite et al., 2013). Multiple prior studies have used the correlation of the mean Enorm and the functional connectivity as a measure of potential motion artifacts (referred to as the QC-FC metric in the study (Ciric et al., 2017)) (see Supplementary data for further details). A null distribution of the correlation with Enorm was obtained by randomly reshuffling the mean Enorm across subjects and then recalculating the correlation (across subjects) of this reshuffled Enorm with each connection. This was repeated for 1000 random permutations. Finally, we also examined the correlation with other summary measures of motion—the maximum and median jump amplitudes, and the number of jumps.
To further evaluate the impact of various motion correction approaches at the individual subject level, we computed the similarity between each subject's functional connectivity matrix to the group mean connectivity matrix, for each correction. The group mean connectivity matrix for each set of nuisance regressors was obtained by averaging the Fisher-Z transformed functional connectivity matrices across all subjects. The similarity was computed as the Pearson's correlation between each subject's Fisher-Z transformed functional connectivity matrix and the group mean connectivity matrix (using AFNI's 3ddot).
Simulation
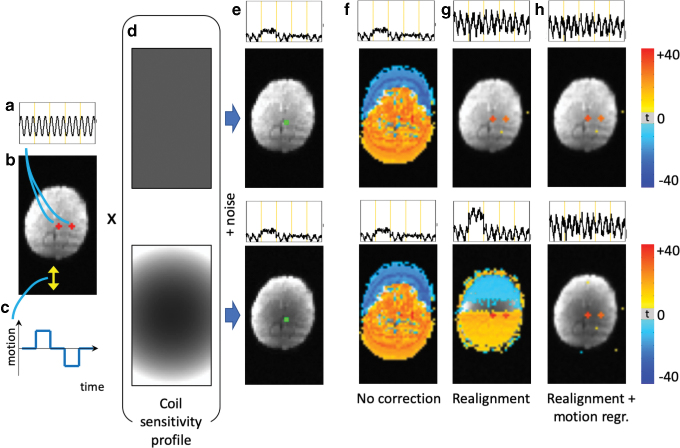
To further understand the impact of different motion correction approaches on data acquired when the head moves into areas with different RF coil sensitivity, we performed a set of simulations. A brain containing functional connectivity was simulated by taking a single EPI brain volume from one of the infant's acquired data, copying it 250 times to create a 250 sec time series, and then superimposing a sinusoidal fluctuation (0.05 Hz, magnitude 2% of the baseline signal) that was identical in two different ROIs (Fig. 6a, b). This brain volume was then translated in the anterior-posterior direction by several millimeters, for a block of time, first in one direction, then back, and then in the opposite direction, and back again (Fig. 6c).
FIG. 6.
Simulation of functional connectivity in the presence of motion with different RF coil sensitivity profiles. A single EPI brain volume from one of the acquired infant data was copied 250 times in time to create a 250 sec time series. A sinusoidal fluctuation (a) was added to two regions, indicated by the red +'s (b). This brain volume was then translated in the anterior-posterior direction by several millimeters, for a block of time, first in on direction, then back, and then in the opposite direction, and back again (c). The image volumes were then multiplied by one of two different coil sensitivity profiles: one that was constant across space, and another that varied across space by a quadratic function (d). Finally, Gaussian distributed random noise with a variance of 1% of the mean signal intensity was added to the time series data. Functional connectivity was estimated by taking the average voxel time series from one voxel (green, e) and computing the correlation with all other voxel time series after different corrections: (f) no further corrections; (g) rigid-body volume registration; (h) rigid-body registration followed by regressing out the estimated realignment parameters. Functional connectivity maps are thresholded at p < 0.001. Time courses for the seed region are shown above the connectivity maps. Functional connectivity maps in the presence of motion without any correction shows high correlation throughout the brain (f). Image registration reduces these motion-related correlations, but only if the coil sensitivity profile is constant across space (g). Motion in the presence of a nonuniform coil sensitivity results in residual signal changes after registration. These residual changes are reduced when regressing out the estimated motion (h). EPI, echo-planar imaging; RF, radio-frequency. Color images are available online.
To avoid interpolation errors and focus primarily on signal changes resulting from movement into different parts of the RF coil sensitivity, the brain was translated by an integer number of voxels. Two different levels of movement were investigated: one voxel (3.5 mm) and three voxels (10.5 mm). For comparison, we investigated motion in both the R–L and A–P directions, as well as using estimated motion from one of the infant scans. The image volumes were then multiplied by one of two different coil sensitivity profiles: one that was constant across space, and another that varied across space by a quadratic function (Fig. 6d). The scale of this quadratic function was chosen to roughly match the coil nonuniformity used in the imaging study. Finally, Gaussian distributed random noise with a variance of 1% of the mean signal intensity was added to the time series data.
These simulated data were then corrected using rigid-body realignment, followed by no further corrections, motion-parameter nuisance regression, or JumpCor. For comparison, the data were also realigned using the actual (input) motion, and the actual motion was regressed from both the data realigned with the estimated and actual motion. Functional connectivity was then estimated by taking the average voxel time series from one of the ROIs with the simulated sinusoidal fluctuation (Fig. 6e) and computing the correlation with all other voxel time series (Fig. 6f–h).
Results
Prevalence of head motion
Of our 98 participants, 72 (73%) exhibited occasional (1–7, median 3) large head movements (1–24 mm, median 3.0 mm), separated by longer periods with very little movement. Figure 1a shows a histogram of the number of large head movements (“jumps”) across subjects, and Figure 1b shows a histogram of the magnitude of the head movements, across all jumps, for all subjects. Figure 1c shows the number of subjects with at least one movement greater than a certain amount (the threshold used to define a “jump”).
Motion artifact reduction strategies and evaluation
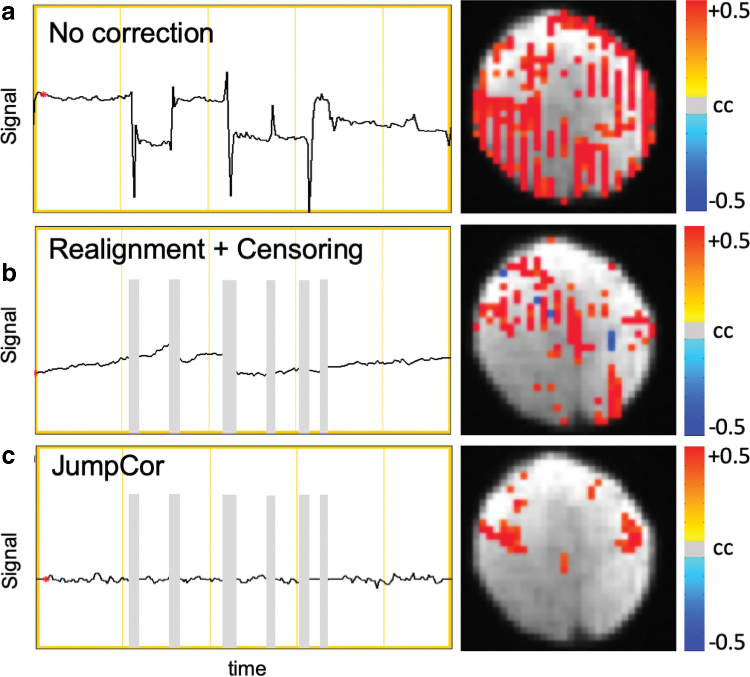
The head motion from one subject illustrating occasional large jumps in motion is shown in Figure 2. The functional connectivity from a seed region in the motor cortex for this subject is shown in Figure 3, in the subject's native space. As expected, without any image realignment, the functional connectivity shows extensive correlations (“connections”) throughout the brain, with a striped pattern in the through-slice (R–L) direction (Fig. 3a). After rigid body realignment and motion censoring (but no other nuisance regression), the functional connectivity still shows correlations across the brain, again with a striped pattern in the through-slice direction (Fig. 3b).
FIG. 3.
Example of time courses (left) and functional connectivity maps (right) for a seed region in the right motor cortex shown in native space overlaid on the echo-planar fMRI time series image. Activation maps are thresholded at p < 0.0005. (a) Signal intensity time series and functional connectivity without any correction or processing. Large signal changes correlated with the seed region are observed throughout the brain, with a striped appearance that matches the orientation of the sagittal slice acquisition. (b) Signal intensity time series and functional connectivity after motion correction (volume registration) and censoring time points with volume-to-volume motion (Enorm) >0.2 mm, as indicated by the gray bars. Residual artifacts are still present. (c) Signal intensity time series and functional connectivity after regressing out the JumpCor regressors. fMRI, functional magnetic resonance imaging. Color images are available online.
The time course from one of the brain voxels indicates that this is likely due to residual motion-induced signal changes that were not removed by the realignment and censoring. JumpCor significantly reduced these residual signal changes, and the resulting motor cortex functional connectivity map shows the expected pattern with strong connectivity to the contralateral primary motor cortex and supplementary motor cortex (Fig. 3c).
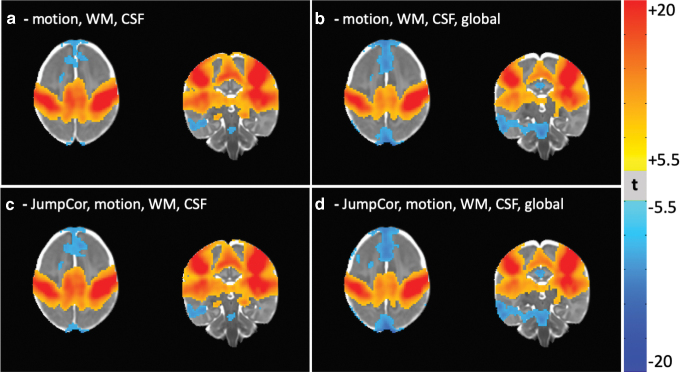
Group connectivity maps (Fig. 4) show very little apparent motion artifact after JumpCor, as well as after all of the typical processing steps (nuisance regression of the estimated head motion and average CSF and white matter signals, with or without the global signal) without JumpCor. Similar results were obtained for group connectivity maps of the auditory cortex, visual cortex, and posterior cingulate (part of the default mode network) (Supplementary Figs. S1–S3).
FIG. 4.
Group functional connectivity maps of a seed region in the right motor cortex, with different sets of nuisance regressors removed in the preprocessing. The nuisance regressors removed for each figure were: (a) motion, average eroded white matter, ventricular CSF, and their temporal derivatives; (b) motion, average eroded white matter, ventricular CSF, the average whole brain (global) signal, and their temporal derivatives; (c) motion, average eroded white matter, ventricular CSF, their temporal derivatives, and the JumpCor regressors; (d) motion, average eroded white matter, ventricular CSF, the average whole brain (global) signal and their temporal derivatives, and the JumpCor regressors. Connectivity maps are thresholded at a Bonferroni corrected p = 0.05 (t-stat = 5.5). CSF, cerebrospinal fluid. Color images are available online.
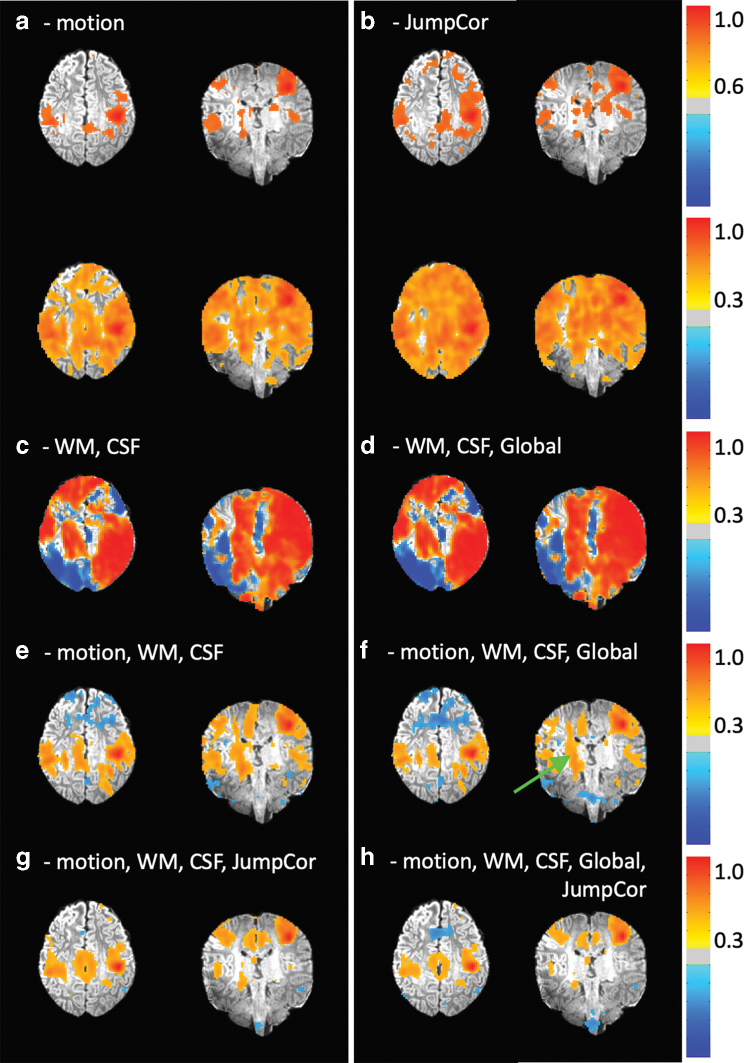
The effects of different sets of nuisance regressors are shown in Figure 5 for the same representative subject shown in Figure 3. Regressing out either the estimated motion parameters or the JumpCor regressors significantly reduced the motion artifact (Fig. 5a, b). In contrast, artifacts remained when regressing out only the average white matter and CSF signal changes and their temporal derivatives (Fig. 5c). This was the case both with and without global signal regression (Fig. 5d). Regressing out the estimated motion together with the white matter, CSF (Fig. 5e) and global signals (Fig. 5f) reduced motion related signal changes. The inclusion of the JumpCor regressors in the nuisance regression (Fig. 5g, h) further reduced the more extensive connections that appeared in the white matter when JumpCor regressors were not included (Fig. 5f, green arrow).
FIG. 5.
Functional connectivity of the motor cortex for one subject that showed occasional large movements (the same subject also shown in Figs. 2 and 3), with different sets of nuisance regressors removed during preprocessing. The nuisance regressors removed for each figure are indicated by the words/abbreviations above each connectivity map. Nuisance regressors: (a) motion = the six realignment parameters, shown at two different thresholds: top row cc = 0.6, bottom row, cc = 0.3; (b) JumpCor = the JumpCor nuisance regressors, shown at two different thresholds: top row cc = 0.6, bottom row, cc = 0.3; (c) WM = average signal over eroded white matter and its temporal derivative; CSF = ventricular CSF and its temporal derivative; (d) WM, CSF, and Global = average signal over the whole brain and its temporal derivative. (e) Motion, WM, CSF. (f) Motion, WM, CSF, and Global. (g) Motion, WM, CSF, and JumpCor. (h) Motion, WM, CSF, Global, and JumpCor. Large artifactual signal changes are reduced by regressing out the estimated motion, but not by regressing out WM, CSF, and Global signal (without motion). Functional connectivity of a motor cortex seed region after nuisance regression of the motion, CSF, WM, and Global signals (f) still showed correlated signal changes outside the motor network in white matter (green arrow). These signal changes are reduced when JumpCor regressors were included in the nuisance regression. WM, white matter. Color images are available online.
Simulation
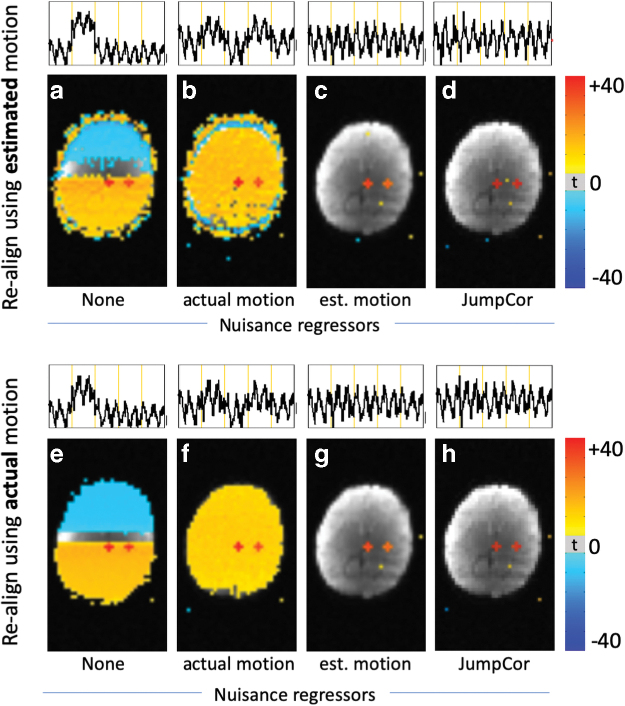
The simulation first showed that, as expected, head motion disrupts the functional connectivity estimate, in this case by causing significant false positive connections (correlations) throughout the brain (Fig. 6f). Applying image realignment eliminated this motion artifact when the coil sensitivity pattern was uniform across the volume. However, the motion artifact was still present after image realignment when the coil sensitivity pattern was spatially nonuniform (Fig. 6g). Motion artifacts were reduced when the estimated head motion parameters were regressed from the data (Fig. 6h). JumpCor also reduced the motion artifacts (Fig. 7d). Similar results were obtained for different levels of motion, different directions of motion (R–L, A–P) (Supplementary Fig. S5), and when using estimated motion taken from one infant's scan (Supplementary Fig. S6).
FIG. 7.
Functional connectivity maps from the simulated data (motion through a nonuniform RF coil sensitivity) for different realignment strategies and different sets of nuisance regressors. Time courses of the center seed region are shown above each connectivity map. Top row (a–c), data were realigned using the estimated motion (AFNI's 3dvolreg), and then different sets of nuisance regressors were removed from the data: (a) no nuisance regression; (b) regressing the actual simulated motion; (c) regressing the estimated motion. Bottom row (d–f), data were realigned using the actual simulated motion, and then different sets of nuisance regressors were removed from the data: (d) no nuisance regression; (e) regressing the actual simulated motion; (f) regressing the estimated motion. Functional connectivity maps are thresholded at p < 0.001. There were only minimal differences between realigning the data using the estimated versus actual motion. However, regressing out the estimated motion reduced the motion artifact (c, f), while regressing out the actual motion did not (b, e). AFNI, Analysis of Functional NeuroImages. Color images are available online.
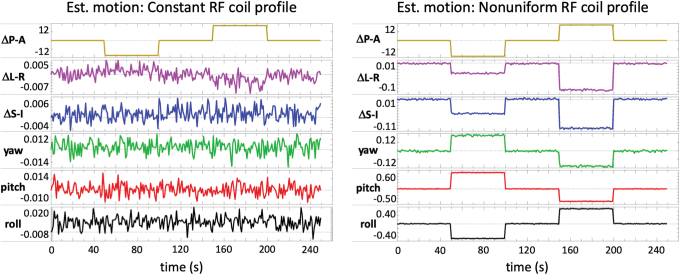
Closer examination of the estimated head motion parameters revealed the likely mechanism that explains why the regression of motion parameters was so effective. The simulated motion was only in one direction (anterior-posterior), and the head motion estimated from the image realignment did correctly show the largest motion to be in this direction (Fig. 8). However, the estimated head motion in the presence of a nonuniform RF coil sensitivity profile also shows small changes (∼0.01–0.5 mm) in the other motion parameters. Furthermore, these errors are not simply scaled copies of the primary movement. For example, the estimated motion in the left-right (L–R) and superior-inferior directions shows negative deviations during the simulated motion that actually occurred in the anterior direction (time points 50–100) and posterior direction (time points 150–200) (Fig. 8). In this way, the six motion parameters form a basis set that allows for the modeling of a wider array of signal changes (e.g., increases in signal for movement in either direction).
FIG. 8.
Estimated motion from a simulated brain volume moving through either (a) a constant or (b) a nonuniform RF coil sensitivity profile. The estimated motion from a brain moving through a constant (uniform) RF coil sensitivity profile shows the large simulated movement in the A–P direction and no systematic changes in the other directions. The estimated motion from a brain moving through a nonuniform RF coil sensitivity profile shows the large simulated motion in the A–P direction, as well as small changes in the other directions that coincide with the periods of movement. Color images are available online.
Functional connectivity maps obtained when aligning the data using the estimated motion are highly similar to those when the data were realigned using the actual motion. The residual motion artifact seen in Figures 6g, 7a and e (realignment without any nuisance regression) is not simply the result of errors in the realignment due to inaccurate estimates of the motion because realigning the data using the true (input) motion still results in artifacts (Fig. 7e). Moreover, regressing out the true motion, either from the data realigned with the true motion or estimated motion, did not correct for this artifact (Fig. 7b, f). Regressing out the estimated motion (Fig. 7c, g) or the JumpCor regressors (Fig. 7d, h) did reduce the motion artifact.
Quantitative measures of motion artifact reduction
Without any nuisance regression, most connections show a strong correlation with motion (Fig. 9a, black line). These correlations were reduced when the estimated head motion was regressed from the data (Fig. 9a, magenta line). When the JumpCor regressors were regressed out of the data, the correlations were substantially reduced and more centered around zero (Fig. 9a, red line). The regression of the estimated motion, average white matter, CSF, global signals, and their temporal derivatives also reduced the correlation with motion (Fig. 9a, green line). The inclusion of the JumpCor regressors in the nuisance regression showed similar results, with an additional slight decrease in correlation (Fig. 9a, blue line).
FIG. 9.
Histograms of the Spearman's rank correlation, across subjects, of the mean volume-to-volume motion (Enorm) and the functional connectivity for all pairwise connections from 230 ROIs, for different sets of nuisance regressors to reduce motion-related signal changes: J = JumpCor regressors, W = average signal over eroded white matter and its temporal derivative, C = average signal over ventricular CSF and its temporal derivative, G = average signal over the whole (global) brain and its temporal derivative, M = estimated realignment parameters. (a) Without any nuisance regression (none, black line), most connections are highly correlated with motion. When JumpCor regressors are removed (red line), the correlation with motion is significantly reduced, being more centered around zero. The correlation is further reduced by regressing out motion, white matter, CSF, and global signals, and even further reduced by regressing out these nuisance regressors and the JumpCor regressors. Null distribution is obtained by permuting the mean framewise displacement across subjects and then recomputing the Spearman's rank correlation. (b, c) Histograms for different thresholds for what is considered a “jump.” (b) after regressing out only the JumpCor regressors; (c) after regressing out the JumpCor regressors (J), average signal over eroded white matter and its temporal derivative (W), average signal over ventricular CSF and its temporal derivative (C), G = average signal over the whole (global) brain and its temporal derivative (G), and the estimated realignment parameters (M). Reducing the jump threshold reduces the correlation with motion when only the JumpCor regressors are removed. When all of the nuisance regressors are removed, different jump thresholds have only a small effect. ROI, region-of-interest. Color images are available online.
The histogram of correlation with motion after nuisance regression (JumpCor, white matter, CSF, global signals) was close to the null distribution obtained from permuting the mean Enorm values (Fig. 9, gray band). Censoring an additional five time points (10 sec) of data after each jump resulted in no difference in the association with the mean Enorm (Supplementary Fig. S8). Similar results were obtained when examining the correlation with the maximum jump amplitude, median jump amplitude, and number of jumps (Supplementary Fig. S9).
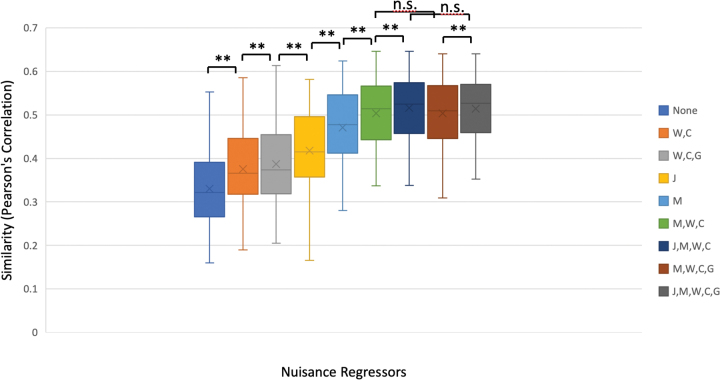
Removing jumps in motion using the JumpCor regressors resulted in a significant increase in similarity compared to regressing out only white matter, CSF, global signals, and their derivatives (Fig. 10). Regressing out the estimated head motion resulted in even higher similarity. The similarity further improved when the tissue-based regressors were combined with the estimated head motion. The addition of the JumpCor regressors to the estimated head motion and tissue-based regressors resulted in a significant increase in similarity (p < 0.001). Regressing out the global signal and its derivative did not have a significant impact on similarity when the other tissue based regressors and estimated head motion were regressed from the data (Supplementary Fig. S7).
FIG. 10.
Box plots showing the similarity between each subject's functional connectivity matrix and the group average functional connectivity matrix, for different sets of nuisance regressors: None, J = JumpCor, M = estimated motion parameters, W = average signal over white matter and the temporal derivative, C = average signal over CSF and the temporal derivative, G = average signal over the whole brain (global) and the temporal derivative. **(p < 0.001), n.s. (p > 0.2). The inclusion of the JumpCor regressors together with the estimated motion (M) and tissue based regressors (W, C, G) results in a significant increase in similarity between the individual subject and group connectivity matrices. No significant differences in similarity were observed with versus without the inclusion of the global signal and its derivative when the other regressors (J, M, W, C) were included. n.s., not significant. Color images are available online.
The effect of different jump thresholds
For higher thresholds (e.g., 20 mm) very few jumps are identified, and the correlation of the absolute value of functional connectivity with motion is similar to that when no nuisance regression is performed. As the jump threshold is lowered, the correlation with motion decreased, until a threshold of about 5 mm, with relatively little difference for smaller jump thresholds (Fig. 9b). When the average white matter, ventricular CSF, and global signals were regressed from the data, different jump thresholds had relatively little effect (Fig. 9c).
Discussion
Large head motion can result in significant residual motion-related signal changes even after realignment and motion censoring, in large part due to the head moving into different parts of the coil sensitivity profile. Our proposed correction technique, JumpCor, successfully reduces these changes when they occur infrequently during the imaging run.
Somewhat surprisingly, regressing out the estimated head motion parameters (a common preprocessing step in resting-state fMRI) also successfully reduces these motion artifacts. The reason this result is surprising is that the signal change resulting from head motion is not necessarily linearly related to the head motion, particularly if the coil sensitivity profile is spatially nonlinear and if the motion is large relative to this sensitivity profile (e.g., as illustrated in Supplementary Fig. S4).
Our simulations suggest that nuisance regression of the motion parameters is likely successful because the signal changes resulting from moving into a different part of the coil sensitivity affect the estimated head motion in such a way that the six realignment parameters form a basis set that can model a wider array of motion-induced signal changes. Therefore, nuisance regression of the six realignment parameters can reduce artifacts even for very large movements.
In this simulation, we examined different amounts of motion (one voxel and three voxels), directions of motion (A–P, L–R), and temporal patterns of motion (A–P translation and motion estimated from one infant). In all cases, the estimated motion parameters had slight errors that provided a basis set to estimate the resulting signal changes. However, there is no way to test and examine all possible types of motion, objects, and coil sensitivity profiles, and therefore, there is no way to guarantee that the regression of estimated motion parameters will always work so well. Therefore, if residual signal changes from occasional jumps in motion remain, JumpCor could be used to reduce them.
Although the motion-induced signal intensity changes are reduced by either JumpCor or motion parameter nuisance regression, our simulation shows that large movement through a nonuniform coil sensitivity can result in slight errors in the realignment. How significant is this misalignment? In our simulation, a movement of ±10.5 mm resulted in erroneous motion estimates of up to ±0.5 mm. Although we are often concerned with movements as low as 0.2 mm in functional connectivity studies, here we have already censored time points with an Enorm >0.2 mm, and using either JumpCor or the regression of the estimated motion we have reduced the signal intensity changes associated with this movement. Therefore, these signal changes should not contribute to false connectivity.
An alternative strategy if alignment errors are of concern is to use a realignment technique that is not as sensitive to the difference in signal intensity, such as boundary-based registration. Nevertheless, even if the realignment is accurate, signal changes resulting from moving into different parts of the coil sensitivity pattern would remain. These changes would not necessarily be reduced by regressing out the accurately estimated motion parameters (e.g., as shown in Fig. 7b, f). In this case, JumpCor could be used to reduce the residual motion-reduced signal changes.
While group functional connectivity maps (Fig. 4, Supplementary Figs. S1–S3) showed very little difference between including or not-including the JumpCor regressors, the effects of JumpCor were more significant at the individual subject level. JumpCor significantly increased the similarity between the individual connectivity maps and the group average, reducing between-subject variability associated with the large “jumps” in signal due to head motion.
The finding that censoring an additional 10 sec of data after each jump did not change the results suggests that the observed motion-related signal changes in this sample are not due to spin-history effects associated with the jumps. Furthermore, gray plots (Supplementary Figs. S10–S13) show prolonged signal increases or decreases in the period between jumps (green and yellow arrows, respectively), consistent with moving into a different part of the RF coil sensitivity, but no clear transient effects after each jump as may be expected with spin-history effects. Both JumpCor and the regression of estimated motion reduce these prolonged signal changes. The global signal changes remaining after JumpCor were not synchronized with the motion. These residual signal changes are most likely due to physiological noise (e.g., aliased respiration) since similar global fluctuations were also observed in subjects who showed relatively little head motion (Supplementary Fig. S12–S13).
The motion threshold that should be used to define a “jump” is a tradeoff between flexibility in modeling motion and degrees of freedom. In our dataset, a threshold of 1 mm reduced motion artifacts while only requiring an additional 2–8 degrees-of-freedom (1–7 jumps, median 3). Accounting for the degrees of freedom is important to estimate statistics correctly, and many common preprocessing approaches, such as temporal filtering, can significantly reduce the degrees of freedom. The numbers of additional JumpCor regressors are relatively small, but should be considered in the context of other processing choices, the duration of the imaging run, and the total number of data points acquired.
In our data, the correlation with mean Enorm decreased with lower jump thresholds, but with similar results for 1 and 5 mm thresholds (Fig. 9b). However, when the estimated motion was regressed from the data, different jump thresholds had minimal effect (Fig. 9c). This minimal effect is likely because the estimated motion parameters are already reducing the motion artifact.
The JumpCor technique presented here regressed out a constant for each segment between the jumps. In principle, one could increase the number and order of polynomials to account for more complex signal dynamics, such as those resulting from spin-history effects.
An alternative approach to reduce the effects of large movements in the presence of nonuniform coil sensitivity is to estimate the bias fields from the acquired images and then correct for the spatial nonuniformity (Seshamani et al., 2014). Finally, an alternative strategy to reduce motion artifacts is to use prospective motion correction (Thesen et al., 2000; Todd et al., 2015; Ward et al., 1998, 2000). Unfortunately, this technology is not yet available on all scanners and does not correct for variations in signal intensity due to the brain moving into a different part of the coil sensitivity. Our proposed technique provides a relatively simple method to deal with this artifact when such technology is unavailable.
Conclusions
Residual head motion-related signal changes in fMRI resulting from moving into a different part of the RF coil sensitivity can be successfully corrected by regressing out the estimated head motion, even when the motion is relatively large. In addition, we present an alternative correction method, JumpCor, that reduces motion artifacts resulting from large infrequent head movements (jumps). This technique significantly reduces artifacts and improves the quality of functional connectivity estimates when combined with the typical preprocessing approach (regressing out the estimated head motion and tissue based regressors). We therefore recommend that JumpCor be added to the typical nuisance regressors used to reduce noise when large jumps in motion are present in the data.
This technique, as well as the knowledge that regression of estimated motion successfully reduces motion artifacts even in the presence of very large head motion (several mm), should reduce the data loss in studies where participants exhibit this type of motion, such as sleeping infants. JumpCor could prove to be a great advantage in developmental neuroimaging studies.
Supplementary Material
Acknowledgments
The authors thank N. Schmidt, C. Frye for assistance in recruitment and data collection and the families for their participation.
Authors' Contributions
R.M.B.: conceptualization, investigation, methodology, formal analysis, writing—original draft, writing—review and editing. D.C.D.: conceptualization, investigation, formal analysis, writing—original draft, writing—review and editing. W.W.: investigation, formal analysis, writing—review and editing. E.M.P.: investigation, formal analysis, writing—review and editing. S.K.: investigation, methodology, writing—review and editing. A.L.A.: conceptualization, investigation, writing—review and editing, project administration, funding acquisition. H.H.G.: conceptualization, writing—review and editing, project administration, funding acquisition. R.J.D.: conceptualization, writing—review and editing, project administration, funding acquisition.
Author Disclosure Statement
R.M.B. is a consultant for NOUS Imaging, Inc., a company that produces the FIRMM motion monitoring software. R.J.D. is the founder, president, and serves on the board of directors for the non-profit organization, Healthy Minds Innovations, Inc.
Funding Information
Funding for this research was provided by NIH grant P50MH100031, the HealthEmotions Research Institute, and the Waisman Center.
Supplementary Material
References
- Avants BB, Tustison NJ, Wu J, et al. 2011. An open source multivariate framework for n-tissue segmentation with evaluation on public data. Neuroinformatics 9:381–400. [DOI] [PMC free article] [PubMed] [Google Scholar]
- Ciric R, Rosen AFG, Erus G, et al. 2018. Mitigating head motion artifact in functional connectivity MRI. Nat Protoc 13:2801–2826. [DOI] [PMC free article] [PubMed] [Google Scholar]
- Ciric R, Wolf DH, Power JD, et al. 2017. Benchmarking of participant-level confound regression strategies for the control of motion artifact in studies of functional connectivity. Neuroimage 154:174–187. [DOI] [PMC free article] [PubMed] [Google Scholar]
- Cox RW. 1996. AFNI: software for analysis and visualization of functional magnetic resonance neuroimages. Comput Biomed Res 29:162–173. [DOI] [PubMed] [Google Scholar]
- Dean, 3rd DC, Dirks H, O'Muircheartaigh J, et al. 2014. Pediatric neuroimaging using magnetic resonance imaging during non-sedated sleep. Pediatr Radiol 44:64–72. [DOI] [PMC free article] [PubMed] [Google Scholar]
- Dean, 3rd DC, Planalp EM, Wooten W, et al. 2017. Mapping white matter microstructure in the one month human brain. Sci Rep 7:9759. [DOI] [PMC free article] [PubMed] [Google Scholar]
- Dean, 3rd DC, Planalp EM, Wooten W, et al. 2018a. Association of prenatal maternal depression and anxiety symptoms with infant white matter microstructure. JAMA Pediatr 172:973–981. [DOI] [PMC free article] [PubMed] [Google Scholar]
- Dean, 3rd DC, Planalp EM, Wooten W, et al. 2018b. Investigation of brain structure in the 1-month infant. Brain Struct Funct 223:1953–1970. [DOI] [PMC free article] [PubMed] [Google Scholar]
- Eggebrecht AT, Elison JT, Feczko E, et al. 2017. Joint attention and brain functional connectivity in infants and toddlers. Cereb Cortex 27:1709–1720. [DOI] [PMC free article] [PubMed] [Google Scholar]
- Friston KJ, Williams S, Howard R, et al. 1996. Movement-related effects in fMRI time-series. Magn Reson Med 35:346–355. [DOI] [PubMed] [Google Scholar]
- Grootoonk S, Hutton C, Ashburner J, et al. 2000. Characterization and correction of interpolation effects in the realignment of fMRI time series. Neuroimage 11:49–57. [DOI] [PubMed] [Google Scholar]
- Jezzard P and Clare S. 1999. Sources of distortion in functional MRI data. Hum Brain Mapp 8:80–85. [DOI] [PMC free article] [PubMed] [Google Scholar]
- Parkes L, Fulcher B, Yucel M, et al. 2018. An evaluation of the efficacy, reliability, and sensitivity of motion correction strategies for resting-state functional MRI. Neuroimage 171:415–436. [DOI] [PubMed] [Google Scholar]
- Power JD, Barnes KA, Snyder AZ, et al. 2012. Spurious but systematic correlations in functional connectivity MRI networks arise from subject motion. Neuroimage 59:2142–2154. [DOI] [PMC free article] [PubMed] [Google Scholar]
- Satterthwaite TD, Elliott MA, Gerraty RT, et al. 2013. An improved framework for confound regression and filtering for control of motion artifact in the preprocessing of resting-state functional connectivity data. Neuroimage 64:240–256. [DOI] [PMC free article] [PubMed] [Google Scholar]
- Satterthwaite TD, Wolf DH, Loughead J, et al. 2012. Impact of in-scanner head motion on multiple measures of functional connectivity: relevance for studies of neurodevelopment in youth. Neuroimage 60:623–632. [DOI] [PMC free article] [PubMed] [Google Scholar]
- Satterthwaite TD, Wolf DH, Ruparel K, et al. 2013. Heterogeneous impact of motion on fundamental patterns of developmental changes in functional connectivity during youth. Neuroimage 83:45–57. [DOI] [PMC free article] [PubMed] [Google Scholar]
- Seshamani S, Cheng X, Fogtmann M, et al. 2014. A method for handling intensity inhomogenieties in fMRI sequences of moving anatomy of the early developing brain. Med Image Anal 18:285–300. [DOI] [PMC free article] [PubMed] [Google Scholar]
- Shi F, Yap PT, Wu G, et al. 2011. Infant brain atlases from neonates to 1- and 2-year-olds. PLoS One 6:e18746. [DOI] [PMC free article] [PubMed] [Google Scholar]
- Thesen S, Heid O, Mueller E, et al. 2000. Prospective acquisition correction for head motion with image-based tracking for real-time fMRI. Magn Reson Med 44:457–465. [DOI] [PubMed] [Google Scholar]
- Todd N, Josephs O, Callaghan MF, et al. 2015. Prospective motion correction of 3D echo-planar imaging data for functional MRI using optical tracking. Neuroimage 113:1–12. [DOI] [PMC free article] [PubMed] [Google Scholar]
- Vanderwal T, Eilbott J, Kelly C, et al. 2020. Stability and similarity of the pediatric connectome as developmental measures. Neuroimage 226:117537. [DOI] [PubMed] [Google Scholar]
- Van Dijk KR, Sabuncu MR, and Buckner RL. 2012. The influence of head motion on intrinsic functional connectivity MRI. Neuroimage 59:431–438. [DOI] [PMC free article] [PubMed] [Google Scholar]
- Ward HA, Lee CC, Grimm RC, et al. 1998. Multi-axis real-time prospective motion correction in fMRI. In: Proceedings of ISMRM 6th Scientific Meeting, Sydney, Australia. [Google Scholar]
- Ward HA, Riederer SJ, Grimm RC, et al. 2000. Prospective multiaxial motion correction for fMRI. Magn Reson Med 43:459–469. [DOI] [PubMed] [Google Scholar]
Associated Data
This section collects any data citations, data availability statements, or supplementary materials included in this article.


