FIG. 3.
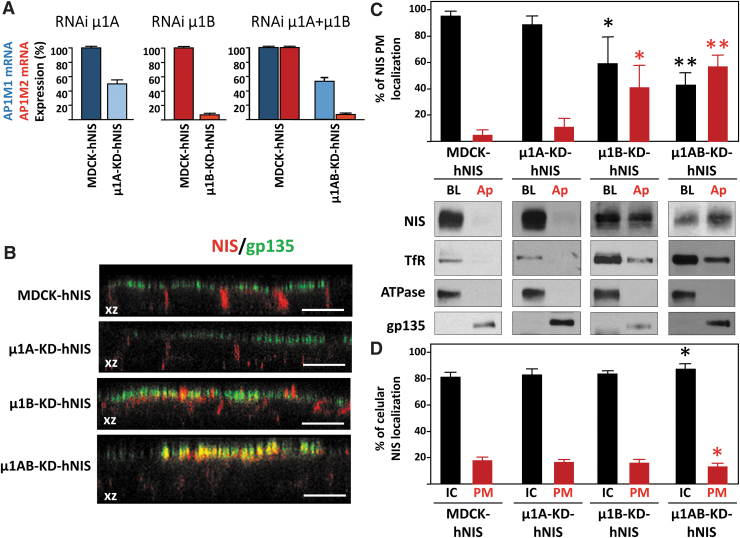
NIS localization in the absence of μ1A, μ1B, or both. (A) AP1M1 and/or AP1M2 mRNA levels were determined by RT-qPCR in control MDCK-hNIS cells and in μ1A RNAi knockdown (μ1A-KD-hNIS), μ1B knockdown (μ1B-KD-hNIS), and μ1A+B knockdown (μ1AB-KD-hNIS) cells. (B) MDCK-hNIS, μ1A-KD-hNIS, μ1B-KD-hNIS, and μ1AB-KD-hNIS cells were plated on polycarbonate filters and analyzed for the polarized distribution of NIS. Representative confocal immunofluorescence orthogonal xz plane views stained for NIS (red) and the apical glycoprotein gp135 (green) are shown. Scale bars, 10 μm. (C) Cells plated on polycarbonate filters were analyzed for the polarized distribution of NIS by biotinylation. Representative Western blots of NIS, TfR, α-Na+/K+-ATPase, and gp135 proteins in basolateral (BL) and apical (Ap) domains are shown. The upper part shows the quantification of the NIS signal in each domain as the percentage of the total PM protein (Ap+BL). (D) Quantification of NIS localization IC vs. PM (BL+Ap). In (C, D) data represent the mean ± SD for at least three experiments. Differences vs. control (MDCK-hNIS) were considered significant: *p < 0.05; **p < 0.01. IC, intracellular; RT-qPCR, quantitative reverse transcription polymerase chain reaction.

