Abstract
Background:
The clinical risk classification of acute myelocytic leukemia (AML) is largely based on cytogenetic and molecular genetic detection. However, the optimal treatment for intermediate-risk AML patients remains uncertain. Further refinement and improvement of prognostic stratification are therefore necessary.
Objectives:
The aim of this study was to identify serum protein biomarkers to refine risk stratification in AML patients.
Design:
This study is a retrospective study.
Methods:
Label-free proteomics was used to identify the differential abundance of serum proteins in AML patients. Transcriptomic data were combined to identify key altered markers that could indicate the risk rank of AML patients. The survival status was assessed by Kaplan–Meier and multivariate Cox regression analyses.
Results:
We delineated serum protein expression in a population of AML patients. Many biological processes were influenced by the identified differentially expressed proteins. Association analysis of transcriptome data showed that intercellular adhesion molecule-2 (ICAM2) had a higher survival prediction value in the intermediate-risk AML group. ICAM2 was detrimental for intermediate-risk AML, regardless of whether patients received bone marrow transplantation. ICAM2 well distinguishes the intermediate group of patients, whose probability of survival is comparable to that of patients with the ELN-2017 according to the reference classification. In addition, newly established stratified clinical features were associated with leukemia stem cell scores.
Conclusion:
The inclusion of ICAM2 expression into the AML risk classification according to ELN-2017 was a good way to transfer patients from three to two groups. Thus, providing more information for clinical decision-making to improve intermediate-risk stratification in AML patients.
Keywords: acute myeloid leukemia, ICAM2, proteomics, risk stratification
Introduction
Molecular cytogenetics is the most important prognostic factor of acute myeloid leukemia (AML), which is the basis of the current risk classification of AML.1 However, nearly 50% of AML patients were classified into the intermediate-risk group, whose prognostic stratification was limited by cytogenetic heterogeneity.2 This group encompasses patients characterized by cytogenetically normal AML (CN-AML) and trisomy 8 (+8), t(9;11), or other chromosomal changes.3 The identification of effective biomarkers may contribute to the development of more precise risk adjustments, providing more information for clinical decision-making to improve intermediate-risk stratification in AML patients.
Genomic expression profiling has been demonstrated as a reliable and efficient method in the fields of cancer classification and prognostication.4 However, instead of catalyzing and signal transducing directly, genes perform their functions by being translated into functional proteins.5 Moreover, the generation of protein diversity from a single gene leads to inherent limitations in genome discovery studies, including epigenetic modification, alternative splicing, and posttranslational modification.6,7 High throughput proteomics approaches create more possibilities for studying complex human diseases and searching for potential proteins as predictors or new therapeutic targets as well.8,9 Importantly, secreted proteins originating from tumor cells have a greater likelihood of reaching the systemic circulation and can be used as biomarkers for early detection.10 Serum proteomic analysis provides insight into the specific pathological conditions that cause protein alterations, especially in hematologic diseases.
We have previously developed a ClinProt system to identify serum candidate peptides for monitoring minimum residual disease (MRD) in adult leukemia, suggesting that FGA, GSTP1, PF4, and CTAP-III could be potential biomarkers for predicting leukemia recurrence and evaluating treatment response.11 With the advent of the post-genomic era and the development of proteomics technology, the methods applied to quantitative protein detection are getting more precise.12 Label-free mass spectrometry (MS) can be applied to the quantitative analysis of proteins in any sample, which demonstrated high data portability and wide adaptability compared with the quantitative data from different sources of the same sample.13,14
Here, we combine label-free quantitative proteomics with transcriptomics to figure out the critical altered proteins which can indicate the risk rank of AML patients. Significantly altered serum proteins expressed in AML bone marrow and their potential clinical contributions are discussed. Our research shows that intercellular adhesion molecule-2 (ICAM2) has an important guiding value in the prognosis of intermediate-risk AML, and patients could be further subdivided into risk stratification based on ICAM2 expression, which could optimize the 2017 update of the European Leukemia Net recommendations on genetic (ELN-2017) risk classification to achieve individualized treatment.
Materials and methods
Patient population
The participants were recruited from the Zhongnan Hospital of Wuhan University (Wuhan, China). The diagnosis and classification criteria of AML were made according to the 2016 World Health Organization Classification for AML.15 The subjects enrolled in this study were newly diagnosed AML patients, none of whom had received DNA-demethylating drugs or other medical treatment before obtaining plasma samples. Bone marrow plasma samples from 10 AML patients and three healthy volunteers were used for proteomic analysis, and all participants were required to obtain written informed consent before sample collection began. This study was approved by the Ethics in Research Committee of the Zhongnan Hospital of Wuhan University in Wuhan, China.
Proteomics analysis and data processing
The processing process of serum protein samples includes protein preparation and digestion, tandem mass tagging (TMT) labeling, high-performance liquid chromatography (HPLC) fractional separation, LC-MS/MS analysis, and data analysis. A label-free quantitation method was supported by Jingjie PTM BioLabs. The data matrix was normalized to mean the expression of proteins with duplicate names, and proteins with missing values were excluded. In addition, the R package clusterProfiler was used for Gene Ontology (GO) and Kyoto Encyclopedia of Genes and Genomes (KEGG) pathway analysis, and the R package ggplot was used for data visualization.
Data availability
To assess coverage and differential expression between proteomics and transcriptome approaches, we performed a joint analysis of publicly available transcriptome sequencing datasets, including two datasets from Gene Expression Omnibus (GEO) with accession numbers GSE12662 and GSE13159. Clinical information and ICAM2 expression data were analyzed from the Oregon Health and Science University (OHSU)-AML project (405 patients) and the Cancer Genome Atlas (TCGA)-AML (151 patients).
Statistical analyses
Statistical analysis and data visualization were performed using GraphPad Prism (version 8.02). Univariate and multivariate Cox regression analyses were performed using survival packages to test independent prognostic factors in R software (version 3.5.2). Kaplan–Meier survival analysis was used to evaluate the prognostic value of ICAM2 cutoff value, and intermediate-risk AML patients were grouped according to the optimal difference in overall survival (OS). The Chi-square test or Fisher’s exact test was used for categorical variables comparison, and the Student unpaired t-test or Mann–Whitney U test was used for continuous variables comparison between the two groups. A p-value less than 0.05 was considered statistically significant. The reporting of this study conforms to the STROBE statement.16,17 A checklist of the STROBE statement for cohort studies is shown in Supplemental Table S1.
Results
Global serum proteins expression in AML
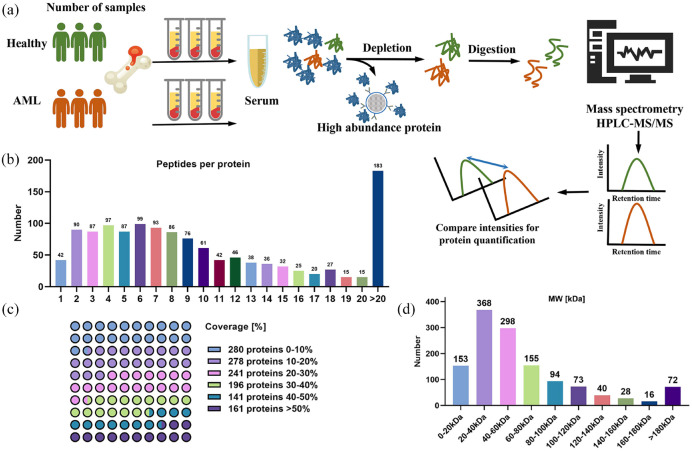
The proteome of bone marrow serum samples from AML patients was analyzed by label-free relative quantitative proteomics. The experimental flow chart of protein preparation, trypsin digestion, chemical labeling, and HPLC-MS/MS treatment is shown in Figure 1(a). Details of the clinical characteristics of the subjects are provided in Supplemental Table S2. With the strategy and methods described above, 1297 serum proteins were detected from 15,704 matched peptides. Notably, 89.82% of identifications were based on three or more matching peptides, and multiple specific peptides for each protein increase the accuracy and reliability of quantitative results [Figure 1(b)]. In addition, most proteins were identified with good peptide coverage, and the coverage of ~30% protein sequence was 61.60% [Figure 1(c)]. In terms of protein molecular weight (MW) distribution, 90.05% of the mass values were between 10 and 140 kDa, indicating a wide average coverage across the board [Figure 1(d)]. Overall, the data quality of the key variables was acceptable.
Figure 1.
Proteomic analysis of serum from bone marrow in normal and AML patients. (a) Schematic of general protein quantitation by mass spectrometry. Healthy, n = 3; AML, n = 10. (b) Most proteins correspond to more than two peptides, and multiple specific peptides for each protein can increase the accuracy and reliability of quantitative results. (c) Percentage of protein coverage by the identified peptides. (d) Distribution of proteins of different molecular weights.
Differential serum protein abundance in AML
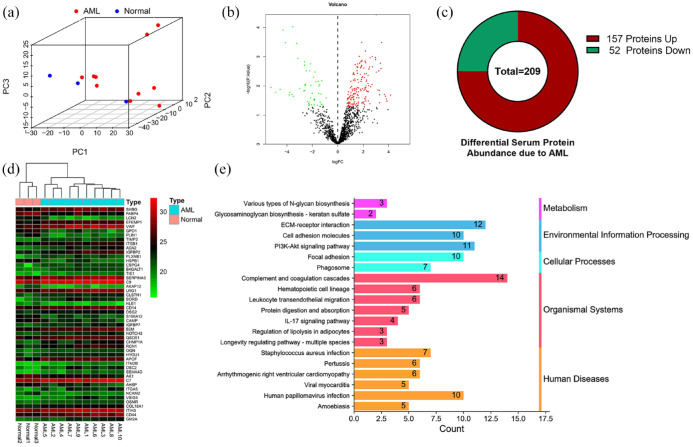
Principal component analysis (PCA) and three-dimensional scatter plots were used to show differences between samples, and bone marrow serum proteomics could significantly distinguish between healthy and AML samples [Figure 2(a)]. To determine the proteins rich in the serum of AML patients, we compared 1297 serum proteins after quality control and found that 157 proteins were upregulated and 52 proteins were down-regulated [Figure 2(b)-(c)]. The heat map shows the top 50 differential proteins with significant changes [Figure 2(d)], and details of all abnormally expressed proteins identified are provided in Supplemental Table S3. To understand the biological processes and pathways of abnormally expressed proteins in AML patients, we conducted the GO and KEGG enrichment analysis. The enriched GO networks are shown in Supplemental Figure S1, the biological processes (BP) included ‘acute inflammatory response’, ‘neutrophil degranulation’, etc. In addition, the most enriched GO terms in cellular component (CC) was ‘collagen-containing extracellular matrix’, and that in molecular function (MF) was ‘extracellular matrix structural constituent’, and the details are in Supplemental Table S4. The KEGG results elucidated the potential biological functions (p-value < 0.05), and a total of 20 significantly enriched pathways were obtained (Supplemental Table S5). These pathways involve five aspects, including human diseases, organismal systems, cellular processes, environmental information processing, and metabolism [Figure 2(e)].
Figure 2.
Proteomics analysis reveals differential protein expression in the bone marrow of AML patients. (a) Principal component analysis (PCA) showed a correlation between bone marrow serum proteomics data of healthy subjects and AML patients. (b) Volcano plots for expression of differentially expressed proteins, red and green separately represent upregulation and down-regulation. (c) A total of 157 upregulated proteins and 52 downregulated proteins were identified. (d) The heat map shows the top 50 differential proteins with significant changes. (e) The bar chart details the number of related proteins that are significantly altered in a particular pathway.
Comparison of transcriptome and proteome data to identify predictors of clinical value
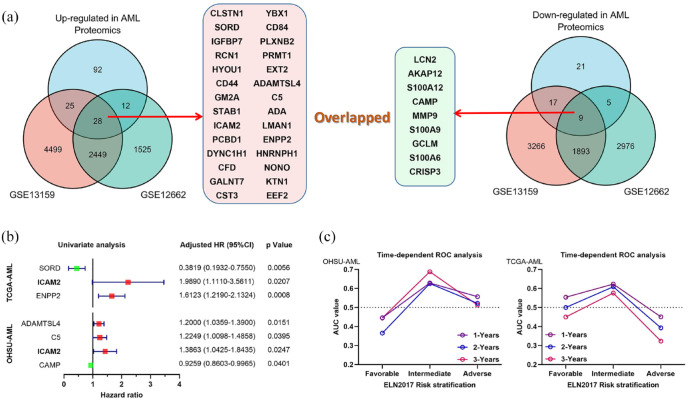
More recently, these AML bone marrow aspirates were analyzed using transcriptome to identify differentially expressed genes shared in a publicly available data set (Supplemental Figure S2). Therefore, we compared our proteomic results with two previously published transcriptome datasets.18,19 By comparing proteome and transcriptome data sets, we found 28 upregulated genes and nine downregulated genes in AML [Figure 3(a)]. Further exploring the clinical value of these overlapping genes, we performed a univariate Cox regression analysis using two independent AML study cohorts (Supplemental Table S6). In the OHSU-AML cohort, the results showed four major risk determinants including CAPM [hazard ratio (HR) = 0.9259, 95% confidence interval (CI) = 0.8603–0.9965, p = 0.0401], ICAM2 (HR = 1.3863, 95% CI = 1.0425–1.8435, p = 0.0247), C5 (HR = 1.2249, 95% CI = 1.0098–1.4858, p = 0.0395), and ADAMTSL4 (HR = 1.2000, 95% CI = 1.0359–1.3900, p = 0.0151). However, three risk genes were associated in the TCGA cohort, including ENPP2 (HR = 1.6123, 95% CI = 1.2190–2.1324, p = 0.0008), ICAM2 (HR = 1.9890, 95% CI = 1.1110–3.5611, p = 0.0207), and SORD (HR = 0.3819, 95% CI = 0.1932–0.7550, p = 0.0056). Therefore, we are more confident that ICAM2 has a predictive risk value in AML because of consistent results across cohorts [Figure 3(b)]. Considering the relationship between ELN-2017 risk classification and AML outcomes, we assessed the predictive value of ICAM2 with each risk stratification by time-dependent receiver operating characteristic (ROC). The results suggest that the expression level of ICAM2 has a superior predictive value in the intermediate-risk group, compared with the favorable-risk group and the adverse-risk group. We confirmed that this trend was also evident in the TCGA-AML cohort [Figure 3(c)]. Details of area values under curves of 1, 3, and 5 years for each group are shown in Supplemental Figure S3. Based on this, we next focused on the potential significance of ICAM2 in intermediate-risk AML patients.
Figure 3.
Compare the differences between proteome and transcriptome analyses. (a) The overall analysis of our serum proteomic changes in AML with two previously reported transcriptome datasets (GSE13159 and GSE12662). (b) Univariate Cox regression analysis of overlapping differential genes in OHSU-AML and TCGA-AML cohorts. (c) Time-dependent receiver operating characteristic (ROC) curves of ICAM2 for 1, 3, and 5 years overall survival in ELN-2017 stratification.
ICAM2 status stratifies patients with intermediate prognosis
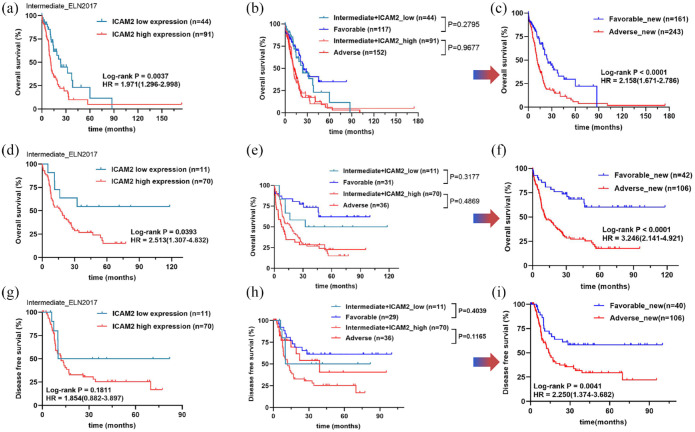
Risk stratification for the choice of treatment in intermediate-risk AML is currently a challenge. In the cytogenetic intermediate-risk group, patients with a high ICAM2 status at diagnosis had poorer OS (HR = 1.971, 95% CI = 1.296–2.998, p = 0.0037) than patients with a low ICAM2 status [Figure 4(a)]. Insofar as stratification at diagnosis is currently based on the ELN-2017 risk classification, we determined that ICAM2 status refines this stratification, especially in the intermediate-risk group [Figure 4(b)]. Among these patients, the OS trends in patients with high ICAM2 expression were very similar to those in the ELN-2017 adverse-risk group (p = 0.9677). Interestingly, there were no significant differences between low ICAM2 expression and the ELN-2017 favorable-risk group in patients (p = 0.2795). Therefore, ICAM2 better discriminates AML patients in the intermediate-risk group and does not influence the results of the traditional ELN-2017 [Figure 4(c)]. Next, we performed a univariate Cox regression analysis to correlate ICAM2 status with clinical variables. The results showed that variables with p less than 0.1 included age, FLT3-ITD, NPM1, transplant, and ICAM2 status. Multivariate Cox regression analysis showed that age over 60 years, transplant treatment, and high ICAM2 expression independently predicted OS in intermediate-risk AML (Table 1). To confirm this finding, we also used data of 151 patients from the TCGA-AML cohort for validation (Supplemental Table S7). ICAM2 can indeed differentiate intermediate-risk stratification well, thus optimizing ELN-2017 stratification [Figure 4(d)-(f)]. Moreover, we compared the disease-free survival (DFS) of each group, and we observed that the highly expressed ICAM2 group had shorter DFS, although not statistically significant [Figure 4(g)]. Similarly, we compared high-expression ICAM2 with the adverse-risk group, and low-expression ICAM2 with the favorable-risk group, which were also relatively consistent [Figure 4(h)]. However, ELN-2017 stratification based on ICAM2 optimization can still effectively distinguish DFS (HR = 2.250, 95% CI = 1.374–3.682, p = 0.0041) in AML patients [Figure 4(i)]. Finally, we define ICAM2-based optimization stratification as risk_new, which can be divided into two groups: favorable_new and adverse_new.
Figure 4.
Optimization of AML ELN-2017 risk stratification based on ICAM2 expression. (a–c) High expression of ICAM2 is associated with poor prognosis in the intermediate-risk AML and combined with ICAM2 expression improved ELN2017 risk stratification into two groups. (d–f) The possibility and accuracy of ICAM2 to optimize ELN-2017 risk stratification was verified in the TCGA-AML cohort. (g–i) TCGA-AML cohort showed that ICAM2 could not distinguish disease-free survival (DFS) in the intermediate-risk group, but the improved ELN-2017 stratification had a good predictive effect on DFS.
Table 1.
Univariate and multivariate Cox regression for intermediate-risk stratification with AML.
| Variable | Univariate analysis | Multivariate analysis | ||||
|---|---|---|---|---|---|---|
| HR | 95% CI | p-value | HR | 95% CI | p-value | |
| Gender (male versus female) | 1.0143 | 0.6630–1.5518 | 0.9478 | |||
| Age (⩾60 versus <60 years) | 2.2094 | 1.4315–3.4100 | 0.0003 | 1.8418 | 1.1486–2.9532 | 0.0112 |
| WBC (⩾50 × 109 versus <Negative) | 1.4126 | 0.7638–2.6123 | 0.2708 | |||
| FLT3-ITD (Positive versus Negative) | 1.7145 | 1.0647–2.7611 | 0.0266 | 1.5551 | 0.5542–4.3642 | 0.4016 |
| NPM1 (Positive versus Negative) | 1.5553 | 0.9352–2.5866 | 0.0888 | 1.1198 | 0.3703–3.3864 | 0.8412 |
| Transplant (yes versus no) | 0.3044 | 0.1788–0.5180 | <0.0001 | 0.3674 | 0.2112–0.6390 | 0.0004 |
| ICAM2_status (high versus low) | 2.0038 | 1.2426–3.2314 | 0.0044 | 1.97 | 1.2130–3.1997 | 0.0061 |
CI, confidence interval; HR, hazard ratio; WBC, white blood cell.
Variables with p < 0.1 in the univariate analysis were included in the multivariate analysis. The p-value in bold type denotes a significant difference (p < 0.05).
Effect of bone marrow transplantation and ICAM2 status with intermediate-risk AML
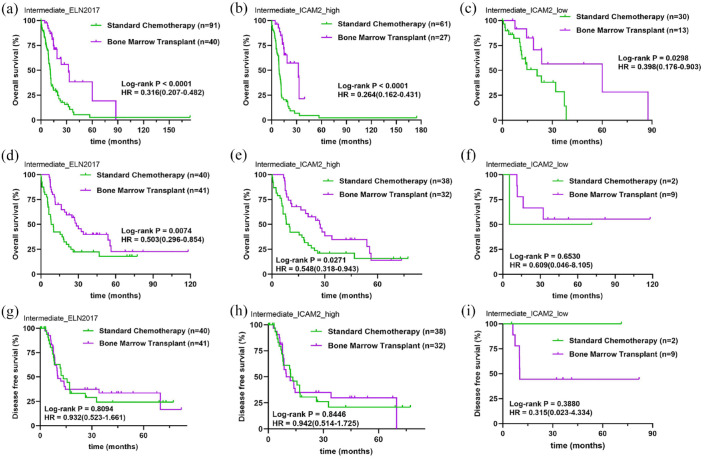
Currently, chemotherapy and hematopoietic stem cell transplantation are the main treatments for AML.20 To verify the effect of ICAM2 between treatment groups in intermediate-risk AML, we compared the survival curves of patients who received and did not receive bone marrow transplantation. Compared with the standard chemotherapy group, the OS of intermediate-risk AML patients receiving bone marrow transplantation was significantly prolonged (HR = 0.316, 95% CI = 0.207–0.482, p < 0.0001) [Figure 5(a)]. We examined which treatments were more beneficial to patients based on ICAM2 expression levels, and found that bone marrow transplantation remained an effective treatment in both high ICAM2 (HR = 0.264, 95% CI = 0.162–0.431, p < 0.0001) and low ICAM2 (HR = 0.398, 95% CI = 0.276–0.903, p = 0.0298) expression groups [Figure 5(b)-(c)]. Of note, for bone marrow transplant recipients, median survival was 32.2 months in the high ICAM2 expression group, but 60 months in the low ICAM2 expression group. Therefore, we believe that ICAM2 still plays a role in AML patients undergoing transplantation. Similarly, we performed the same analysis on the TCGA-AML cohort, and the data was validated [Figure 5(d)–(f)]. In addition, we analyzed DFS in the intermediate-risk group of AML patients who received bone marrow transplantation. However, survival distribution curves with patients who underwent bone marrow transplantation demonstrated no improvement in DFS time compared with the standard chemotherapy [Figure 5(g)]. We also did not observe significant differences in DFS among patients with standard chemotherapy or transplantation based on ICAM2 expression [Figure 5(h) and (i)]. One of the reasons we considered was related to the sample size of ICAM2 low expression in the TCGA-AML cohort. More importantly, DFS is affected by complications following bone marrow transplantation, such as graft-versus-host disease, early mortality, drug response rate, and so on.
Figure 5.
Effect of bone marrow transplantation and ICAM2 status with intermediate-risk AML. (a) Bone marrow transplantation is an effective treatment for intermediate-risk AML. (b) Overall survival of AML patients receiving bone marrow transplantation in the high ICAM2 expression group. (c) Overall survival of AML patients receiving bone marrow transplantation in the low ICAM2 expression group. (d) The TCGA cohort verifies the efficacy of bone marrow transplantation with intermediate-risk AML. (e and f) Overall survival of AML patients receiving bone marrow transplantation in low and high ICAM2 expression groups from the TCGA cohort. (g) Effect of bone marrow transplantation on disease-free survival of intermediate-risk patients with AML. (h and i) Disease-free survival of AML patients receiving bone marrow transplantation in low and high ICAM2 expression groups from the TCGA cohort.
Clinical features of new risk stratification based on ICAM2 status
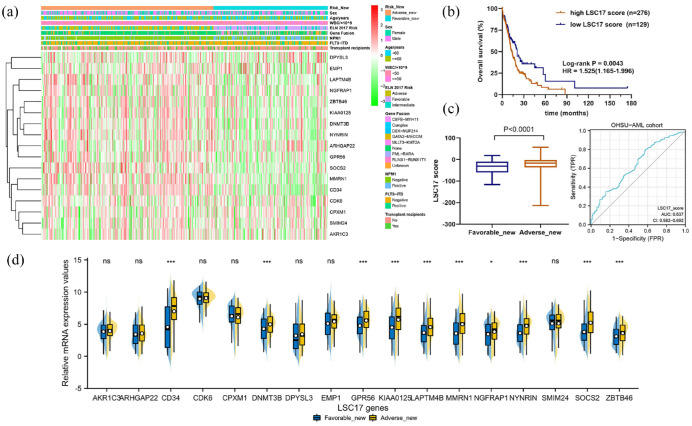
To distinguish the differences in the risk_new stratification, we compared clinical characteristics (sex, age, white blood cell count, ELN-2017 risk, gene fusion, NPM1, FLT3-ITD, and transplant) between favorable_new and adverse_new [Figure 6(a)]. To explore the association between risk_new stratification and leukemia stem cells (LSCs), the landscape of LSC17 signatures for each AML case was plotted. The progression and recurrence of AML are attributed to the persistence of leukemia stem cells (LSC), which possess many stem cell properties, including a quiescent state associated with therapeutic resistance. The 17-gene LSC score (LSC17) developed by Ng and colleagues has been confirmed by numerous studies, and patients with higher LSC17 scores have a relatively poor prognosis.21 By calculating the LSC17 score of each patient according to the reported algorithm, we found that LSC17 scores were higher in the adverse_new group than in the favorable_new group [Figure 6(b) and (c)]. Due to the high heterogeneity of AML patients, the LSC17 score results overlap between the two groups. ROC analysis found that the variable LSC17_score actually had a low predictive ability (AUC = 0.637, 95% CI = 0.582–0.692). Interestingly, analysis of LSC17 signatures expression showed that several LSC-related genes were up-regulated in the adverse_new group, including CD34, DNMT3B, GPR56, KIAA0125, LAPTM4B, MMRN1, NGFRAP1, NYNRIN, SOCS2, and ZBTB46 [Figure 6(d)]. These results were largely confirmed in the cohort of TCGA-AML (Supplemental Figure S5).
Figure 6.
Clinical features of new risk stratification based on ICAM2 status. (a) Heatmap of clinical characteristics (sex, age, white blood cell count, ELN-2017 risk, gene fusion, NPM1, FLT3-ITD, and transplant) between favorable_new and adverse_new. (b) LSC17 score predicted the overall survival rate of AML. (c) The adverse_new group had a higher LSC17 score, but only a lower accuracy in predicting the outcome (AUC = 0.637). (d) In the adverse_new group, several LSC-related genes were up-regulated.
Proposed risk stratification algorithm based on ELN-2017 risk classification refined by ICAM2 status
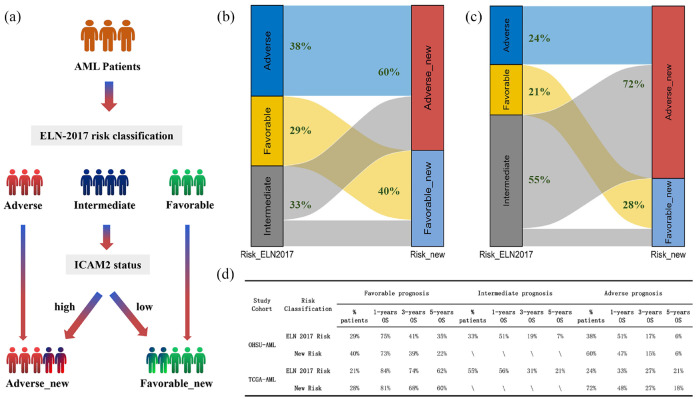
When incorporating ICAM2 expression in the integrated risk classification of AML based on ELN-2017 risk classification, patients were well moved from three to two groups [Figure 7(a)]. In the OHSU-AML cohort, 60% (22% of intermediate-risk ELN-2017 patients) were reclassified in the adverse-new risk group, and 40% (11% of intermediate-risk ELN-2017 patients) were re-classified in the favorable-new risk group [Figure 7(b)]. In another cohort of TCGA-AML, 72% (47% of intermediate-risk ELN-2017 patients) were reclassified in the adverse-new risk group, and 28% (8% of intermediate-risk ELN-2017 patients) were re-classified in the favorable-new risk group [Figure 7(c)]. We evaluated the prognostic value of ICAM2 in patients with intermediate-risk AML based on ELN-2017. In the OHSU-AML cohort, the 1-, 3-, and 5-year survival rates in the adverse_new stratification were 47%, 15%, and 6%, respectively, compared with 51%, 17%, and 6% for ELN-2017 risk stratification. Similarly, 1-, 3-, and 5-year survival rates were 73%, 39%, and 22%, respectively, for patients with favorable_new stratification, compared with 75%, 41%, and 35%, respectively, for patients with ELN-2017 risk stratification. The TCGA-AML cohort results were also consistent. Thus, ICAM2 well distinguishes the intermediate group of patients, whose probability of survival is comparable to that of patients with poor prognosis according to the reference classification [Figure 7(d)].
Figure 7.
Proposed risk stratification algorithm based on ELN-2017 risk classification refined by ICAM2 status. (a) ICAM2 expression was included in the comprehensive risk classification of AML according to the ELN-2017 risk classification. (b and c) AML patients in TCGA and OHSU cohorts were divided into two groups according to the new stratified protocol. (d) ICAM2 well differentiated the intermediate group of patients, and the probability of survival was comparable to the ELN-2017 risk classification.
Discussion
Currently, AML patients can be divided into three groups based on genetic and molecular abnormalities, including favorable, intermediate, and adverse prognoses. The proportion of patients with an intermediate prognosis is the highest and the clinical treatment decision is difficult.22 Therefore, a detailed classification of this subgroup of patients is required. In general, the intensity and type of treatment for AML patients are adjusted according to the risk status, and standard chemotherapy is considered reasonable for favorable-risk AML, whereas allogeneic hematopoietic stem cell transplantation is used for adverse-risk AML.23 For intermediate-risk AML, bone marrow transplantation and chemotherapy are commonly used after the first complete remission, but it is still controversial which method can improve the prognosis of patients.24 New molecular markers have been shown to affect prognosis and have been included in the revision of the ELN classification.25–27 Our study attempted to identify novel markers to refine risk stratification in intermediate-risk AML patients.
Proteomic-based approaches are increasingly being used in the discovery of leukemia biomarkers.28 In this study, label-free proteomics was used for proteomic analysis of the bone marrow serum of AML patients. By analyzing differences in protein abundance in different databases, functional and pathway differences between AML patients and healthy volunteers were revealed. We pursued ICAM2 as our lead candidate for its consistent abnormal expression in both proteome and transcriptome. There are four main families of cell adhesion molecules, including integrin, cadherin, selectin, and immunoglobulin superfamily.29 ICAM2 (also known as CD102), a member of the immunoglobulin superfamily, binds to the leukocyte adhesion LFA-1(CD11a/CD18) protein.30 The interaction between LFA-1 and ICAM-2 mediates leukocyte function and promotes immunoglobulin production and T/NK cytotoxicity.31 Peptides in the ICAM-2 domain were found to be more effective leukocyte adhesion activators than ICAM-1 and ICAM-3.32 Earlier studies showed that retinoic acid-induced leukemic cell aggregation through LFA-1 and ICAM2.33 Soluble ICAM2 is elevated in the plasma of leukemia patients, but decreases rapidly during treatment and chemotherapy.34 Several studies have reported that ICAM2 plays an important role in the occurrence and development of malignant tumors.35,36 Human proteins circulate in the serum due to secretion and leakage from various tissues, which makes serum proteomics more valuable in the study of hematologic diseases.
Although the molecular mechanism and regulatory network of ICAM2 have been studied extensively in previous studies, its key clinical application relevance value remains unclear. We first found that ICAM2 has a high predictive value for survival in the moderate-risk group of AML and that high expression is associated with poor prognosis. Hitherto, most studies on AML stratification have focused on molecular genetic changes that significantly improve AML patient stratification.37 With the development of next-generation sequencing, several AML scores have been established to predict survival based on gene expressions, such as metabolism-related genes, immune-related genes, and stem-cell-related genes.38–40 In a systematic analysis of cellular adhesion molecule expression signatures, additional data showed that ICAM2 was inversely associated with overall survival in AML patients, which further supported our results.41 We demonstrated that patients with intermediate ELN-2017 risk were still significantly stratified by ICAM2 expression, which was an independent predictor of clinical outcome in multivariate regression analysis. There was a strong association between ICAM2 status and OS, even after accounting for age and the potential effects of bone marrow transplantation. However, for patients in the low-expression group, a smaller proportion of transplant participants did not have a statistically significant relationship with treatment modality.
To ensure reliable results, our conclusions hold in both independent data sets. The TCGA cohort showed consistent results when comparing ELN-2017 with our new_risk stratification [Figure 7(d)]. In the TCGA-AML cohort, 1-, 3-, and 5-year survival rates for the ELN-2017 adverse-risk group were 33%, 27%, and 21%, respectively, and for the adverse_new group were 48%, 27%, and 18%. And again, 1-, 3-, and 5-year survival rates for the ELN-2017 favorable-risk group were 84%, 74%, and 62%, respectively, and for the favorable_new group were 81%, 68%, and 60%. These conclusions apply to the simulation conditions of our training set. Therefore, we optimized the ELN-2017 risk stratification from three groups to two without affecting the survival probability of the original adverse-risk group and the favorable-risk group. Of note, 5-year survival was significantly longer in the TCGA cohort, which we speculate was related to the median age or race of the cohort. The median age in the OHSU cohort was 61, and the 25th and 75th percentile sites were 46 and 71, respectively. The median age in the TCGA cohort was 56, and the 25th and 75th percentiles were 42 and 66.5, respectively. The Mann–Whitney U test statistical value was p = 0.036. The effect of age, race, and ethnicity on overall survival in AML patients is interesting.42–44 In addition, we also assessed the LSC17 score in this study and found that most LSC-related gene expressions were upregulated in the adverse-new risk group. ROC analysis found that the predictive specificity of LSC17_score was not very high, perhaps because of the heterogeneous effect of AML patients. To explore the biological pathways involved in ICAM2, we performed GSEA between high and low ICAM2 levels data sets. As shown in Supplemental Figure S5. The enrichment results showed that there was a significant correlation between high- and low-ICAM2 expression groups: ‘peroxisome’, ‘alanine aspartate and glutamate metabolism’, ‘selenoamino acid metabolism’, ‘fatty acid metabolism’, and ‘retinol metabolism’ were also metabolism-related pathways. The pathway details of the gene sets are arranged in order of importance in Supplemental Table S8. These results may provide a mechanistic explanation for the scientific value and clinical significance of ICAM2.
Although we further reveal the clinical value of ICAM2 in AML, there are still some limitations to our study. In a comprehensive analysis of the promotion of ICAM2 in clinical practice, other clinical factors, such as the uniformity of treatment regimens, need to be considered. Second, although multicenter cohort studies with public databases are intended to compensate for the shortcomings of single-center cohort studies, inconsistent interventions and lack of information are the limitations of retrospective studies. Therefore, prospective studies should be conducted in the future to balance the bias caused by retrospective studies.
Conclusion
Our study demonstrated that the up-regulation of ICAM2 is closely related to the poor prognosis of AML in intermediate-risk groups through serum proteomics analysis, and adding the expression level of ICAM2 examination can optimize ELN-2017 risk stratification. Improving the sensitivity and specificity of patient classification can provide a reliable basis for clinical decision-making.
Supplemental Material
Supplemental material, sj-docx-2-tah-10.1177_20406207221132346 for Serum proteomics screening intercellular adhesion molecule-2 improves intermediate-risk stratification in acute myeloid leukemia by Nan Zhang, Xiaoyan Liu, Jinxian Wu, Xinqi Li, Qian Wang, Guopeng Chen, Linlu Ma, Sanyun Wu and Fuling Zhou in Therapeutic Advances in Hematology
Supplemental material, sj-pdf-1-tah-10.1177_20406207221132346 for Serum proteomics screening intercellular adhesion molecule-2 improves intermediate-risk stratification in acute myeloid leukemia by Nan Zhang, Xiaoyan Liu, Jinxian Wu, Xinqi Li, Qian Wang, Guopeng Chen, Linlu Ma, Sanyun Wu and Fuling Zhou in Therapeutic Advances in Hematology
Acknowledgments
Not applicable.
Footnotes
ORCID iD: Fuling Zhou  https://orcid.org/0000-0003-0982-0382
Supplemental material: Supplemental material for this article is available online.
Contributor Information
Nan Zhang, Department of Hematology, Zhongnan Hospital of Wuhan University, Wuhan, China.
Xiaoyan Liu, Department of Hematology, Zhongnan Hospital of Wuhan University, Wuhan, China.
Jinxian Wu, Department of Hematology, Zhongnan Hospital of Wuhan University, Wuhan, China.
Xinqi Li, Department of Hematology, Zhongnan Hospital of Wuhan University, Wuhan, China.
Qian Wang, Department of Hematology, Zhongnan Hospital of Wuhan University, Wuhan, China.
Guopeng Chen, Department of Hematology, Zhongnan Hospital of Wuhan University, Wuhan, China.
Linlu Ma, Department of Hematology, Zhongnan Hospital of Wuhan University, Wuhan, China.
Sanyun Wu, Department of Hematology, Zhongnan Hospital of Wuhan University, Wuhan, China.
Fuling Zhou, Department of Hematology, Zhongnan Hospital of Wuhan University, No.169 Donghu Road, Wuhan 430072, China.
Declarations
Ethics approval and consent to participate: The patients were informed of sample collection and usage. The samples were collected and used following approval by the Institutional Ethical Committee Board of the Zhongnan Hospital of Wuhan University in Wuhan, China.
Consent for publication: Written informed consent for publication was obtained from all participants.
Author contributions: Nan Zhang: Conceptualization; Data curation; Formal analysis; Software; Writing – original draft.
Xiaoyan Liu: Funding acquisition; Methodology; Writing – review & editing.
Jinxian Wu: Methodology; Visualization.
Xinqi Li: Validation.
Qian Wang: Data curation; Writing – original draft.
Guopeng Chen: Resources.
Linlu Ma: Investigation.
Sanyun Wu: Data curation.
Fuling Zhou: Funding acquisition; Project administration; Supervision; Writing – review & editing.
Funding: The authors disclosed receipt of the following financial support for the research, authorship, and/or publication of this article: This work was supported by the Zhongnan Hospital of Wuhan University Science, Technology and Innovation Cultivation Fund [grant number ZNLH201902], and the Natural Science Foundation of China (NSFC) program [grant number 81900116].
The authors declared no potential conflicts of interest with respect to the research, authorship, and/or publication of this article.
Availability of data and materials: The datasets produced in this study are available in the Supplementary files. In addition, several user-friendly AML databases or tools were used to download, analyze, or reference data. TCGA (The Cancer Genome Atlas, https://portal.gdc.cancer.gov/), OHSU (Oregon Health and Science University, accessed through https://www.cbioportal.org/) were used, and GEO (Gene Expression Omnibus, https://www.ncbi.nlm.nih.gov/geo/) data are accessible under accession numbers GSE12662 and GSE13159.
References
- 1. Bullinger L, Döhner K, Döhner H. Genomics of acute myeloid leukemia diagnosis and pathways. J Clin Oncol 2017; 35: 934–946. [DOI] [PubMed] [Google Scholar]
- 2. Versluis J, In ‘t, Hout FE, Devillier R, et al. Comparative value of post-remission treatment in cytogenetically normal AML subclassified by NPM1 and FLT3-ITD allelic ratio. Leukemia 2017; 31: 26–33. [DOI] [PubMed] [Google Scholar]
- 3. Pastore F, Dufour A, Benthaus T, et al. Combined molecular and clinical prognostic index for relapse and survival in cytogenetically normal acute myeloid leukemia. J Clin Oncol 2014; 32: 1586–1594. [DOI] [PMC free article] [PubMed] [Google Scholar]
- 4. Hou H-A, Tien H-F. Genomic landscape in acute myeloid leukemia and its implications in risk classification and targeted therapies. J Biomed Sci 2020; 27: 81. [DOI] [PMC free article] [PubMed] [Google Scholar]
- 5. Jayavelu AK, Wolf S, Buettner F, et al. The proteogenomic subtypes of acute myeloid leukemia. Cancer Cell 2022; 40: 301.e12–317.e12. [DOI] [PubMed] [Google Scholar]
- 6. Zhang N, Shen Y, Li H, et al. The m6A reader IGF2BP3 promotes acute myeloid leukemia progression by enhancing RCC2 stability. Exp Mol Med 2022; 54: 194–205. [DOI] [PMC free article] [PubMed] [Google Scholar]
- 7. Zhang N, Zhang P, Chen Y, et al. Clusterization in acute myeloid leukemia based on prognostic alternative splicing signature to reveal the clinical characteristics in the bone marrow microenvironment. Cell Biosci 2020; 10: 118. [DOI] [PMC free article] [PubMed] [Google Scholar]
- 8. van Dijk AD, de Bont ESJM, Kornblau SM. Targeted therapy in acute myeloid leukemia: current status and new insights from a proteomic perspective. Expert Rev Proteomics 2020; 17: 1–10. [DOI] [PubMed] [Google Scholar]
- 9. Hoff FW, Hu CW, Qutub AA, et al. Shining a light on cell signaling in leukemia through proteomics: relevance for the clinic. Expert Rev Proteomics 2018; 15: 613–622. [DOI] [PMC free article] [PubMed] [Google Scholar]
- 10. Wang Y, Zhang L, Chen W-L, et al. Rapid diagnosis and prognosis of de novo acute myeloid leukemia by serum metabonomic analysis. J Proteome Res 2013; 12: 4393–4401. [DOI] [PubMed] [Google Scholar]
- 11. Bai J, He A, Huang C, et al. Serum peptidome based biomarkers searching for monitoring minimal residual disease in adult acute lymphocytic leukemia. Proteome Sci 2014; 12: 49. [DOI] [PMC free article] [PubMed] [Google Scholar]
- 12. Ding Z, Wang N, Ji N, et al. Proteomics technologies for cancer liquid biopsies. Mol Cancer 2022; 21: 53. [DOI] [PMC free article] [PubMed] [Google Scholar]
- 13. Li MY, Zhao C, Chen L, et al. Quantitative proteomic analysis of plasma exosomes to identify the candidate biomarker of imatinib resistance in chronic myeloid leukemia patients. Front Oncol 2021; 11: 779567. [DOI] [PMC free article] [PubMed] [Google Scholar]
- 14. Xu G, Li Z, Wang L, et al. Label-free quantitative proteomics reveals differentially expressed proteins in high risk childhood acute lymphoblastic leukemia. J Proteomics 2017; 150: 1–8. [DOI] [PubMed] [Google Scholar]
- 15. Arber DA, Orazi A, Hasserjian R, et al. The 2016 revision to the World Health Organization classification of myeloid neoplasms and acute leukemia. Blood 2016; 127: 2391–2405. [DOI] [PubMed] [Google Scholar]
- 16. von Elm E, Altman DG, Egger M, et al. The Strengthening the Reporting of Observational Studies in Epidemiology (STROBE) statement: guidelines for reporting observational studies. Lancet 2007; 370: 1453–1457. [DOI] [PubMed] [Google Scholar]
- 17. Döhner H, Estey EH, Amadori S, et al. Diagnosis and management of acute myeloid leukemia in adults: recommendations from an international expert panel, on behalf of the European LeukemiaNet. Blood 2010; 115: 453–474. [DOI] [PubMed] [Google Scholar]
- 18. Haferlach T, Kohlmann A, Wieczorek L, et al. Clinical utility of microarray-based gene expression profiling in the diagnosis and subclassification of leukemia: report from the International Microarray Innovations in Leukemia Study Group. J Clin Oncol 2010; 28: 2529–2537. [DOI] [PMC free article] [PubMed] [Google Scholar]
- 19. Payton JE, Grieselhuber NR, Chang LW, et al. High throughput digital quantification of mRNA abundance in primary human acute myeloid leukemia samples. J Clin Invest 2009; 119: 1714–1726. [DOI] [PMC free article] [PubMed] [Google Scholar]
- 20. Leotta S, Condorelli A, Sciortino R, et al. Prevention and treatment of acute myeloid leukemia relapse after hematopoietic stem cell transplantation: the state of the art and future perspectives. J Clin Med 2022; 11: 253. [DOI] [PMC free article] [PubMed] [Google Scholar]
- 21. Ng SWK, Mitchell A, Kennedy JA, et al. A 17-gene stemness score for rapid determination of risk in acute leukaemia. Nature 2016; 540: 433–437. [DOI] [PubMed] [Google Scholar]
- 22. Xuan L, Liu Q. Maintenance therapy in acute myeloid leukemia after allogeneic hematopoietic stem cell transplantation. J Hematol Oncol 2021; 14: 4. [DOI] [PMC free article] [PubMed] [Google Scholar]
- 23. Begna KH, Kittur J, Gangat N, et al. European LeukemiaNet-defined primary refractory acute myeloid leukemia: the value of allogeneic hematopoietic stem cell transplant and overall response. Blood Cancer J 2022; 12: 7. [DOI] [PMC free article] [PubMed] [Google Scholar]
- 24. Ihlow J, Gross S, Busack L, et al. Acute myeloid leukemia: negative prognostic impact of early blast persistence can be in part overcome by a later remission prior to post-induction therapy. Haematologica. Epub ahead of print 11 November 2021. DOI: 10.3324/haematol.2021.279134. [DOI] [PMC free article] [PubMed] [Google Scholar]
- 25. Herold T, Rothenberg-Thurley M, Grunwald VV, et al. Validation and refinement of the revised 2017 European LeukemiaNet genetic risk stratification of acute myeloid leukemia. Leukemia 2020; 34: 3161–3172. [DOI] [PMC free article] [PubMed] [Google Scholar]
- 26. Eisfeld A-K, Kohlschmidt J, Mims A, et al. Additional gene mutations may refine the 2017 European LeukemiaNet classification in adult patients with de novo acute myeloid leukemia aged <60 years. Leukemia 2020; 34: 3215–3227. [DOI] [PMC free article] [PubMed] [Google Scholar]
- 27. Bill M, Mrózek K, Giacopelli B, et al. Precision oncology in AML: validation of the prognostic value of the knowledge bank approach and suggestions for improvement. J Hematol Oncol 2021; 14: 107. [DOI] [PMC free article] [PubMed] [Google Scholar]
- 28. Hernandez-Valladares M, Bruserud Selheim ØF. The implementation of mass spectrometry-based proteomics workflows in clinical routines of acute myeloid leukemia: applicability and perspectives. Int J Mol Sci 2020; 21: E6830. [DOI] [PMC free article] [PubMed] [Google Scholar]
- 29. Juliano RL. Signal transduction by cell adhesion receptors and the cytoskeleton: functions of integrins, cadherins, selectins, and immunoglobulin-superfamily members. Annu Rev Pharmacol Toxicol 2002; 42: 283–323. [DOI] [PubMed] [Google Scholar]
- 30. Huang M-T, Mason JC, Birdsey GM, et al. Endothelial intercellular adhesion molecule (ICAM)-2 regulates angiogenesis. Blood 2005; 106: 1636–1643. [DOI] [PubMed] [Google Scholar]
- 31. Tanaka H, Yashiro M, Sunami T, et al. ICAM-2 gene therapy for peritoneal dissemination of scirrhous gastric carcinoma. Clin Cancer Res 2004; 10: 4885–4892. [DOI] [PubMed] [Google Scholar]
- 32. Kotovuori A, Pessa-Morikawa T, Kotovuori P, et al. ICAM-2 and a peptide from its binding domain are efficient activators of leukocyte adhesion and integrin affinity. J Immunol 1999; 162: 6613–6620. [PubMed] [Google Scholar]
- 33. Larson RS, Brown DC, Sklar LA. Retinoic acid induces aggregation of the acute promyelocytic leukemia cell line NB-4 by utilization of LFA-1 and ICAM-2. Blood 1997; 90: 2747–2756. [PubMed] [Google Scholar]
- 34. Mustjoki S, Alitalo R, Elonen E, et al. Intercellular adhesion molecule-1 in extravasation of normal mononuclear and leukaemia cells. Br J Haematol 2001; 113: 989–1000. [DOI] [PubMed] [Google Scholar]
- 35. Hiraoka N, Yamazaki-Itoh R, Ino Y, et al. CXCL17 and ICAM2 are associated with a potential anti-tumor immune response in early intraepithelial stages of human pancreatic carcinogenesis. Gastroenterology 2011; 140: 310–321. [DOI] [PubMed] [Google Scholar]
- 36. Feduska JM, Aller SG, Garcia PL, et al. ICAM-2 confers a non-metastatic phenotype in neuroblastoma cells by interaction with α-actinin. Oncogene 2015; 34: 1553–1562. [DOI] [PMC free article] [PubMed] [Google Scholar]
- 37. Padmakumar D, Chandraprabha VR, Gopinath P, et al. A concise review on the molecular genetics of acute myeloid leukemia. Leuk Res 2021; 111: 106727. [DOI] [PubMed] [Google Scholar]
- 38. Zhang N, Chen Y, Lou S, et al. A six-gene-based prognostic model predicts complete remission and overall survival in childhood acute myeloid leukemia. Onco Targets Ther 2019; 12: 6591–6604. [DOI] [PMC free article] [PubMed] [Google Scholar]
- 39. Stiehl T, Wang W, Lutz C, et al. Mathematical modeling provides evidence for niche competition in human AML and serves as a tool to improve risk stratification. Cancer Res 2020; 80: 3983–3992. [DOI] [PubMed] [Google Scholar]
- 40. Ijurko C, González-García N, Galindo-Villardón P, et al. A 29-gene signature associated with NOX2 discriminates acute myeloid leukemia prognosis and survival. Am J Hematol 2022; 97: 448–457. [DOI] [PMC free article] [PubMed] [Google Scholar]
- 41. Cheng J, Han J, Lin C. A comprehensive assessment of the prognostic role of cell adhesion molecules in acute myeloid leukemia. Transl Cancer Res 2020; 9: 7605–7618. [DOI] [PMC free article] [PubMed] [Google Scholar]
- 42. Abraham IE, Patel AA, Wang H, et al. Impact of race on outcomes in intermediate-risk acute myeloid leukemia. Cancer Causes Control 2021; 32: 705–712. [DOI] [PubMed] [Google Scholar]
- 43. Abraham IE, Rauscher GH, Patel AA, et al. Structural racism is a mediator of disparities in acute myeloid leukemia outcomes. Blood 2022; 139: 2212–2226. [DOI] [PMC free article] [PubMed] [Google Scholar]
- 44. Larkin K, Nicolet D, Kelly BJ, et al. High early death rates, treatment resistance, and short survival of Black adolescents and young adults with AML. Blood Adv. Epub ahead of print 5 July 2022. DOI: 10.1182/bloodadvances.2022007544. [DOI] [PMC free article] [PubMed] [Google Scholar]
Associated Data
This section collects any data citations, data availability statements, or supplementary materials included in this article.
Supplementary Materials
Supplemental material, sj-docx-2-tah-10.1177_20406207221132346 for Serum proteomics screening intercellular adhesion molecule-2 improves intermediate-risk stratification in acute myeloid leukemia by Nan Zhang, Xiaoyan Liu, Jinxian Wu, Xinqi Li, Qian Wang, Guopeng Chen, Linlu Ma, Sanyun Wu and Fuling Zhou in Therapeutic Advances in Hematology
Supplemental material, sj-pdf-1-tah-10.1177_20406207221132346 for Serum proteomics screening intercellular adhesion molecule-2 improves intermediate-risk stratification in acute myeloid leukemia by Nan Zhang, Xiaoyan Liu, Jinxian Wu, Xinqi Li, Qian Wang, Guopeng Chen, Linlu Ma, Sanyun Wu and Fuling Zhou in Therapeutic Advances in Hematology
Data Availability Statement
To assess coverage and differential expression between proteomics and transcriptome approaches, we performed a joint analysis of publicly available transcriptome sequencing datasets, including two datasets from Gene Expression Omnibus (GEO) with accession numbers GSE12662 and GSE13159. Clinical information and ICAM2 expression data were analyzed from the Oregon Health and Science University (OHSU)-AML project (405 patients) and the Cancer Genome Atlas (TCGA)-AML (151 patients).


