Abstract
The 10 years between the last influenza pandemic and start of the severe acute respiratory syndrome coronavirus 2 pandemic have been marked by great advances in our ability to follow influenza occurrence and determine vaccine effectiveness (VE), largely based on widespread use of the polymerase chain reaction assay. We examine the results, focusing mainly on data from the United States and inactivated vaccines. Surveillance has expanded, resulting in increased ability to characterize circulating viruses and their impact. The surveillance has often confirmed previous observations on timing of outbreaks and age groups affected, which can now be examined in greater detail. Selection of strains for vaccines is now based on enhanced viral characterization using immunologic, virologic, and computational techniques not previously available. Vaccine coverage has been largely stable, but VE has remained modest and, in some years, very low. We discuss ways to improve VE based on existing technology while we work toward supraseasonal vaccines.
Keywords: influenza, influenza vaccines, public health surveillance, sentinel surveillance, vaccine effectiveness
Influenza surveillance in the United States has expanded, resulting in increased ability to characterize circulating viruses and their impact. Selection of strains for vaccines is now based on enhanced viral characterization using immunologic, virologic, and computational techniques not previously available.
During the 10 years between the end of the influenza A(H1N1) pandemic in 2010 and the break in transmission at the beginning of the severe acute respiratory syndrome coronavirus 2 pandemic, global influenza surveillance has expanded markedly, with improved antigenic and molecular characterization of circulating viruses [1]. As a result, the Global Influenza Surveillance and Response System (GISRS) can provide detailed data for the twice-yearly selection of strains to be contained in the Northern and Southern Hemisphere vaccines [2]. In addition, availability of reverse-transcription polymerase chain reaction (PCR) has contributed to annual vaccine effectiveness (VE) estimates from multiple regions [3, 4].
In the United States (US), the Centers for Disease Control and Prevention (CDC) has collected detailed data on influenza vaccination and characterized seasonal influenza epidemiology, a major task in a large and diverse country [5]. This has allowed identification of the extent of circulation of different influenza types and subtypes/lineages and associated morbidity and mortality. VE and burden estimates have been presented annually and, if possible, midseason [6, 7]. Antigenic relatedness of circulating and vaccine viruses has also been evaluated during the season and at the time of strain selection [2].
Thus, the last decade presents a distinct period during which there were major advances in antigenic characterization of circulating strains, their impact, and the extent of vaccine coverage. We examine trends in seasonality, epidemiology, and virology of inactivated influenza viruses in the US during this period using surveillance systems data available from the CDC (Supplementary Appendix) [8]. We also consider whether such improvements have led to concomitant changes in VE, the ultimate goal of these activities.
SEASONALITY AND PREDOMINANT VIRUSES
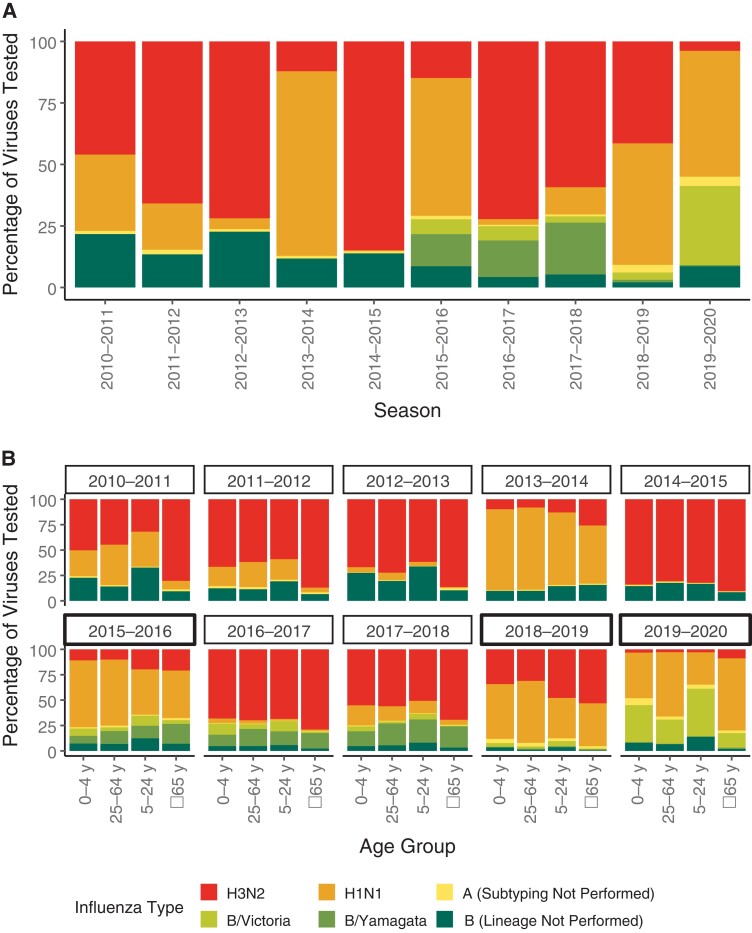
Seasonal influenza outbreaks are often described by the virus that predominates early in that season. Actually, individual US seasons often include a substantial proportion of multiple subtypes or lineages (Figure 1A). Over the 10 seasons, type A represented 78% of influenza viruses detected, with type B constituting the remaining 22%. Type B did not predominate in any year, and only approached 50% in 2019–2020, when almost all identified influenza B viruses were B/Victoria viruses. The lack of B/Yamagata may presage the disappearance of this virus, a developing issue in strain selection [9]. In contrast, influenza A(H3N2) predominated in 5 seasons and A(H1N1) in 2 seasons (2013–2014 and 2015–2016). The other 3 seasons (2010–2011, 2018–2019, and 2019–2020) were mixed, with A(H3N2) still common, except in 2019–2020, when A(H1N1) was also prominent. Influenza B lineage typing was not performed prior to the 2015–2016 season, preventing evaluation of the distribution of B lineages in half of the seasons.
Figure 1.
Strain predominance by influenza season for the overall population (A) and by age group (B).
In all seasons, including those during which it was a minority of viruses, the proportion of A(H3N2) was highest among those ≥65 years old (Figure 1B). There was no consistent pattern for other subtypes or lineages. Interestingly, during the 2009 pandemic, the proportion of A(H1N1) infections in older individuals was disproportionately small [10], a trend that gradually changed over time. Following further antigenic drift, A(H1N1) was even more prominent in 2019–2020 in older individuals compared to younger individuals.
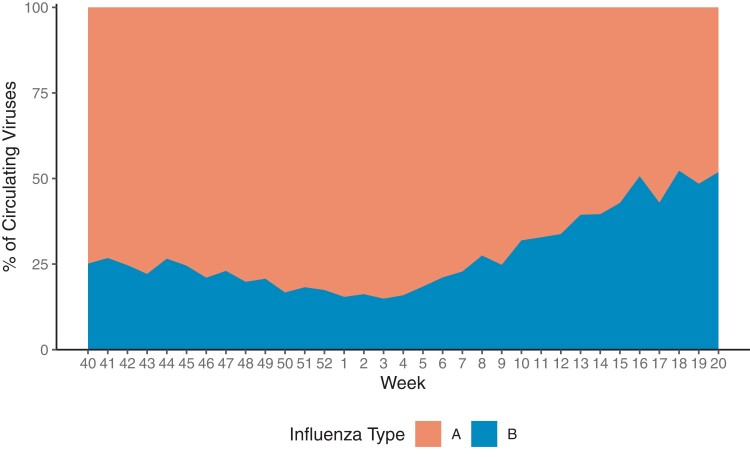
There is also a common perception that seasons are often closed out by an increase in the frequency of type B viruses. Although not true in all seasons, such a tendency is seen in the summarized data in Figure 2. That means that type B viruses are generally not absent at any time during the season, an observation which may affect some projected therapies specific to type A.
Figure 2.
Average percentage of influenza A vs B by week, 2010–2011 through 2019–2020.
TIMING AND DURATION OF OUTBREAKS
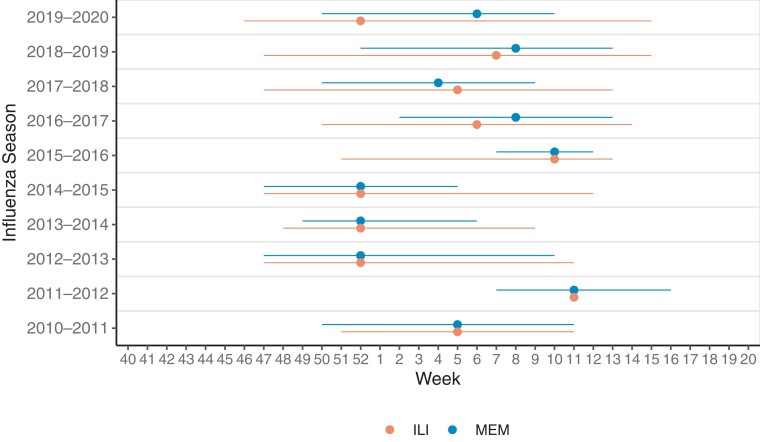
Seasonality of influenza-like-illness (ILI), a nonspecific outcome, was defined as the period during which ILI activity was above season-specific thresholds (Figure 3). As a virus-specific measure, we used the Moving Epidemic Method (MEM) algorithm to establish epidemic thresholds for the start and stop of the influenza circulation [11]. Epidemic thresholds were calculated using CDC clinical laboratory data on the percentage of outpatient influenza tests administered that were positive for influenza (ie, test positivity) from the 2003–2004 through 2015–2016 influenza seasons [8, 12].
Figure 3.
Timing and duration of influenza outbreaks. Timing of peak (point) and duration (line) of influenza outbreaks as assessed based on influenza-like illness (ILI) data and the Moving Epidemic Method (MEM). The 2014–2015 season had a 53rd week not pictured here, whereas the rest had 52 weeks.
The average length of an influenza season over the 10 seasons included was 12 weeks (range, 5–16 weeks) using the MEM and 16 weeks (range, 0–22 weeks) using ILI activity. ILI activity never got above the baseline threshold during the 2011–2012 season. The ILI season duration was generally longer and this method may be better suited for identifying an initial increase in influenza activity, whereas the MEM season may be better suited for identifying periods of high influenza activity, which could be used in control strategies.
The peak week for influenza test positivity (measure used for MEM) and ILI were the same or differed by only 1–2 weeks for all but the 2019–2020 season. Based on test positivity, influenza virus circulation peaked between late January and late February (epidemiologic weeks 4–8) in half of the seasons. During the 2012–2013, 2013–2014, and 2014–2015 seasons, the peak virus circulation occurred in late December (epidemiologic week 52), whereas in the 2015–2016 and 2011–2012 seasons the peak circulation was in mid-March (epidemiologic weeks 10–11). There was little evidence that the timing of a previous season had any effect on that of the subsequent season.
SEVERITY OF OUTBREAKS
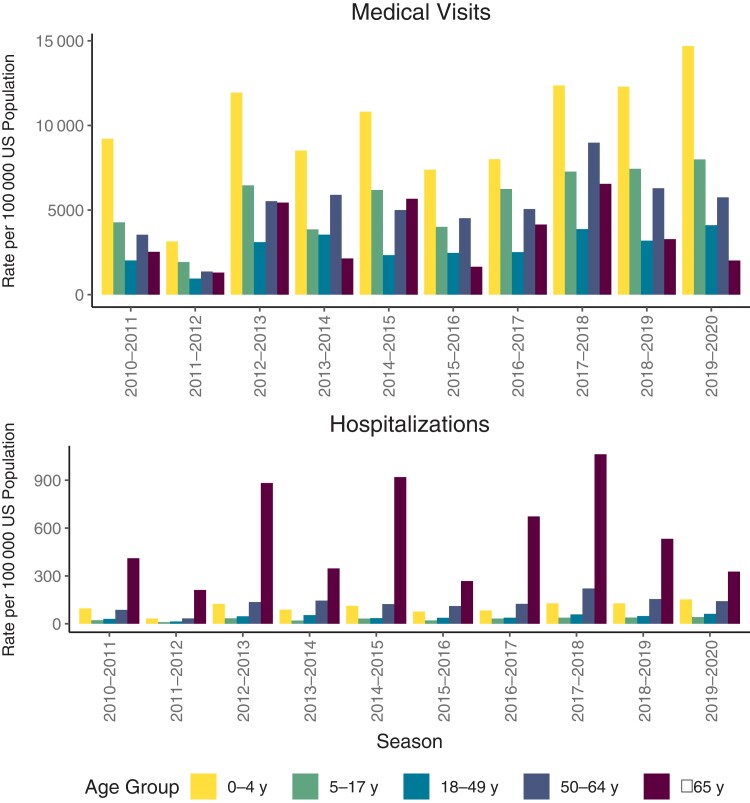
Here, we compare seasons in terms of their relative impact and use modeled CDC estimates for medical visits and hospitalizations as rough indicators [12, 13] (Figure 4). These estimates are useful in comparing the occurrence of subtypes and lineages by age and by time. The fact that there is annual variation in the burden is well known [14, 15]. The factors involved are complex, of which the predominant strains are only 1 variable. In all seasons, the incidence of influenza-related ambulatory visits was highest in young children, whereas hospitalizations were highest in those aged ≥65 years. The 3 seasons with the highest hospitalization rates (2012–2013, 2014–2015, and 2017–2018) were all A(H3N2)-predominant seasons. Some influenza A(H3N2)-predominant seasons, such as 2011–2012, however, had relatively low hospitalization rates. The other seasons with lower hospitalizations (2013–2014, 2015–2016, and 2019–2020) were all seasons in which mainly A(H1N1) and occasionally type B predominated. Medical visits did not always follow the same pattern, with the highest frequency in 2019–2020, the mixed A(H1N1)/B year.
Figure 4.
Rate of influenza medical visits and hospitalizations by age group. Abbreviation: US, United States.
INFLUENZA VACCINATION COVERAGE
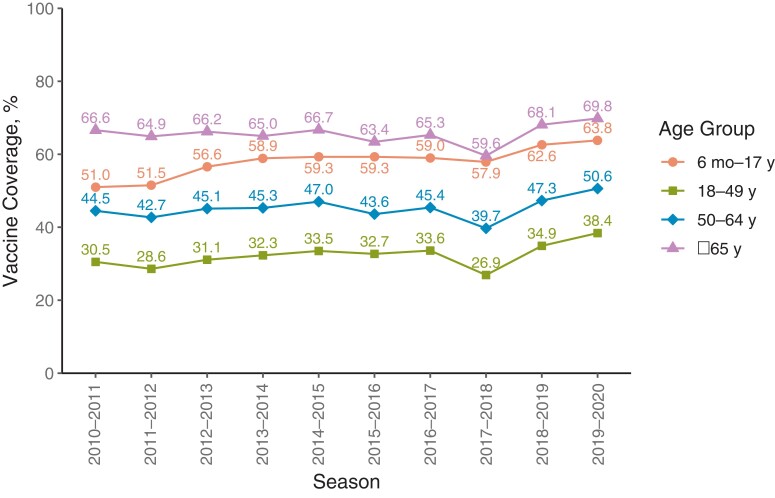
Figure 5 shows vaccination uptake over the 10 seasons based on national surveys and the Centers for Medicare and Medicaid Services Minimum Data Set [16–19]. Vaccination coverage remained moderately high throughout this period, rising slowly but steadily for most age groups since the nearly universal recommendation by the Advisory Committee on Immunization Practices in 2010. Children were second in vaccination frequency, exceeded only by the traditional influenza vaccination target group, older individuals. All age groups had lower coverage in 2017–2018 compared to 2016–2017. In 2017–2018 there was discussion of possible low VE in the strain selected for most of the vaccines, which took place during the vaccination season [20].
Figure 5.
Vaccination coverage by season and age group—United States.
STRAIN SELECTION: METHODS AND VIRUSES CHOSEN
The process of annual strain selection by the World Health Organization (WHO) has been in place for decades [21]. For many years, the selection was done once a year, typically in February, to leave sufficient time to produce vaccines that could be used starting in September. Because of the realization that a selection in February meant that the vaccine for use in the Southern Hemisphere could be more than a year out of date for the Southern Hemisphere winter, a second selection began to be made in September–October each year starting in 1998. That process has continued to the present.
Criteria used in strain selection have evolved over time with advances in laboratory science [22, 23]. For many years, it was based solely on data from hemagglutination inhibition tests involving naive ferrets infected with the viruses in question. Recently, human serology data have been added because human sera may distinguish important antigenic differences in circulating viruses that render a vaccine less protective. Other serologic tests to identify neutralizing antibodies have also been added plus an effort to consider the neuraminidase antigen [24]. Molecular techniques have also been used to help further characterize viruses into different genetic subgroups (clades), which may circulate simultaneously in different parts of the world. The overall intent for each of the 4 subtypes/lineages is to select a vaccine virus representing the clade that is likely to predominate in the future and that may also broadly cover other clades should it not. This is often difficult to do, especially when there is not a clearly predominant clade for that virus globally [25]. The selection of 1 component may be delayed for a month in hope that a predominant representative will emerge and be useful for vaccine production. The delay usually takes place with the A(H3N2) component, the subtype that has recently had the highest diversity of circulating variants.
Table 1 shows the Northern Hemisphere strain selection of the past 10 years. Southern Hemisphere selections have routinely preceded a change in the Northern Hemisphere strains when a change did occur, and that is shown in the last column [23]. In no case was a new virus picked for 1 hemisphere season and not repeated in the following season in the other hemisphere, except for the Southern Hemisphere 2019 for A(H3N2). The B lineage to be used in the trivalent vaccine is indicated; such a formulation is still used in a number of countries. Because there were questions concerning possible reduced VE if the circulating B lineage was different from that in the vaccine, in the US, all vaccines now contain both lineages.
Table 1.
Influenza Northern Hemisphere Vaccine Strains
| Season | A(H3N2) | A(H1N1) | B/Victoria | B/Yamagata | B Strain in TIV | Strain Changes for Following Southern Hemisphere Season |
|---|---|---|---|---|---|---|
| 2010–2011 | A/Perth/16/2009 | A/California/7/2009 | B/Brisbane/60/2008 | NA | B/Victoria | NA |
| 2011–2012 | A/Perth/16/2009 | A/California/7/2009 | B/Brisbane/60/2008 | NA | B/Victoria | NA |
| 2012–2013 | A/Victoria/361/2011 | A/California/7/2009 | B/Brisbane/60/2008 | B/Wisconsin/1/2010 | B/Yamagata | NA |
| 2013–2014 | A/Texas/50/2012 | A/California/7/2009 | B/Brisbane/60/2008 | B/Massachusetts/2/2012 | B/Yamagata | NA |
| 2014–2015 | A/Texas/50/2012 | A/California/7/2009 | B/Brisbane/60/2008 | B/Massachusetts/2/2012 | B/Yamagata | H3N2 (A/Switzerland/9715293/2013) B/Yamagata (B/Phuket/3073/2013) |
| 2015–2016 | A/Switzerland/9715293/2013 | A/California/7/2009 | B/Brisbane/60/2008 | B/Phuket/3073/2013 | B/Yamagata | H3N2 (A/Hong Kong/4801/2014) |
| 2016–2017 | A/Hong Kong/4801/2014 | A/California/7/2009 | B/Brisbane/60/2008 | B/Phuket/3073/2013 | B/Victoria | H1N1 (A/Michigan/45/2015) |
| 2017–2018 | A/Hong Kong/4801/2014 | A/Michigan/45/2015 | B/Brisbane/60/2008 | B/Phuket/3073/2013 | B/Victoria | H3N2 (A/Singapore/INFIMH-16–0019/2016) |
| 2018–2019 | A/Singapore/INFIMH-16-0019/2016 | A/Michigan/45/2015 | B/Colorado/06/2017 | B/Phuket/3073/2013 | B/Victoria | H3N2 (A/Switzerland/8060/2017) |
| 2019–2020 | A/Kansas/14/2017 | A/Brisbane/02/2018 | B/Colorado/06/2017 | B/Phuket/3073/2013 | B/Victoria | H3N2 (A/South Australia/34/2019) B/Victoria (B/Washington/02/2019) |
The table shows the World Health Organization–recommended vaccine virus egg-propagated reference viruses for Northern Hemisphere influenza vaccines. Not shown is the current practice of adding a selection for the cell culture or recombinant vaccines.
Abbreviations: NA, not applicable; TIV, trivalent influenza vaccine.
As can be seen in Table 1, the strain changes are most frequent for A(H3N2), again a reflection of the greater diversity of this subtype. Influenza A(H1N1) did not change for 8 years following its emergence, and the B/Victoria strain was not updated for 9 years, from 2009–2010 until 2018–2019. There was no official choice of another lineage for a quadrivalent vaccine until 2012–2013, when a B/Yamagata virus was recommended for the trivalent vaccine, and at the end of the 10-year period, B/Phuket stayed the choice in the quadrivalent vaccine for 5 years, continuing to the present. The Southern Hemisphere recommendation on 3 occasions changed the A(H3N2) vaccine virus before the same virus was then used in the Northern Hemisphere recommendations. In a fourth year, 2019–2020, the new Southern Hemisphere choice was further changed for the subsequent Northern Hemisphere season. One change each was made for the other subtypes/lineages, all continuing for at least the following Northern Hemisphere recommendation. This sequence followed the strain becoming prevalent in the previous Northern Hemisphere season, and in many cases dominating it. It demonstrates the logistic problem in choosing the strain in February, before the season has fully developed. Importantly, VE estimates for the current season are rarely available in time for the Southern Hemisphere strain selection in February, but can be informative when this has occurred [26].
VACCINE EFFECTIVENESS DURING THE 10 YEARS
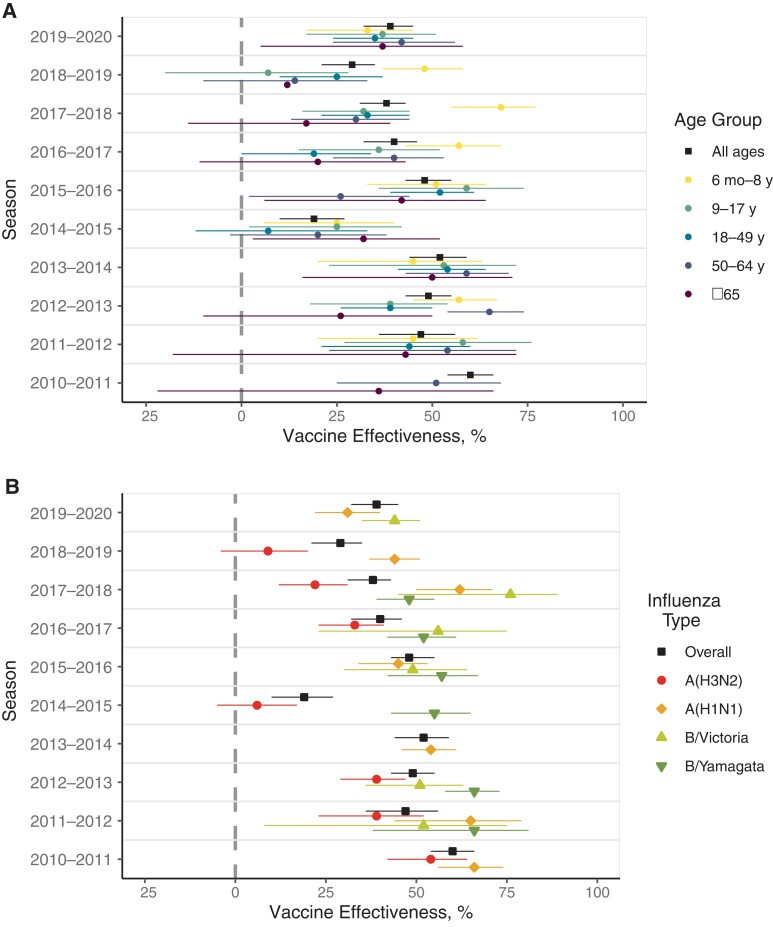
By the start of the 10-year period, the test-negative design had become an established method to estimate the effectiveness of influenza vaccines on an annual basis globally. This design is now standard for analysis of observational data [27, 28]. In the US, VE against medically attended infection is estimated in ambulatory settings across the lifespan, as is VE against hospitalization among adults. Over the 10-year period, ambulatory VE varied seasonally, with no consistent temporal trends observed by age group (Figure 6A) [6]. However, patients aged 6 months to 8 years most frequently had the highest VE whereas patients 65 or older most often had the lowest VE, with the other age groups generally in the middle.
Figure 6.
Vaccine effectiveness in preventing medically attended illnesses: overall by age (A) and for all ages by influenza type (B).
Vaccine effectiveness estimates over the last 10 years by influenza subtype/lineage are shown in Figure 6B (and stratified by age in Supplementary Figure 1) [6]. Overall, it can be seen that, at least in recent years, the point estimate of VE for A(H3N2) was lower than that of A(H1N1) and type B. In general, at least 3 phenomena have particularly affected the A(H3N2) viruses: (1) a greater genetic diversity of clades, making the selection of the optimal vaccine virus more difficult [29]; (2) specific immune response to egg adaptation [30, 31]; and (3) the deleterious relative effects of prior-year vaccination [32]. All of these phenomena can also affect the other viruses but are most prominent with A(H3N2). These issues are now affecting the A(H1N1) vaccine strain as evidenced by the 2019–2020 season, when the overall VE was unexpectedly low due to the increased prevalence of antigenically drifted A(H1N1) clades [33]. There have been other notable issues with the A(H1N1) viruses that have influenced the VE, but only in some birth cohorts [34]. These subtler differences were confirmed with human sera and not ferret sera and resulted in the eventual replacement of the original A/California virus in 2017–2018 (Table 1). Such an effect, based on imprinting from infections early in life, is thought to be present generally and is likely responsible for much of the age-specific differences in VE in general [35].
A recent surprise with type B/Victoria was in the 2019–2020 season, when 98% of circulating B/Victoria viruses belonged to a different clade than the vaccine virus [33]. There was an awareness that a triple deletion variant of B/Victoria virus was circulating in some parts of the world and concern that if it took over, the vaccine would be mismatched. In fact, that happened, but the VE against B/Victoria was still within the normally expected range.
Type A(H3N2), in contrast, has had low VE, with confidence intervals indicating no significant protection in 2 of the 7 seasons where A(H3N2) VE estimates were available. In other years, the point estimate for the VE was <50% for all but the 2010–2011 season. The match between the circulating and vaccine strains was reported to be relatively good in these years [36]. Interestingly, it was in the same years that the deleterious effects of prior-year vaccination were first reported [32, 36]. Clear mismatch in terms of a new variant appearing (ie, antigenic drift) after the strain for the vaccine is chosen is responsible for the low VE in a number of the seasons. As previously indicated, it is often marked by the new virus being recommended for the Southern Hemisphere formulation and then appearing in the subsequent season’s Northern Hemisphere vaccine.
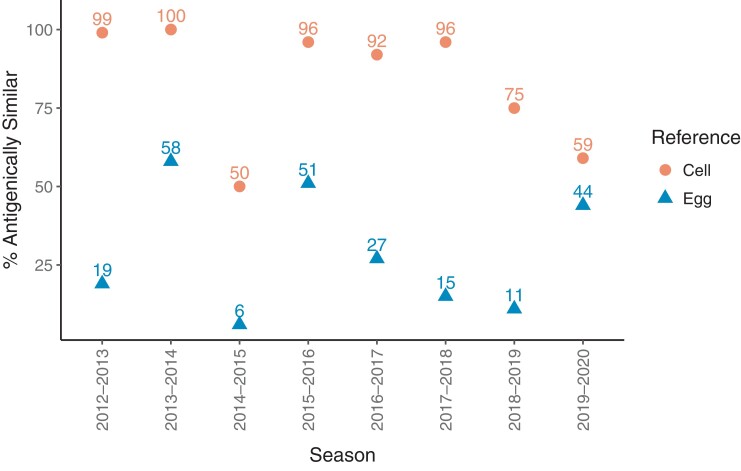
Another of the factors that has affected the A(H3N2) subtype more than others is the changes in the virus as it is adapted to growth in eggs for vaccine production. Figure 7 shows the percentage of A(H3N2) viruses tested by the CDC that were similar to the egg- or cell-cultured variants [37]. Egg adaptation was cited as a major reason for low VE in 2012–2013, but recent evidence suggests that the low VE may have instead been due to poor immunogenicity, due to vaccination boosting a cross-reactive immune response instead of a response to only the specific vaccine epitope [38]. Importantly, egg adaptation may or may not have occurred at antigenic sites in the virion that are involved in producing protective antibodies [38]. The most dramatic period in which egg adaption was associated with lower VE, and in which most evaluated A(H3N2) viruses were cell-like, was the 3-year period from 2016 to 2019 [39]. Egg adaption as an independent event can be mitigated by use of cell- or recombinant-produced vaccines, which are now available. At first, the limitation was that no non-egg passaged seed viruses were available, but they are now included in the WHO recommendations. However, the problems are often multifactorial, especially the need for the Northern Hemisphere, of choosing a virus in February, in the middle of the season.
Figure 7.
Proportion of circulating influenza A(H3N2) viruses tested that were antigenically similar to cell- and egg-propagated reference viruses.
IMPROVING VACCINE EFFECTIVENESS
The use of the PCR tests has allowed more detailed study of influenza viruses globally, especially in those areas where viral identification had been difficult. Paradoxically, it also allowed recognition that the efficacy of influenza vaccines had been overestimated at 70%–90% before the start of the decade—partially because these studies relied on serologic outcomes, not actual identification of the virus. The PCR technique combined with large, geographically representative test-negative design studies has allowed rapid assessment of VE even in the middle of an influenza season. Unfortunately, in the last decade VE has not increased but rather varies at a modest level determined by a number of interrelated factors. Low VE is particularly seen with the most common subtype, A(H3N2). This problem continues with the return of influenza transmission in the current season, 2021–2022, with an interim estimated VE of 16% (95% confidence interval: −16% to 39%) against A(H3N2) in the US [6]. Again, this subclade has now been chosen for the Southern Hemisphere vaccine. This suggests that modest VE will persist in spite of better surveillance globally and a great deal of immunologic, virologic, and computational work going into strain selection, as recently summarized [40]. The overall situation reinforces the need for a supraseasonal vaccine that has greater breadth and durability of protection [20]. However, development of supraseasonal influenza vaccines remains a complex challenge that will require new methods and immunological targets besides the constantly evolving hemagglutinin head that is the focus of current vaccines.
Until that is achieved, intermediate solutions may need to be implemented. Improvements to standard egg-based vaccines have included vaccines not produced in eggs (ie, cell-based and recombinant) as well as high-dose and adjuvanted vaccines for the elderly. Increased influenza vaccine uptake and use of improved vaccines offers an immediate option for reducing the burden of influenza, especially among risk groups. In addition to existing technologies, some additional approaches may be needed to improve VE, some of which may be easier to implement than others. For example, the potential extinction of the B/Yamagata lineage may provide an opportunity for a quadrivalent vaccine that instead contains 2 A(H3N2) viruses. Such a vaccine would take additional clinical research to meet regulatory standards but could quickly follow the path created for the approval of 2 influenza B viruses. It would give those involved in strain selection twice the chance of hitting the right subclade of H3N2 viruses, responsible for most influenza deaths and hospitalizations in the past decade, to produce a higher degree of protection while work proceeds toward a more long-term solution.
Supplementary Data
Supplementary materials are available at Clinical Infectious Diseases online. Consisting of data provided by the authors to benefit the reader, the posted materials are not copyedited and are the sole responsibility of the authors, so questions or comments should be addressed to the corresponding author.
Supplementary Material
Contributor Information
Ryan E Malosh, Division of Immunizations, Michigan Department of Health and Human Services, Lansing, Michigan, USA.
Ian McGovern, Center for Outcomes Research and Epidemiology, Seqirus USA Inc, Cambridge, Massachusetts, USA.
Arnold S Monto, School of Public Health, University of Michigan, Ann Arbor, Michigan, USA.
Notes
Acknowledgments. The authors thank Manish M. Patel, Influenza Division, Centers for Disease Control and Prevention, for his critical review of the manuscript.
Financial support. This work was supported in part by the National Institute of Allergy and Infectious Diseases (NIAID) (contract number 75N93021C00015). I. M. reports support from Seqirus USA Inc (employer).
All authors have submitted the ICMJE Form for Disclosure of Potential Conflicts of Interest. Conflicts that the editors consider relevant to the content of the manuscript have been disclosed.
References
- 1. Ortiz JR, Sotomayor V, Uez OC, et al. Strategy to enhance influenza surveillance worldwide. Emerg Infect Dis 2009; 15:1271–8. [DOI] [PMC free article] [PubMed] [Google Scholar]
- 2. Hay AJ, McCauley JW. The WHO global influenza surveillance and response system (GISRS)—a future perspective. Influenza Other Respir Viruses 2018; 12:551–7. [DOI] [PMC free article] [PubMed] [Google Scholar]
- 3. Stuurman AL, Biccler J, Carmona A, et al. Brand-specific influenza vaccine effectiveness estimates during 2019/20 season in Europe—results from the DRIVE EU study platform. Vaccine 2021; 39:3964–73. [DOI] [PubMed] [Google Scholar]
- 4. Skowronski DM, Leir S, Sabaiduc S, et al. Influenza vaccine effectiveness by A (H3N2) phylogenetic subcluster and prior vaccination history: 2016–2017 and 2017–2018 epidemics in Canada. J Infect Dis 2022; 225:1387–98. [DOI] [PMC free article] [PubMed] [Google Scholar]
- 5. Centers for Disease Control and Prevention . US influenza surveillance: purpose and methods.2021. Available at: https://www.cdc.gov/flu/weekly/overview.htm. Accessed 31 May 2022.
- 6. Centers for Disease Control and Prevention . CDC seasonal flu vaccine effectiveness studies.2022. Available at: https://www.cdc.gov/flu/vaccines-work/effectiveness-studies.htm. Accessed 31 May 2022.
- 7. Rolfes MA, Flannery B, Chung JR, et al. Effects of influenza vaccination in the United States during the 2017–2018 influenza season. Clin Infect Dis 2019; 69:1845–53. [DOI] [PMC free article] [PubMed] [Google Scholar]
- 8. Centers for Disease Control and Prevention . FluView interactive.2018. Available at: https://www.cdc.gov/flu/weekly/fluviewinteractive.htm. Accessed 14 January 2022.
- 9. Dhanasekaran V, Sullivan S, Edwards KM, et al. Human seasonal influenza under COVID-19 and the potential consequences of influenza lineage elimination. Nature Commun 2022; 13:1721. [DOI] [PMC free article] [PubMed] [Google Scholar]
- 10. Shrestha SS, Swerdlow DL, Borse RH, et al. Estimating the burden of 2009 pandemic influenza A (H1N1) in the United States (April 2009–April 2010). Clin Infect Dis 2011; 52:S75–82. [DOI] [PubMed] [Google Scholar]
- 11. Vega T, Lozano JE, Meerhoff T, et al. Influenza surveillance in Europe: establishing epidemic thresholds by the moving epidemic method. Influenza Other Respir Viruses 2013; 7:546–58. [DOI] [PMC free article] [PubMed] [Google Scholar]
- 12. Biggerstaff M, Kniss K, Jernigan DB, et al. Systematic assessment of multiple routine and near real-time indicators to classify the severity of influenza seasons and pandemics in the United States, 2003–2004 through 2015–2016. Am J Epidemiol 2018; 187:1040–50. [DOI] [PMC free article] [PubMed] [Google Scholar]
- 13. Reed C, Chaves SS, Daily Kirley P, et al. Estimating influenza disease burden from population-based surveillance data in the United States. PLoS One 2015; 10:e0118369. [DOI] [PMC free article] [PubMed] [Google Scholar]
- 14. Centers for Disease Control and Prevention . Disease burden of flu.2022. Available at: https://www.cdc.gov/flu/about/burden/index.html. Accessed 31 May 2022.
- 15. Centers for Disease Control and Prevention . How CDC estimates the burden of seasonal influenza in the U.S. 2019. Available at: https://www.cdc.gov/flu/about/burden/how-cdc-estimates.htm. Accessed 31 May 2022.
- 16. Centers for Disease Control and Prevention . FluVaxView interactive! 2021. Available at: https://www.cdc.gov/flu/fluvaxview/interactive.htm. Accessed 14 January 2022.
- 17. Centers for Disease Control and Prevention . About the National Immunization Surveys (NIS).2018. Available at: https://www.cdc.gov/vaccines/imz-managers/nis/about.html. Accessed 31 May 2022.
- 18. Centers for Disease Control and Prevention . Behavioral Risk Factor Surveillance System.2018. Available at: https://www.cdc.gov/brfss/index.html. Accessed 31 May 2022.
- 19. Centers for Medicare and Medicaid Services . Minimum Data Set (MDS) 3.0 for nursing homes and swing bed providers.2022. Available at: https://www.cms.gov/Medicare/Quality-Initiatives-Patient-Assessment-Instruments/NursingHomeQualityInits/NHQIMDS30. Accessed 31 May 2022.
- 20. Paules CI, Sullivan SG, Subbarao K, Fauci AS. Chasing seasonal influenza—the need for a universal influenza vaccine. N Engl J Med 2018; 378:7–9. [DOI] [PubMed] [Google Scholar]
- 21. Monto AS. Reflections on the Global Influenza Surveillance and Response System (GISRS) at 65 years: an expanding framework for influenza detection, prevention and control. Influenza Other Respir Viruses 2018; 12:10–12. [DOI] [PMC free article] [PubMed] [Google Scholar]
- 22. Hampson A, Barr I, Cox N, et al. Improving the selection and development of influenza vaccine viruses—report of a WHO informal consultation on improving influenza vaccine virus selection, Hong Kong SAR, China, 18–20 November 2015. Vaccine 2017; 35:1104–9. [DOI] [PMC free article] [PubMed] [Google Scholar]
- 23. World Health Organization . Global Influenza Programme: candidate vaccine viruses and potency testing reagents. 2022. Available at: https://www.who.int/teams/global-influenza-programme/vaccines/who-recommendations/candidate-vaccine-viruses. Accessed 31 May 2022.
- 24. Krammer F, Fouchier RAM, Eichelberger MC, et al. NAction! How can neuraminidase-based immunity contribute to better influenza virus vaccines? mBio 2018; 9:e02332–17. [DOI] [PMC free article] [PubMed] [Google Scholar]
- 25. Perofsky AC, Nelson MI. The challenges of vaccine strain selection. eLife 2020; 9:e62955. [DOI] [PMC free article] [PubMed] [Google Scholar]
- 26. Flannery B, Kondor RJG, Chung JR, et al. Spread of antigenically drifted influenza A(H3N2) viruses and vaccine effectiveness in the United States during the 2018–2019 season. J Infect Dis 2019; 221:8–15. [DOI] [PMC free article] [PubMed] [Google Scholar]
- 27. Foppa IM, Haber M, Ferdinands JM, Shay DK. The case test-negative design for studies of the effectiveness of influenza vaccine. Vaccine 2013; 31:3104–9. [DOI] [PubMed] [Google Scholar]
- 28. Jackson ML, Nelson JC. The test-negative design for estimating influenza vaccine effectiveness. Vaccine 2013; 31:2165–8. [DOI] [PubMed] [Google Scholar]
- 29. Valesano AL, Fitzsimmons WJ, McCrone JT, et al. Influenza B viruses exhibit lower within-host diversity than influenza A viruses in human hosts. J Virol 2020; 94:e01710-19. [DOI] [PMC free article] [PubMed] [Google Scholar]
- 30. Gambaryan A, Robertson J, Matrosovich M. Effects of egg-adaptation on the receptor-binding properties of human influenza A and B viruses. Virology 1999; 258:232–9. [DOI] [PubMed] [Google Scholar]
- 31. Zost SJ, Parkhouse K, Gumina ME, et al. Contemporary H3N2 influenza viruses have a glycosylation site that alters binding of antibodies elicited by egg-adapted vaccine strains. Proc Natl Acad Sci U S A 2017; 114:12578–83. [DOI] [PMC free article] [PubMed] [Google Scholar]
- 32. Kim SS, Flannery B, Foppa IM, et al. Effects of prior season vaccination on current season vaccine effectiveness in the United States Flu Vaccine Effectiveness Network, 2012–2013 through 2017–2018. Clin Infect Dis 2021; 73:497–505. [DOI] [PMC free article] [PubMed] [Google Scholar]
- 33. Tenforde MW, Kondor RJG, Chung JR, et al. Effect of antigenic drift on influenza vaccine effectiveness in the United States—2019–2020. Clin Infect Dis 2020; 73:e4244–e50. [DOI] [PMC free article] [PubMed] [Google Scholar]
- 34. Flannery B, Smith C, Garten RJ, et al. Influence of birth cohort on effectiveness of 2015–2016 influenza vaccine against medically attended illness due to 2009 pandemic influenza A(H1N1) virus in the United States. J Infect Dis 2018; 218:189–96. [DOI] [PMC free article] [PubMed] [Google Scholar]
- 35. Petrie JG, Parkhouse K, Ohmit SE, Malosh RE, Monto AS, Hensley SE. Antibodies against the current influenza A(H1N1) vaccine strain do not protect some individuals from infection with contemporary circulating influenza A(H1N1) virus strains. J Infect Dis 2016; 214:1947–51. [DOI] [PMC free article] [PubMed] [Google Scholar]
- 36. Ohmit SE, Thompson MG, Petrie JG, et al. Influenza vaccine effectiveness in the 2011–2012 season: protection against each circulating virus and the effect of prior vaccination on estimates. Clin Infect Dis 2014; 58:319–27. [DOI] [PMC free article] [PubMed] [Google Scholar]
- 37. Vaccines and Related Biological Products Advisory Committee . Global surveillance and virus characterization.2020. Available at: https://www.fda.gov/advisory-committees/blood-vaccines-and-other-biologics/vaccines-and-related-biological-products-advisory-committee. Accessed 31 May 2022.
- 38. Cobey S, Gouma S, Parkhouse K, et al. Poor immunogenicity, not vaccine strain egg adaptation, may explain the low H3N2 influenza vaccine effectiveness in 2012–2013. Clin Infect Dis 2018; 67:327–33. [DOI] [PMC free article] [PubMed] [Google Scholar]
- 39. Liu F, Gross FL, Jefferson SN, et al. Age-specific effects of vaccine egg adaptation and immune priming on A(H3N2) antibody responses following influenza vaccination. J Clin Invest 2021; 131:e146138. [DOI] [PMC free article] [PubMed] [Google Scholar]
- 40. World Health Organization . Vaccines against influenza WHO position paper—May 2022. Wkly Epidemiol Rec 2022; 19:185–208. [Google Scholar]
Associated Data
This section collects any data citations, data availability statements, or supplementary materials included in this article.


