Abstract
Genetically engineered T cell therapy can induce remarkable tumor responses in hematologic malignancies. However, it is not known if this type of therapy can be applied effectively to epithelial cancers, which account for 80–90% of human malignancies. We have conducted a first-in-human, phase 1 clinical trial of T cells engineered with a T cell receptor targeting HPV-16 E7 for the treatment of metastatic human papilloma virus-associated epithelial cancers (NCT02858310). The primary endpoint was maximum tolerated dose. Cell dose was not limited by toxicity with a maximum dose of 1 × 10¹¹ engineered T cells administered. Tumor responses following treatment were evaluated using RECIST (Response Evaluation Criteria in Solid Tumors) guidelines. Robust tumor regression was observed with objective clinical responses in 6 of 12 patients, including 4 of 8 patients with anti-PD-1 refractory disease. Responses included extensive regression of bulky tumors and complete regression of most tumors in some patients. Genomic studies, which included intra-patient tumors with dichotomous treatment responses, revealed resistance mechanisms from defects in critical components of the antigen presentation and interferon response pathways. These findings demonstrate that engineered T cells can mediate regression of common carcinomas, and they reveal immune editing as a constraint on the curative potential of cellular therapy and possibly other immunotherapies in advanced epithelial cancer.
Genetically engineered T cell therapy is an emerging cancer treatment strategy that has shown efficacy in hematologic cancers and that holds promise for the treatment of wide-ranging malignancies. NY-ESO-1 T cell receptor (TCR) T cells have shown tumor responses in melanoma, a highly immunogenic malignancy, and in synovial sarcoma, a rare soft tissue tumor1. However, evidence for the safety and clinical activity of engineered T cell therapy in epithelial cancers is limited2–5. Human papilloma virus (HPV)-associated malignancies, which include carcinomas of the uterine cervix, oropharynx, anus, vulva, vagina and penis, are prototypical epithelial cancers. In the metastatic stage they are incurable and often resistant to standard therapy. They uniformly express the HPV E7 antigen, which contributes to malignant transformation and cancer cell survival, making it an attractive therapeutic target4–7. E7 localizes to the intracellular compartment and consequently cannot be targeted with antibodies or chimeric antigen receptor (CAR)-T cells. We have discovered a high-avidity TCR that targets HPV-16 E7 through recognition of the E711–19 epitope complexed with HLA-A*02:01 (ref.8) (HLA, human leukocyte antigen). Human T cells genetically engineered to express this TCR (E7 TCR-T cells) engage and kill HPV+ tumor cell lines in vitro and mediate regression of HPV+ tumor xenografts in vivo8. We have conducted a clinical trial of E7 TCR-T cells for patients with metastatic HPV-associated cancers (NCT02858310).
Results
Patients and treatments.
Between 27 January 2017 and 20 April 2018, 12 patients with metastatic HPV-16+ cancers were treated (Table 1). Patients had a median age of 47 years (range, 31–65 years) and squamous cell carcinomas (n = 11) or adenocarcinomas (n = 1). The primary tumor sites were the uterine cervix (n = 5), head and neck (n = 4), anus (n = 2) and vulva (n = 1). The median number of prior anticancer agents was 4 (range, 3–7). Eight patients had received programmed cell death protein 1 (PD-1)-based immunotherapy, and one patient had received cellular therapy (LN-145, a tumor-infiltrating lymphocyte-based cell product). A median of 96% (range, 93–99%) of the infused T cells expressed the E7 TCR and bound to the E711–19-HLA-A*02:01 tetramer target complex (Table 1). A reduced cyclophosphamide dose (30 mg kg−1) was administered to six patients. A median of four doses of aldesleukin were given (range, 0–11). There were no T cell product manufacturing failures and no patients who were unable to receive a product that was initiated. A CONSORT trial diagram is provided in Extended Data Fig. 1.
Table 1 |.
Patient characteristics
| Age (years) | Sex | Diagnosis | Sites of disease | Previous systemic treatments | Cell dose (×109) | E7 TCR-T cells (%)a | Cyclophosphamide dose (mg kg−1) | Aldesleukin doses | Response (duration in months)b | |
|---|---|---|---|---|---|---|---|---|---|---|
| 1 | 49 | F | Vulvar SCC | Lungs, mediastinum, retroperitoneum, pelvis, inguinal, thigh | Cisplatin, topotecan, carboplatin, paclitaxel, bevacizumab, trametinib, erlotinib | 1 | 97 | 30 | 3 | PR (8) |
| 2 | 50 | M | Head and neck SCC | Kidney, bone | Cisplatin, pembrolizumab, nivolumab | 1 | 95 | 60 | 10 | SD (3c) |
| 3 | 44 | F | Cervical SCC | Inguinal, retroperitoneum | Cisplatin, carboplatin, paclitaxel, bevacizumab | 1 | 99 | 30 | 11 | SD (3) |
| 4 | 44 | F | Cervical SCC | Iliac, mediastinum, retroperitoneum | Cisplatin, paclitaxel, bevacizumab | 10 | 94 | 60 | 6 | NR |
| 5 | 59 | M | Anal SCC | Lungs, mediastinum, pleura, kidney, retroperitoneum, bone | Mitomycin, 5-FU, pembrolizumab | 10 | 95 | 60 | 5 | PR (9) |
| 6 | 41 | M | Head and neck SCC | Bone, lung | Cisplatin, pembrolizumab, cetuximab, 5-FU | 10 | 93 | 60 | 4 | PR (4) |
| 7 | 65 | M | Head and neck SCC | Lungs, abdominal wall, mediastinum, retroperitoneum, pleura, subdiaphragmatic, bone | Cisplatin, nivolumab, α-tocopherlyoxyacetic acid, cetuximab, 5-FU, LN-145 | 100 | 98 | 30 | 6 | PR (4) |
| 8 | 31 | F | Cervical Adenocarcinoma | Lung | Cisplatin, paclitaxel, bevacizumab | 107 | 96 | 30 | 3 | PR (3) |
| 9 | 62 | F | Anal SCC | Liver, mediastinum, lung | Mitomycin, 5-FU, oxaliplatin, cisplatin, nivolumab | 107 | 96 | 60 | 3 | SD (2) |
| 10 | 59 | M | Head and neck SCC | Lung, mediastinum | Cisplatin, docetaxel, pembrolizumab, cetuximab | 120 | 93 | 60 | 3 | SD (4) |
| 11 | 40 | F | Cervical SCC | Liver, lung, mediastinum, retroperitoneum, bone, pelvis | Cisplatin, paclitaxel, bevacizumab, pemetrexed, pembrolizumab | 100 | 94 | 30 | 0 | NR |
| 12 | 40 | F | Cervical SCC | Chest wall, rectum, retroperitoneum | Cisplatin, paclitaxel, bevacizumab, carboplatin, gemcitabine, atezolizumab, pemetrexed | 100 | 97 | 30 | 1 | PR (8) |
Measured by flow cytometry as percentage of CD3+ cells with mouse TCR β-chain constant region and tetramer (HLA-A*02:01-E711–19) binding.
Duration is measured in time from E7 TCR-T cell infusion.
Treated with another agent without having progressed. F, female; FU, fluorouracil; M, male; NR, no response; PR, partial response; SCC, squamous cell carcinoma; SD, stable disease.
Safety.
There were no dose-limiting toxicities (DLTs) at dose levels 1 or 2. There was one DLT at dose level 3 (Table 2 shows grade 3 and 4 adverse events; Supplementary Table 1 shows the highest-grade adverse events (AEs) by patient) in patient 11 who, before cell infusion, developed rapidly progressive lymphangitic pulmonary metastases and impaired pulmonary function. Cells were infused in the intensive care unit as a precaution, and the patient displayed rapid cardiopulmonary decompensation and related complications that required prolonged hospitalization. The protocol was subsequently amended to prohibit treatment of patients with hypoxia at the time of cell infusion. Dose level 3 (1 × 10¹¹ E7 TCR-T cells) was determined to be the recommended phase 2 dose. The most common grade 3 and 4 AEs were the expected toxicities of the conditioning regimen and high-dose aldesleukin (Table 2). Clinical signs of TCR reactivity against healthy tissues were not observed5. Cytokine release syndrome symptoms were typical of aldesleukin administration and, in contrast to CAR-T cells for hematologic malignancies, did not limit the dose of E7 TCR-T cells2,3,9. There were no treatment-related deaths.
Table 2 |.
Adverse events (grades 3 and 4)
| Adverse event | Dose level 1 (n = 3) | Dose level 2 (n = 3) | Dose level 3 (n = 6) | All dose levels (%) |
|---|---|---|---|---|
| Anemia | 3 | 3 | 6 | 12 (100) |
| Lymphopenia | 3 | 3 | 6 | 12 (100) |
| Leukopenia | 3 | 3 | 6 | 12 (100) |
| Neutropenia | 3 | 3 | 6 | 12 (100) |
| Febrile neutropenia | 2 | 2 | 4 | 8 (67) |
| Thrombocytopenia | 2 | 2 | 4 | 8 (67) |
| Hypophosphatemia | 2 | 1 | 3 | 6 (50) |
| Hyponatremia | 0 | 1 | 3 | 4 (33) |
| Pulmonary edema | 1 | 0 | 2 | 3 (25) |
| Hypoxia | 1 | 0 | 2 | 3 (25) |
| Aspartate aminotransferase increased | 0 | 1 | 2 | 3 (25) |
| Hypotension | 1 | 0 | 1 | 2 (17) |
| Pleural effusion | 0 | 1 | 1 | 2 (17) |
| Alanine aminotransferase increased | 0 | 1 | 1 | 2 (17) |
| Hypokalemia | 1 | 0 | 1 | 2 (17) |
| Catheter-related infection | 0 | 0 | 1 | 1 (8) |
| Syncope | 0 | 0 | 1 | 1 (8) |
| Pure red cell aplasia | 1 | 0 | 0 | 1 (8) |
| Fever | 0 | 0 | 1a | 1 (8) |
| Acute kidney injury | 0 | 0 | 1a | 1 (8) |
| Respiratory failure | 0 | 0 | 1a | 1 (8) |
| Generalized muscle weakness | 0 | 0 | 1a | 1 (8) |
| Hyperkalemia | 0 | 0 | 1a | 1 (8) |
| Peripheral ischemia (lower extremity) | 0 | 0 | 1a | 1 (8) |
| Anxiety | 0 | 0 | 1a | 1 (8) |
| Blood bilirubin increased | 0 | 0 | 1a | 1 (8) |
| CPK increased | 0 | 0 | 1a | 1 (8) |
| Acidosis | 0 | 0 | 1a | 1 (8) |
| Delirium | 0 | 0 | 1a | 1 (8) |
| Dysphagia | 0 | 0 | 1a | 1 (8) |
| Hypertension | 0 | 0 | 1a | 1 (8) |
Occurred in the same patient.
Clinical activity.
Six of 12 patients demonstrated objective tumor responses (Table 1 and Fig. 1). Three patients demonstrated complete regression of one or more tumors. In some patients, cancer regression was extensive with durable regression of some tumors; no Response Evaluation Criteria in Solid Tumors (RECIST) responses are ongoing (Fig. 1a–e and Extended Data Fig. 2a–c). Patient 1 had metastatic vulvar squamous cell carcinoma (SCC) with more than 80 lung metastases as well as retroperitoneal, pelvic and thigh metastases (Fig. 1c). She had been treated previously with seven systemic anticancer agents. She experienced an eight-month partial response with complete regression of ~25 tumors in the lungs that remained absent from imaging eight months after treatment. Patient 5 had metastatic anal SCC with more than 90 metastatic tumors that involved the thorax, retroperitoneum, bones and kidney (Fig. 1d). He had been treated previously with chemoradiation and with PD-1-based therapy. He experienced a nine-month partial response with complete regression of ~80 tumors that remained absent from imaging 14 months after treatment (Fig. 1d and Extended Data Fig. 2a,c). Patient 12 had metastatic cervical SCC with chest wall, rectal and retroperitoneal metastases (Fig. 1e). She had been treated previously with seven systemic anticancer agents including PD-1-based therapy. She experienced a partial response of eight months duration with complete regression of two of three sites of disease. The tumors that regressed completely remained absent from imaging eight months after treatment (Fig. 1e and Extended Data Fig. 2b,c). Responses were observed at all dose levels, which may be related to the high starting dose of 1 × 10⁹ E7 TCR-T cells, which was approximately two- to sevenfold higher than the recommended therapeutic dose for CAR-T cells10,11.
Fig. 1 |. E7 TCR-T cells demonstrate robust clinical activity in epithelial cancers.
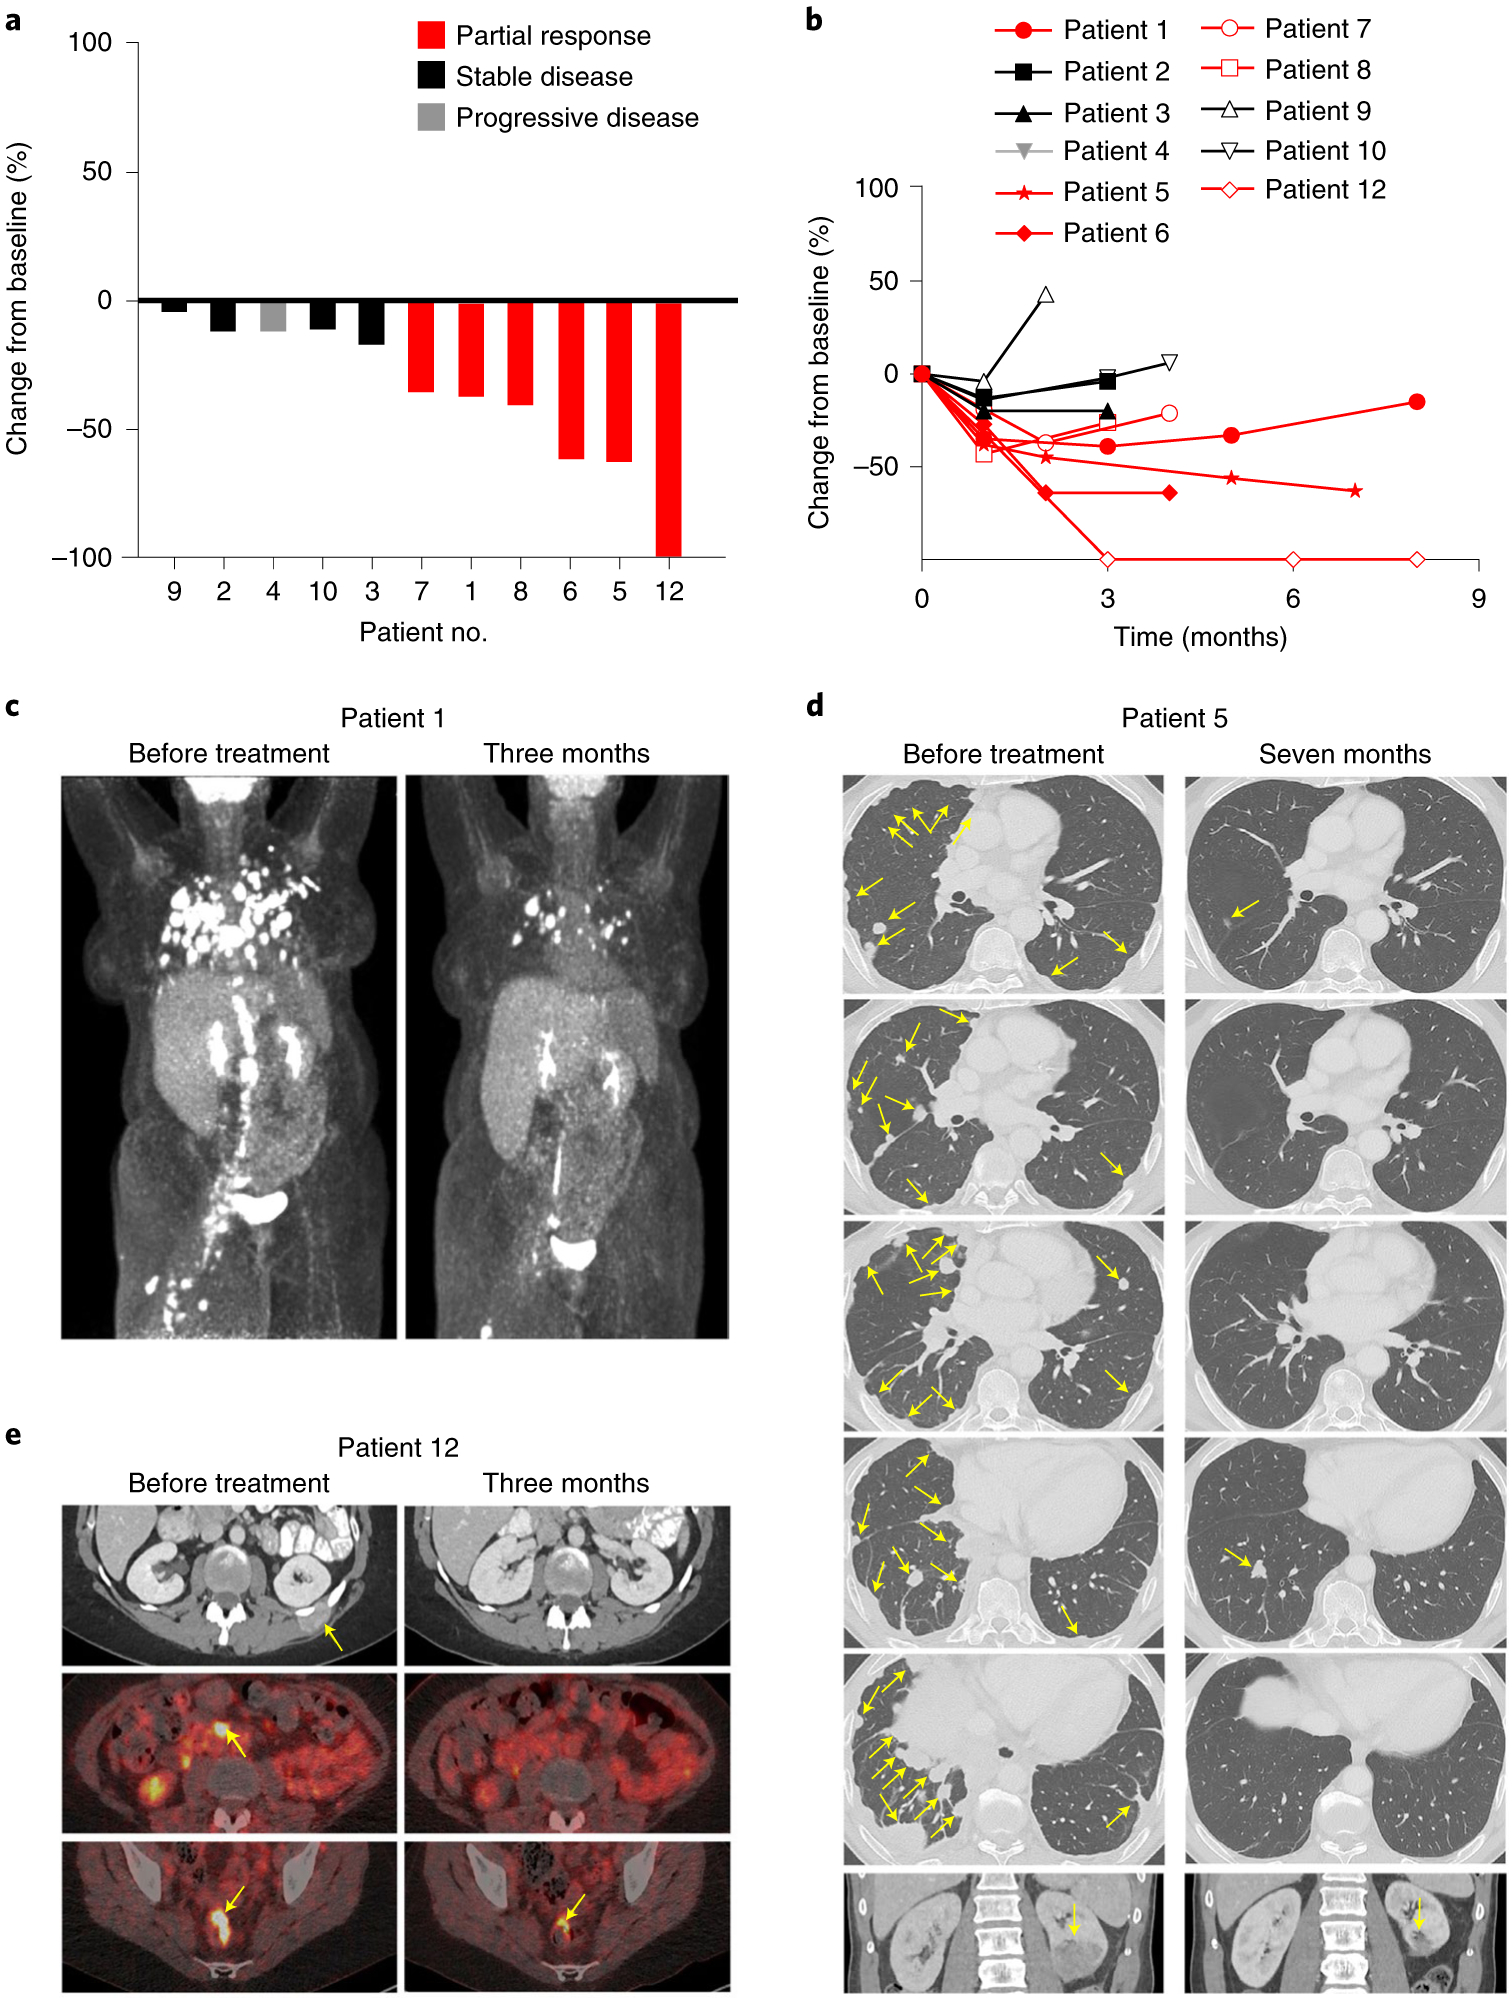
a, Waterfall plot of the best clinical response for each evaluable patient. b, Spider plot of the change in the sum of the diameters of each patient’s index lesions over time. Patients with objective clinical responses are indicated in red. c, Positron emission tomography (PET) scans from patient 1, who had metastatic vulvar cancer with extensive pulmonary, retroperitoneal, pelvic and thigh lesions. d, Computed tomography (CT) scans from patient 5, who had metastatic anal cancer with numerous pulmonary, pleural and kidney lesions. e, CT scans (top row) and PET-CT scans (middle row and bottom row) from patient 12, who had metastatic cervical cancer with chest wall, retroperitoneal and rectal lesions. Yellow arrows point to tumors.
T cell characteristics.
The exploratory objective of this trial was to perform immunologic studies to understand and improve the administered E7 TCR-T cell therapy. E7 TCR-T cells displayed expansion and prolonged survival after infusion, as assessed by their frequency and concentration (Fig. 2a and Extended Data Fig. 3) in peripheral blood. Frequency and concentration at the first response assessment were significantly different between dose levels but not between patients with or without response (Extended Data Fig. 4a,b). Prolonged, high persistence of E7 TCR-T cells was observed, particularly at dose levels 2 and 3 (Fig. 2a and Extended Data Fig. 3). Increased peripheral blood T cell reactivity against the targeted E7 epitope was observed after treatment and correlated with E7 TCR-T cell frequency (Fig. 2b). Anti-E7 TCR antibodies were not detected in serum after treatment, suggesting low immunogenicity of the TCR despite the use of murine constant regions (Extended Data Fig. 5). Collectively, these data demonstrated enduring persistence of functional engineered T cells.
Fig. 2 |. Engineered T cells displayed in vivo persistence and function, and tumors displayed genetic defects in crucial immune-related genes.
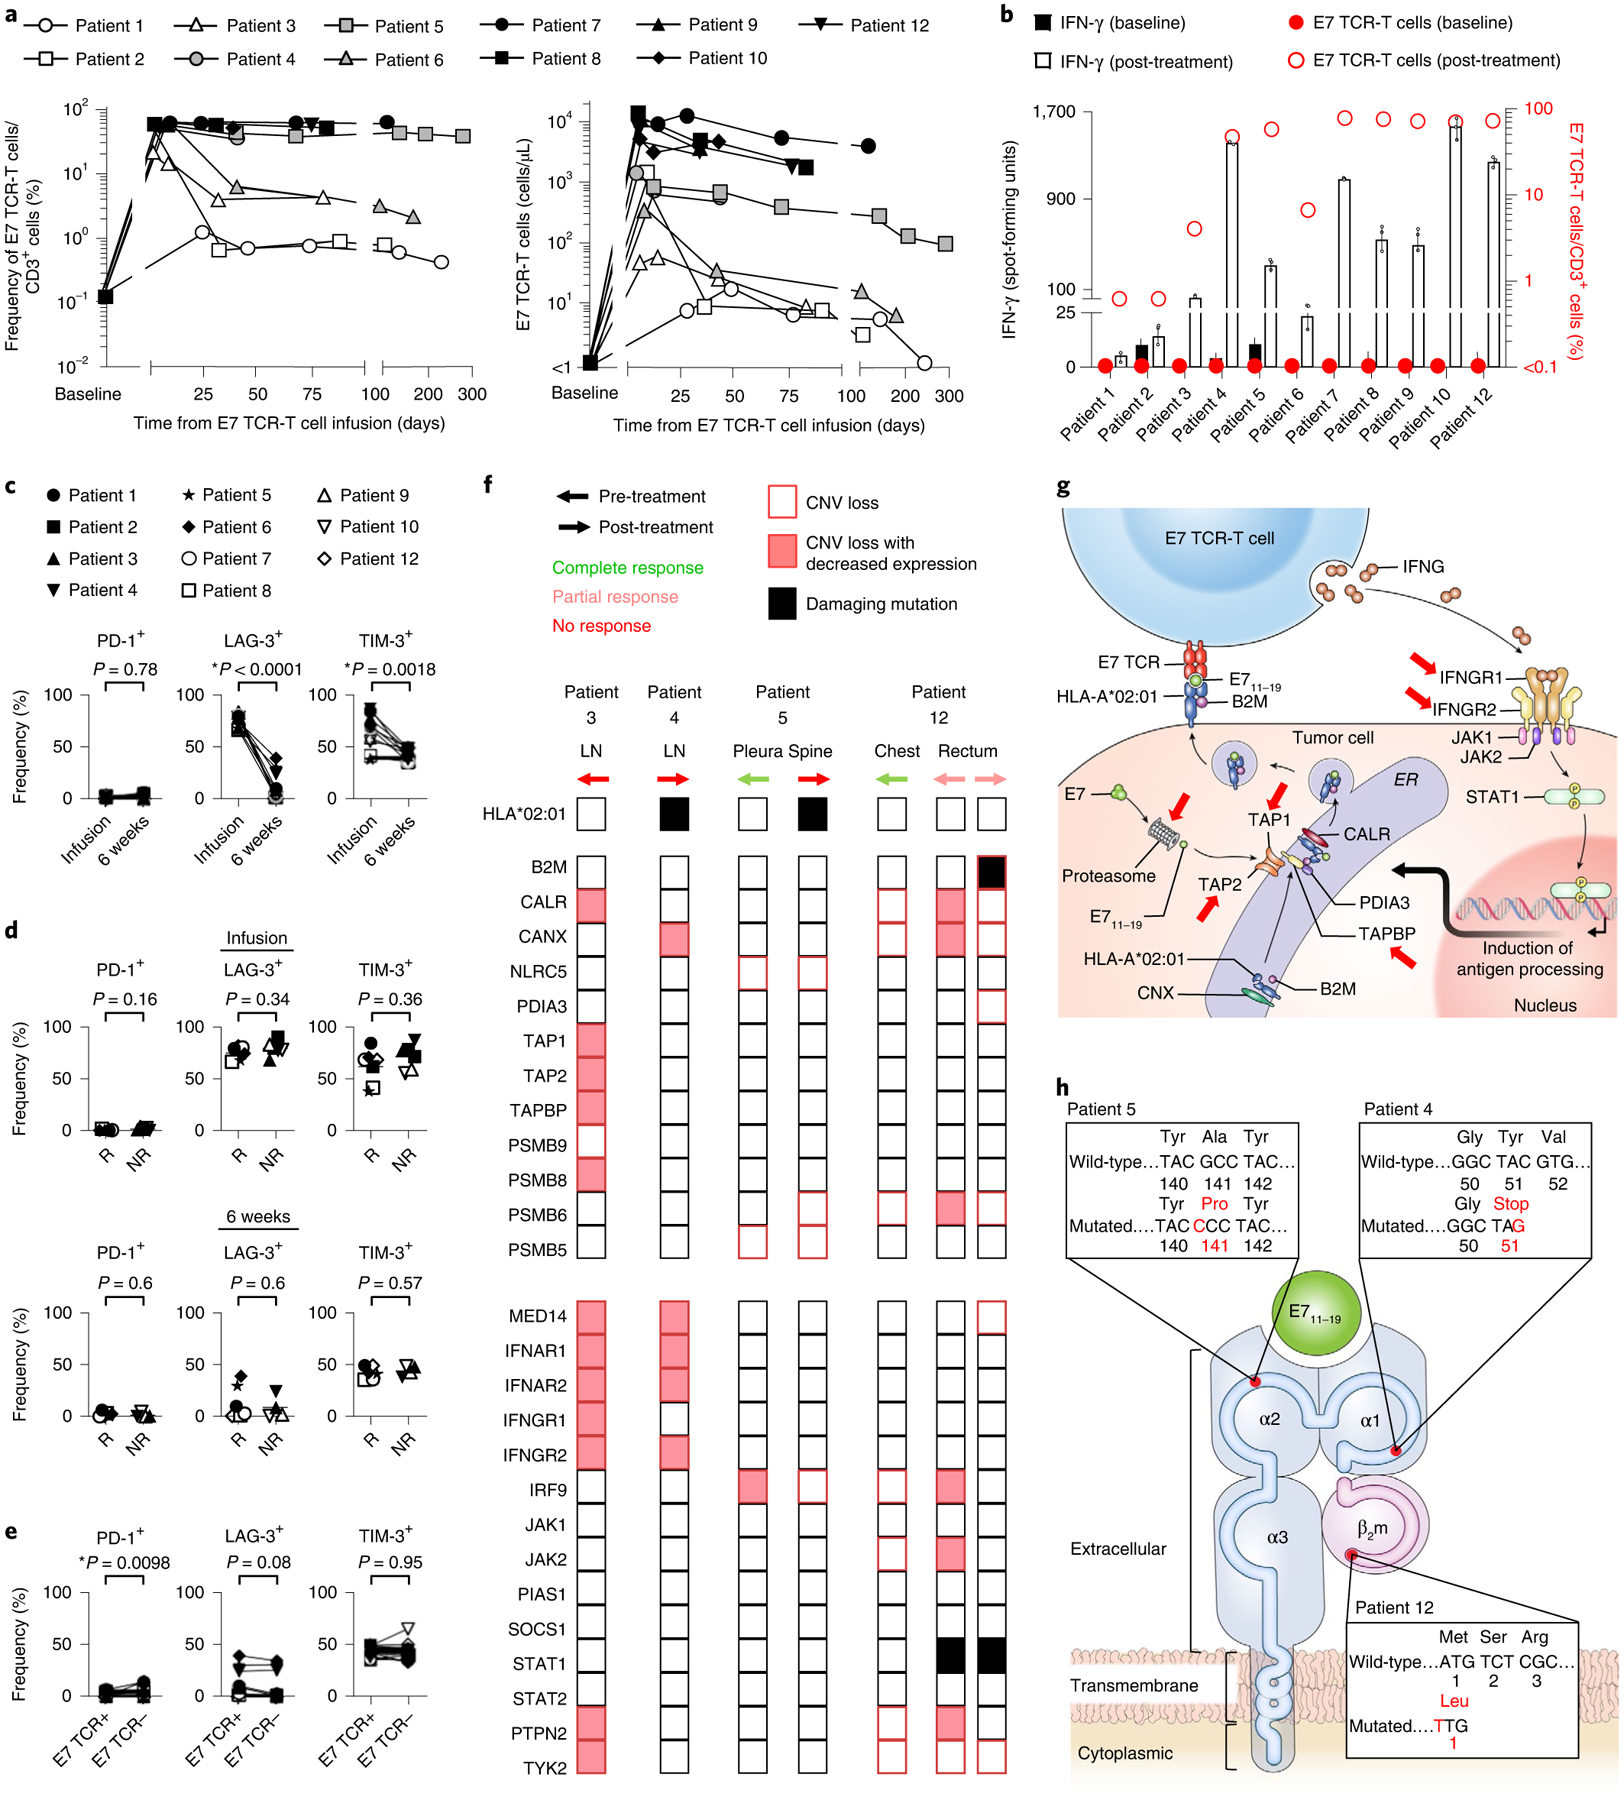
a, Persistence of E7 TCR-T cells based on flow cytometric analysis of peripheral blood. White, gray and black symbols indicate dose levels 1, 2 and 3, respectively. b, The frequency of E7 TCR-T cells and the reactivity of peripheral blood T cells against E7 before treatment and at the first clinical response assessment (that is, at the 6-week time point). The left y axis and bars indicate interferon-γ (IFN-γ) production as measured by FluoroSpot assay. Data are presented as mean ± standard deviation of three technical replicates. The right y axis and circle symbols indicate the frequency of E7 TCR-T cells per peripheral blood T cell. Persistence of E7 TCR-T cells correlated with peripheral blood T cell reactivity against E7 (Spearman r = 0.6545, P = 0.0336). c–e, Flow cytometric analysis of the E7 TCR-T cells expression of inhibitory receptors. c, Expression of inhibitory receptors by E7 TCR-T cells in infusion products (infusion) compared to E7 TCR-T cells in peripheral blood at the 6-week time point (6 weeks). The frequency of transduced E7 TCR-T cells that express the inhibitory receptor indicated in the y-axis label is shown. P values represent two-sided paired t-tests (P = 0.78 for PD-1, P < 0.0001 for LAG-3 and P = 0.0018 for TIM-3). d, Comparison of inhibitory receptor expression by E7 TCR-T cells in patient who responded (R) or did not respond (NR) to treatment. The frequency of transduced E7 TCR-T cells that express the inhibitory receptor indicated in the y-axis label is shown. The top row shows infusion products. The bottom row shows peripheral blood at the 6-week time point. P values represent two-sided unpaired t-tests. e, Expression of inhibitory receptors at the 6-week time point by peripheral blood T cells expressing (E7 TCR+) or not expressing (E7 TCR−) the E7 TCR. P values represent two-sided paired t-tests. f, Heatmap indicating genetic defects in molecular pathways related to antigen processing (top section) and IFN response (bottom section). Each column represents a distinct tumor. The patient, site of disease, biopsy timing and response to treatment for that specific tumor are indicated above the columns. Only damaging mutations are shown. Copy number variation (CNV) analysis was performed with whole exome sequencing (WES) data. CNV loss was defined as copy number less than tumor ploidy. Decreased expression was defined as a twofold or greater decrease by RNA-sequencing (RNA-seq) analysis. LN, lymph node. g, Diagram illustrating immune-related genetic defects in antigen processing and IFN response in the tumor biopsy from patient 3. h, Illustration depicting identified damaging mutations to the target HLA complex for each patient. Patient 5 had a missense mutation and patient 4 had a nonsense mutation in HLA-A*02:01. Patient 12 had CNV loss of B2M combined with a start-loss point mutation in the remaining copy of B2M.
To investigate possible inhibition of E7 TCR-T cells by immune checkpoint mechanisms, expression of inhibitory receptors by E7 TCR-T cells was studied. A low frequency of E7 TCR-T cells in peripheral blood expressed the PD-1 receptor (Fig. 2c–e). A higher frequency expressed the lymphocyte activation gene 3 (LAG-3) and T cell immunoglobulin and mucin domain-containing protein 3 (TIM-3) receptors; however, the frequency of LAG-3+ and TIM-3+ cells decreased following cell infusion (Fig. 2c). Expression of inhibitory receptors did not correlate with treatment response (Fig. 2d) and was not elevated in E7 TCR-T cells compared with endogenous T cells (Fig. 2e). Thus, the findings did not clearly point to a checkpoint-based mechanism of resistance, although they also did not rule out the potential influence of this axis. Infused and engrafted E7 TCR-T cells were analyzed for a panel of phenotypic markers (Extended Data Figs. 6 and 7) and functional characteristics (Extended Data Fig. 8). Serum cytokine levels were also analyzed (Extended Data Fig. 9). Strong correlations with clinical response were not identified. Taken together, these data failed to present clear T cell-based factors that determined treatment response.
Tumor genomics and transcriptomics.
To study potential tumor-intrinsic genetic mechanisms of resistance, all available tumor samples from all patients were interrogated with WES and RNA-seq analysis (Supplementary Table 2 and Fig. 2f–h). The data were analyzed to identify defects in antigen processing and interferon response, pathways critical to T cell recognition and engagement of tumor cells (Supplementary Table 3 and Fig. 2f–h). Patient 3 had a tumor that was biopsied before cell infusion and did not respond to treatment. It demonstrated multiple copy number loss defects, including loss of TAP1 and TAP2, which are central to antigen processing, and IFNGR1 and IFNGR2, which are necessary for IFN-γ response (Fig. 2f,g)12–15. Patient 4 had a tumor that did not respond to treatment and was biopsied following treatment. It demonstrated a nonsense mutation in HLA-A*02:01, a necessary component of the E7 TCR target peptide–HLA complex (Fig. 2f,h). Patient 5 had extensive pleural disease that was biopsied before treatment and designated for post-treatment biopsy (Fig. 2f). However, the pleural disease rapidly and completely regressed, and a post-treatment biopsy could not be obtained (Fig. 1d). Nine months after treatment, a new spine metastasis developed despite the persistence of engineered T cells representing 53% of the T cell compartment (Fig. 2a). This metastasis demonstrated a damaging mutation in HLA-A*02:01 (Fig. 2f,h). The mutation was absent from the pre-treatment biopsy of the pleural tumor that regressed completely, providing further evidence of the HLA-A*02:01 mutation as the mechanism of late escape (Fig. 2f). As with patient 5, patient 12 had a tumor biopsied before treatment (a chest wall lesion) and designated for post-treatment biopsy that rapidly and completely regressed and could not be biopsied (Figs. 1e and 2f). The patient also had a rectal tumor that was biopsied before treatment and at time points following treatment (Fig. 2f and Extended Data Fig. 10). Biopsies from this tumor displayed the presence of E7 TCR-T cells and the absence of tumor cells during regression (day +36 and day +77), and the presence of E7 TCR-T cells and of tumor cells, but non-colocalization of the two cell types during subsequent tumor progression (day +209) (Extended Data Fig. 10). The biopsy from the time of progression demonstrated copy number loss of B2M combined with a start-loss point mutation in the remaining copy of B2M (Fig. 2f,h). This biallelic loss, through combined copy number loss and mutation, of a critical component of the E7 TCR target appears to explain the lack of colocalization of E7 TCR-T cells with tumor cells at day +209. The defects in B2M were not detected in the rectal tumor prior to treatment, and they were not detected in the chest wall tumor that regressed completely (Fig. 2f), which further supports their importance in tumor resistance. Hence, for patient 3, the data suggest tumor resistance through compound genetic defects in critical pathways for T cell-mediated recognition and killing of tumor cells, and for patients 4, 5 and 12, the data demonstrate definitive resistance mechanisms through defects in components of the target peptide–HLA complex (Fig. 2g,h).
Discussion
Antigen receptor-engineered T cell therapy is an emerging cancer treatment modality that promises to transform the treatment of certain cancers. CAR-T cells have demonstrated unprecedented efficacy in leukemia and lymphoma2,3,16. TCR-T cells have shown responses in niche soft tissue tumors, albeit when given with other agents with clinical activity (that is, interleukin-2 (IL-2) for melanoma and high-dose oxazaphosphorine alkylating agent for synovial sarcoma)1. After nearly two decades of clinical trials, the present study now demonstrates robust clinical activity for antigen receptor-engineered T cell therapy in conventional carcinomas2,4,5. The treatment also showed clear clinical activity in cancers refractory to PD-1-based immunotherapy. This finding may be due to the contrasting mechanisms of actions of the approaches, with E7 TCR-T cells directly targeting tumors with high numbers of high-avidity T cells and checkpoint blockade indirectly targeting tumors through disinhibition of natural numbers of variable-avidity, undefined-specificity T cells in the tumor. Interestingly, complete regression of some tumors occurred, but other tumors, sometimes in the same patients, demonstrated immune escape through alterations in the target peptide–HLA complex, antigen processing and IFN response. These findings are consistent with other emerging data from cellular therapy and checkpoint inhibitor studies17–20. They also conform with the concept of cancer immunoediting and illustrate the downstream clinical implications of this phenomenon in the late-stage treatment of epithelial cancer21,22. Collectively, the data support a proof of principle for the development of engineered T cell therapy for common epithelial cancers, including treatments that target private tumor neoantigens with personalized TCRs23–25, while also pointing to the importance of tumor-intrinsic factors for biomarker discovery and therapeutic advances.
One limitation of the study is that the conditioning regimen may have contributed a direct cytotoxic anti-tumor effect. However, cyclophosphamide is not used to treat HPV-associated cancers, high-dose ifosfamide (a cyclophosphamide analog) has negligible post-platinum activity26–28 and fludarabine does not have activity in solid tumors. In addition, patient 7 responded to E7 TCR-T cells but not to a prior cell therapy (LN-145) with a higher dose of cyclophosphamide in the conditioning. Finally, the observed immune-based mechanisms of tumor escape imply immunological rather than chemotherapeutic pressure on the tumors. Another limitation of the study is that tumor microenvironment studies were limited; tumor samples were not available due to patient consent and safety, rapid elimination of tumors or the quantity and quality of the biopsy samples. Hence, while the available data implicate tumor-intrinsic genetic defects as treatment-limiting mechanisms of resistance, other factors such as inhibitory forces in the tumor microenvironment may have been important.
The response rate in this trial was higher and the observed tumor regression was greater (that is, complete regression of many individual tumors in different patients) than in a prior trial of engineered T cells targeting HPV-16 E6 (E6 TCR-T cells) in a similar patient population7. Caution is required in comparing between sequential trials with small numbers of patients. Nonetheless, this finding may point to the importance of high-avidity peptide–HLA complex targeting as E7 TCR-T cells have higher functional avidity, longer target peptide–HLA dissociation time and greater anti-tumor effector function (IFN-γ production and tumor cytolysis) than E6 TCR-T cells8. It also may be important that, compared with the E6 epitope, the E7 epitope has greater predicted HLA binding affinity and is more readily detected by MS3 Poisson detection mass spectrometry, suggesting higher stability and increased abundance of the peptide–HLA target complex29. Finally, the transduction efficiency for the E7 TCR-T cell product is substantially higher than it was for the E6 TCR-T cell product (93–99% for E7 versus 45–76% for E6), resulting in higher expression of the TCR and fewer untransduced bystander cells to compete for engraftment29.
It would be valuable to know if treatment with E7 TCR-T cells resulted in epitope spreading, but the investigation was limited by the availability of tumor biopsy samples. The E7 antigen is an attractive therapeutic target due to its tumor-restricted, constitutive expression, which facilitates proof-of-principle clinical research. Other tumor-restricted antigens such as mutated neoantigens and cancer germline antigens may also be targeted with TCR-T cells and represent viable therapeutic targets, but their expression is more heterogeneous, and clinical data on targeting them with TCR-T cells in epithelial cancers are limited. This trial was designed to determine the maximum tolerated dose rather than the minimal effective dose. Although high doses of cells were feasible, lower doses may be effective as suggested by responses at the first two dose levels. T cell responses against the E7 TCR murine constant region were not measured; however, sustained, high-level engraftment was observed suggesting that T cell-mediated rejection of E7 TCR-T cells was not a major limitation.
Future research will aim to develop technologies that overcome resistance, with a focus on strategies that upregulate interferon response and antigen processing or that activate non-T cell anti-tumor responses4,30. In addition, treatment at an earlier stage of disease may help to preempt immune editing and development of resistance, and thereby improve outcomes. Finally, future research will concentrate on the development of biomarker assays to rapidly identify common resistance mechanisms to improve patient selection. A phase 2 arm of this trial (NCT02858310) is currently open to further assess the safety and clinical activity of the maximum tolerated dose (100 billion E7 TCR-T cells) in patients with metastatic disease, and clinical trials for earlier-stage disease are planned.
Methods
Study design.
This phase 1 study used a 3 + 3 dose escalation strategy to determine the maximum tolerated dose of E7 TCR-T cells. The exploratory objective of the protocol was to conduct immunologic studies to understand and improve the therapy. There were no secondary objectives. The full clinical trial protocol is provided in the Supplementary Information. Briefly, patients were treated with 1 × 10⁹ (level 1), 1 × 10¹⁰ (level 2) and 1 × 10¹¹ (level 3) TCR-T cells. A conditioning regimen was administered consisting of cyclophosphamide 30 mg kg−1 or 60 mg kg−1 intravenously (i.v.; days −7 and −6) and fludarabine 25 mg m−2 i.v. (days −7 through −3; five doses). Cyclophosphamide dose was chosen by investigators based on bone marrow reserve and comorbidities. E7 TCR-T cells were administered on day 0 followed by aldesleukin 720,000 IU kg−1 i.v. every 8 h until patient tolerance was exceeded.
Study oversight.
The protocol was approved by the National Cancer Institute Institutional Review Board at the National Institutes of Health Clinical Center and was conducted in accordance with the principles of the Declaration of Helsinki and the International Conference on Harmonization Good Clinical Practice Guideline. An independent data and safety monitoring committee regularly reviewed safety data. All the patients provided written informed consent. The study was designed by the authors, who also collected and analyzed the data. The manuscript was written by the authors. All the authors had access to the data and vouch for its accuracy and completeness.
Patients.
The major inclusion criteria were a diagnosis of metastatic or locally advanced refractory or recurrent HPV-associated cancer from any primary tumor site that was measurable, HPV-16 genotype from tumor, HLA-A*02:01 allele from blood, prior first-line chemotherapy or chemoradiation, three or fewer brain metastases that have been treated with surgery or stereotactic radiosurgery, age 18–70 years, Eastern Cooperative Oncology Group performance status of 0 or 1, seronegative for human immunodeficiency virus antibody, hepatitis B antigen and hepatitis C antibody, absolute neutrophil count >1,000 mm−3 white blood cell count >3,000 mm−3, platelet count >100,000 mm−3, hemoglobin >8.0 g dl−1, serum ALT/AST <2.5 times the upper limit of normal, calculated creatinine clearance >50 ml min−1/1.732 using the Cockcroft–Gault equation, total bilirubin <1.5 mg dl−1, and more than four weeks from prior systemic therapy at the time of receiving E7 TCR-T cells. The major exclusion criteria were active systemic infection, coagulation disorder or other active major medical illnesses of the cardiovascular, respiratory or immune system, any form of primary immunodeficiency, concurrent opportunistic infection, autoimmune disease, concurrent systemic steroid therapy, and history of severe immediate hypersensitivity reaction to cyclophosphamide, fludarabine or aldesleukin. HPV-16 genotype was confirmed at the Massachusetts General Hospital Department of Pathology using the Cobas 4800 System (Roche)31. Patients were required to have the germline HLA-A*02:01 allele based on HLA haplotype testing performed by the NIH Clinical Center HLA Laboratory. An Eastern Cooperative Oncology Group performance status of 0 or 1 was required. The first patient was enrolled on 27 January 2017 and the last patient was enrolled on 20 April 2018.
Safety and response assessments.
AEs were recorded from enrollment to at least 40 days following cell infusion. All research-related grade 3 and greater adverse events, regardless of attribution, that occurred within 30 days of E7 TCR-T cell administration were considered DLTs with the following exceptions: aldesleukin toxicity that resolved to grade 2 or less within 14 days of the last dose of aldesleukin, transient grade 3 hypoxia associated with cell infusion, autoimmune toxicity that resolved to grade 2 or less within 14 days, hemorrhage that was unrelated to the E7 TCR-T cells (that is, bleeding from the primary tumor or a site of prior radiotherapy), infection that was controlled within seven days, and hematologic toxicities of the conditioning regimen. AEs were graded according to the Common Terminology Criteria for Adverse Events, version 4.03. Tumor response was measured according to the RECIST v1.1 guidelines.
E7 TCR-T cell manufacturing.
E7 TCR-T cells were manufactured as described previously32. Briefly, autologous peripheral blood mononuclear cells (PBMCs) were obtained by leukapheresis. PBMCs were stimulated with OKT3 50 ng ml−1 in culture medium supplemented with IL-2 300 IU ml−1. Cells were transduced by spinoculation in RetroNectin-coated bags using MSGV1 gamma-retrovirus encoding the E7 TCR. A secondary expansion step utilizing stimulation with irradiated allogeneic feeder cells, OKT3 and IL-2 was performed. The total manufacturing time was ~23 days. Cell manufacturing was conducted at the NIH Clinical Center, Department of Transfusion Medicine. There were no manufacturing failures.
Biospecimen collection and cell lines.
Peripheral blood samples were processed by the Experimental Transplantation and Immunology Branch (ETIB) Preclinical Development and Clinical Monitoring Facility (PDCMF). PBMCs were isolated using lymphocyte separation medium (Corning). Apheresis products were collected by the Dowling Apheresis Clinic of the Department of Transfusion Medicine (National Institutes of Health, Bethesda). E7 TCR-T cell infusion samples were obtained from each manufactured cell product and cryopreserved. Serum was obtained from peripheral blood samples that were collected in serum separator tubes (BD Vacutainer; Fisher Scientific). Tumor biopsy specimens were formalin-fixed and paraffin-embedded (FFPE) or frozen in optimal cutting temperature (OCT) medium (Tissue-Tek; Sakura) using standard techniques.
Flow cytometry.
Cells were labeled with fixable viability dye (eBioscience/Thermo Fisher Scientific) and antibodies against CD3 (UCHT1; BD Biosciences; 1:20 dilution used), mouse TCR β-chain constant region (H57–595; BD Biosciences; 1:100 dilution used), HLA-A*02:01-E711–19 tetramer (peptide sequence YMLDLQPET, MBL; 1:20 dilution used), CD4 (SK3, Biolegend; 1:200 dilution used), CD8 (SK1, BD Biosciences; 1:100 dilution used), PD-1 (EH12.1 BD Biosciences; 1:50 dilution used), LAG-3 (REA351, Miltenyi Biotec; 1:15 dilution used), TIM-3 (7D3, BD Biosciences; 1:30 dilution used), CD45RA (HI100, Biolegend; 1:100 dilution used), CD45R0 (UCHL1, BD Biosciences; 1:50 dilution used), Ki-67 (B56, BD Biosciences; 1:20 dilution used), CCR4 (L291H4, Biolegend; 1:50 dilution used), CCR6 (G034E3, Biolegend; 1:50 dilution used) and CXCR3 (G025H7, Biolegend; 1:50 dilution used). Data were acquired with a Fortessa cytometer (BD Biosciences) and analyzed with FlowJo software (Becton, Dickinson and Co.). Analyses were gated on live, singlet, lymphocytes. T cells were identified by CD3 expression. The frequency of E7 TCR-T cells in infusion products and peripheral blood was determined by lymphocytes that expressed mouse TCR β-chain constant region and bound HLA-A*02:01-E711–19 tetramers (both were required). The gating strategy and examples are shown in Supplementary Fig. 1. Analyses of E7 TCR-T cell phenotype were performed by gating on lymphocytes that expressed both CD3 and the mouse TCR β-chain constant region. The frequency of E7 TCR-T cells was calculated with the following formula: (CD3+, mouse TCR β-chain constant region+, tetramer+ cells)/(total CD3+ cells) × 100%. E7 TCR-T cell concentration in peripheral blood was calculated with the following formula: absolute lymphocyte count × (CD3+ cells/lymphocytes) × (E7 TCR-T cells/CD3+ cells).
T cell functional assays.
T cells were isolated from PBMCs by CD14 microbead depletion (Miltenyi Biotec) followed by negative selection with a Pan T Cell isolation kit (Miltenyi Biotec). ImmunoSpot assays were performed with 20,000 effector cells and 20,000 target cells. Effector cells were T cells as described in each figure legend. Target cells were 293-A2 cells pulsed with either NY-ESO-1157–165 (irrelevant control; GenScript) or E711–19 peptide (GenScript). The 293-A2 cell line is a HEK293-based cell line with stable expression of HLA-A*02:01 that was generated in the National Cancer Institute Surgery Branch (NCI–SB) and verified for HLA-A*02:01 expression by flow cytometry33. Effector cells and target cells were co-incubated for 18 h. A FluoroSpot assay (ImmunoSpot, Cellular Technology Limited) was performed according to the manufacturer’s protocol. Blinded IFN-γ, tumor necrosis factor-α (TNF-α) and IL-2 spot counts were provided by ImmunoSpot. IFN-γ, TNF-α and IL-2 production assays were performed with 200,000 effector cells and 400,000 target cells. Target cells were 293-A2 cells pulsed with either NY-ESO-1157–165 or E711–19 peptide. Targets and effectors were co-cultured for 20 h. IFN-γ, TNF-α and IL-2 concentrations in the supernatant were determined by electrochemiluminescence immunoassays (Meso Scale Discovery (MSD)), according to the manufacturer’s specifications. Electrochemiluminescence was measured using MESO QuickPlex SQ 120 and protein concentration was calculated using Discovery Workbench 4.0 (MSD). The upper limit of quantification was 100,000 pg ml−1. Cytotoxicity assays were performed by seeding 10,000 target cells (Caski (ATCC) or 624 cell lines (NCI_SB)34) on E-Plates (Acea Biosciences). After 24 h, T cells were added in three effector-to-target (E:T) ratios: 10:1, 5:1, 1:1. Cytolysis was measured with the impedance-based xCELLigence RTCA MP Real Time Cell Analyzer (Acea Biosciences). Percent killing at 8 h was calculated using the following formula: [normalized cell index (0 h) – (normalized cell index [8 h]/normalized cell index [0 h])] × 100%.
Serum cytokine analysis.
The protein concentration in serum was determined by electrochemiluminescence immunoassay (MSD), according to the manufacturer’s specifications. The following immunoassay kits were used: MSD V-PLEX Plus Chemokine Panel 1 (Human) kit, MSD V-PLEX Plus Cytokine Panel 1 (Human) kit, MSD V-PLEX Plus Proinflammatory Panel 1 (Human) kit and TH17 Panel 1 (Human) kit. Electrochemiluminescence was measured using a MESO QuickPlex SQ 120 instrument and protein concentration was calculated using a Discovery Workbench 4.0 (MSD). The upper limit of quantification was 100,000 pg ml−1.
Immunogenicity assay.
E7 TCR or mock transduced Jurkat cells (ATCC) were cultured with patient serum. Anti-TCR antibodies were detected by labeling with anti-human IgG (Dianova) followed by flow cytometric analysis. The sensitivity for the assay was 10 ng ml−1 based on testing with a surrogate positive control antibody (hamster anti-mouse TCR beta; Bio-Rad). The background negative reading for the assay was determined by testing 40 disease-matched samples (patients with HPV-associated tumors).
Fluorescent microscopy studies.
E7 TCR-T cells were detected in biopsy samples by staining 5-μm FFPE tumor sections with RNAscope probes (Advanced Cell Diagnostics (ACD)) that target mouse TCR α-chain constant region (mTRAC) mRNA (559508, ACD) and HPV-16 E7 mRNA (463468-C2, ACD), followed by staining with CD3 protein (MCA1477; Bio-Rad) by immunohistochemistry. Biopsy sections were stained using the RNAscope LS Multiplex Fluorescent Assay kit (322800, ACD) and with the Bond RX auto-stainer (Leica Biosystems). Tissues were pre-treated for 15 min at 100 °C with Bond Epitope Retrieval Solution 2 (Leica Biosystems). TSA-Cyanine 3 Plus (for mTRAC) and TSA-Cyanine 5 Plus (for HPV-16 E7; Perkin Elmer) were used at a 1:750 dilution. To confirm that the mTRAC mRNA expression colocalized with T cells, sections where subsequently stained with a CD3 antibody (MCA1477; Bio-Rad) at a 1:100 dilution for 1 h, followed by IgG secondary antibody (BA-4001, 1:100 dilution; Vector Laboratories) using the Bond Polymer Refine Kit specifications (Leica Biosystems) but without 3,3′-diaminobenzidine and hematoxylin. Antibody binding was detected by staining with an anti-horseradish peroxidase antibody conjugated with Alexa 488 (123-545-021; Jackson ImmunoResearch Laboratories) for 30 min (13.6 μg ml−1 dilution). As a negative control, the RNAscope 3-plex LS multiplex negative control probe (Bacillus subtilis dihydrodipicolinate reductase (dapB) gene) (320878, ACD) was used to stain patient biopsy sections followed by an IgG1 isotype antibody (559072, 1:50 dilution, BD Pharmingen). The fluorescent images were taken on a Zeiss LSM 880 NLO laser scanning microscope. The images were acquired and analyzed with ZEN imaging software (Zeiss). Pseudo coloring was performed with the ZEN software.
Genomic and transcriptomic studies.
Sequencing.
Genomic and transcriptomic studies were performed on microdissected tumor specimens. Gene sets for pathways analysis were from the Ingenuity Pathway Analysis database version Summer Release 2018 (Qiagen, Supplementary Table 3). Sequencing data were acquired at Covance. Pathologist-guided tumor microdissection was performed on OCT/FFPE-embedded biopsies or resected tissues. DNA was extracted with QiAmp for DNA (Qiagen). RNA was extracted with RNeasy (Qiagen). Sample quality control was tested with BioAnalyzer and RiboGreen. cDNA was generated with a cDNA reverse transcription kit (Thermo Fisher Scientific). TruSeq RNA Exome polymerase chain reaction (PCR) was run on the Bio-Rad Tetrad 2 platform (10 cycles for final amplification). WES libraries were made using KAPA HyperPrep (Roche) and Agilent SureSelectXT2 Human All Exon V6 set probes. An Illumina RNA Exome kit was used for RNA-seq. Sequencing was performed with the HiSeq 2500 platform (Illumina).
Whole exome sequencing and variant calling.
WES data were processed with the CCR Collaborative Bioinformatics Resource (CCBR) in-house pipeline (https://github.com/CCBR/Pipeliner). Trimming of low-quality reads and adaptors was accomplished with Trimmomatic v0.36 with the following parameter settings: Leading:10; Trailing:10; Sliding window:4:20; Minlen:20. BWA-mem v0.7.15 was used to map reads to the hs37d5 reference genome (with decoys) using default parameter settings35. The resulting binary alignment map (BAM) files were sorted using SAMtools v1.317 and PCR duplicates were marked using Picard v2.1.1 (https://broadinstitute.github.io/picard/). Realignment around insertions and deletions (INDELs) and base recalibration was performed using the Genome Analysis Toolkit v.3.4 (GATK, Broad Institute) following the GATK Best Practices. For somatic single nucleotide polymorphism (SNP) detection, four callers were used (MuTect (v1.1.7), MuTect2 (within GATK v. 3.8–0), Strelka (v2.9.0) and Vardict (v1.4)) with two-sided paired tumor/normal and run in high confidence mode, where possible. Variants called by at least one of the callers were kept for further analysis, and the same four callers were used for somatic INDEL detection. Detected variants were verified by visualizing WES reads at each locus in the Integrative Genomics Viewer (IGV 2.4.16, http://software.broadinstitute.org/software/igv/). Nonsynonymous mutations were analyzed for functional significance with three in silico protein variant tools: Polymorphism Phenotyping v2, Sorting Intolerant from Tolerant, and Mutation Taster (http://www.mutationtaster.org/). A mutation was considered damaging if the mutation was predicted to be harmful by at least two of the three protein analysis tools. For germline SNP and small INDEL calling, the HaplotypeCaller from the GATK package was used. For copy number analysis, Control-FREEC (v11.5) was used and conditioned on the ploidy and cellularity estimates from Sequenza (sequenza-utils v. 2.2 and Sequenza R package v. 3.0). Copy loss was defined as copy number less than ploidy with a significant P value by Kolmogorov–Smirnov test and Wilcoxon rank-sum test. The transcribed and non-transcribed regions were defined based on Ensembl v91.
RNA-seq analysis.
RNA-seq expression data were processed using the CCBR in-house utility (https://github.com/CCBR/Pipeliner). Briefly, reads were trimmed of low-quality bases and adapter sequences were removed using Trimmomatic v0.33. Mapping of reads to the GRCh37 (hg19) reference genome was performed using STAR v2.5.2b in 2-pass mode. RSEM v1.3.0 was then used to quantify gene-level expression, with counts normalized to library size as counts per million. Finally, limma-voom v3.34.5 was used for quantile normalization and differential expression. Control tumor samples were sequenced with each batch and were assessed for batch effects using both limma (v3.38.3) and ComBat (package sba v3.32.1). It was determined that no batch correction was necessary. Expression levels were compared between patients after conversion to units of transcripts per million. Expression of each gene is relative to the average expression of that gene in all samples.
Statistical analysis.
For continuous variables, the median and range are presented. For categorical variables, the number of patients in each category is given. The significance of differences in values between time points was tested with paired t-tests (Wilcoxon signed rank test for non-parametric data). Tests for correlation between engraftment of E7 TCR-T cells and cell dose were with carried out with one-way ANOVA. Tests for correlation of E7 TCR-T cell engraftment and peripheral blood T cell reactivity against E7 were performed with Spearman’s rank correlation. P < 0.05 was considered significant. Use of other statistical tests is indicated in each figure legend.
Reporting Summary.
Further information on research design is available in the Nature Research Reporting Summary linked to this article.
Extended Data
Extended Data Fig. 1 |.
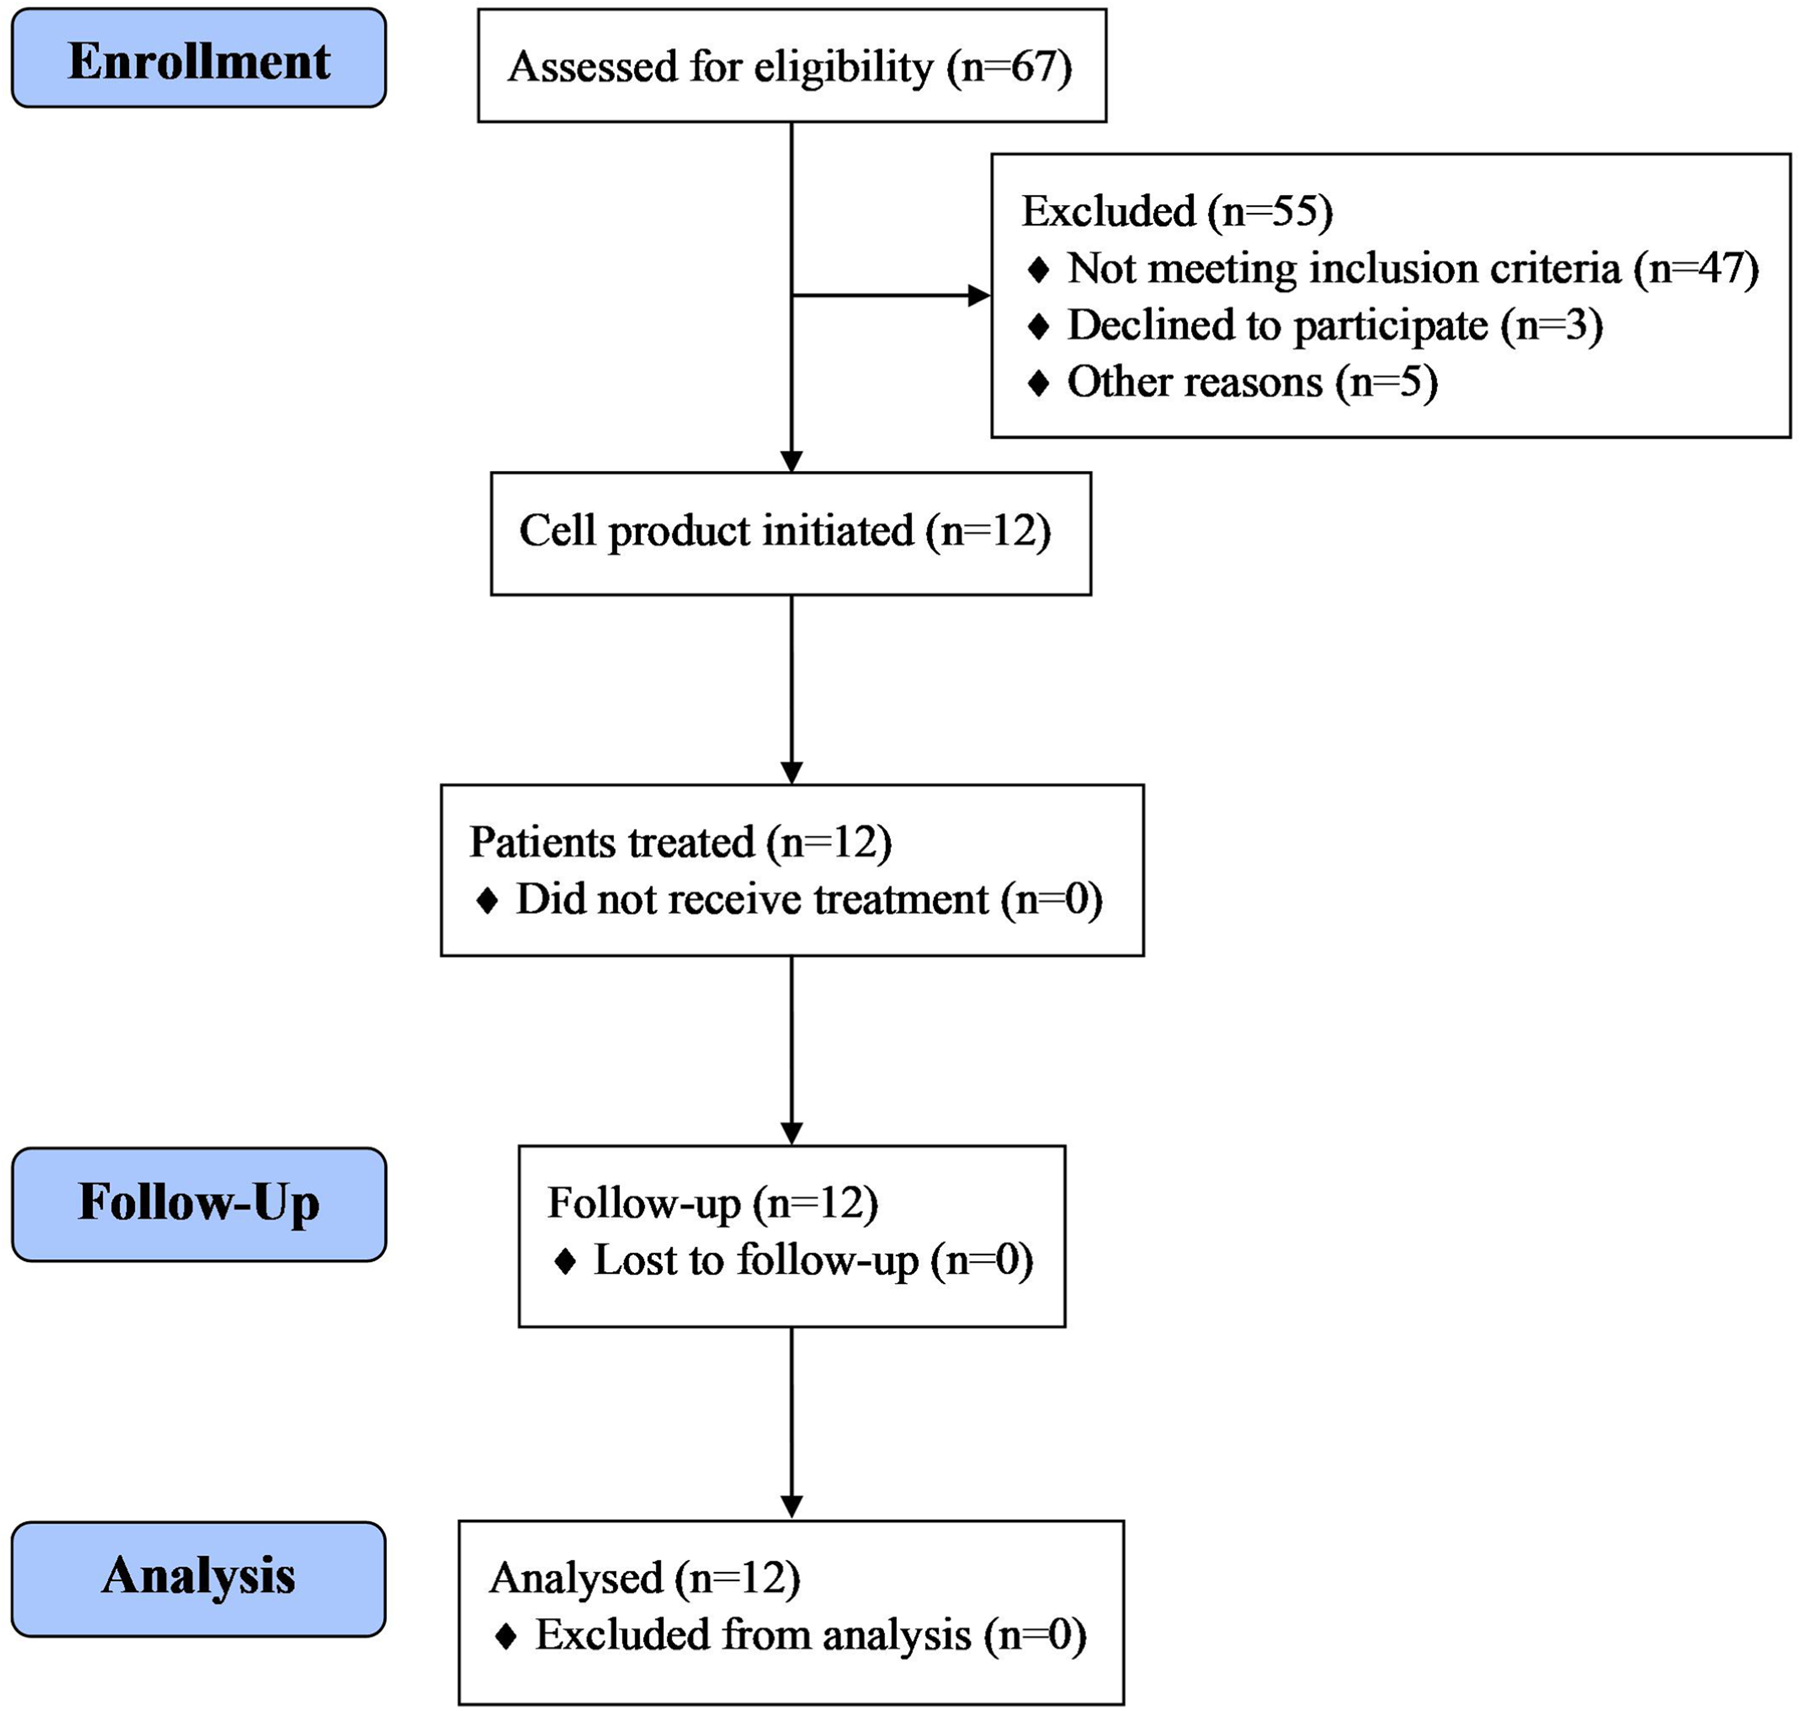
CONSORT flow diagram.
Extended Data Fig. 2 |. Durable, complete regression of multiple index and non-index tumors.
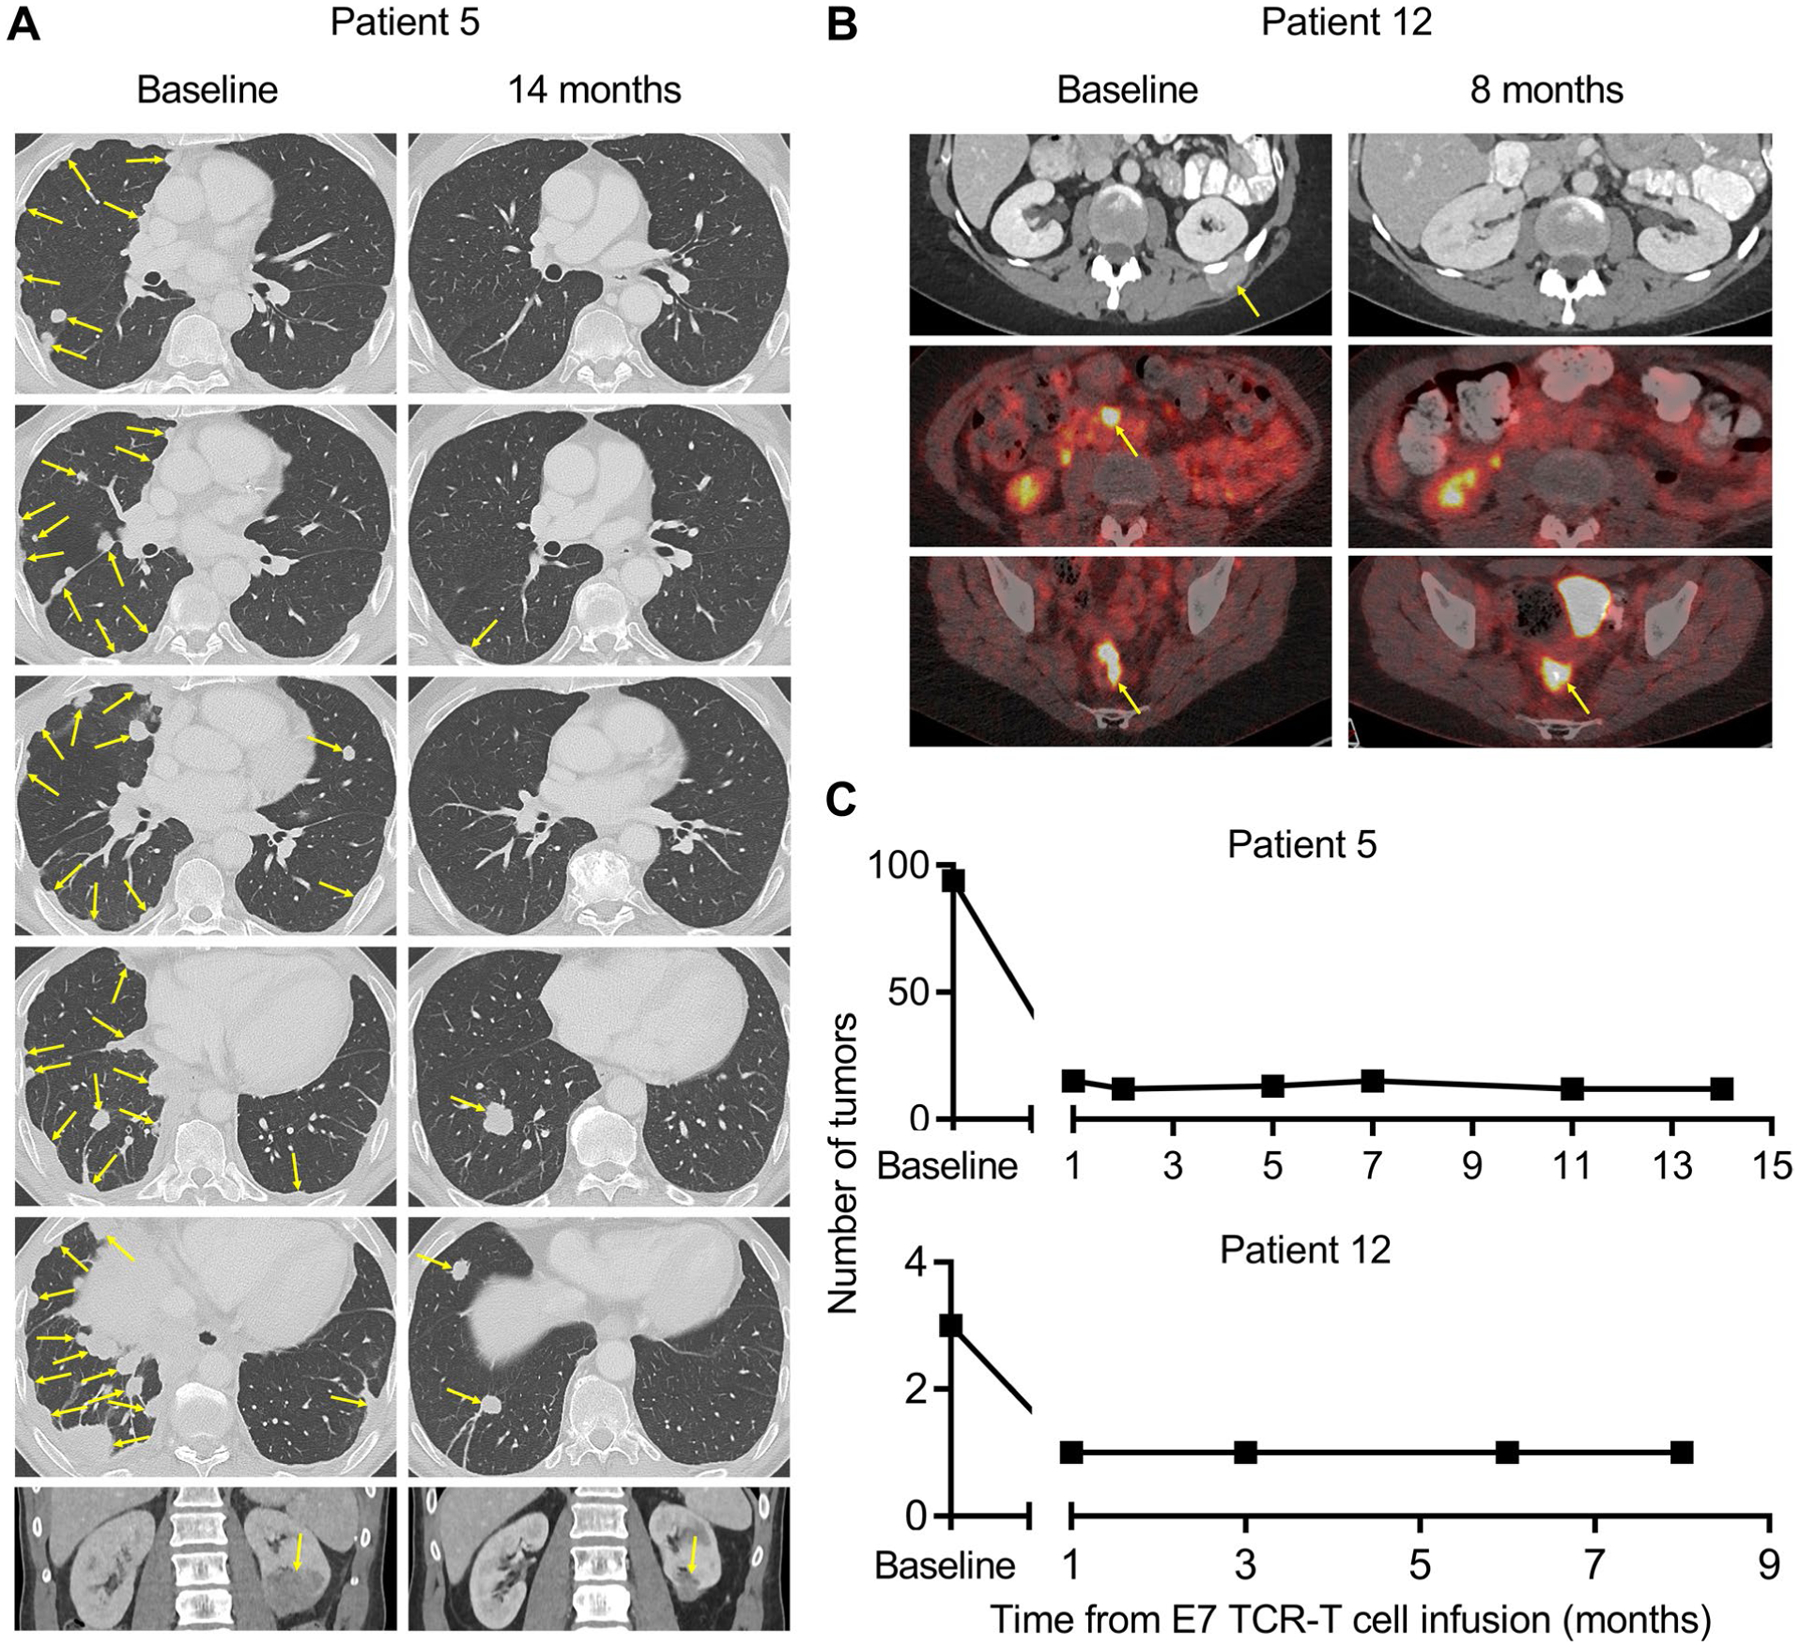
Radiographic imaging studies from Patient 5 and Patient 12. a, For Patient 5, computed tomography (CT) scans are shown. b, For Patient 12, the top row are CT scans and the middle and bottom rows are positron emission tomography-CT scans. The timepoint for the scans is indicated above each column. Yellow arrows indicate tumors. c, The number of discrete tumors present at baseline and serial timepoints after treatment are shown.
Extended Data Fig. 3 |. Peripheral blood engraftment of E7 TCR-T cells in Patient 12 at late time points.
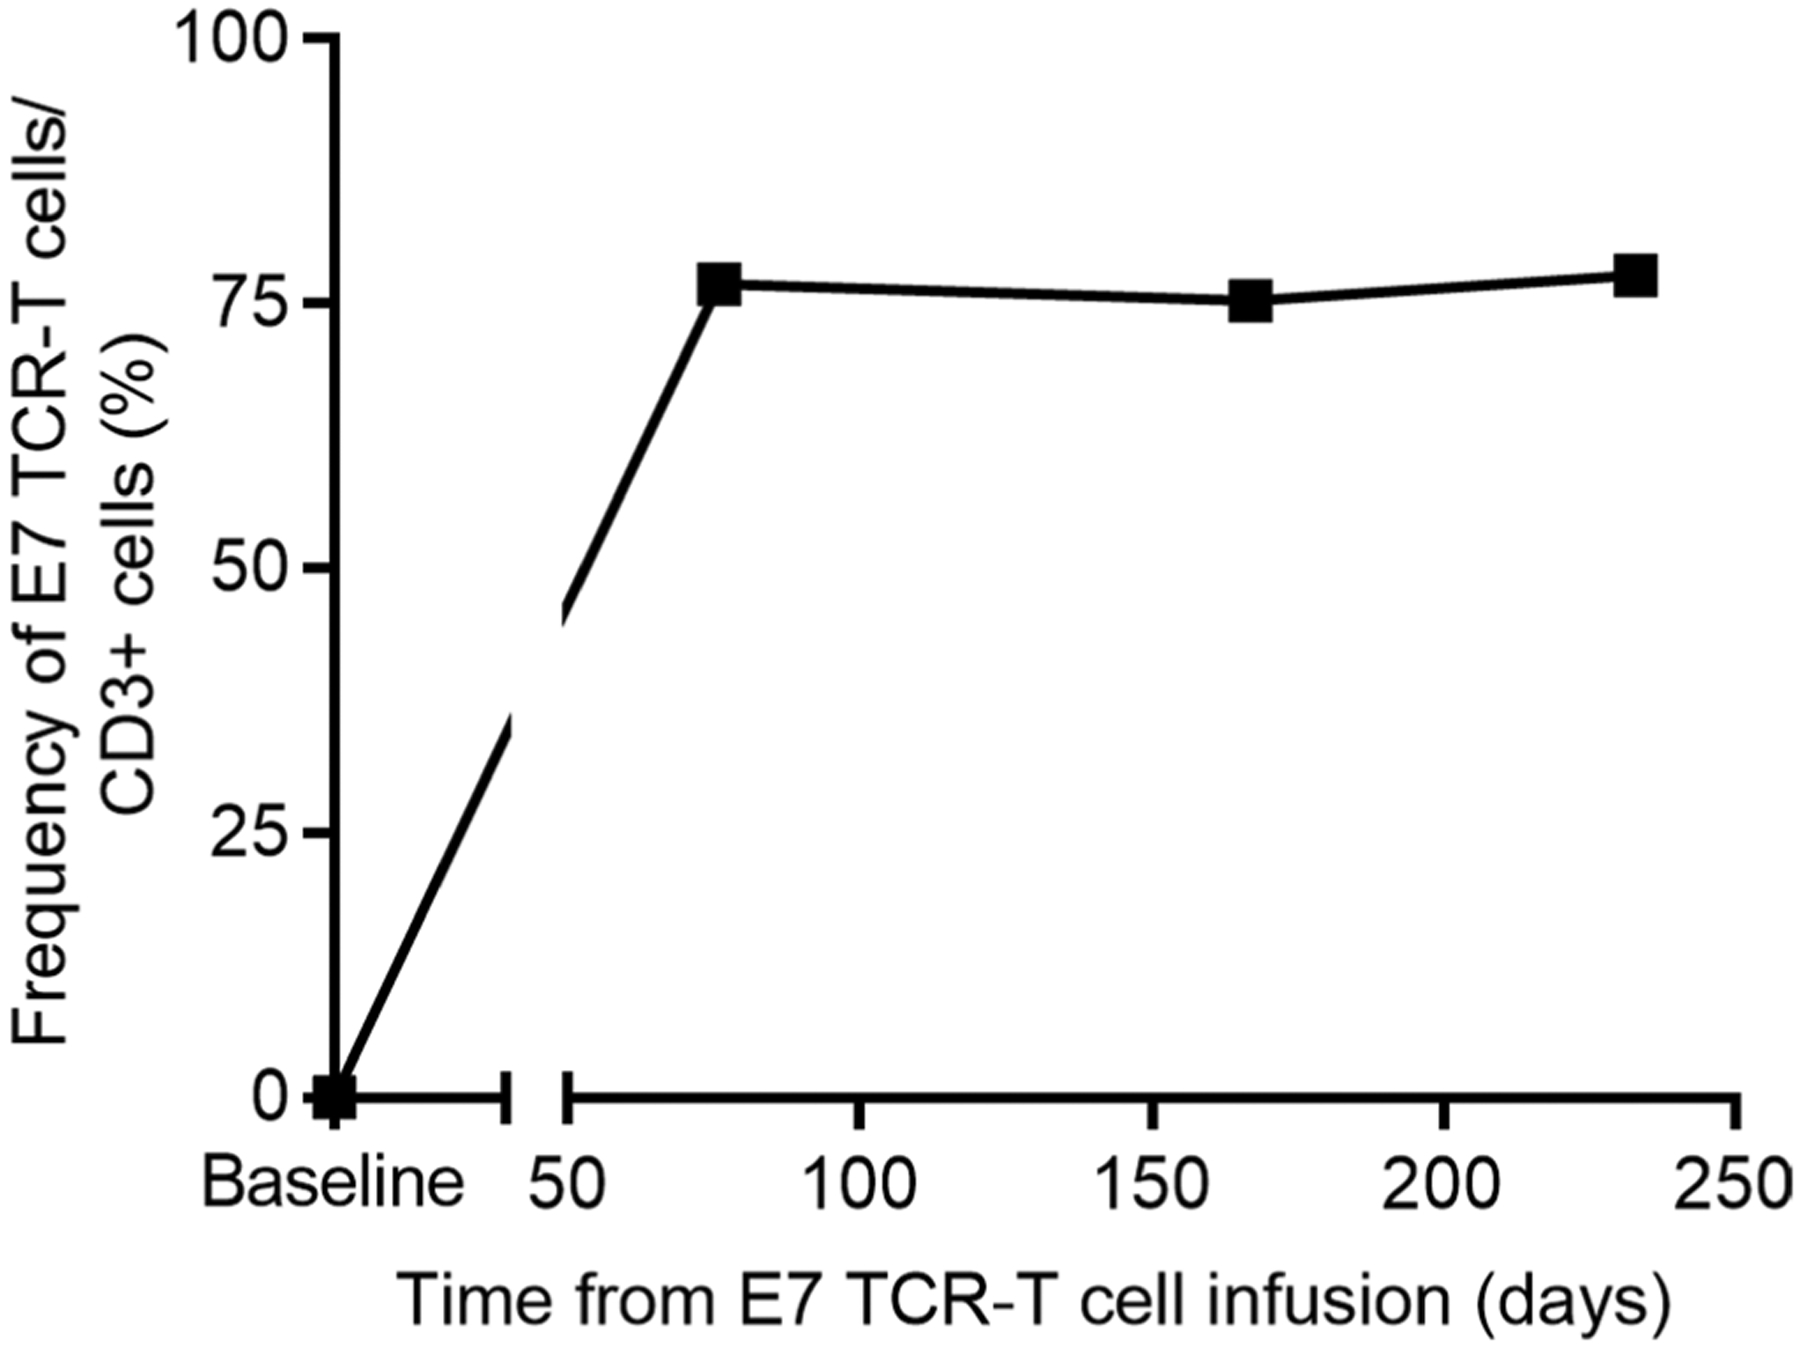
The frequency of E7 TCR-T cells in the peripheral blood of Patient 12 at late time points after treatment is graphed.
Extended Data Fig. 4 |. Peripheral blood engraftment of E7 TCR-T cells.
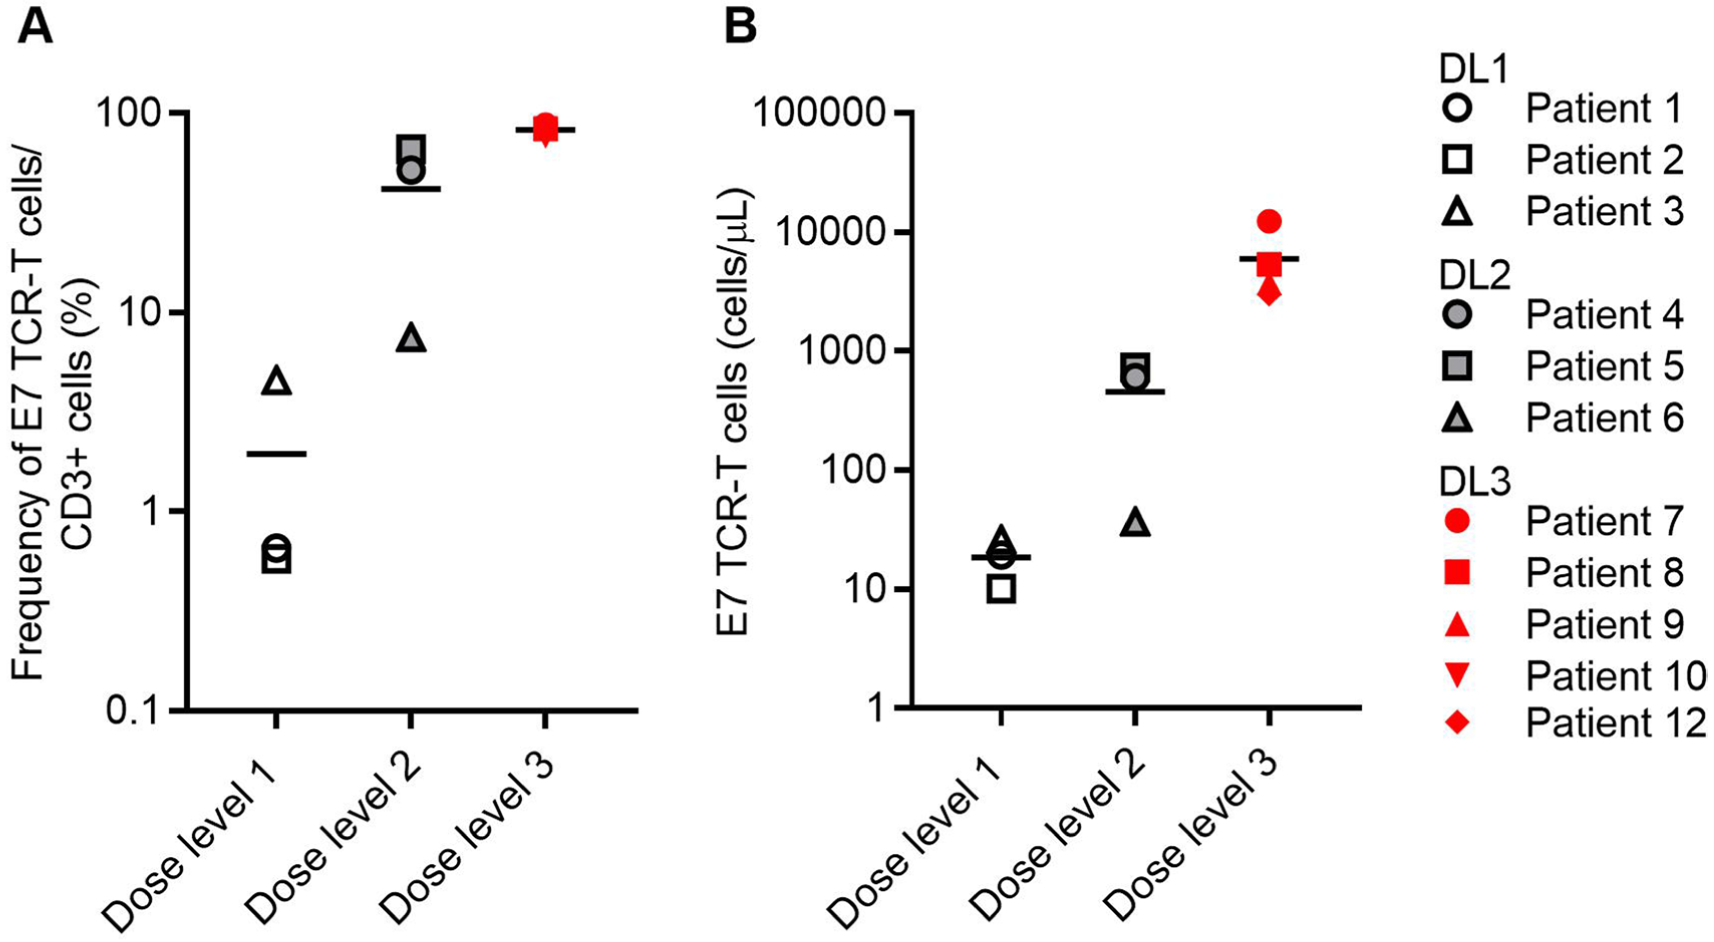
Flow cytometry was used to determine engraftment of E7 TCR-T cells in the peripheral blood of patients at the first response assessment timepoint (6 weeks). a, The frequency of E7 TCR-T cells in peripheral blood correlated with dose (P = 0.0006, Kruskal-Wallis one-way ANOVA) but not with response (P = 0.347, two-sided unpaired t-test). b, The concentration of E7 TCR-T cells in peripheral blood correlated with dose (P = 0.0226, one-way ANOVA) but not with response (P = 0.4796, two-sided unpaired t-test).
Extended Data Fig. 5 |. Serum antibodies against E7 TCR-T cells.
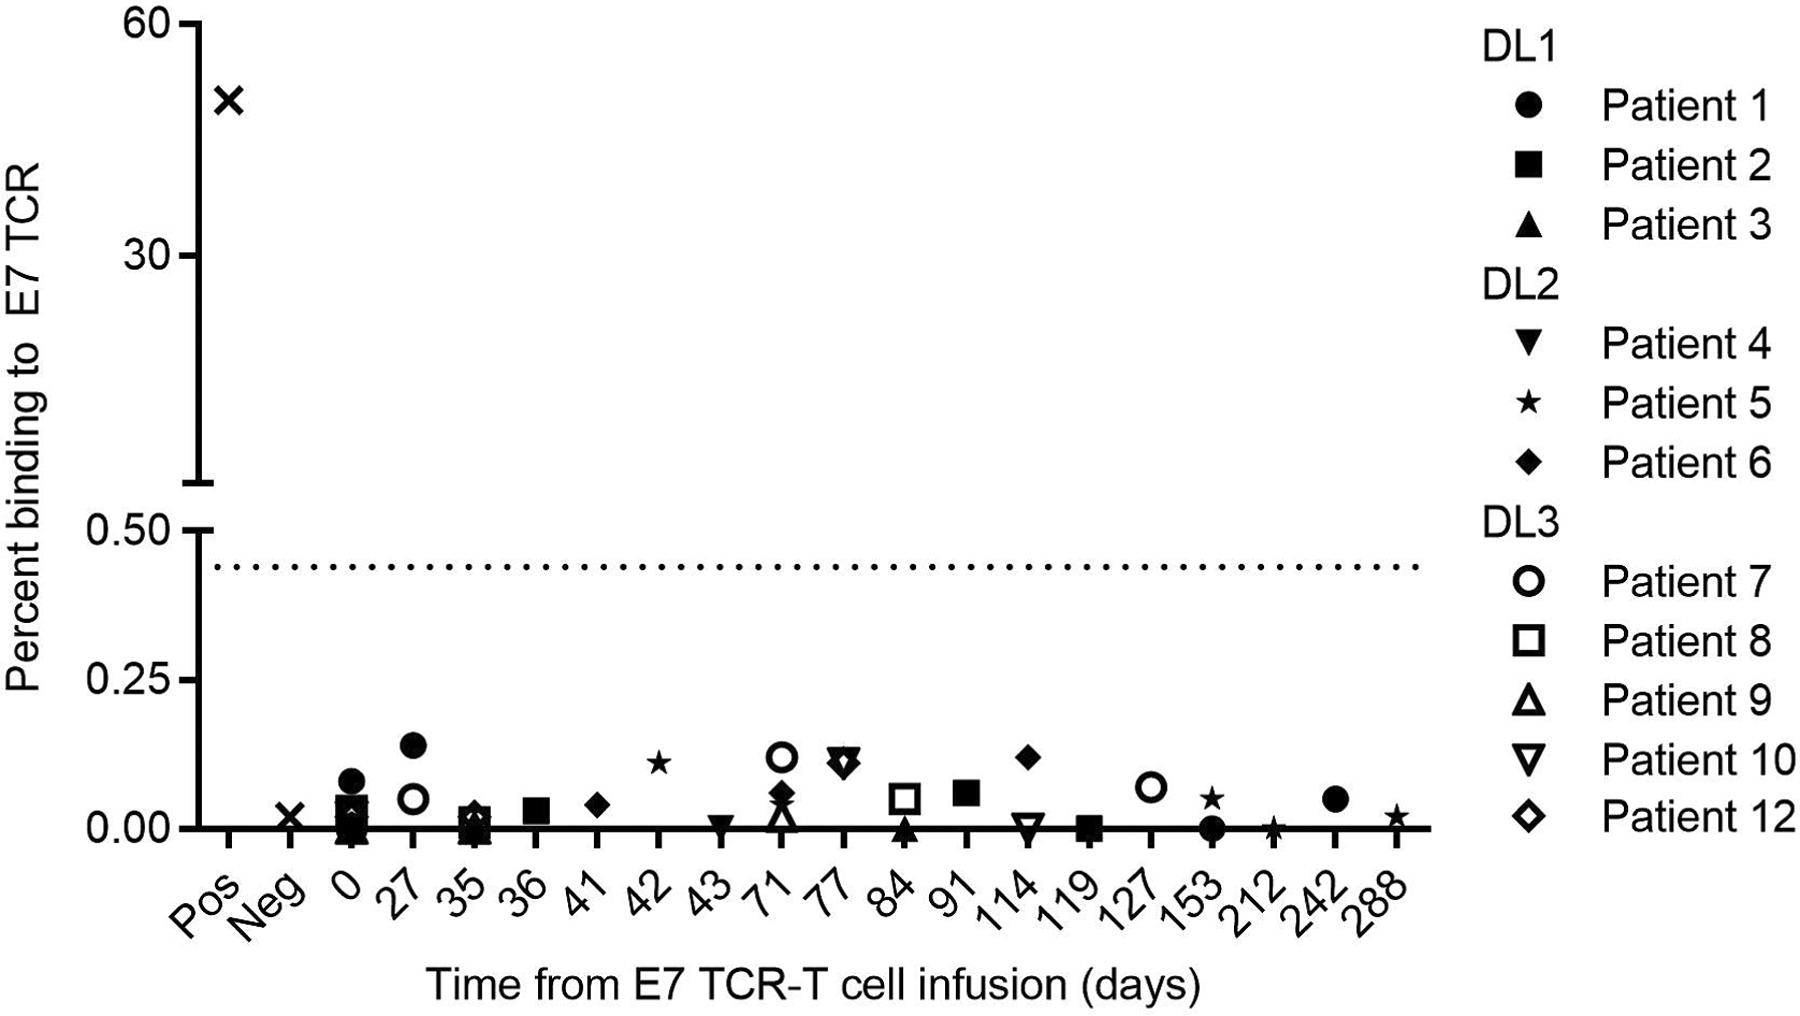
The dotted line indicates the background detection level. Hamster anti-mouse TCR antibody was used as a positive control (Pos). Healthy donor serum was used as the negative control (Neg).
Extended Data Fig. 6 |. Infusion product phenotypic characterization.
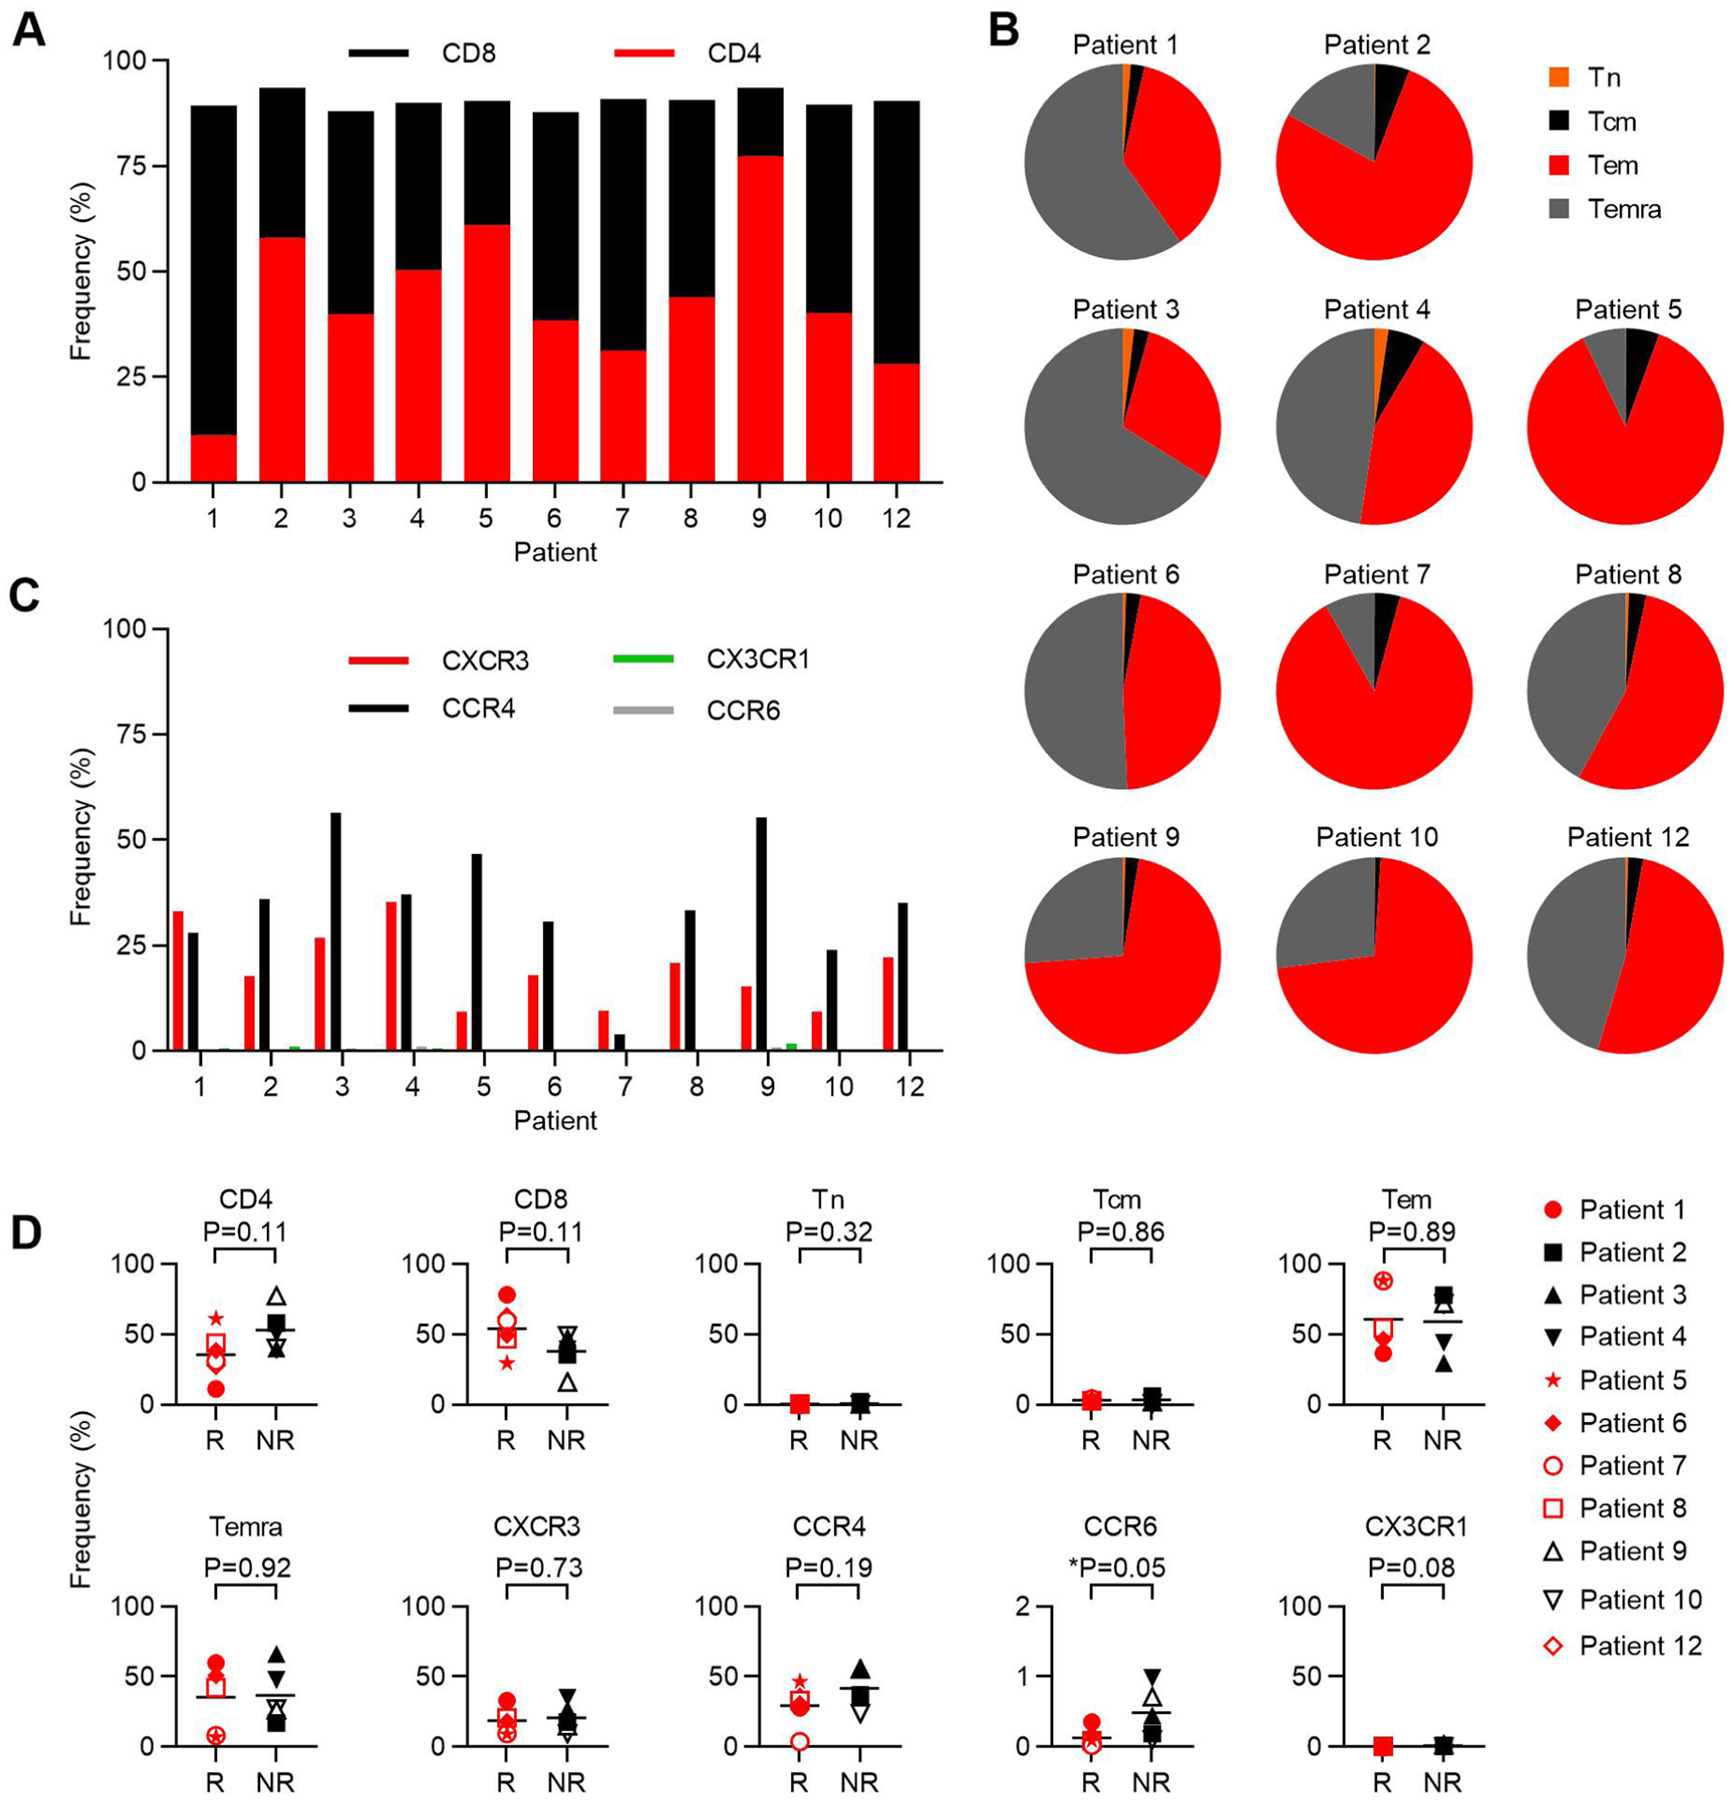
The expression of cell surface antigens by E7 TCR-T cells was determined by flow cytometry. a, Stacked bar graph of the frequency of single-positive CD4 and CD8 T cells. b, Pie chart that depict memory T cell subset composition. Tn (naïve, CD45RA+CCR7+), Tcm (central memory, CD45RA−CCR7+), Tem (effector memory, CD45RA−CCR7−), Temra (effector memory RA+, CD45RA+CCR7−). c, Bar graph of the frequency of expression of the chemokine receptors in the symbol legend. d, The frequency of each marker or subset in the E7 TCR-T cells administered to patients who responded (R) or did not respond (NR) to treatment. P-values are two-sided unpaired t-tests.
Extended Data Fig. 7 |. Phenotype of engrafted peripheral blood E7 TCR-T cells.
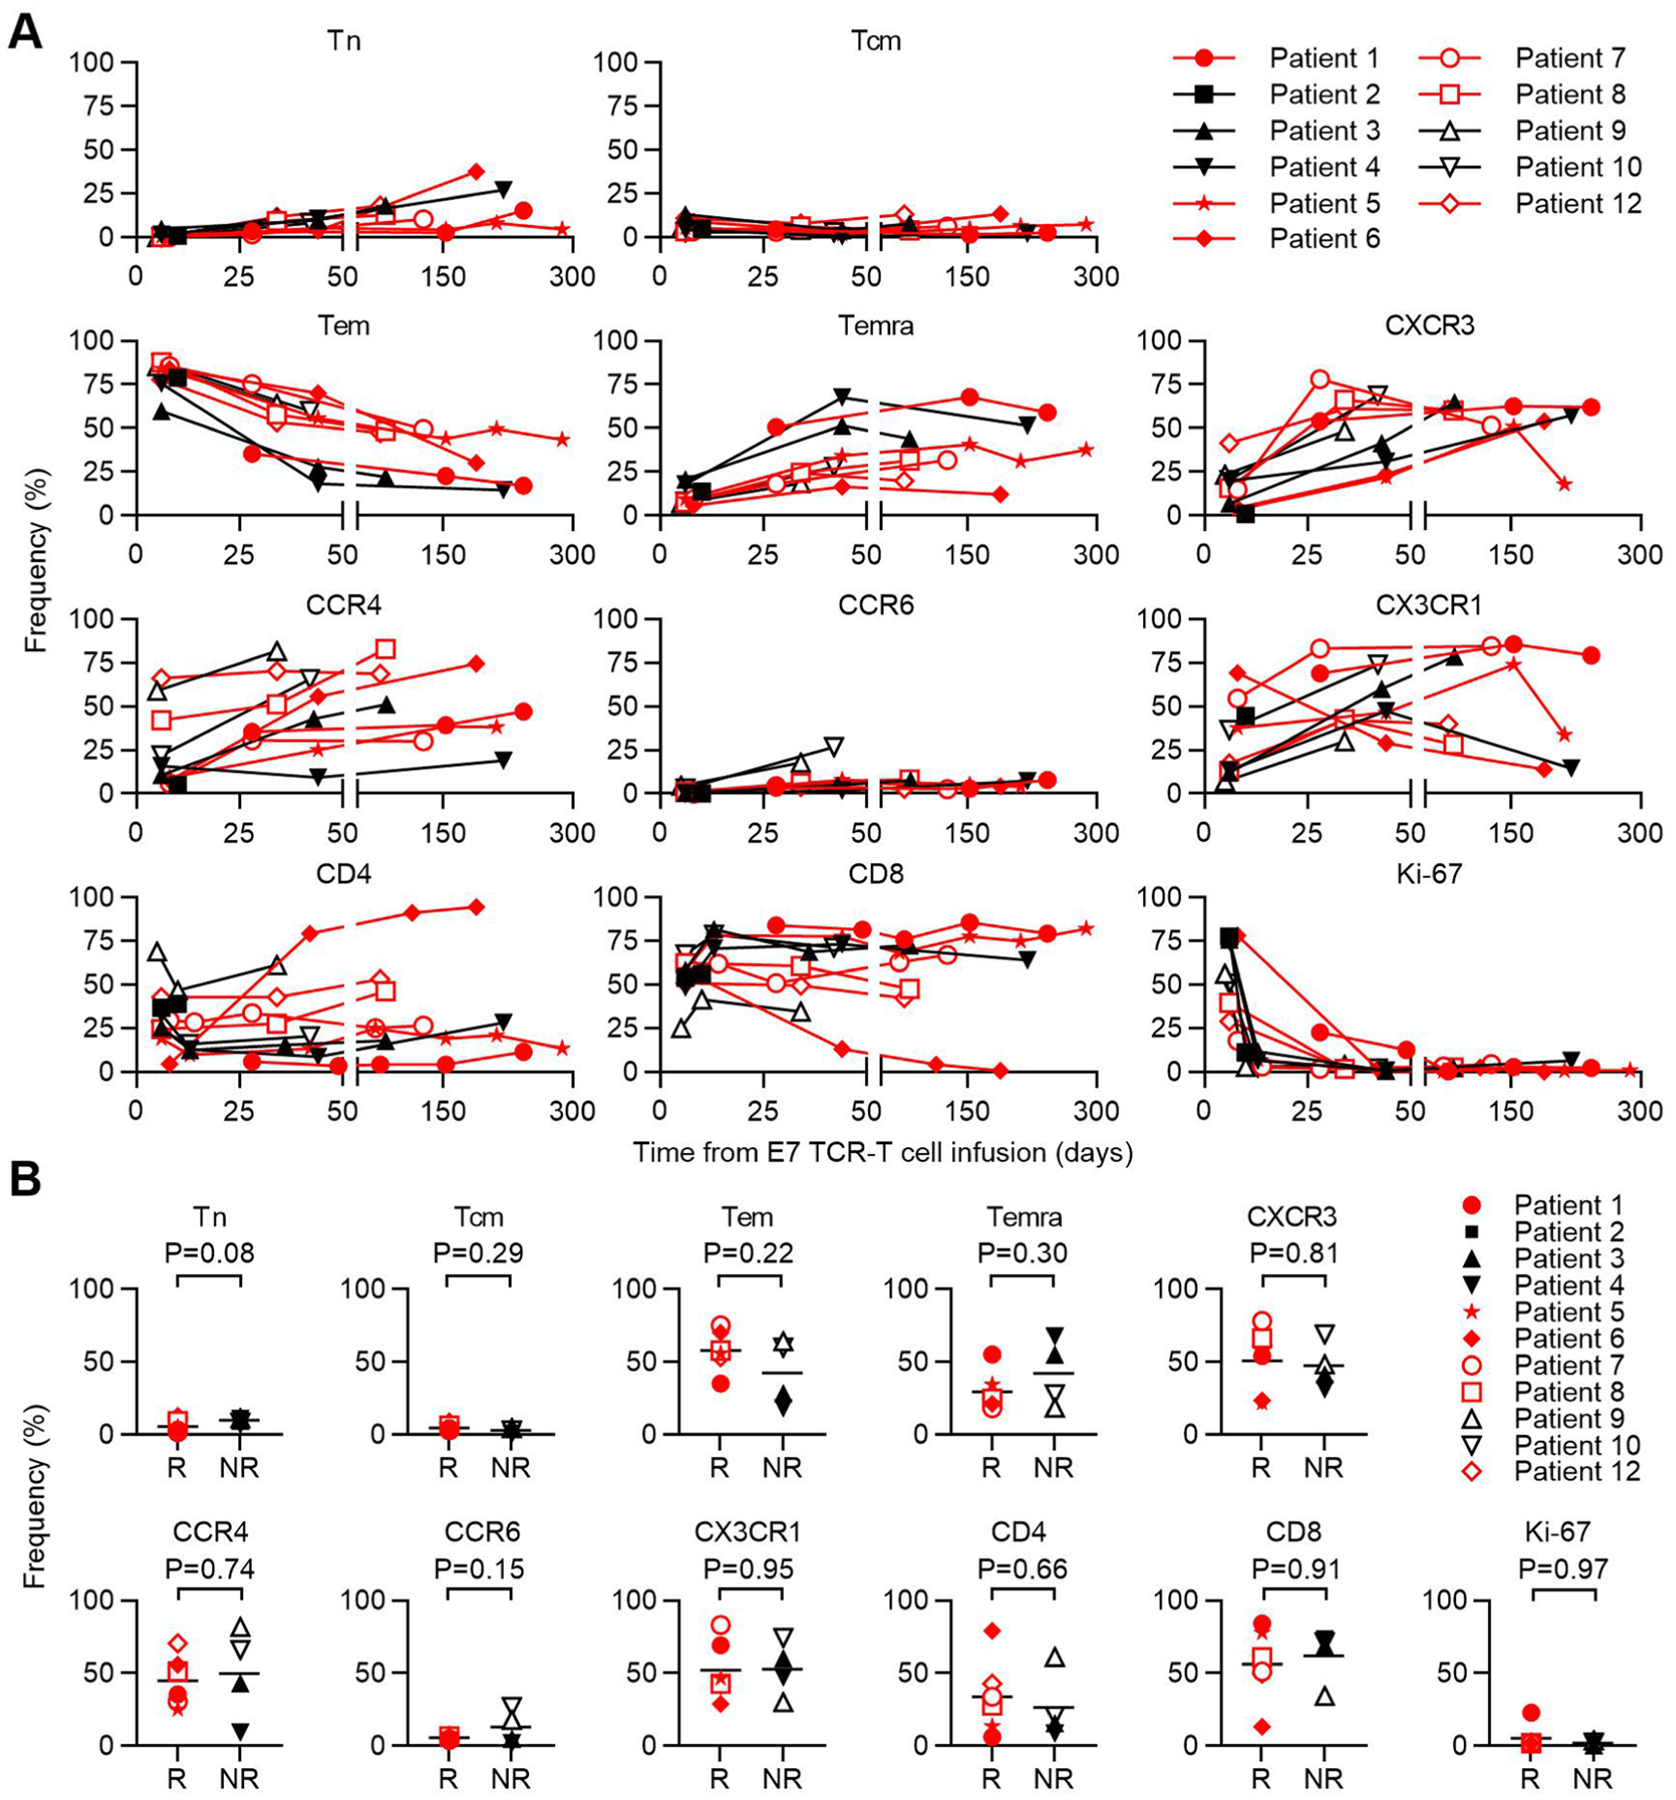
a, Flow cytometric analysis of memory T cell subsets, chemokine receptors, CD4/CD8 T cell subsets, and Ki-67 expression by engrafted E7 TCR-T cells is shown. The T cell subset or phenotypic marker is indicated above each graph. Gating is on CD3+, mTCRB+, live, lymphocytes. CD4 and CD8 frequencies are for single positive cells. Tn (naïve, CD45RA+CCR7+), Tcm (central memory, CD45RA−CCR7+), Tem (effector memory, CD45RA−CCR7−), Temra (effector memory RA+, CD45RA+CCR7−). b, Phenotype at first response assessment (6 weeks) of engrafted E7 TCR-T cells in patients who responded (R) or did not respond (NR) to treatment. The T cell subset or phenotypic marker is indicated above each graph. Red symbols represent patients with tumor responses. P-values are from two-sided unpaired t-tests.
Extended Data Fig. 8 |. Infusion product functional characterization.
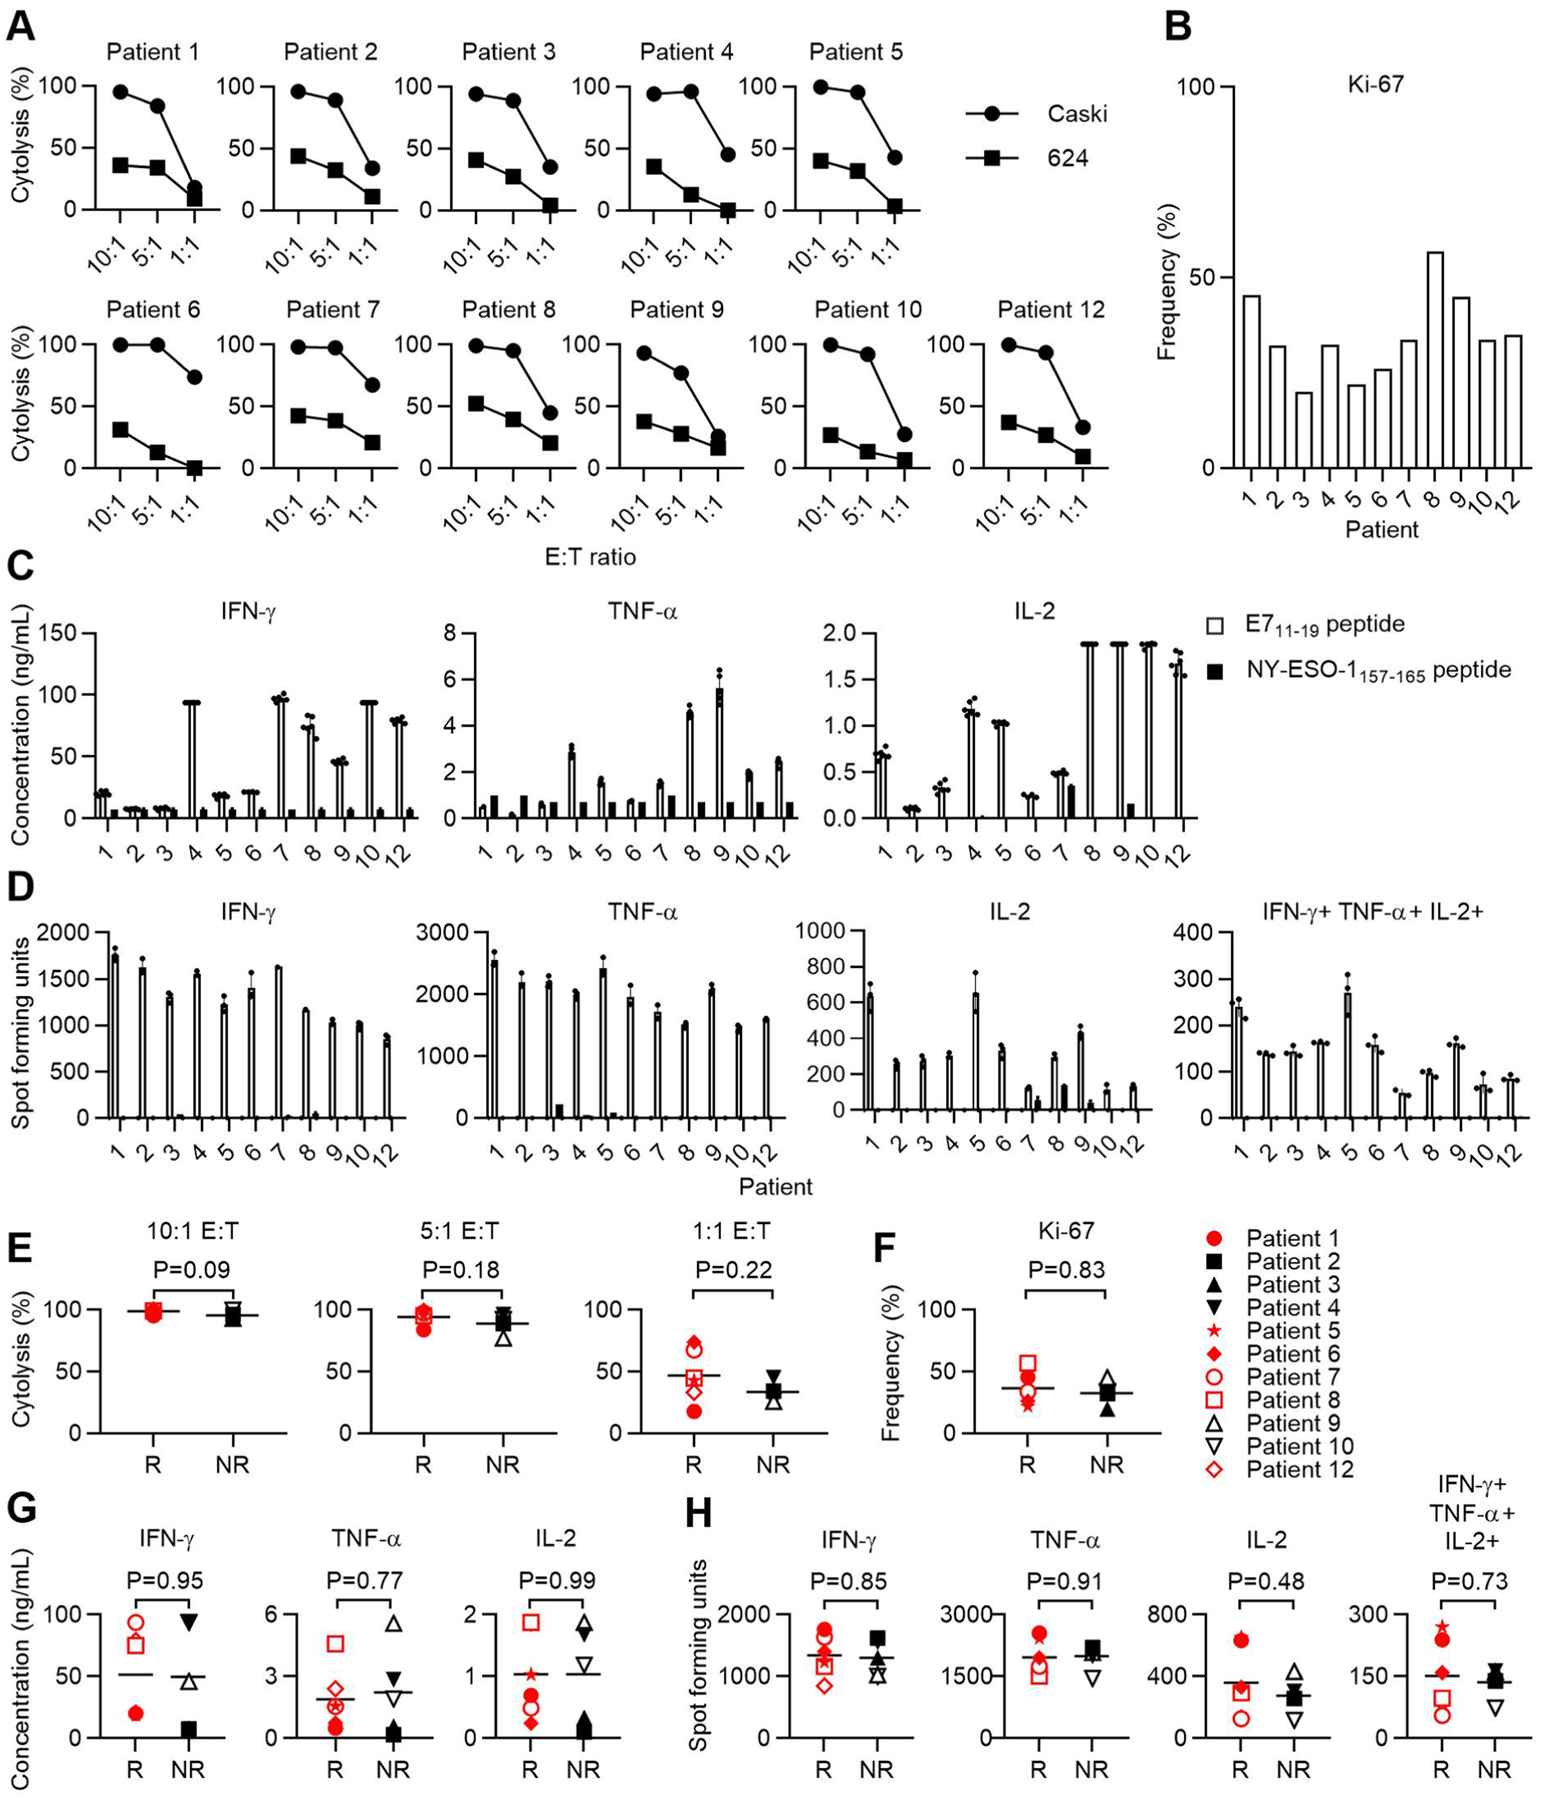
a, Percent cell killing at 8 hours as measured by impedance-based cytolysis assay. The effector to target ratio (E:T) is indicated on the x-axis. The target cell is indicated in the symbol legend. Error bars represent the standard deviation of 2–5 technical replicates. CaSki is HLA-A*02:01+ HPV-16+. 624 is HLA-A*02:01+ HPV-16−. b, The frequency of transduced cells that expressed Ki-67 as determined by flow cytometry. c, Cytokine production following coculture of the infusion product from the patient indicated in the graph title with 293-A2 cells pulsed with the target peptide indicated in the symbol legend. Error bars represent the standard deviation of 2–3 independent experiments (with 2 technical replicates in each experiment); all replicates are shown. d, ELISPOT assay measurement of cytokine-secreting cells in the infusion product. The cytokine measured is indicated by the graph title. The target cells and symbol legend are the same as in panel C. 2 independent experiments are shown. e-h, Functional characteristics of the infusion products administered to patients who responded (R) or did not respond (NR) to treatment. P-values are two-sided unpaired t-tests.
Extended Data Fig. 9 |. Serum cytokines and chemokines following E7 TCR-T cell infusion.
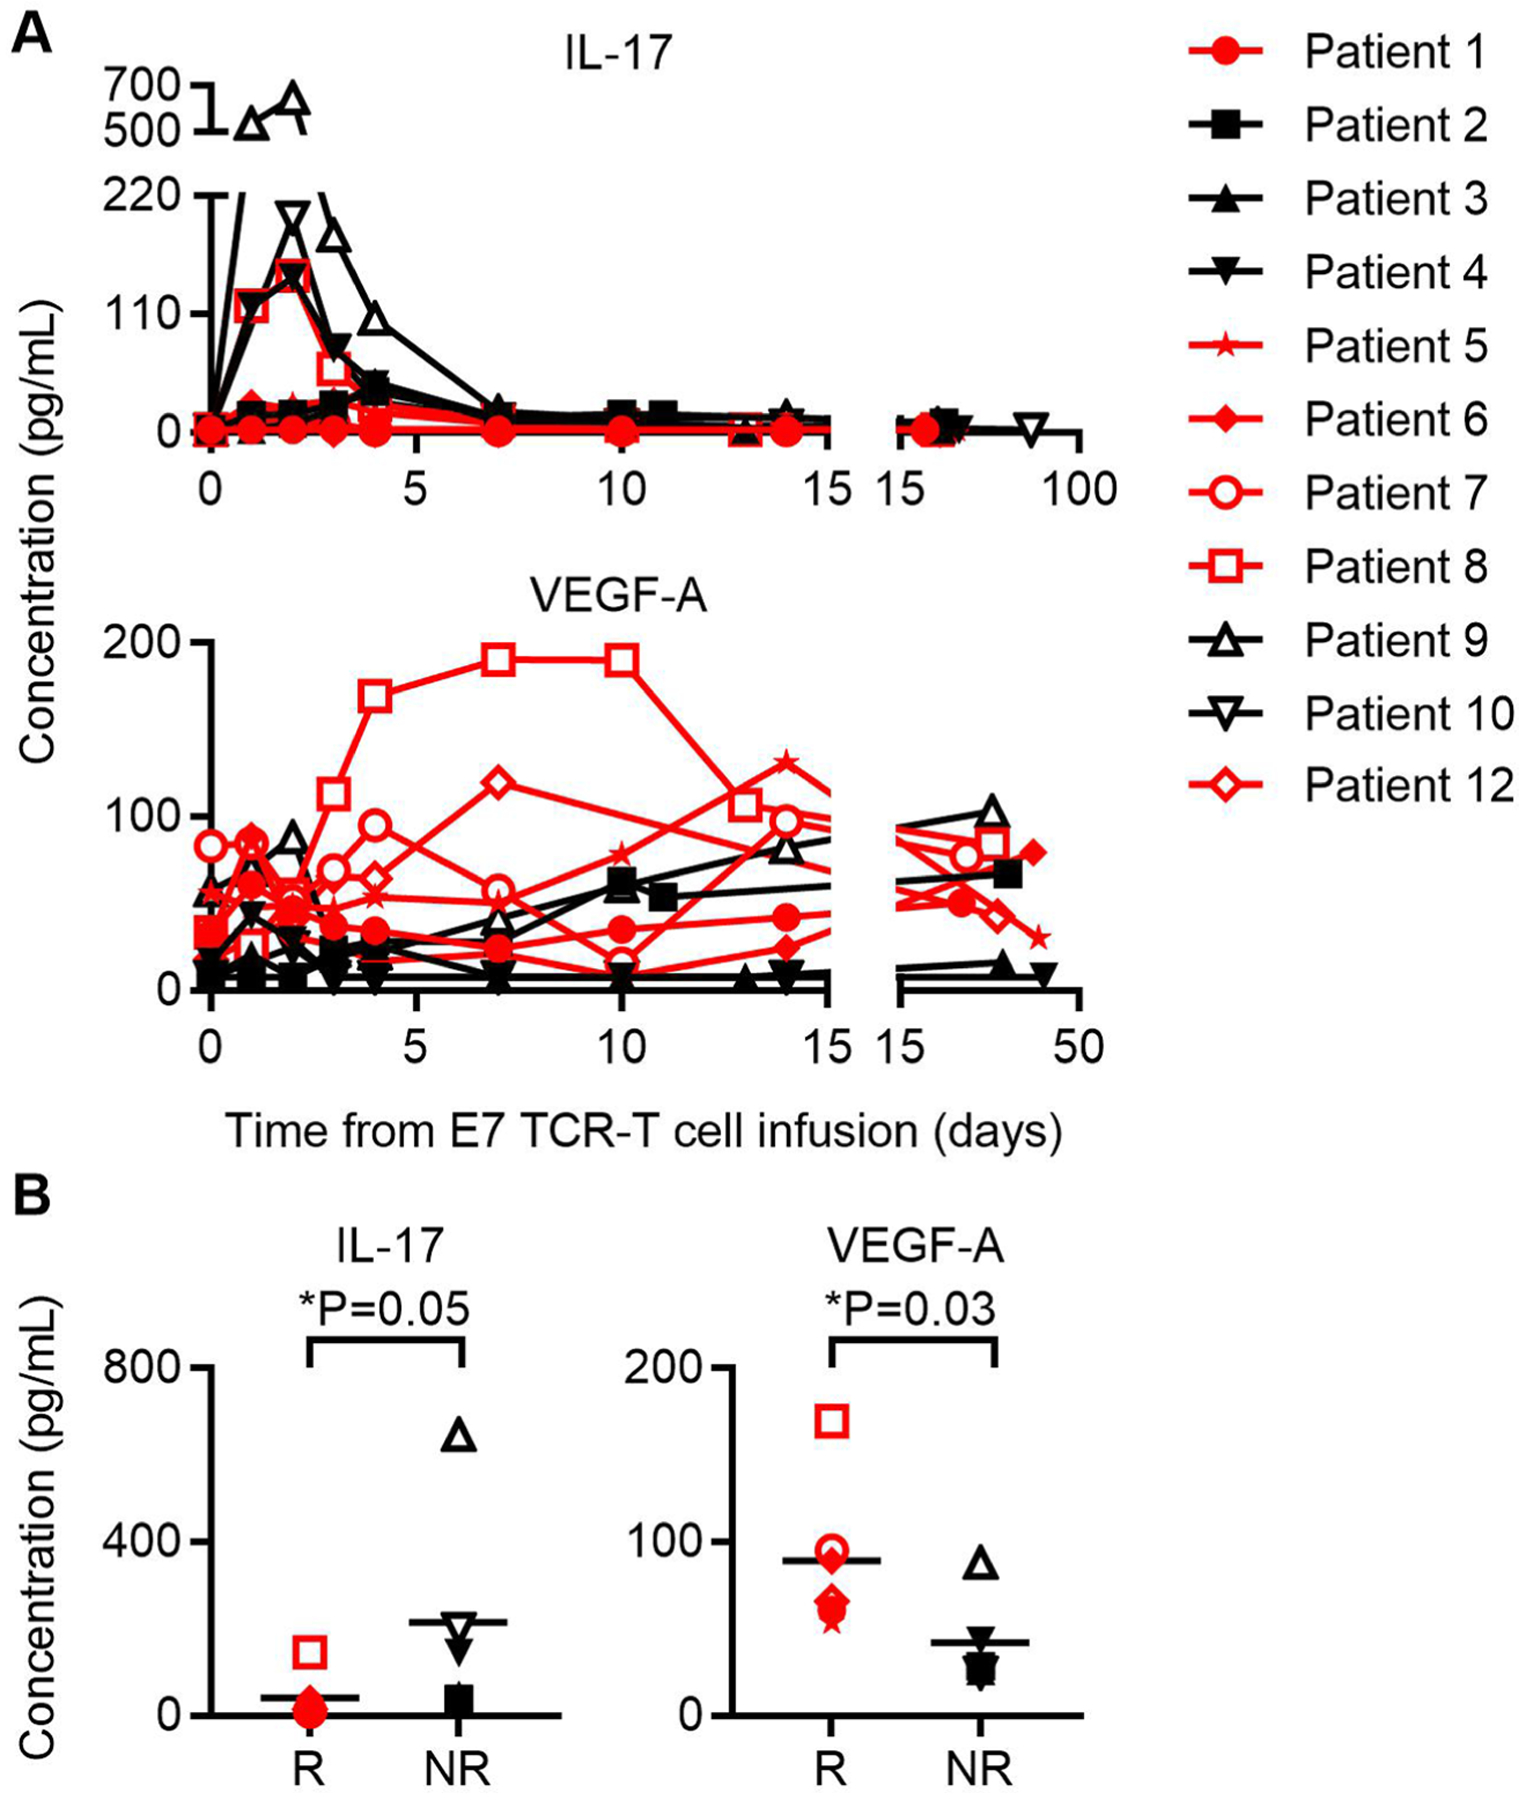
Serum concentrations of IL-1α, IL-1β, IL-4, IL-5, IL-6, IL-7, IL-8, IL-10, IL-12/23 p40, IL-12 p70, IL-13, IL-15, IL-16, IL-17A, IL-21, IL-22, IL-23, IL-27, IL-31, IFNγ, TNFα, TNFβ, GMCSF, VEGF-A, Eotaxin, Eotaxin-3, CXCL10, MCP-1, MCP-4, MIP-1α, MIP-1β, TARC, and MIP-3α were determined. Chemokines and cytokines for which the peak values were significantly different between responding and non-responding patients are shown. a, Graph of serum IL-17 and VEGF-A concentrations in patients indicated in symbol legend at the time points indicated on the x-axis. Red color indicates patients with tumor responses. b, Peak IL-17 and VEGF-A serum concentrations in patients who responded (R) or who did not respond (NR) to treatment. The symbol legend is shown in panel A. Statistical significance was determined by a two-sided unpaired t-test.
Extended Data Fig. 10 |. Infiltration of tumor biopsy specimens with E7 TCR-T cells.
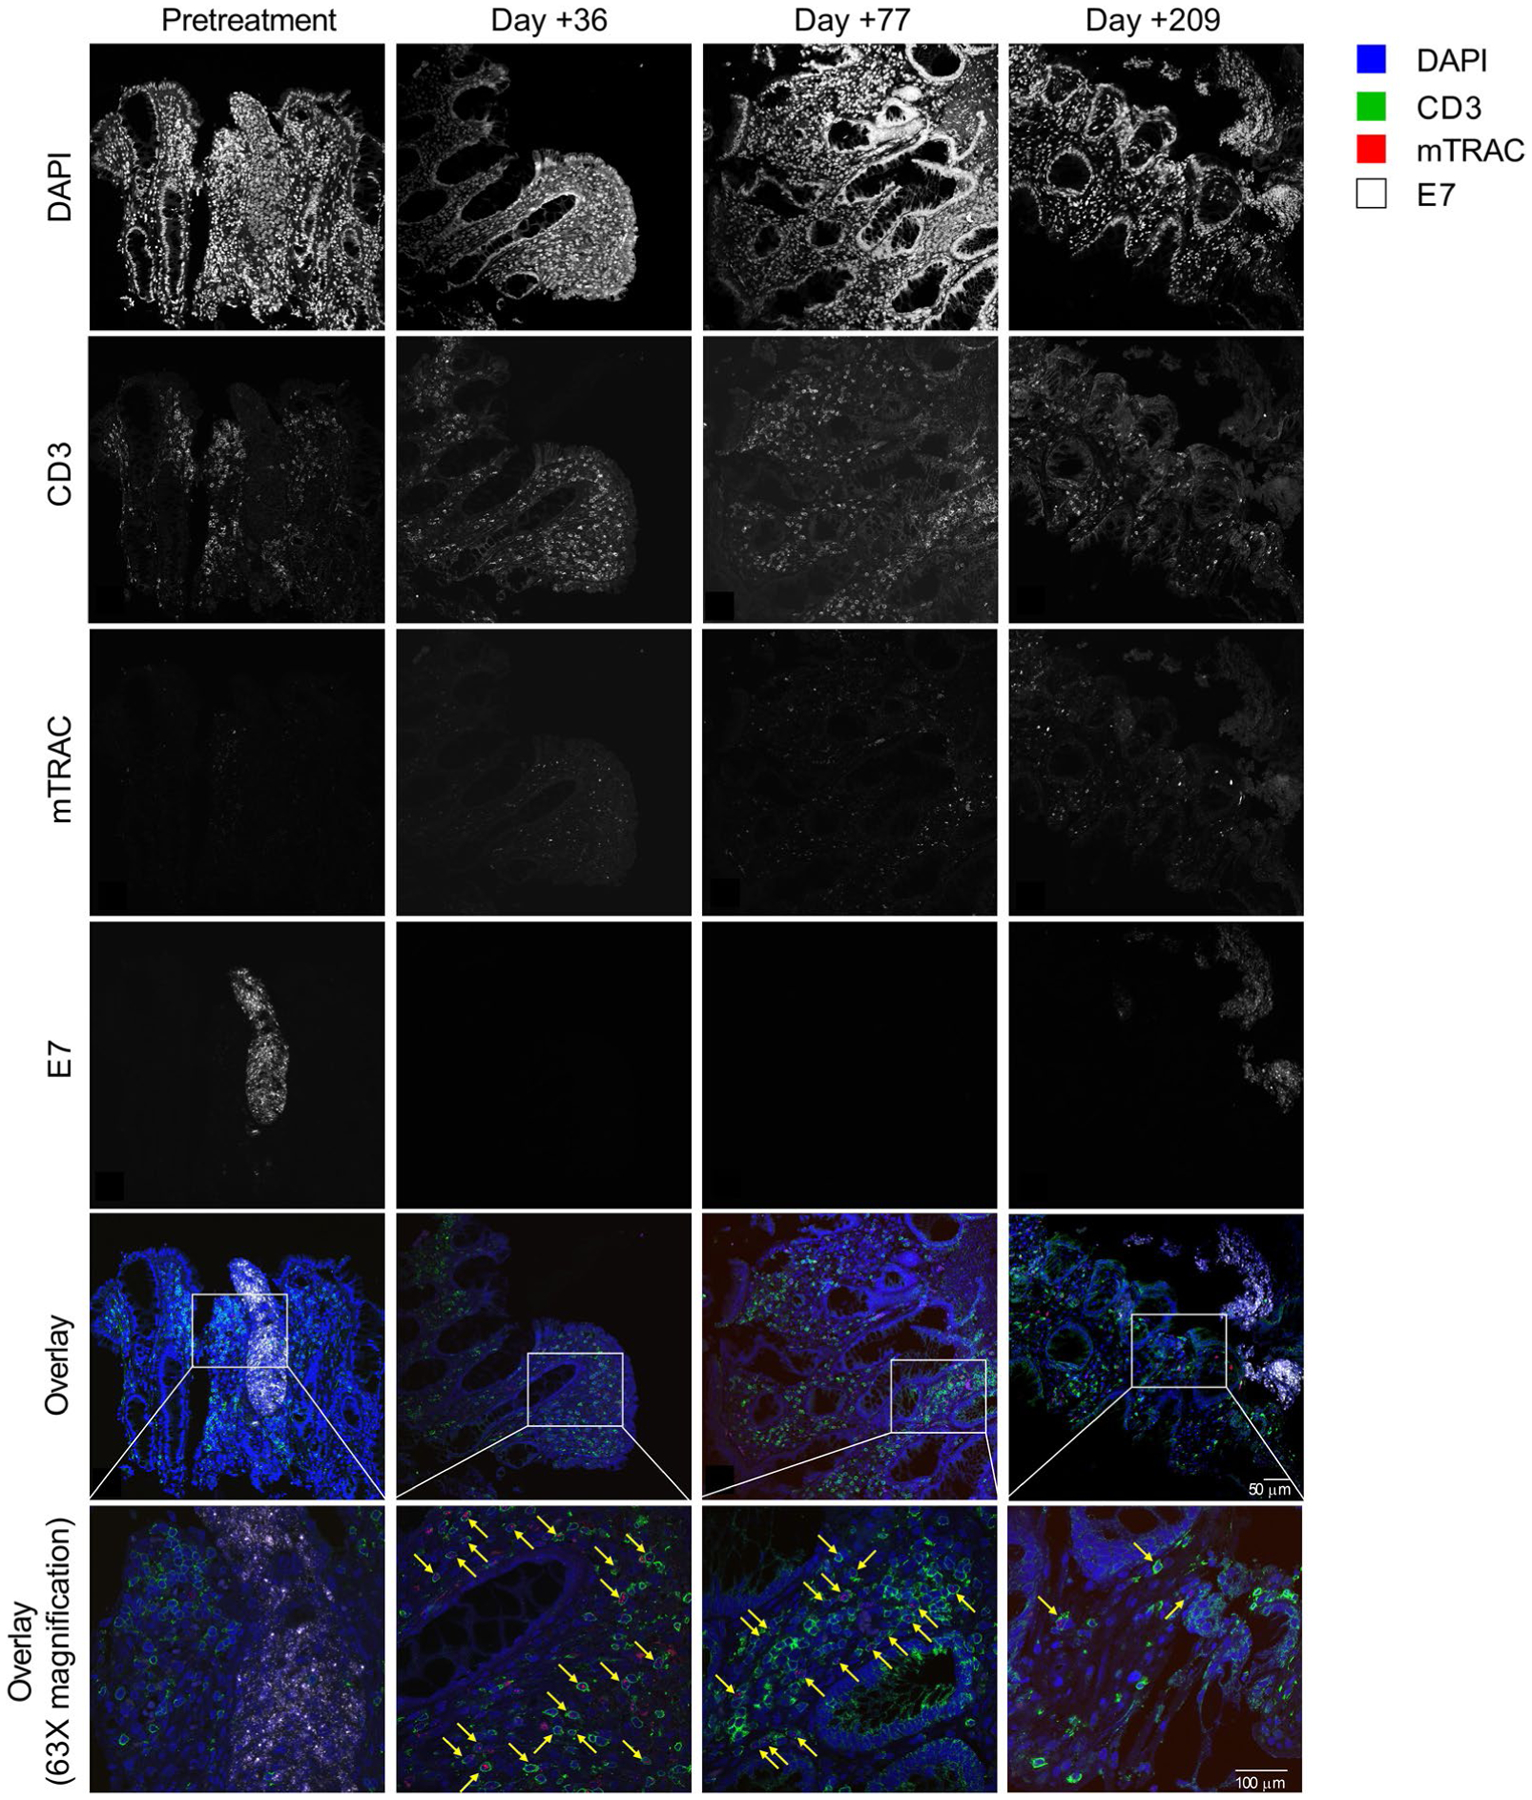
Serial samples from endoscopic biopsy of Patient 12’s tumor were examined. Immunohistochemistry was performed to detect CD3 protein, and RNAscope was performed to detect the E7 TCR α-chain (mTRAC) and HPV-16 E7 transcripts. A sequential labeling technique was employed to simultaneously examine protein and RNA expression on a single slide (each sample was stained once and is shown). The time point for each biopsy is indicated at the top of each row. The protein or transcript labeled is indicated to the left of each column. The color legend indicates labeling for the overlays on the bottom two rows. The yellow arrows point to E7 TCR-T cells as detected by CD3 protein membrane labeling and cytoplasmic mTRAC transcript labeling.
Supplementary Material
Acknowledgements
This research was funded by the NIH Intramural Research Program and through a NIH Cooperative Research and Development Agreement with Kite, a Gilead Company (C.S.H.). Support was also provided by the NHLBI-funded National Gene Vector Biorepository at Indiana University under contract no. 75N92019D00018 and by federal funding through the NCI, NIH, under contract no. 75N91019D00024 (C.S.H.). The content of this publication does not necessarily reflect the views or policies of the Department of Health and Human Services, nor does mention of trade names, commercial products or organizations imply endorsement by the US Government. The clinical-grade E7 TCR retroviral vector was manufactured by S. Feldman, NCI Surgery Branch.
Competing interests
C.S.H. is an inventor on the NIH patent for the E7 TCR and other NIH patents in the field of immunotherapy. C.S.H. receives research funding through an NCI Collaborative Research and Development Agreement with Kite Pharma. The other authors declare no competing interests.
Footnotes
Online content
Any methods, additional references, Nature Research reporting summaries, source data, extended data, supplementary information, acknowledgements, peer review information; details of author contributions and competing interests; and statements of data and code availability are available at https://doi.org/10.1038/s41591-020-01225-1.
Code availability
RNA-seq expression data and WES data were processed with the CCR Collaborative Bioinformatics Resource (CCBR) in-house pipeline (https://github.com/CCBR/Pipeliner).
Extended data is available for this paper at https://doi.org/10.1038/s41591-020-01225-1.
Supplementary information The online version contains supplementary material available at https://doi.org/10.1038/s41591-020-01225-1.
Data availability
Sequencing data files from WES and RNA have been deposited in the Database of Genotypes and Phenotypes (dbGaP) (accession no. phs002286.v1.p1). Gene sets for pathways analysis were from the Ingenuity Pathway Analysis database (version Summer Release 2018, https://digitalinsights.qiagen.com). WES mutation analysis and copy number variant tables are provided in Supplementary Datasets 1 and 2. Source data for Figs. 1 and 2, along with Extended Data Figs. 1–9, are provided in Supplementary Dataset 3. External requests for data will be evaluated by the corresponding author and requests may be subject to NIH policy. Source data are provided with this paper.
References
- 1.Robbins PF et al. A pilot trial using lymphocytes genetically engineered with an NY-ESO-1-reactive T cell receptor: long-term follow-up and correlates with response. Clin. Cancer Res 21, 1019–1027 (2015). [DOI] [PMC free article] [PubMed] [Google Scholar]
- 2.June CH, O’Connor RS, Kawalekar OU, Ghassemi S & Milone MC CAR T cell immunotherapy for human cancer. Science 359, 1361–1365 (2018). [DOI] [PubMed] [Google Scholar]
- 3.Guedan S, Ruella M & June CH Emerging cellular therapies for cancer. Annu. Rev. Immunol 37, 145–171 (2019). [DOI] [PMC free article] [PubMed] [Google Scholar]
- 4.Hinrichs CS Molecular pathways: breaking the epithelial cancer barrier for chimeric antigen receptor and T cell receptor gene therapy. Clin. Cancer Res 22, 1559–1564 (2016). [DOI] [PMC free article] [PubMed] [Google Scholar]
- 5.Hinrichs CS & Restifo NP Reassessing target antigens for adoptive T cell therapy. Nat. Biotechnol 31, 999–1008 (2013). [DOI] [PMC free article] [PubMed] [Google Scholar]
- 6.Stevanović S et al. Landscape of immunogenic tumor antigens in successful immunotherapy of virally induced epithelial cancer. Science 356, 200–205 (2017). [DOI] [PMC free article] [PubMed] [Google Scholar]
- 7.Doran SL et al. T cell receptor gene therapy for human papillomavirus-associated epithelial cancers: a first-in-human, phase I/II study. J. Clin. Oncol 37, 2759–2768 (2019). [DOI] [PMC free article] [PubMed] [Google Scholar]
- 8.Jin BY et al. Engineered T cells targeting E7 mediate regression of human papillomavirus cancers in a murine model. JCI Insight 3, e99488 (2018). [DOI] [PMC free article] [PubMed] [Google Scholar]
- 9.Schwartzentruber DJ Guidelines for the safe administration of high-dose interleukin-2. J. Immunother 24, 287–293 (2001). [DOI] [PubMed] [Google Scholar]
- 10.Center for Biologics Evaluation and Research. YESCARTA (axicabtagene ciloleucel) (FDA, 2019). [Google Scholar]
- 11.Center for Biologics Evaluation and Research. KYMRIAH (tisagenlecleucel) (FDA, 2019). [Google Scholar]
- 12.Spies T et al. A gene in the human major histocompatibility complex class II region controlling the class I antigen presentation pathway. Nature 348, 744–747 (1990). [DOI] [PubMed] [Google Scholar]
- 13.Cerundolo V et al. Presentation of viral antigen controlled by a gene in the major histocompatibility complex. Nature 345, 449–452 (1990). [DOI] [PubMed] [Google Scholar]
- 14.Farrar MA & Schreiber RD The molecular cell biology of interferon-gamma and its receptor. Annu. Rev. Immunol 11, 571–611 (1993). [DOI] [PubMed] [Google Scholar]
- 15.Schneider WM, Chevillotte MD & Rice CM Interferon-stimulated genes: a complex web of host defenses. Annu Rev. Immunol 32, 513–545 (2014). [DOI] [PMC free article] [PubMed] [Google Scholar]
- 16.Tran E, Longo DL & Urba WJ A milestone for CAR T cells. New Engl. J. Med 377, 2593–2596 (2017). [DOI] [PubMed] [Google Scholar]
- 17.Ribas A & Wolchok JD Cancer immunotherapy using checkpoint blockade. Science 359, 1350–1355 (2018). [DOI] [PMC free article] [PubMed] [Google Scholar]
- 18.Gettinger S et al. Impaired HLA class I antigen processing and presentation as a mechanism of acquired resistance to immune checkpoint inhibitors in lung cancer. Cancer Discov. 7, 1420–1435 (2017). [DOI] [PMC free article] [PubMed] [Google Scholar]
- 19.Zaretsky JM et al. Mutations associated with acquired resistance to PD-1 blockade in melanoma. New Engl. J. Med 375, 819–829 (2016). [DOI] [PMC free article] [PubMed] [Google Scholar]
- 20.Shin DS et al. Primary resistance to PD-1 blockade mediated by JAK1/2 mutations. Cancer Discov. 7, 188–201 (2017). [DOI] [PMC free article] [PubMed] [Google Scholar]
- 21.Schreiber RD, Old LJ & Smyth MJ Cancer immunoediting: integrating immunity’s roles in cancer suppression and promotion. Science 331, 1565–1570 (2011). [DOI] [PubMed] [Google Scholar]
- 22.Dunn GP, Koebel CM & Schreiber RD Interferons, immunity and cancer immunoediting. Nat. Rev. Immunol 6, 836–848 (2006). [DOI] [PubMed] [Google Scholar]
- 23.Tran E, Robbins PF & Rosenberg SA ‘Final common pathway’ of human cancer immunotherapy: targeting random somatic mutations. Nat. Immunol 18, 255–262 (2017). [DOI] [PMC free article] [PubMed] [Google Scholar]
- 24.Scheper W et al. Low and variable tumor reactivity of the intratumoral TCR repertoire in human cancers. Nat. Med 25, 89–94 (2019). [DOI] [PubMed] [Google Scholar]
- 25.Schumacher TN, Scheper W & Kvistborg P Cancer neoantigens. Annu. Rev. Immunol 37, 173–200 (2019). [DOI] [PubMed] [Google Scholar]
- 26.Huber MH et al. A phase II study of ifosfamide in recurrent squamous cell carcinoma of the head and neck. Am. J. Clin. Oncol 19, 379–382 (1996). [DOI] [PubMed] [Google Scholar]
- 27.Sandler A et al. Ifosfamide in the treatment of advanced or recurrent squamous cell carcinoma of the head and neck: a phase II Hoosier Oncology Group trial. Am. J. Clin. Oncol 21, 195–197 (1998). [DOI] [PubMed] [Google Scholar]
- 28.Sutton GP, Blessing JA, Photopulos G, Berman ML & Homesley HD Gynecologic Oncology Group experience with ifosfamide. Semin. Oncol 17, 6–10 (1990). [PubMed] [Google Scholar]
- 29.Riemer AB et al. A conserved E7-derived cytotoxic T lymphocyte epitope expressed on human papillomavirus 16-transformed HLA-A2+ epithelial cancers. J. Biol. Chem 285, 29608–29622 (2010). [DOI] [PMC free article] [PubMed] [Google Scholar]
- 30.Zhang L et al. Enhanced efficacy and limited systemic cytokine exposure with membrane-anchored interleukin-12 T cell therapy in murine tumor models. J. Immunother. Cancer 8, e000210 (2020). [DOI] [PMC free article] [PubMed] [Google Scholar]
- 31.Helman SR et al. Human papillomavirus T cell cross-reactivity in cervical cancer: implications for immunotherapy clinical trial design. JAMA Netw. Open 1, e180706 (2018). [DOI] [PMC free article] [PubMed] [Google Scholar]
- 32.Jin J et al. Enhanced clinical-scale manufacturing of TCR transduced T cells using closed culture system modules. J. Transl. Med 16, 13 (2018). [DOI] [PMC free article] [PubMed] [Google Scholar]
- 33.Khong HT & Rosenberg SA Pre-existing immunity to tyrosinase-related protein (TRP)-2, a new TRP-2 isoform, and the NY-ESO-1 melanoma antigen in a patient with a dramatic response to immunotherapy. J. Immunol 168, 951–956 (2002). [DOI] [PMC free article] [PubMed] [Google Scholar]
- 34.Cormier JN et al. Natural variation of the expression of HLA and endogenous antigen modulates CTL recognition in an in vitro melanoma model. Int. J. Cancer 80, 781–790 (1999). [DOI] [PMC free article] [PubMed] [Google Scholar]
- 35.Li H Aligning sequence reads, clone sequences and assembly contigs with BWA-MEM. Preprint at https://arxiv.org/abs/1303.3997v2 (2013).
Associated Data
This section collects any data citations, data availability statements, or supplementary materials included in this article.
Supplementary Materials
Data Availability Statement
Sequencing data files from WES and RNA have been deposited in the Database of Genotypes and Phenotypes (dbGaP) (accession no. phs002286.v1.p1). Gene sets for pathways analysis were from the Ingenuity Pathway Analysis database (version Summer Release 2018, https://digitalinsights.qiagen.com). WES mutation analysis and copy number variant tables are provided in Supplementary Datasets 1 and 2. Source data for Figs. 1 and 2, along with Extended Data Figs. 1–9, are provided in Supplementary Dataset 3. External requests for data will be evaluated by the corresponding author and requests may be subject to NIH policy. Source data are provided with this paper.


