
Figure 2.
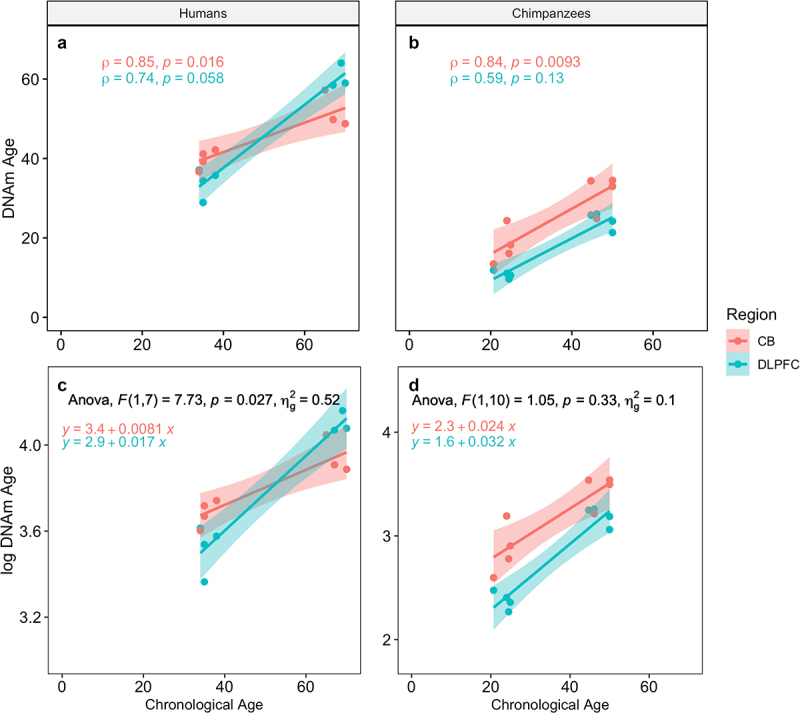
Epigenetic age estimates using the Horvath clock for humans and chimpanzees and results of the ANCOVA. A & B: Spearman’s rho is shown for each species (A = humans, B = chimpanzees) and region. C & D: Results of the ANCOVA comparing slopes of ageing for each region for (c) humans and (d) chimpanzees, along with the regression equations for each line. CB = cerebellum, DLPFC = dorsolateral prefrontal cortex.