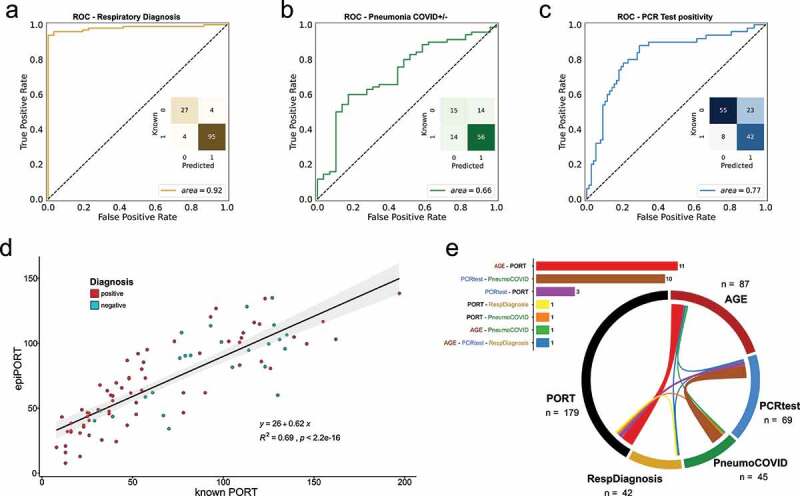
Figure 1.

a,b,c) ROC curve of the LOOCV penalized logistic regression models (refer to Supplementary Figure 1 for group definition). a) Respiratory Diagnosis (positive: groups I, II, III, and IV vs. negative: group V). b) COVID-19 Diagnosis within the pneumonia group (positive: groups I, II, and III vs. negative: group IV). c) PCR test positivity (positive: groups II, and III vs. negative: groups I, IV, and IV). d) epiPORT model (LOOCV penalized linear regression) based on COVID-19 diagnosis vs. non COVID-19 pneumonia (positive: groups I, II, and III vs. negative: group IV). Individuals with a positive diagnosis are indicated in teal, while negative in red. e) Predictive CpG sites shared among the models (see Supplementary Table 5). The barplot (top) shows the number of shared predictive CpG sites. In the chord diagram (bottom) the shared predictive sites are displayed as ribbons (the thickness is proportional to the number of shared sites) connecting the models (the numbers represent the predictive CpG sites for each model). The overlap was calculated using the VIB/UGent Venn webtool (http://bioinformatics.psb.ugent.be/webtools/Venn/).
