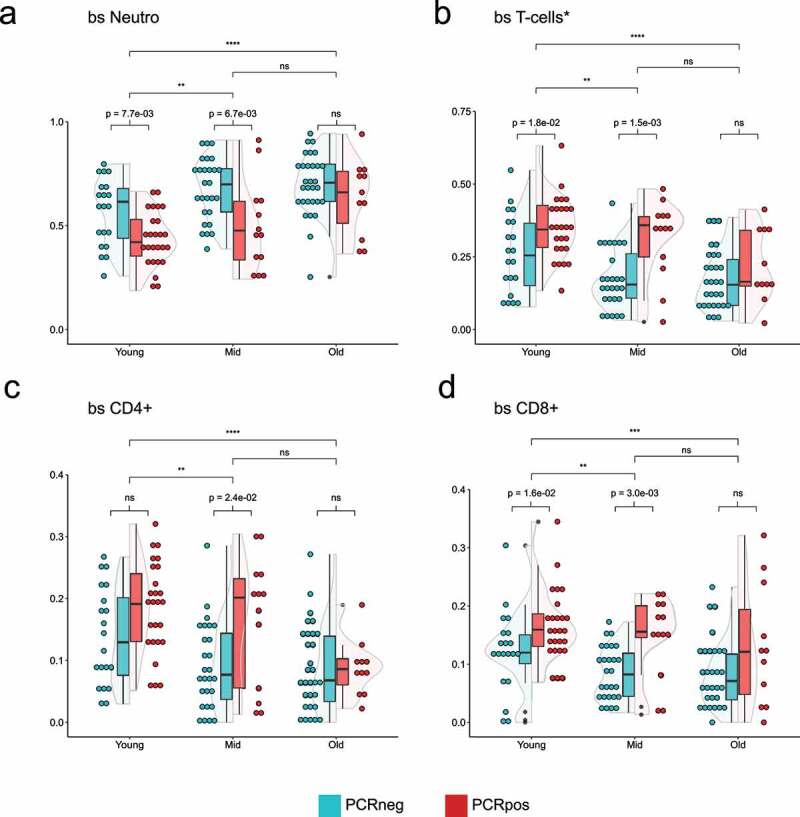
Figure 3.

Violin plots showing the distribution of 5meC-calculated neutrophils (a), T-cells (b, sum of CD4+, and CD8+), CD4 + T cells (c), CD8 + T cells (d) in three different age groups split by the PCR positivity test. Teal: PCR test negative; red: PCR test positive. Wilcoxon rank sum test was used to compare the means. Top bars are comparing age groups (ns = p-val >0.05; * = p-val <0.05; ** = p-val <0.01; *** = p-val <0.001; **** = p-val <0.0001), while the bottom bars are comparing PCR positive and negative within each group (ns = p-val >0.05; if the p-val <0.05, the value is indicated).
