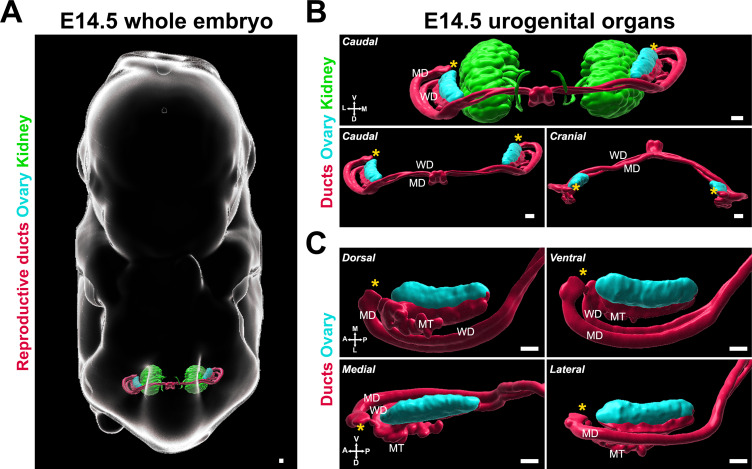
Figure 1. 3D models of developing ovaries provide a new perspective of ovary morphology.
(A) 3D model generated by isosurface segmentation of lightsheet images taken of a whole XX embryo at E14.5 immunostained for PAX8 (kidney, reproductive ducts, green, red) and FOXL2 (gonad, cyan). (B) Caudal and cranial views of the surfaces representing the urogenital system, with and without the kidney surfaces, isolated from the whole embryo images in (A). (C) Close-ups of dorsal, ventral, medial, and lateral views of the surfaces representing the ovary and reproductive ducts, isolated from the images in (A). MD, Müllerian duct; MT, mesonephric tubule; WD, Wolffian duct. Yellow asterisks indicate the location of the infundibulum of the presumptive oviduct for reference. Compasses on the bottom left of each panel indicate the orientation of the ovary: A, anterior; D, dorsal; L, lateral; M, medial; P, posterior; V, ventral. Scale bars, 100 μm.

