Abstract
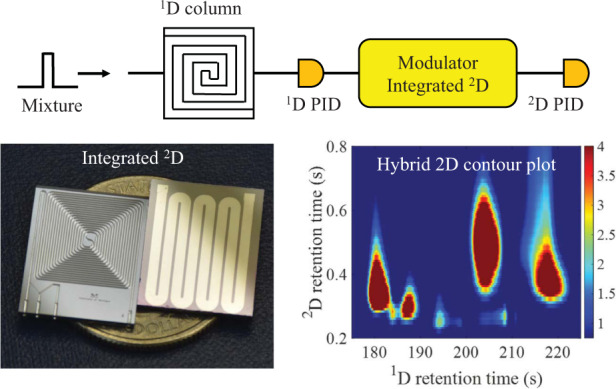
Two-dimensional (2D) gas chromatography (GC) provides enhanced vapor separation capabilities in contrast to conventional one-dimensional GC and is useful for the analysis of highly complex chemical samples. We developed a microfabricated flow-restricted pneumatic modulator (FRPM) for portable comprehensive 2D micro-GC (μGC), which enables rapid 2D injection and separation without compromising the 1D separation speed and eluent peak profiles. 2D injection characteristics such as injection peak width and peak height were fully characterized by using flow-through micro-photoionization detectors (μPIDs) at the FRPM inlet and outlet. A 2D injection peak width of ~25 ms could be achieved with a 2D/1D flow rate ratio over 10. The FRPM was further integrated with a 0.5-m long 2D μcolumn on the same chip, and its performance was characterized. Finally, we developed an automated portable comprehensive 2D μGC consisting of a 10 m OV-1 1D μcolumn, an integrated FRPM with a built-in 0.5 m polyethylene glycol 2D μcolumn, and two μPIDs. Rapid separation of 40 volatile organic compounds in ~5 min was demonstrated. A hybrid 2D contour plot was constructed by using both 1D and 2D chromatograms obtained with the two μPIDs at the end of the 1D and 2D μcolumns, which was enabled by the presence of the flow resistor in the FRPM.
Subject terms: Electrical and electronic engineering, Chemistry
Introduction
Microfabricated gas chromatography (μGC) is a powerful portable vapor analysis method for applications such as environmental protection and monitoring, workplace hazard analysis, and biomedicine1–5. To date, nearly all μGC devices are one-dimensional (1D) GC with relatively short columns (<10 m), which limits the separation performance for complex mixtures for many field applications6–9 (e.g., petroleum, food, metabolomic or forensic), which may require the analysis of hundreds of diverse compounds. Thus, the addition of a second column in two-dimensional (2D) GC, such as heart-cutting or comprehensive 2D GC, is needed to further enhance the separation capabilities and broaden the range of compounds that can be analyzed by a single portable μGC device.
In comprehensive 2D GC, a modulator is critical for periodically cutting portions of eluents from the first-dimensional (1D) column and injecting them into the second-dimensional (2D) column for further analysis10,11. These modulators are typically either thermal or pneumatic. A thermal modulator first traps a portion of an eluent from the 1D column, injects the trapped eluent into the 2D column by rapidly raising the temperature, and is then cooled immediately to trap subsequent eluents from the 1D column. The major drawbacks of the thermal modulator are the need for (1) high power for rapid temperature ramping and (2) rapid cooling mechanisms (such as liquid N2 or liquid CO2). These factors increase the modulator footprint and therefore are not conducive to μGC development. While a microfabricated thermal modulator using thermal-electric cooling was recently demonstrated12,13, its operation was still power intensive, it was difficult to fabricate and maintain, and it was incapable of trapping light compounds.
A pneumatic modulator uses external valves and auxiliary flows to inject a portion of an eluent from the 1D column into the 2D column without rapid heating or cooling. Commonly used types of modulators include the stop-flow modulator14–16, in which the flow in 1D is suspended temporarily when 2D separation takes place. While the stop-flow modulator (essentially a T-junction) can be microfabricated15, the use of the stop-flow mode significantly increases the 1D separation time11,16 and causes additional peak broadening. Another commonly used pneumatic flow switching modulator is the Deans switch11,17–20, which has been microfabricated for comprehensive 2D GC18. While the Deans switch allows for continuous 1D separation concomitant with 2D separation, the flow rates in 1D and 2D need to be carefully adjusted to avoid backflow in 1D. A high flow rate ratio between 2D and 1D results in disturbances in 1D flow. Consequently, it is difficult to achieve sharp 2D injection and rapid 2D separation. In addition, the analyte concentration in 2D is diluted due to the auxiliary flow needed to transfer the 1D eluent to 2D. Differential flow modulators10,11,21,22 use 4- or 6-port valves so that the 1D and 2D flows are independent and thus allow for concomitant 1D and 2D separation while permitting a high 2D to 1D flow rate ratio for sharp 2D injection and improved 2D separation. However, 4- and 6-port valves are very bulky and heavy, which are unsuitable for μGC.
This work demonstrates a microfabricated chip-based flow-restricted pneumatic modulator (FRPM) enabling sharp 2D injection and a high 2D flow rate without suspending 1D separation. The design, fabrication, and characterization of this pneumatic modulator are described, and an injection peak width of ~25 ms is achieved at a 2D/1D flow rate ratio over 10 without 1D perturbation. Subsequently, the FRPM is monolithically integrated with a 0.5 m 2D column on a single chip. Finally, a first-of-its-kind portable automated comprehensive 2D μGC device is developed, consisting of a 10 m OV-1 1D microfabricated column (μcolumn), an integrated FRPM with a built-in 0.5 m WAX (i.e., polyethylene glycol (PEG)) 2D μcolumn, and two flow-through micro-photoionization detectors (μPIDs). The entire device was run standalone without any benchtop components. The rapid separation of 40 volatile organic compounds (VOCs) in 5 min is demonstrated. A 2D contour plot is constructed by using both 1D and 2D chromatograms obtained with the two μPIDs at the end of the 1D and 2D μcolumns, showing improved peak capacity compared to that of conventional comprehensive 2D GC using only one vapor detector at the end of the 2D column. The use of the μPID at the end of 1D is crucially enabled by the presence of the flow resistor in the FRPM.
FRPM design and principles
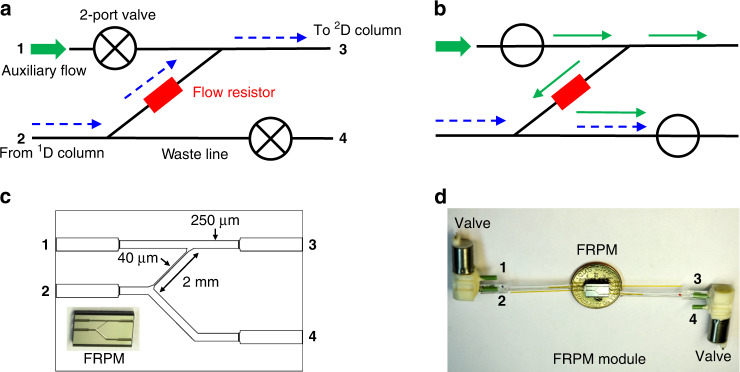
A block diagram for the FRPM along with its operation is provided in Fig. 1. The FRPM consists of an inlet for auxiliary flow (Port 1), an inlet for 1D eluents (Port 2), an outlet connected to the 2D column (Port 3), and an outlet as the waste line (Port 4), as well as an internal flow resistor between 1D and 2D. The auxiliary flow and waste line are controlled by two 2-port valves. During loading (Fig. 1a), both valves are closed, and a portion of the 1D eluent is loaded onto the 2D column through the flow resistor. During 2D separation (Fig. 1b), both valves are open, and a high auxiliary flow simultaneously provides the 2D carrier gas flow for 2D separation and the buffer flow that prevents the 1D eluent from entering the 2D column. Concurrently, 1D separation continues, and the 1D eluent is diverted to the waste line. After 2D separation, both valves are closed again, and a new modulation cycle begins. The fabrication of the FRPM is shown in Supplementary Figs. S1 and S2.
Fig. 1. Flow-restricted pneumatic modulator (FRPM) operation for comprehensive 2D μGC.
a 1D to 2D loading configuration with both valves closed (typical flow rate: ~1 mL/min). The blue arrows depict the 1D flow direction. b 2D separation with both valves open for high 2D flow (typical flow rate: ~10 mL/min), enabling sharp 2D injection and rapid 2D separation. The green arrows depict the auxiliary flow direction. c Microfabricated FRPM schematic and photograph. The flow resistor is a narrow channel with a cross-section of 40 μm × 170 μm (width × depth) and a length of 2 mm. All other channels have cross-sections of 250 μm × 250 μm (width × depth). d Photograph of the FRPM module with the FRPM and two 2-port valves. Ports 1–4 are labeled on the schematics and photographs
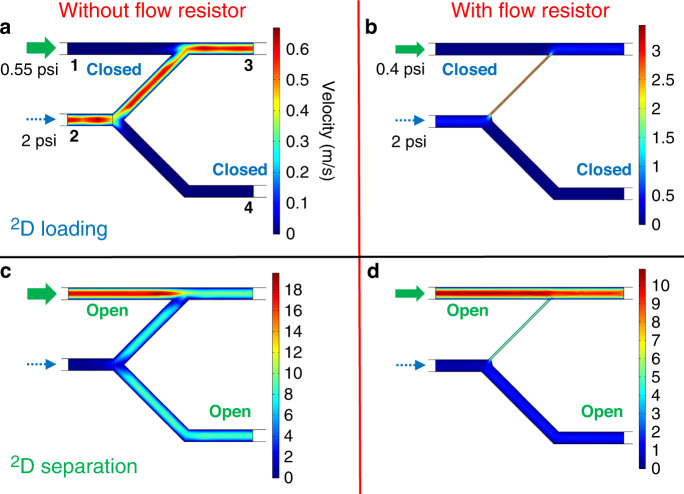
Computational fluid dynamics simulation was performed to examine the theoretical flow inside the FRPM. During 2D loading (Fig. 2a, b), the 1D to 2D flow velocity (at Port 3) is the same regardless of the presence of the flow resistor because the additional flow resistance resulting from the 40-μm narrow channel of the FRPM is negligible compared to that of the upstream 10 m column. During 2D separation, the FRPM without a flow resistor requires a higher input pressure from Port 1 (0.55 vs. 0.4 psi) to maintain the same flow rate at Port 3 as that of the FRPM with a flow resistor (see Fig. 2c, d). A comparison between Fig. 2c and d shows that during 2D separation, the flow resistor causes more of the auxiliary flow from Port 1 to be diverted to 2D (as the 2D carrier gas), whereas much of the auxiliary flow is flushed downward away from 2D when the flow resistor is not present. In both cases, the 1D flow is diverted to the waste line by the buffer flow passing through the 1D to 2D connection channel, which prevents the 1D flow from entering 2D. With the flow resistor, 1D separation continues without significant interruption, but without the flow resistor, significant flow perturbations are observed when the high flow from the auxiliary line causes flow shocks in 1D.
Fig. 2. Microfluidic simulations of the FRPM module.
Flow velocity field distribution of the FRPM module during 2D loading and separation phases without (a, c) and with (b, d) a flow resistor. The simulated geometry of the FRPM module is the same as that shown in Fig. 1c. The entire simulation geometry includes a 10 m column with a channel width of 250 μm (not shown) attached to the FRPM module at Port 2. Input pressures are assigned at the inlet of the 10 m column (2 psi) and at the inlet of Port 1 in the FRPM module (0.55 psi for the FPRM without a flow resistor (a, c) and 0.4 psi for the FRPM with a flow resistor (b, d)
Compared to the other aforementioned pneumatic modulators, the FRPM modulator has several advantages.
(1) A high auxiliary flow rate can be used for sharp 2D injection and rapid 2D separation.
(2) The flow resistor restricts the auxiliary flow that is spent on the waste line (see Fig. 2), which saves the auxiliary flow.
(3) Again, due to the flow resistor, the impact of the auxiliary flow on the 1D flow and separation is minimized. Consequently, a large range of auxiliary flow rates and 1D flow rates can be selected without 1D flow perturbation (such as flow shocks upon modulation switching and 1D backflow). This allows for detection immediately after the 1D outlet to directly monitor 1D separation, which enables utilization of the 1D chromatogram for constructing 2D contour plots (as further discussed later).
(4) The eluent concentration (or density) at the transfer junction from the 1D outlet to the 2D inlet is preserved. In contrast, the Deans switch relies on the auxiliary flow to push the eluent from 1D to 2D, consequently diluting the eluent concentration and reducing the 2D signal when a concentration-dependent vapor detector (e.g., PID) is used.
(5) 1D separation is continuous (unlike in stop-flow modulation), which expedites 1D separation and reduces 1D peak broadening.
(6) The FRPM is versatile and can be operated in stop-flow mode by permanently closing the waste line valve and letting the 1D and auxiliary flow share the same pressure/flow source (see Discussion).
(7) The FRPM can be easily microfabricated and even integrated with a 2D column on a single chip.
Results
FRPM module
FRPM chips were microfabricated using the same process as that for μcolumns (details in Supplementary Fig. S1). Each FRPM chip has dimensions of 8 mm × 5 mm × 1 mm (length × width × thickness). Figure 1c illustrates a schematic of the microfluidic channels inside the FRPM, with a 2-mm long, 40 μm × 170 μm (width × depth) channel as the built-in flow resistor. The flow resistor’s width and depth can be adjusted to achieve different flow resistances. All other channels have cross-sections of 250 μm × 250 μm. FRPM modules were constructed by connecting the FRPM chip to two 2-port valves at the corresponding ports (Fig. 1d).
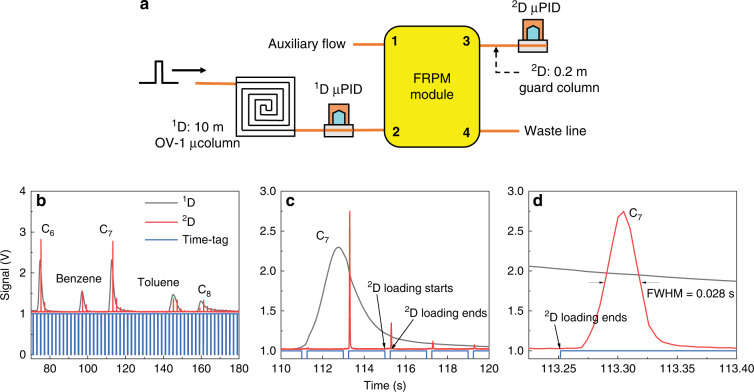
As illustrated in Fig. 3a, 2D injection using the FRPM module was characterized by only a 10 m OV-1 1D μcolumn and a 20 cm guard column in 2D (no 2D separation column). Two flow-through μPIDs were used to measure and compare eluents immediately before and after the FRPM. Initial characterization was carried out using unmodulated operation (chromatograms in Supplementary Fig. S3a). All 1D eluents were transferred to 2D with slight delays between the eluent peaks detected by the 1D and 2D μPID, which increased for heavier compounds. These delays resulted from the 20 cm guard column in 2D. A comparison of the C6 and C7 peak heights showed that the 2D μPID is approximately 2.4 times more sensitive than the 1D μPID. The relative peak heights for other compounds in the 2D μPID are reduced compared to those in 1D again due to peak broadening resulting from the 20 cm guard column.
Fig. 3. Operation characteristics of the FRPM module.
a Setup used to characterize the FRPM module. The sample mixture is injected into a 10 m OV-1 coated microcolumn (μcolumn) with a cross-section of 200 μm × 250 μm (width × depth). A microphotoionization detector (1D μPID) is connected to the 1D μcolumn and used to monitor the 1D eluents. The 2D μPID is connected to the outlet of the FRPM module via a 20 cm guard column (inner diameter: 250 μm) and used to monitor the 2D eluents. Ports 1–4 labeled on the FRPM module are described in Fig. 1(A). Unmodulated operation is shown in (a). b 1D and 2D chromatograms of C6, C7, C8, benzene, and toluene. The time-tags (shown as a blue square wave) record the closed (= 0) and open (= 1) states of the FRPM module valves, corresponding to 2D loading (= 0) and 2D separation (= 1), respectively. c Magnification of C7 peak in 1D and 2D. d Magnification of C7 peak in 2D. Experimental conditions: loading time = 0.25 s; modulation time = 2 s; 1D flow rate = 1.2 mL/min (measured at Port 3 with both valves closed). The flow rate is nearly the same when measured at the outlet of 1D (before the FRPM), indicating that the impact of the flow resistor on the 1D flow is negligible. 2D flow rate = 20 mL/min (measured at Port 3 with both valves open). The 1D μcolumn temperature ramping profile is provided in Fig. S3(B). The FRPM is kept at the isothermal ambient temperature (~20 °C). Helium is used as both the 1D carrier gas and auxiliary flow
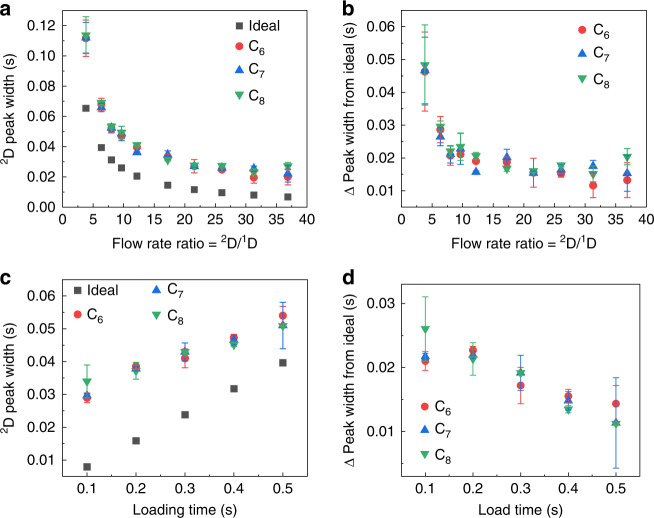
Modulated operation was investigated next. Figure 3b–d shows an example of 1D and modulated 2D chromatograms using alkanes and aromatics. The heights of the modulated 2D peaks are lower than those for the unmodulated peaks because the loading from 1D to 2D may not occur exactly at the apexes of the 1D peaks. Since sharp 2D injections are crucial for maximizing the 2D peak capacity, the 2D injection peak width (defined as the full-width-at-half-maximum) for C6, C7, and C8 as a function of the flow rate ratio between 2D and 1D (2D/1D) was examined (Fig. 4a). In general, the injection peak width decreases with an increasing 2D/1D flow rate ratio. However, the measured injection peak width is always broader than the ideal peak width (defined as the loading time divided by the 2D/1D flow rate ratio). This broadening is caused by the 20 cm guard column, and the broadening vs. flow rate can be viewed as the Golay plot of said column (Fig. 4b). The 2D injection peak width is also affected by loading time and is characterized in Fig. 4c at a fixed flow rate ratio of 13. The measured peak width increases linearly with increasing loading time and is again broader than the theoretical value. The broadening effect diminishes with longer loading times (Fig. 4d) since the broadening from the guard column becomes less prominent. Section S2 (Supplementary Figs. S4–S11) of the Supplementary Information provides the maximally allowed 2D/1D flow ratio without affecting the 1D flow and peak height (and peak area) for different loading times. In addition, we experimentally tested a series of flow resistors with widths of 20, 60, 80, and 250 μm and corresponding depths of 160, 190, 210, and 250 μm (see Supplementary Fig. S6 for the results of an FRPM with a 250-μm width). The different depths occur due to reactive ion etching lag during the deep reactive ion etching process. Considering an appropriately high flow rate ratio of ~10, 1D flow jittering is eliminated only once the flow resistor’s width is reduced to 40 μm (depth = 170 μm). A width of 20 μm also eliminates the 1D jittering but is prone to channel blocking during microfabrication. Based on these results, we selected the FRPM chip with a flow resistor width × depth = 40 μm × 170 μm, which allowed for an injection peak as sharp as ~25 ms achieved with a loading time of 0.25 s and a flow rate ratio larger than 10. This was accomplished without perturbing the 1D flow or significantly slowing down 1D separation due to the sufficiently high flow resistance of the 40-μm channel.
Fig. 4. 2D peak width dependence on 2D/1D flow rate ratio and loading time.
2D peak widths (full width at half maximum) of C6, C7, and C8 detected by 2D μPID vs. 2D/1D flow rate ratio (a) and loading time (c). The ideal 2D peak width is calculated by the loading time divided by the flow rate ratio. Deviations of 2D peak widths from ideal injection widths vs. flow rate ratio (b) and loading time (d). In (a) and (b), the loading time is fixed at 0.25 s and the 2D flow rate varies from 4 to 40 mL/min. In (c) and (d), the 2D flow rate is fixed at 16 mL/min and the loading time varies from 0.1 to 0.5 s. In all experiments, 1D flow rate = 1.2 mL/min and modulation time = 2 s. Error bars are obtained with 3 measurements
An alternative FRPM module design replaces the two 2-port valves with a single 3-port valve (Supplementary Fig. S12). During 2D loading and separation, the 3-port valve directs the auxiliary flow to its normally opened and closed ports, respectively, allowing performance like that of the two-valve module (Supplementary Figs. S13 and S14). Compared to the two-valve configuration, the single-valve FRPM module uses fewer components and is thus cheaper and easier to maintain. However, the eluent concentration (or density) at the transfer junction from the 1D outlet to the 2D inlet is slightly reduced because of the additional buffer flow added to the 1D eluents during loading.
Integrated FRPM and 2D μcolumn module
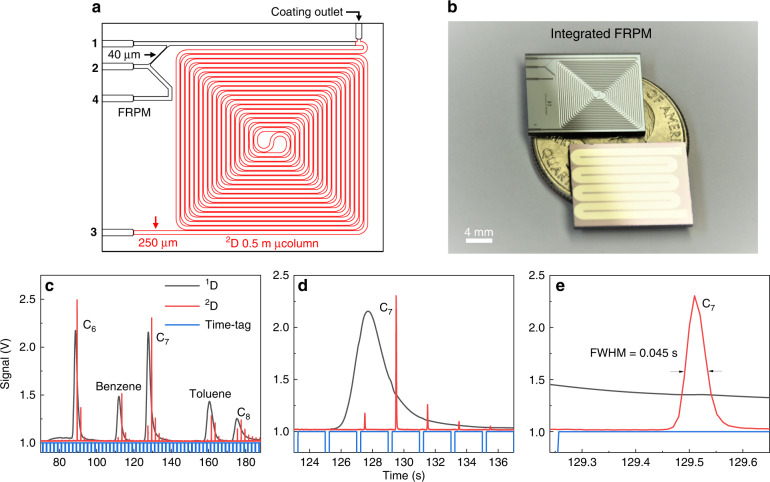
To further reduce the device footprint and number of interconnections, the FRPM was integrated with a 0.5 m 2D μcolumn (cross-section: 250 μm × 250 μm) on a single chip of dimensions 18 mm × 15 mm × 1 mm (length × width × thickness) (Fig. 5a, b). Because of the additional flow resistance from the 0.5 m 2D μcolumn, the integrated module was re-evaluated with the same methodology as the stand-alone module (Supplementary Figs. S15 and S16). As shown in Fig. 5c–e, at a flow rate ratio = 13, the integrated FRPM module demonstrates performance similar to that of the stand-alone module, with an additional 2D peak broadening of ~20 ms due to the extra 0.5 m μcolumn (the 2D μcolumn was only deactivated without any stationary phase coating yet).
Fig. 5. Operation characteristics of the 2D μcolumn integrated FRPM module.
a Schematic of FRPM integrated with 0.5 m 2D μcolumn. b Photograph of integrated FRPM chip (top) with backside heater (bottom). c 1D and 2D chromatograms of C6, C7, C8, benzene, and toluene using deactivated integrated FRPM chip. d Magnification of C7 peak in 1D and 2D . e Magnification of C7 peak in 2D. Experimental conditions: loading time = 0.25 s; modulation time = 2 s; 1D flow rate = 1.1 mL/min; 2D flow rate = 14 mL/min. The 1D temperature ramping profile is the same as that in Figure 3. The integrated chip is at isothermal room temperature (~20 oC). Helium is used as both 1D carrier gas and auxiliary flow
Automated portable comprehensive 2D μGC construction and operation
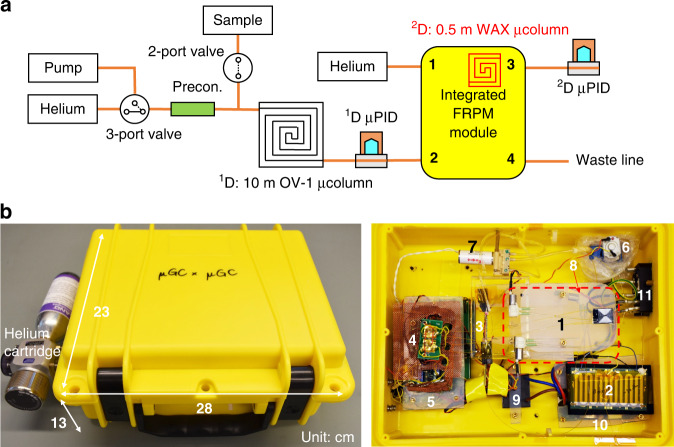
We constructed a stand-alone automated portable comprehensive 2D μGC device (Fig. 6) consisting of a 10 m OV-1 1D μcolumn (nonpolar), the integrated FRPM and 0.5 m WAX 2D μcolumn (polar), and two flow-through μPIDs at the 1D and 2D outlets, respectively, as well as accessories such as valves, a preconcentrator, a pump, helium cartridges, and in-house control software. Miniaturized comprehensive 2D GC at the subsystem level was investigated previously using μcolumns and thermal/pneumatic modulators13,15. However, these devices used benchtop GC injectors and/or detectors and were thus not automated stand-alone systems for field applications. This work presents a first-of-its-kind automated portable comprehensive 2D μGC without any benchtop components.
Fig. 6. Portable comprehensive 2D μGC system.
a Schematic of the integrated FRPM-based portable comprehensive 2D μGC device. The integrated FRPM module contains a 0.5 m long WAX 2D μcolumn. b System photographs. The device has dimensions 28 cm × 23 cm × 13 cm (length × width × height) and weighs 2.4 kg (including helium cartridge). (1) Integrated FRPM and 0.5 m WAX 2D μcolumn module (within the dashed square); (2) 1D 10 m OV-1 μcolumn; (3) Preconcentrator. (4) μPID array; (5) Printed circuit board and data acquisition card (copper mesh shielded); (6) Pump; (7) 3-port valve; (8) 2-port valve; (9) DC–DC converter; (10) 24 V power supply; (11) Rocker switch connected to wall power
This comprehensive 2D μGC is different from traditional comprehensive 2D GC in a few aspects. First, traditional comprehensive 2D GC uses only one detector at the end of the 2D column. The 1D chromatogram is reconstructed based only on information from the 2D detector, which leads to errors in the 1D retention time, 1D peak broadening, and the possibility of undersampling of 1D peaks. In contrast, our comprehensive 2D μGC uses two flow-through μPIDs to monitor the 1D and 2D eluents. This arrangement removes the need for 1D chromatogram reconstruction, as the 1D chromatogram can be directly obtained from the 1D μPID. As a result, the 1D peak position (i.e., 1D retention time) is accurately determined, and the original 1D peak width is preserved, which improves the separation performance (i.e., peak capacity). Second, because of the two-detector arrangement, a new algorithm to generate hybrid 2D contour plots using both 1D and 2D chromatograms can be developed to improve the separation performance. Third, the modulation time is dynamically adjusted to accommodate different 1D peak widths. For example, a short modulation time is used for earlier eluents with sharper peak widths—which reduces the chance for undersampling—and a longer modulation time for later eluents to accommodate the generally broader 2D peaks that require longer analysis times for separation.
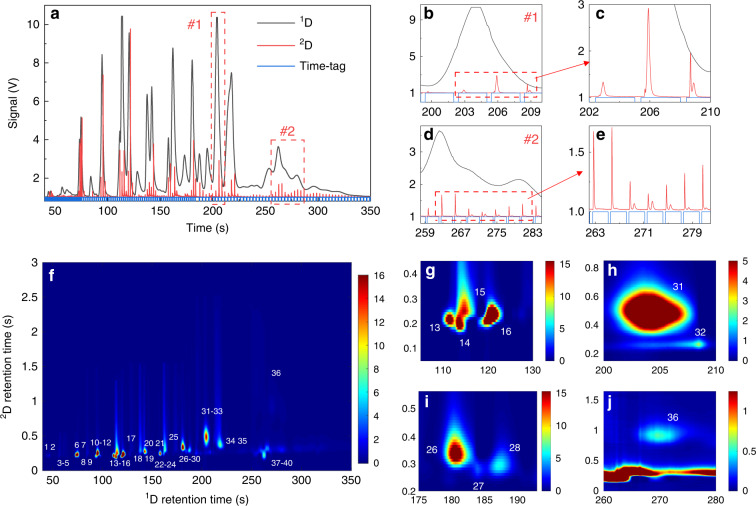
The comprehensive 2D μGC device was employed to separate 40 VOCs (selected such that some have similar boiling points but different polarities to enable 2D separation, see Supplementary Table S2) in ~5 min, as shown in Fig. 7. The 2D column (i.e., the integrated FRPM module) was operated using a carefully tuned temperature profile (Supplementary Fig. S17) to balance the sharpness of the 2D elution peaks while maintaining sufficient 2D separation. Figure 7a shows the 1D and modulated 2D chromatograms obtained by the 1D and 2D μPIDs, respectively. Two magnified images of certain regions are provided to visualize exemplary additional separations in 2D (Fig. 7b–e). For example, in Fig. 7b, c, two VOCs are completely coeluted in 1D yet separated in 2D. Another coelution example can be seen in Supplementary Fig. S19. Figure 7f presents the hybrid 2D contour plot generated using both the 1D and 2D chromatograms obtained (see Methods for a brief description of the hybrid contour plot method). Throughout the entire analysis, each analyte is eluted from the 2D column within a single modulation cycle, i.e., no wrap-around was observed. The 2D contour plot using the conventional method, which relies only on the 2D μPID data, is plotted in Supplementary Fig. S18. By virtue of the additional 1D information, more peaks are identified in the same segment (e.g., Fig. 7g, i) compared to the conventional 2D contour plot (e.g., Supplementary Fig. S18b, c). As a result, all 40 VOCs are separated using our hybrid method vs. only 32 peaks using the conventional 2D contour plot method.
Fig. 7. 1D and 2D chromatograms and hybrid 2D contour plot.
a 1D and 2D chromatograms of the 40 VOC mix (Table S2) obtained by 1D and 2D μPIDs in the portable comprehensive 2D μGC device. Magnifications of area #1 (b, c) and area #2 (d, e) in 1D and 2D. f Hybrid 2D contour plot using both the 1D and 2D chromotograms in Fig. (a). Magnifications of peaks 13–16 (g), 31–32 (h), 26–28 (i) and 36 (J). Panels (h) and (j) correspond to (c) and (e), respectively. For comparison, the 2D contour plot using the conventional method that relies only on the 2D μPID data is presented in Fig. S 18. Experimental conditions: 1D flow rate = 1.2 mL/min; 2D flow rate = 11 mL/min. Loading time = 0.4 s; modulation is segmented into three periods: modulation time = 1 s from 0 to 75 s; 2 s from 75 to 180 s; and 4 s from 180 to 350 s. Both 1D μcolumn (OV-1) and 2D integrated FRPM module undergo temperature ramping (Fig. S3(B) and S17). Helium is used as both 1D carrier gas and auxiliary flow
Use of the two detectors and the hybrid method significantly benefits 1D chromatogram construction due to improved 1D peak capacity and accuracy in 1D peak retention time. To evaluate the increase in the 1D peak capacity, 1D retention times and peak widths of benzene, C7, C8, and C9 are extracted from the conventional and hybrid 2D contour plots and are listed in Table 1. All of these analytes from the hybrid 2D contour plot have sharper peak widths than the widths obtained from the conventional 2D contour plot, and their widths (and retention times) are very close to the directly measured values from the 1D chromatogram. Notably, the C9 peak width is narrower in the hybrid reconstruction than in the measured value due to its coelution in 1D (Supplementary Fig. S19a). This suggests that our algorithm can reconstruct the real (i.e., not coeluted) peak for C9 by using the 1D data. The 1D peak capacity of these analytes is calculated using the formula15:
| 1 |
where and are the retention times for two adjacent peaks and and are the corresponding peak widths (full-widths-at-half-maximum). Rs is the resolution. The 1D peak capacity using the hybrid method yields (Rs = 1), showing a significant improvement over the conventional method . In addition, the accuracy of the 1D retention time is improved. For example, the C7 peak position is 94.7 s, as measured directly by the 1D μPID. The reconstructed peak position is 95 s using our algorithm, compared to 95.6 s using the conventional method.
Table 1.
1D retention times (RTs) and full-widths-at-half-maximum (FWHMs) for benzene, C7, C8, and C9 reconstructed from conventional (conv, Supplementary Fig. S18a) and hybrid (Fig. 7f) 2D contour plots and measured (meas) directly from the 1D chromatogram (Fig. 7a)
| RTconv | FWHMconv | RThybrid | FWHMhybrid | RTmeas | FWHMmeas | |
|---|---|---|---|---|---|---|
| Benzene | 85.7 | 2.7 | 84.8 | 2.6 | 84 | 2.4 |
| C7 | 95.6 | 2.4 | 95 | 1.9 | 94.7 | 2 |
| C8 | 143.4 | 2.5 | 142.6 | 2.3 | 142 | 2.3 |
| C9 | 197.1 | 7.2 | 194.2 | 2.7 | 194.6 | 3.8a |
All values are provided in seconds
aCoelution
The 2D peak capacity can be estimated as follows assuming isothermal separation15:
| 2 |
where N is the theoretical plate number, tr is the analyte 2D retention time, and tm is the holdup time. Using C9 (tr = 0.261 s, peak width = 0.055 s, reconstructed from the hybrid 2D contour plot) and a holdup time of 0.17 s, (Rs = 1). Therefore, the peak capacity of the whole system is 62. Note that in Fig. 7, the comprehensive 2D μGC system is optimized to separate all 40 VOCs in a short time rather than to achieve a high peak capacity.
Discussion
This article presents the development of a new FRPM for 2D comprehensive GC that allows a high auxiliary flow rate (and hence a high 2D flow rate) without disturbing or interrupting the 1D flow. The FRPM is shown to enable rapid 2D injection and separation while maintaining 1D separation and 1D peak shape. The integrated flow resistor in the FRPM not only helps reduce the impact of the auxiliary flow on the 1D peak shape and elusion time but also reduces the excess consumption of the auxiliary flow.
It should be noted that the 1D and 2D performance is affected by the auxiliary flow rate. As shown in Fig. 4a, the 2D peak width is determined by the auxiliary flow and 1D flow rate ratio. A higher auxiliary flow results in a narrower 2D injection peak width, which is preferred for 2D separations. However, an excessive auxiliary flow rate may cause 1D flow fluctuations (i.e., transient pressure changes), which cause 1D peak jittering (see Supplementary Figs. S5 and S6) and elution delay (see Supplementary Figs. S4 and S14). Therefore, the auxiliary flow must be kept in a reasonable range such that the 1D chromatogram is not disturbed. In our 2D μGC system, the flow rate ratio (when 1D flow is fixed at ~1 mL/min) is determined to be optimal at ~10 for narrow injection from 1D to 2D while avoiding any 1D jittering or significant 1D elution delay (see Section S2 in the SI). In addition, μPID responds to analyte concentration, not mass flow rate. Therefore, the auxiliary flow rate (or 2D carrier gas flow rate) or any pressure changes caused by valve switching do not affect the PID sensitivity. No fluctuations or spikes in the PID signal are observed when the valves are actuated.
In the FRPM, the duty cycle (i.e., the loading time vs. modulation time) ranges from 10 to 50% as a diverting flow modulation (e.g., 0.2–1.0 s loading time in a 2 s modulation cycle), which is low compared to that of other valve-based differential flow modulators, where a duty cycle as high as 80% was used19–21 (note that stop-flow modulation can achieve a 100% duty cycle). A longer loading time would allow increased mass transfer to 2D but would also lead to a broader 2D injection peak width and a shorter allowed 2D separation time. Although this low duty cycle does not affect the present 2D μGC system due to the use of concentration-dependent vapor sensors (i.e., μPIDs), the 2D signal (i.e., 2D detector’s sensitivity) may be reduced if the 2D detector (e.g., flame ionization detector) depends on the mass flow rate.
We subsequently used the integrated FRPM to construct a first-of-its-kind automated portable comprehensive 2D μGC. Rapid separation of a diverse set of 40 VOCs in ~5 min is demonstrated. Due to the FRPM, an undisturbed 1D chromatogram can be obtained and allows for the development of a new algorithm to construct hybrid 2D contour plots incorporating both 1D and 2D chromatograms. This results in more accurate 1D peak reconstructions and increased peak capacities compared to those of the conventional method, which uses only the 2D data. 32 peaks were counted from the conventional 2D contour plot (Supplementary Fig. S18a) and 29 peaks from the 1D chromatogram alone (Fig. 7a) compared to the 40 peaks separated by the hybrid 2D contour plot (Fig. 7f), corresponding to a gain of 8 and 11 peaks compared to those of a comprehensive 2D GC using the conventional method and a single column 1D GC, respectively.
If desired, the FRPM (and hence the comprehensive 2D μGC) can be operated in stop-flow mode15 by permanently closing the waste line valve and letting the 1D and auxiliary flow share the same pressure/flow source. Supplementary Fig. S20 shows the separation of the same 40 VOCs in Fig. 7 using this mode. The 1D separation time and peak width are both significantly increased with strong 1D flow perturbations. While this is a drawback compared to the current operating paradigm, the FRPM’s flexibility of operation allowing for stop-flow mode may be useful for some applications, such as those where rapid analysis is not crucial.
Compared to other pneumatic modulators, the major advantages of the FRPM are as follows: (1) Sharp 2D injection and rapid 2D separation with a high 2D flow rate (or high 2D/1D flow rate ratio) are enabled. (2) Continuous and undisturbed 1D separation concomitant with 2D separation is enabled, which facilitates a new method for constructing hybrid 2D contour plots using both 1D and 2D chromatograms, thus enhancing the overall 2D GC peak capacity without sacrificing the analysis time. (3) Integration with a 2D column is possible, reducing the footprint to be amendable for μGC. In contrast, most flow modulators are bulky and only suitable for benchtop operation19–23. However, due to its nature as a diverting flow modulator, the FRPM has an inherent disadvantage of mass loss due to the low duty cycle (20–50%) compared to that of most differential flow modulators, which can achieve a high duty cycle20,21. A detailed comparison of different types of pneumatic modulators is given in Supplementary Table S3.
The FRPM described here is applicable to traditional comprehensive 2D GC in which the two columns are connected in series (via a modulator) and whose total peak capacity is multiplicative. It can also be used in a heart-cutting 2D GC. There is another type of 2D GC (pseudo-2D GC) device24, in which multiple columns are arranged in parallel and coated with different stationary phases of varying polarities so that analytes of the same boiling point but different polarities can be separated. The FRPM is not applicable to this type of GC.
In summary, we developed a first-of-its-kind automated portable comprehensive 2D μGC using an integrated FRPM. This compact and versatile device provided portable stand-alone separations of 40 VOCs in ~5 min with an enhanced peak capacity compared to that of the conventional 2D GC. Further integration of the FRPM with both 1D and 2D μcolumns can further improve device compactness, potentially facilitating a hand-held device applicable to many more field applications.
Materials and methods
Materials
Analytical standard-grade hexane, heptane, octane, benzene, toluene, hexamethyldisilazane (HMDS), and the 40 VOCs listed in Supplementary Table S2 were purchased from Sigma-Aldrich (St. Louis, MO). N-type silicon wafers (P/N 1095, 100 mm diameter, 500 μm thickness), P-type heavily doped wafers (100 mm diameter, 0.001–0.005 Ω-cm, 400 μm thickness), and Borofloat 33 glass (P/N 517) were purchased from University Wafer. Carbopacks B (P/N 20273) and X (P/N 10437-U) were purchased from Sigma-Aldrich. Additional accessory materials are provided in Supplementary Table S4. All materials were used as purchased without further purification or modification. Helium (99.5% purity, P/N 49615He) was used as the carrier and auxiliary gas and was purchased from Leland Gas Technologies (South Plainfield, NJ).
Component fabrication
The 10 m 1D μcolumn (cross-section: 200 μm × 250 μm, width × depth), the stand-alone FRPM, and the integrated FRPM and 0.5 m 2D μcolumn were fabricated according to the fabrication process depicted in Supplementary Fig. S1. The stand-alone FRPM had no heater on the backside of the chip, but the integrated FRPM and 2D μcolumn were fabricated with a shared backside heater. The fabrication yield for the stand-alone FRPM was >95% (132 chips per 4-inch wafer), >90% for the integrated FRPM (12 chips per 4-inch wafer), and >50% for the 10 m μcolumn (2 chips per 4-inch wafer).
The integrated FRPM with a 0.5 m 2D μcolumn (cross-section: 250 μm × 250 μm) coating procedure is depicted in Supplementary Fig. S2. Prior to coating, both the 2D μcolumn and FRPM channels were deactivated by eight repeated injections of HMDS at 120 °C over 1 h. The coating outlet was blocked with a rubber septum during deactivation. During 2D μcolumn coating, the outlets of the FRPM were blocked, leaving only the coating outlet open to ensure that no coating solution flowed into the FRPM channels. A dummy 10 m μcolumn was attached to the coating outlet as a flow resistor to control the coating flow speed. The 2D μcolumn was dynamically coated with PEG by injecting 15 μL of solution and pushing it out at a rate of 5 cm/min. PEG: 2% (w/w) solution of CarboWAX in dichloromethane with azobisisobutyronitrile (1% w.r.t. CarboWAX) as a crosslinker. The coating process was repeated 2 times. The column was subsequently treated with HMDS after each coating and then baked at 180 °C for 1 h prior to use. Finally, the guard column attached to the coating outlet was removed, and hysol epoxy was applied to block the outlet. The 10 m μcolumn underwent the same coating procedure with a 3% (w/w) solution of OV-1 in dichloromethane. The resistance of the integrated heater was measured to be 40 Ω for the integrated FRPM chip and 28 Ω for the 10 m μcolumn. Both columns were wire bonded to PCB boards to allow for pulse-width-modulated heating using a peak voltage of 24 V. The μPID chip was fabricated as described in our previous work25,26. The μPID array was packaged on a PCB board, as shown in Fig. 6b.
The stainless steel preconcentrator was made by first cutting a 21.5-gauge stainless steel tube to 3.5 cm in length. One end was first plugged with glass wool. Subsequently, the tube was filled with 0.75 mg of Carbopack B, followed by 0.75 mg of Carbopack X, and the other end was then plugged with glass wool again. Two universal press-tight connectors were attached to both ends of the stainless steel tube after loading and fixed using hysol epoxy. A very thin layer of epoxy (∼0.2 mm) was also applied to the outer surface of the stainless steel tube body. The entire preconcentrator was placed into an oven at 120 °C and left to dry for 12 h. Finally, Kapton tape was wrapped around the stainless steel tube before it was wrapped with a 32-gauge nickel chromium heating wire (resistance ∼7 Ω) to ensure electrical isolation between the stainless steel tube and heating wires.
Computational fluid dynamics simulation
COMSOL Multiphysics® was used to generate the results presented in Fig. 2. A laminar flow module was used in the simulation, where helium was used as the gas flow and silicon was used as the walls. Closed valves were simulated by assigning an extremely large viscosity (i.e., 10,000) at a short portion of the inlet (Port 1) and the waste line (Port 4) simultaneously.
Comprehensive 2D μGC system setup and operation
The comprehensive 2D μGC system consisted of a stainless steel preconcentrator, a 10 m OV-1 coated 1D μcolumn, an integrated FRPM and a 0.5 m 2D WAX μcolumn, and two flow-through μPIDs at the end of 1D and 2D, respectively. Components were interconnected using universal press-tight connectors and deactivated fused silica capillaries. A detailed schematic along with a device photograph is shown in Fig. 6b. The 1D flow rate was calibrated at the end of the 2D μPID (Port 3) with both valves closed. The 2D flow rate was calibrated at the end of the 2D μPID by opening both valves at the auxiliary flow inlet (Port 1) and waste line (Port 4). Analytes were stored in a Tedlar bag and sampled into the preconcentrator before backflush injection into the 1D μcolumn. During operation, the analytes were separated by the 1D column, flowed through the 1D μPID, and subsequently entered the FRPM module for 2D comprehensive modulation and separation. Separation was conducted using temperature ramped programming in both dimensions via the integrated backside heaters. Helium (99.5% purity) was used as the carrier and auxiliary gas. Loading and modulation times were set by simultaneously controlling the valves’ ON and OFF states at the auxiliary flow inlet (Port 3) and waste line (Port 4).
Segmented modulations were achieved by assigning different loading and modulation times to different segments of analysis. The current work used modulation times of 1 s from 0 to 75 s, 2 s from 75 to 180 s, and 3 s from 180 to 350 s. The loading time was kept at 0.4 s during all segments. Portable μGC operation was controlled by LabVIEWTM software developed in-house.
2D chromatogram construction
The 2D contour plots in Supplementary Fig. S18 were constructed with the traditional method adopted in conventional comprehensive 2D GC that has only one detector at the outlet of the 2D column (i.e., no detector at the end of the 1D column). They were generated through the 2D interpolation of the original 2D GC data based on a cubic spline27. The interpolated value at a query grid point was based on a cubic interpolation of the values at neighboring grid points in each respective dimension.
The hybrid 2D contour plot in Fig. 7f–j was constructed with the signal obtained from both 1D and 2D μPIDs. The traditional interpolation method based on a cubic spline was first applied using the 2D GC data. 1D GC data were then adopted to correct the contour data along the 1D direction, while peak shapes along the 2D direction were preserved. The details of the algorithm will be presented in a separate paper.
Supplementary Information
Acknowledgements
The authors acknowledge the support from the National Institute for Occupational Safety and Health (NIOSH) via R01 OH011082-01A1 and the Office of the Director of National Intelligence (ODNI), Intelligence Advanced Research Projects Activity (IARPA), via IARPA FA8650-19-C-9101, and the National Institutes of Health via U18TR003812. The views and conclusions contained herein are those of the authors and should not be interpreted as necessarily representing the official policies or endorsements, either expressed or implied, of the ODNI, IARPA, or the U.S. Government. The U.S. Government is authorized to reproduce and distribute reprints for governmental purposes, notwithstanding any copyright annotation thereon. The authors acknowledge microfabrication aid from the Lurie Nanofabrication Facility at the University of Michigan.
Conflict of interest
The authors declare the following competing financial interest(s): the photoionization detector (PID) technology used in the article is licensed to Nanova, Blu Biotech, ChromX Health. X.F. is a co-inventor of this technology, and he also serves as a paid consultant to Nanova and ChromX Health.
Supplementary information
The online version contains supplementary material available at 10.1038/s41378-022-00452-5.
References
- 1.Wang J, et al. Compact prototype microfabricated gas chromatographic analyzer for autonomous determinations of VOC mixtures at typical workplace concentrations. Microsyst. Nanoeng. 2018;4:17101. doi: 10.1038/micronano.2017.101. [DOI] [Google Scholar]
- 2.Qin Y, Gianchandani YB. A fully electronic microfabricated gas chromatograph with complementary capacitive detectors for indoor pollutants. Microsyst. Nanoeng. 2016;2:15049. doi: 10.1038/micronano.2015.49. [DOI] [PMC free article] [PubMed] [Google Scholar]
- 3.Zhou M, et al. Rapid breath analysis for acute respiratory distress syndrome diagnostics using a portable two-dimensional gas chromatography device. Anal. Bioanal. Chem. 2019;411:6435–6447. doi: 10.1007/s00216-019-02024-5. [DOI] [PMC free article] [PubMed] [Google Scholar]
- 4.Sharma R, Zhou M, Hunter MD, Fan X. Rapid in situ analysis of plant emission for disease diagnosis using a portable gas chromatography device. J. Agric. Food Chem. 2019;67:7530–7537. doi: 10.1021/acs.jafc.9b02500. [DOI] [PubMed] [Google Scholar]
- 5.Regmi, B. P. & Agah, M. Micro gas chromatography: an overview of critical components and their integration. Anal. Chem.90, 13133–13150. 10.1021/acs.analchem.8b01461 (2018). [DOI] [PubMed]
- 6.Higgins Keppler EA, Jenkins CL, Davis TJ, Bean HD. Advances in the application of comprehensive two-dimensional gas chromatography in metabolomics. TrAC Trends Anal. Chem. 2018;109:275–286. doi: 10.1016/j.trac.2018.10.015. [DOI] [PMC free article] [PubMed] [Google Scholar]
- 7.Muscalu, A. M. & Górecki, T. Comprehensive two-dimensional gas chromatography in environmental analysis. TrAC – Trends Anal. Chem.106, 225–245. 10.1016/j.trac.2018.07.001 (2018).
- 8.Amaral, M. S. S. & Marriott, P. J. The blossoming of technology for the analysis of complex aroma bouquets—a review on flavour and odorant multidimensional and comprehensive gas chromatography applications. Molecules (Basel, Switzerland)24, 2080. 10.3390/molecules24112080 (2019). [DOI] [PMC free article] [PubMed]
- 9.Gruber, B. et al. Comprehensive two-dimensional gas chromatography in forensic science: a critical review of recent trends. TrAC – Trends Anal. Chemistry.105, 292–301. 10.1016/j.trac.2018.05.017 (2018).
- 10.Tranchida PQ, Purcaro G, Dugo P, Mondello L. Modulators for comprehensive two-dimensional gas chromatography. Trends Anal. Chem. 2011;30:1437–1461. doi: 10.1016/j.trac.2011.06.010. [DOI] [Google Scholar]
- 11.Edwards M, Mostafa A, Górecki T. Modulation in comprehensive two-dimensional gas chromatography: 20 years of innovation. Anal. Bioanal. Chem. 2011;401:2335–2349. doi: 10.1007/s00216-011-5100-6. [DOI] [PubMed] [Google Scholar]
- 12.Kim S-J, et al. Microfabricated thermal modulator for comprehensive two-dimensional micro gas chromatography: design, thermal modeling, and preliminary testing. Lab Chip. 2010;10:1647–1654. doi: 10.1039/c001390k. [DOI] [PubMed] [Google Scholar]
- 13.Serrano G, Paul D, Kim S-J, Kurabayashi K, Zellers ET. Comprehensive two-dimensional gas chromatographic separations with a microfabricated thermal modulator. Anal. Chem. 2012;84:6973–6980. doi: 10.1021/ac300924b. [DOI] [PubMed] [Google Scholar]
- 14.Whiting J, Sacks R. Selectivity enhancement for high-speed gc analysis of volatile organic compounds with portable instruments designed for vacuum-outlet and atmospheric-pressure inlet operation using air as the carrier gas. Anal. Chem. 2002;74:246–252. doi: 10.1021/ac010879g. [DOI] [PubMed] [Google Scholar]
- 15.Whiting JJ, et al. A high-speed, high-performance, microfabricated comprehensive two-dimensional gas chromatograph. Lab Chip. 2019;19:1633–1643. doi: 10.1039/C9LC00027E. [DOI] [PubMed] [Google Scholar]
- 16.Harynuk J, Górecki T. Comprehensive two-dimensional gas chromatography in stop-flow mode. J. Sep. Sci. 2004;27:431–441. doi: 10.1002/jssc.200301649. [DOI] [PubMed] [Google Scholar]
- 17.Sharif KM, Chin S-T, Kulsing C, Marriott PJ. The microfluidic Deans switch: 50 years of progress, innovation and application. Trends Anal. Chem. 2016;82:35–54. doi: 10.1016/j.trac.2016.05.005. [DOI] [Google Scholar]
- 18.Lee J, et al. Fully automated portable comprehensive 2-dimensional gas chromatography device. Anal. Chem. 2016;88:10266–10274. doi: 10.1021/acs.analchem.6b03000. [DOI] [PubMed] [Google Scholar]
- 19.Seeley JV, Micyus NJ, Bandurski SV, Seeley SK, McCurry JD. Microfluidic Deans switch for comprehensive two-dimensional gas chromatography. Anal. Chem. 2007;79:1840–1847. doi: 10.1021/ac061881g. [DOI] [PubMed] [Google Scholar]
- 20.Seeley JV. Recent advances in flow-controlled multidimensional gas chromatography. J. Chromatogr. A. 2012;1255:24–37. doi: 10.1016/j.chroma.2012.01.027. [DOI] [PubMed] [Google Scholar]
- 21.Seeley JV, Kramp F, Hicks CJ. Comprehensive two-dimensional gas chromatography via differential flow modulation. Anal. Chem. 2000;72:4346–4352. doi: 10.1021/ac000249z. [DOI] [PubMed] [Google Scholar]
- 22.Wang FC-Y. New valve switching modulator for comprehensive two-dimensional gas chromatography. J. Chromatogr. A. 2008;1188:274–280. doi: 10.1016/j.chroma.2008.02.104. [DOI] [PubMed] [Google Scholar]
- 23.Bueno PA, Jr., Seeley JV. Flow-switching device for comprehensive two-dimensional gas chromatography. J. Chromatogr. A. 2004;1027:3–10. doi: 10.1016/j.chroma.2003.10.033. [DOI] [PubMed] [Google Scholar]
- 24.Gholizadeh A, Chowdhury M, Agah M. Parallel ionic liquid semi-packed microfabricated columns for complex gas analysis. Anal. Chem. 2020;92:10635–10642. doi: 10.1021/acs.analchem.0c01721. [DOI] [PubMed] [Google Scholar]
- 25.Zhu H, et al. Flow-through microfluidic photoionization detectors for rapid and highly sensitive vapor detection. Lab Chip. 2015;15:3021–3029. doi: 10.1039/C5LC00328H. [DOI] [PubMed] [Google Scholar]
- 26.Li MWH, et al. High-sensitivity micro-gas chromatograph-photoionization detector for trace vapor detection. ACS Sens. 2021;6:2348–2355. doi: 10.1021/acssensors.1c00482. [DOI] [PubMed] [Google Scholar]
- 27.Matos, J. T. V., Duarte, R. M. B. O. & Duarte, A. C. Trends in data processing of comprehensive two-dimensional chromatography: state of the art. J. Chromatogr. B Analyt. Technol. Biomed. Life Sci.910, 31–45. 10.1016/j.jchromb.2012.06.039 (2012). [DOI] [PubMed]
Associated Data
This section collects any data citations, data availability statements, or supplementary materials included in this article.


