Abstract
Aberrant lipid metabolism is an early event in tumorigenesis and has been found in a variety of tumor types, especially prostate cancer (PCa). Therefore, We hypothesize that PCa can be stratified into metabolic subgroups based on glycolytic and cholesterogenic related genes, and the different subgroups are closely related to the immune microenvironment. Bioinformatics analysis of genomic, transcriptomic, and clinical data from a comprehensive cohort of PCa patients was performed. Datasets included the Cancer Genome Atlas (TCGA) and International Cancer Genome Consortium (ICGC) dataset, GSE70768, our previously published PCa cohort. The unsupervised cluster analysis was employed to stratify PCa samples based on the expression of metabolic-related genes. Four molecular subtypes were identified, named Glycolytic, Cholesterogenic, Mixed, and Quiescent. Each metabolic subtype has specific features. Among the 4 subtypes, the cholesterogenic subtype exhibited better median survival, whereas patients with high expression of glycolytic genes showed the shortest survival. The mitochondrial pyruvate carriers (MPC) 1 exhibited expression difference between PCa metabolic subgroups, but not for MPCs 2. Glycolytic subtypes had lower immune cell scores, while Cholesterogenic subgroups had higher immune cell scores. Our results demonstrated that metabolic classifications based on specific glycolytic and cholesterol-producing pathways provide new biological insights into previously established subtypes and may guide develop personalized therapies for unique tumor metabolism characteristics.
Keywords: immune infiltration, metabolic reprogramming, metabolic subgroup, PCa prognosis, PCa targeted therapy, prostate cancer, tumor microenvironment
1. Introduction
Prostate cancer (PCa) remains one of the main global health problems faced by men. The incidence of PCa in European and American populations is increasing year by year.[1] In the United States, Approximately 230,000 new cases of PCa are diagnosed every year, and about 195,000 radical prostatectomy procedures are performed.[2,3] According to American Cancer Society data, the relative survival rates for PCa patients compared to survival were 99%, 98%, and 96% at 5, 10, and 15 years, respectively.[4] Metastatic PCa causes over 30,000 deaths per year in the US and 350,000 deaths worldwide.[5,6] Therefore, Metastatic PCa is still the main cause of death in PCa patients and an important economic burden on the public health system. These data indicate that most patients with PCa have slow tumor growth and require only active monitoring, and only a very small number of patients with aggressive PCa require treatment to save lives.
Metabolic reprogramming of tumor cells is essential for them to adapt to the tumor microenvironment (TME) and maintain tumor growth.[7,8] Several studies demonstrated that the metabolic state and activity of immune cells seriously affect the proliferation and invasion of tumor cells.[9,10] The metabolic adaptability of tumor cells driven by oncogenes or inactivated tumor suppressors intrigues tumor development in the complex TME. Metabolic reprogramming of tumor cells is mainly characterized by overactive glycolysis and fatty acid synthesis. In many cancer types, key metabolic enzymes are upregulated, including PCa,[11] kidney cancer,[12] lung cancer,[13] and lymphoma.[14] However, the heterogeneity of different metabolic pathways and whether clinical results can be used to classify PCa into clinical subgroups have not yet been fully established. This study divided PCa into 4 subgroups based on the expression profiles of glycolysis and cholesterol-producing genes and studied the relationship between PCa subtypes and survival, mutation, and immune environment. And we may contribute to the prognostic stratification of PCa to enable customized treatment design and the development of new therapies by understanding how specific cellular tumor progression pathways better.
2. Materials and Methods
2.1. Data source
The data in this study are from our previous published PCa cohort[15] and the Cancer Genome Atlas (TCGA) database (https://www.cancer.gov/tcga), GEO (https://www.ncbi.nlm.nih.gov/geo/), International Cancer Genome Consortium (ICGC) (https://icgc.us/). The Standardized RNA data of 499 PCa samples were obtained from the TCGA website. The RNA sequence data of our PCa cohort was standardized by Z score, which included 64 PCa patients. The PCa-ICGC data of normalized read count values were downloaded from the ICGC website, and patients were primarily derived from a French population. The microarray datasets (GSE70768[16]) were downloaded from the GEO. As mentioned previously, the expressionprofile (FPKM/read count values) was transformed into TPMs (transcripts per kilobase million).[17] The somatic mutational data (CNVs, SNVs) was also downloaded.
2.2. Batch profile estimation and correction
We applied a normalization strategy to analyze the data from TCGA, GEO, ICGC, and our PCa cohort and deleted unnecessary changes as corrections. The “ComBat” method is used to eliminate the possibility of batch effects between different data sets due to non-biological technical biases.[18]
2.3. Metabolic subgrouping
To identify molecular subsets associated with PCa metabolism, the “REACTOME_GLYCOLYSIS” (n = 29) and “REACTOME_ Gene sets for the “CHOLESTEROL_BIOSYNTHESIS” (n = 72) pathway were retrieved from the molecular features database (Broad Institute’s Molecular Signature Database), which contained glycolysis and cholesterol synthesis related genes.[19] Subgroups were classified based on the expression levels of glycolytic and cholesterol-related genes using ConsensusClusterPlus v1.38.[20] Euclidean distance and hierarchical clustering with K = 5 are considered distance metrics and clustering algorithms, respectively. According to the median expression levels of glycolysis and cholesterol synthase genes in each sample, all patients were divided into 4 groups: quiescent subtype (glycolysis ≤ 0, cholesterol ≤ 0), glycolytic subtype (glycolysis > 0, cholesterol ≤ 0), cholesterogenic subtype (glycolysis ≤ 0, cholesterol > 0) and mixed subtype (glycolysis > 0, cholesterol > 0).
2.4. Survival analysis
In the subsequent prognostic analysis, we focused on the TCGA-PCa cohort, which has the most detailed clinical data. The survival rate of 4 PCa subtypes was compared using the Kaplan–Meier curves and Log-rank tests. The Kaplan–Meier curve was used to show the difference in survival rate, and a log-rank test was employed to test the significance of the difference in survival with the cutoff point <0.05.
2.5. Estimation of the level of immune cell infiltration in PCa
We used the ESTIMATE algorithm[21] to infer the level of immune cell infiltration of each PCa sample, including immune score, tumor purity, and stromal score. We used the Kruskal-Wallis method to examine the difference between PCa subtypes. A P value < .05 was defined as statistically significant.
2.6. The proportion of immune cell subpopulations in PCa subtypes
We applied the CIBERSORT algorithm[22] to infer the proportion of LM22 human immune cells in merged data. The 1000 permutations and P < .05 were set as inclusion criteria. The LM22 human cells among the 4 PCa subtypes were compared. The Kruskal–Wallis test was used to examine the difference among PCa subtypes. A P value < .05 was defined as statistically significant.
2.7. Gene set enrichment analysis
The gene enrichment analysis was employed to calculate the overall enrichment score in the meta-cohort.[23] The signature gene sets curated from c2/c5 were downloaded from Broad Institute’s Molecular Signature Database. Then we compared the KEGG pathway between glycolytic and cholesterogenic groups. According to the false discovery rate < 0.05, the more important enrichment pathways were identified.
2.8. Comparison with existing molecular subtypes
Several studies have indicated that the expression profiles of dozens of genes (a set of biomarkers) have been used to impute risk scores for PCa prognosis. Recently, individual genetic biomarkers have been overexpressed, including PCa-associated transcript 1 (PCAT1) or α-methylacyl-CoA racemase (AMACR), ETS gene fusion, and glutathione S- Transferase Pi 1 (GSTP1) is hypermethylated and used to stratify aggressive PCa.[24] According to the latest National Comprehensive Cancer Network PCa Guidelines, several clinically applicable expression profiles have been developed: the Prolaris (46 gene test) from Myriad Genetics Inc. and the 22 gene test from Decipher Inc., and the Genomic Prostate from Oncotype DX scores (17 genetic tests).[25,26] We compared our established model with the current PCa model using the AUC curve.
2.9. Mitochondrial pyruvate carrier (MPC)-related genes MPC1/2 correlate with metabolic subgroups
MPC genes encode 2 proteins, MPC1, and MPC2, which are dysregulated in a variety of tumors, including colon cancer,[27] kidney cancer,[12] and PCa,[11] and to closely related to prognosis. MPC can control the expression of mitochondrial pyruvate in tumor cells, thereby inhibiting the expression of MPC1 and MPC2, and promoting glycolytic activity and lactate production.[28] To explore the association between MPC1/2 and glycolysis-cholesterol synthesis phenotype, we compared the expression of 2 genes in the PCa metabolic subgroup.
2.10. Association between genomic mutation and molecular subtypes
The SNP and CNV data were obtained from PCa-TCGA, and identified in our PCa cohort samples. In every subgroup, the most genomic variation genes were exhibited using the heatmap. The mutation analysis was conducted using the R package “maftools,”[29] which calculates the mutation frequency of given genes and compares the most mutant genes between the glycolytic and cholesterogenic subtypes. P value < .05 was considered statistically significant.
3. Results
3.1. Identification of 4 phenotypes of PCa based on analysis of glycolytic and cholesterogenic gene expression
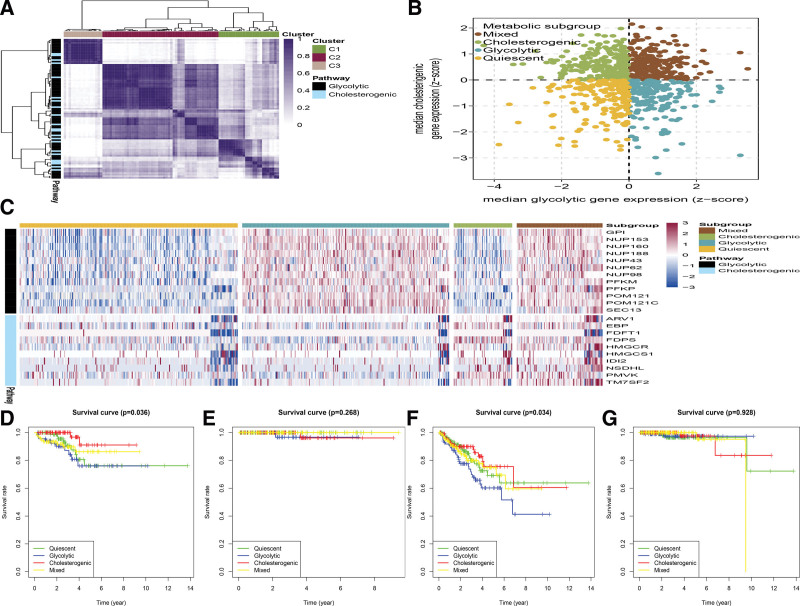
A total of 829 PCa tumor samples were included in the meta-cohort (TCGA PCa cohort, n = 499, ICGC PCa cohort, n = 142, GSE70768 PCa dataset, n = 123, and our previous PCa cohort, n = 65). The TCGA PCa cohort and our PCa cohort were merged to reduce the batch effects using the “ComBat” algorithm. The raw PCA for combined expression profile and combat PCA for combined expression profile was exhibited in Figure S1A and B, http://links.lww.com/MD/H799. The “Glycolysis” (n = 29) and “Cholesterol biosynthesis” (n = 72) gene sets are derived from the Reactome gene set.To detect the core genes of each pathway and correlate with PCa biology, an unsupervised consensus cluster analysis was conducted to stratify the 2 subtypes of significantly expressed glycolysis (n = 12) and cholesterol synthesis (n = 10) genes (Fig. 1A). The median expression of co-expressed cholesterol production and glycolysis genes in each sample was calculated. The median expression value of co-expressed metabolic-related genes in each sample was imputed. According to the co-expression of these 2 gene sets, the 4 metabolic subtypes of PCa were stratified, and we named quiescent, glycolytic, cholesterogenic, and mixed (Fig. 1B). The levels of genes associated with glycolysis and cholesterol biosynthesis, and the proportion of patients in each metabolic subgroup, are shown in Figure 1C. The mixed subgroup had the largest number of patients (233/829, 28.1%), followed by patients with cholesterol (226/829, 27.2%), glycolytic (192/829, 23.2%), and quiescent subtypes(178/829, 21.5%).
Figure 1.
The PCa tumors were stratified based on the expression of glycolysis and cholesterol-producing genes. (A) Heatmap exhibited consensus clustering solution (k = 5) for glycolytic and cholesterogenicrelated genes in PCa samples (n = 829). (B) Scatter plot exhibited median expression levels of co-expressedglycolytic (x-axis) and cholesterogenic (y-axis) genes in each PCa sample. According to the relative expression levels of glycolysis and cholesterol-producing genes, 4 metabolic subgroups were identified. (C) The heat map showed the expression levels of co-expressed glycolysis and cholesterol production genes in each subgroup. (D–G) Kaplan–Meier survival analysis of patients with DFI (D), DSS (E), PFI (F), and OS (G) PCa stratified by metabolic subgroup were exhibited. DFI = disease-free interval, DSS = disease-specific survival, OS = overall survival, PCa = prostate cancer, PFI = progression-free interval.
To uncover the correlation between PCa metabolic subtypes and patient’s prognosis, survival analysis for Disease-Free Survival, Disease-Specific Survival, Disease-Free Interval, Progression-Free Interval (PFI), and Overall Survival was performed in the TCGA cohort. The Kaplan–Meier analysis was employed to test the difference. There was no statistical significance in the distribution of metabolic subgroups in Overall Survival and Disease-Specific Survival. However, significant statistical significance in DFS/PFI was detected. Patients in the cholesterol group exhibited a better prognosis compared with patients in the glycolytic (Fig. 1D–G). A variety of metabolic phenotypes related to the glycolysis-cholesterol synthesis axis in PCa have been identified. Compared with tumors with high cholesterol production phenotypes with cholesterol synthesis and low glycolysis rate, they are less aggressive and resistant to chemotherapy, and more sensitive.
3.2. Clinical characteristics of metabolic subgroups
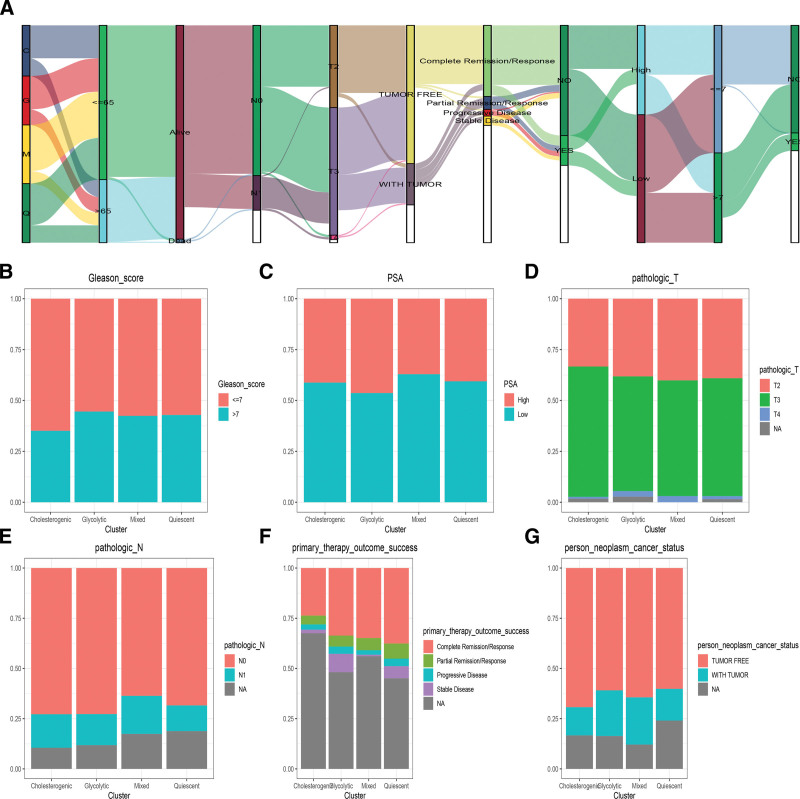
The correlation between Metabolic subgroups and Clinical characteristics is integrated into a module map (Fig. 2A).In terms of clinical features, the glycolytic and cholesterogenic subgroups were older population (Age < 65), the glycolytic had higher Gleason score and PSA score (Fig. 2B and C), Glycolytic and mixed subtypes has advanced pathologic T, N stage (Fig. 2D and E). During the follow-up, the glycolytic group has a higher percentage of stable disease and tumor-free (Fig. 2F and G).
Figure 2.
Clinical characteristics of Metabolic subgroups. The correlation between Metabolic subgroups and Clinical characteristics is integrated into a module map (A). The Stacked histogram was shown the association metabolic subgroups and Gleason score (B) and PSA score (C), pathologic T (D), N stage (E), primary therapy outcome success (F), and new tumor events (G).
3.3. Identification of PCa subtype-specific GO and KEGG terms
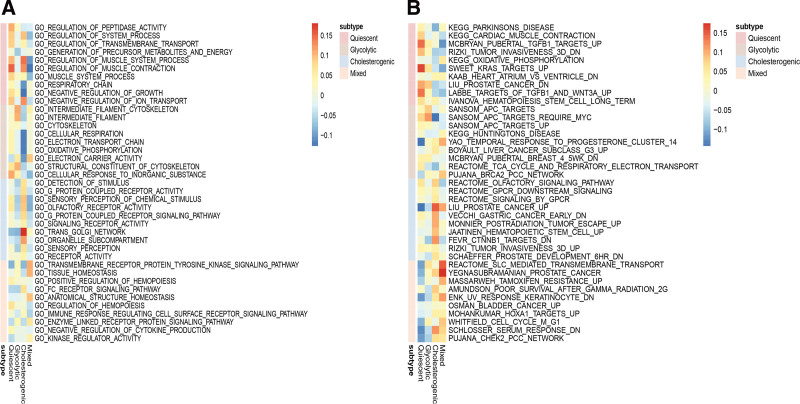
Gene enrichment analysis reveals distinct enriched up-regulated gene sets among the 4 metabolic subgroups. The glycolytic subtype was enriched in the cytoskeleton and oxidative phosphorylation structural constituent of the cytoskeleton. Olfactory receptor activity, signaling receptor activity, and receptor activity were highly activated in cholesterogenic subgroup. In contrast, Kinase regulator activity, anatomical structure homeostasis, and muscle system process were activated in the quiescent and mixed subtype (Fig. 3A). Generally, pathways related to cancer are highly active in the subgroup of glycolysis and cholesterol production. Multiple cancer-related pathways were identified that are hyperactivated in cholesterogenic and glycolytic subtypes, PCa, liver cancer, Rizki tumor invasiveness, and Schaeffer prostate development(Fig. 3B).
Figure 3.
Screen of PCa subtype-specific up-regulated GO (A) and KEGG (B) among 4 metabolic subtypes using the GSEA method in the TCGA dataset. GSEA = gene enrichment analysis, PCa = prostate cancer.
3.4. The expression levels of MPC varied among the metabolic subgroups
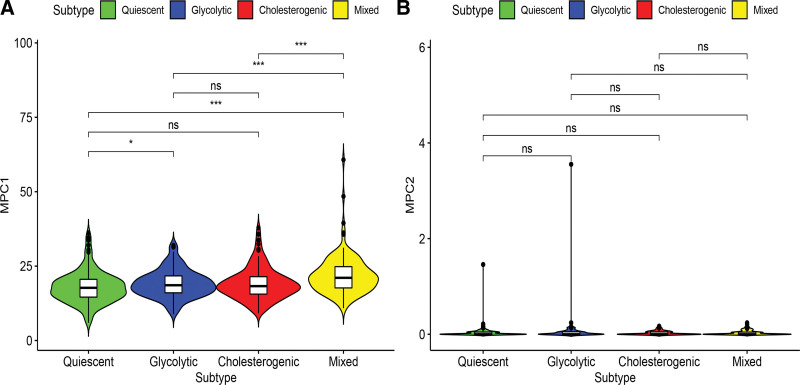
The main function of the mitochondrial pyruvate carrier (MPC) complex on the inner mitochondrial membrane is to transfer free pyruvate from the cytoplasm to the mitochondrial matrix.[30] Previous studies have shown that MPC1 and MPC2 are different in metabolic pathways and can promote tumor glycolytic activity. This variation exerts a vital role in the production of lactic acid.[31,32] The mRNA levels of MPC1 significantly differed among the metabolic subtypes, but not for MPC2 (Fig. 4A). MPC1 expression was relatively higher in the glycolytic group, while MPC2 expression levels generally show lower expression levels in the metabolic subgroup. In the cholesterol group, MPC1 expression was relatively higher than that in the quiescent and glycolytic group (Fig. 4B). Therefore, we can infer that dysregulation of MPC may be related to the metabolic tumor subtypes of PCa.
Figure 4.
Relation of MPC1 (A) and MPC2 (B) expressions with PCa metabolic subgroups. MPC = mitochondrial pyruvate carrier, PCa = prostate cancer.
3.5. Association between genomic variation and molecular subtypes
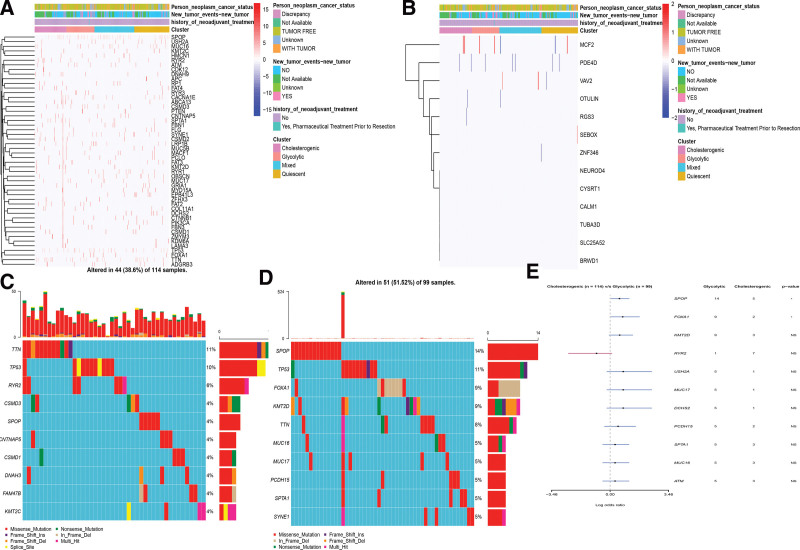
To uncover the genomic variation with different metabolic phenotypes, the SNP, CNV, and metabolic subgroups with altered mRNA expression in these genes were evaluated. The CNVs/SNP differed significantly among the metabolic subgroups (Fig. 5A and B). The PCa subtype-specific gene mutations were explored between the cholesterogenic and glycolytic subtypes (Fig. 5C and D). Highly mutated genetic profiles were also exhibited. TP53, TTN, and RYR2 were the most frequently mutated genes in the cholesterogenic subtype, while TP53, SPOP, and FOXA1 were observed in the glycolytic subtype. The SPOP and FOXA1 showed high mutation frequency in the glycolytic subtype, with cutoff points < 0.05 (Fig. 5E).
Figure 5.
The landscape of mutations among PCa metabolic subgroups.This heat map showed the distribution of somatic mutation (SNP) (A) and CNV (B) events that affected frequently mutated genes across metabolic subgroups in PCa. (C) Mutation analysis between the glycolytic and cholesterogenic subsets. (D) Gene mutation map of highly mutated genes between the 2 subtypes. (E) The forest plot exhibited a comparison of gene mutations between the 2 subtypes (*P: .1, **P: .05, ns: not significant). PCa = prostate cancer.
3.6. Relationship between metabolic subtype tumor genome and immune microenvironment
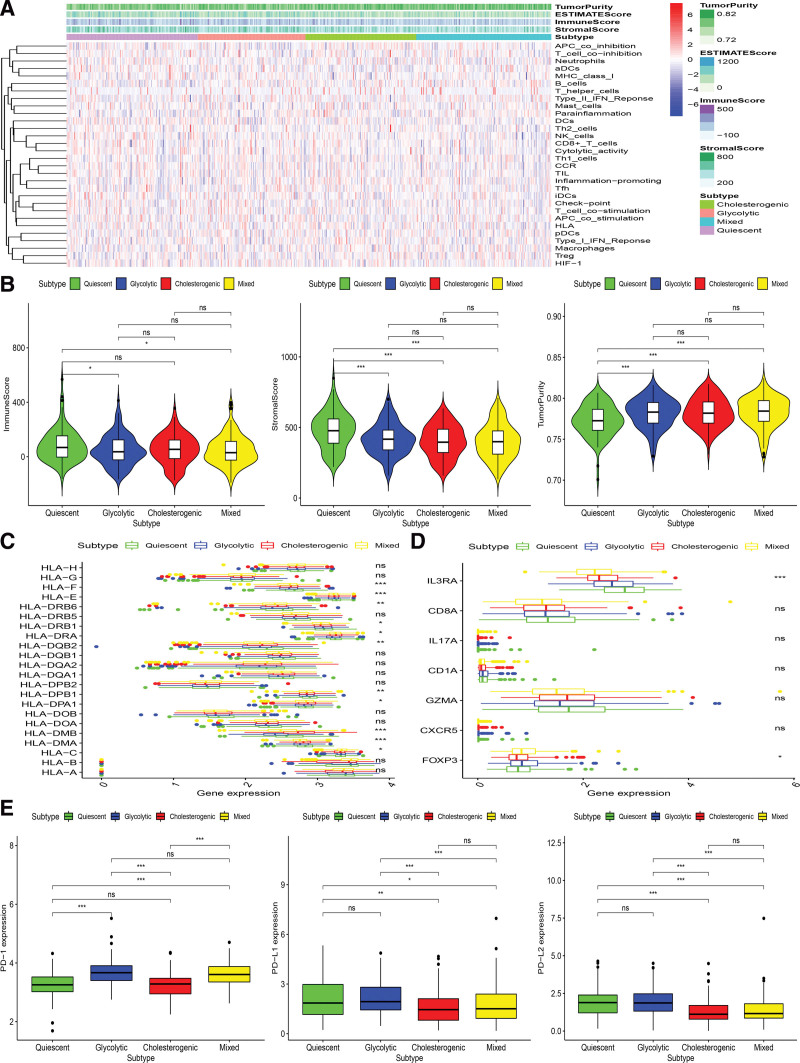
Metabolic reprogramming is closely related to the immune environment. We observed markedly abnormal expression of metabolic genes in PCa patients. To uncover the association between metabolic subtypes and immune environment, the ssgene enrichment analysis method was employed to impute the enrichment score of immune cells in tumor samples based on a set of 29 immune-related genes (Fig. 6A). The stroma scores and the immune scores in the Glycolytic and Quiescent subset were significantly higher, while the tumor purity in the Cholesterogenic and Mixed subset was significantly higher (Kruskal–Wallis test, P < .05) (Fig. 6B).
Figure 6.
Immune environment landscape across metabolic subgroup of PCa. The heatmap showing the distribution of immune cell infiltration in PCa across the metabolic subtypes (A). Association between 4 metabolic groups and the Stromal Score, Immune Score, and Tumor Purity (B), HLA related genes (C), immune cell subpopulation marker genes (D), PD-1, PD-L1, and PD-L2 (E). HLA = human leukocyte antigen-presenting, PCa = prostate cancer.
The relation between metabolic subtypes and human leukocyte antigen-presenting was also assessed, and results indicated that significantly higher expression in Glycolytic and Quiescent and lower expression in Cholesterogenic and Mixed (Kruskal-Wallis test, P < .05, Fig. 6C). Expression levels of immune cell marker genes such as IL3RA (pDC), IL-17 (Th17 cells), FOXP3 (Treg), CXCR5 (Tfh cells), CD1A (iDC), and CD8A (cytotoxic T cells)[33] showed the same trend, which was highest in glycolytic group and lowest in Cholesterogenic group (Fig. 6D). These findings also proved that Glycolytic obtains a higher concentration of immune cell infiltration.
The expression levels of PD1 (benzoate dehydratase 1), PD-L1 (programmed death-ligand 1), and PD-L2 (programmed death-ligand 2) were also explored among 4 PCa subtypes in meta-cohort. The findings demonstrated that the expression levels of PD-L1, PD1, and PD-L2 were higher in the glycolysis group, while the relative expression levels of PD-L1, PD1, and PD-L2 were lower in the cholesterol group (Kruskal–Wallis test, P < .05) (Fig. 6E). Based on the above research results, we speculated that the glycolytic subtype may respond better to PD-L1 immunotherapy because PD-1/PD-L1 are usually positively associated with the immune response in the body.[34]
3.7. Identification of PCa subtype-specific networks
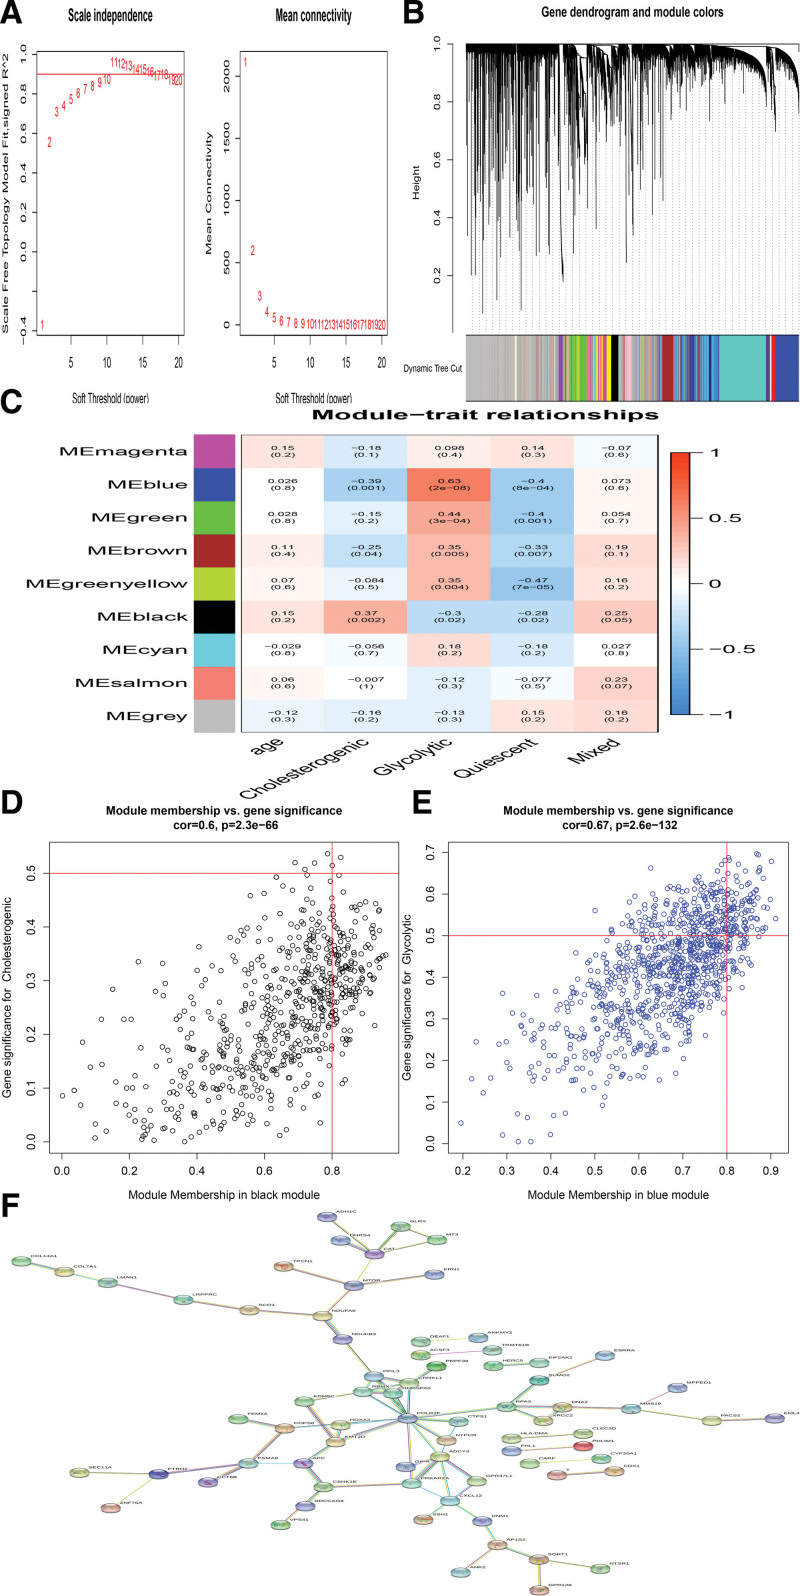
A weighted gene co-expression network was constructed based on the PCa samples by WGCNA algorithm,[35] and a set of gene modules was recognized to be associated with previously identified highly expressed genes. We identified several gene modules that significantly distinguish PCa by metabolic subtype and age (Fig. 7A and B). WGCNA produced a gene module (black) that was significantly related to the cholesterol subgroup, and the Blue module was highly positively related to the Glycolytic subgroup (Fig. 7C–E). The key genes were identified with the cutoff points of Gene GS > 0.5 and Gene MM > 0.8.[36] A total of 192 hub genes were identified in the Black and Blue module, including 3 transcription factor genes, that is, ESRRA, KDM5C, and SUMO2 (Fig. 7F).
Figure 7.
The weighted gene correlation network analysis (WGCNA). (A). better soft threshold was identified. (B). Gene dendrogram and module colors using WGCA method. (C).The WGCNA analysis exhibited that 2 sets of genes (modules) significantly correlated with glycolytic and cholesterogenic subsets. (D and E). Module membership versus gene significance was plotted in glycolytic and cholesterogenic subsets. (F).The identification of PCa subtype-specific networks.
3.8. Comparison between metabolic subtypes and previous PCa subtypes
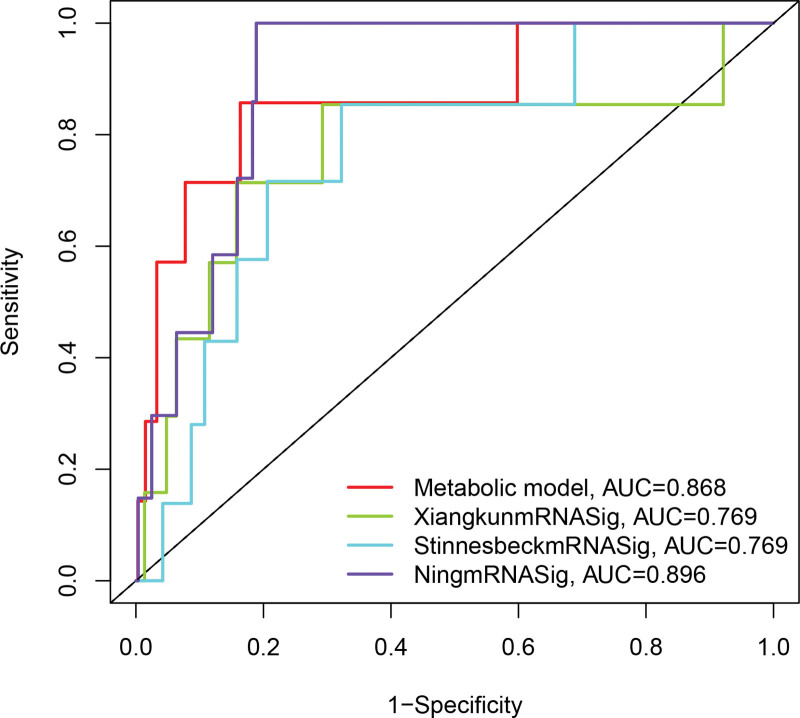
We further compared the predictive performance of metabolic subtypes (defined as metabolicSig) with 3 features recently obtained from Stinnesbeck’s study (referred to as StinnesbeckmRNASig),[37] 9 mRNA signature obtained from Xiangkun’s study (defined as XiangkunmRNASig)[38] and 4-mRNA signature derived from Ning’s study (referred to as NingmRNASig)[39] using the same TCGApatient cohort. As shown in Figure 8, the AUC of metabolic Sig at 3 years of PFI was 0.868, which was significantly higher than XiangkunmRNASig (AUC = 0.769) and StinnesbeckmRNASig (AUC = 0.769), but lower than NingmRNASig (AUC = 0.896). These results suggest that metabolicSig has better prognostic performance in predicting survival than the 2 recently published mRNA markers.
Figure 8.
The ROC analysis at 3 years of overall survival for the metabolicSig, StinnesbeckmRNASig, XiangkunmRNASig, and NingmRNASig.
4. Discussion
Although about 3-quarters of U.S. PCa patients are already in the localized stage at diagnosis, an increasing number of men are being diagnosed with distant-stage PCa. Survival rates for distant PCa have improved, but less than one-third of men survive 5 years after diagnosis.[40] The large differences in the incidence and treatment of PCa may be due to its genomic instability and changes in various PCa-related risk factors. Therefore, it is an urgent scientific problem to explore the potential molecular mechanism of PCa occurrence and development to seek more effective diagnosis and treatment strategies. The assessment of metabolic genes is expected to be a useful tool for studying the abnormal metabolism of cancer cells. In the process of tumorigenesis and development, metabolic pathways usually adapt to malignant tumors through metabolic reorganization, and the accompanying TME plays an important role in cancer progression. In the process of glycolysis and metabolism, cancer cells produce enough ATP to promote the proliferation of cancer cells.[41] Several studies reported that a higher percentage of malignant tissues exhibited higher glycolytic properties in multiple tumors, especially in PCa.[42] Jiajia Hu et al reported that PCa cells may metabolize glucose as an energy source to activate a series of bioenergy pathways, among which glucose and glycolysis play an essential role in the growth of prostate cells.[43] The metabolic balance control of PCa cells was changed, and the biosynthesis of endogenous cholesterol was increased, which accumulated in tumor cells.[44] PCa and obesity adipose tissue is an active endocrine tissue that can regulate the metabolic activity of the prostate and affect cancer, especially the development of tumors. Both PCa and obese adipose tissue were relatively active endocrine tissues, which can regulate the metabolic activity of the prostate and affect the development of cancer, especially the development of tumors.[44,45] Therefore, elucidation of the metabolic pathways associated with PCa is essential for prevention and treatment.
Continued understanding of clinically relevant tumor subtypes is needed to accelerate the development of PCa personalized therapy. In the current study, PCa shows a distinct metabolic profile associated with the expression levels of genes involved in glycolysis and cholesterol synthesis, 2 biological processes that affected the prognosis of PCa. Four metabolic subtypes were identified based on glycolytic and cholesterol production pathways that are related to survival. Each metabolic subtype has specific characteristics. We also found that genes related to glycolysis and cholesterol production closely correlated with the expression of PCa-specific oncogenes, and these findings provide a deeper understanding of the metabolic vulnerability of PCa isoforms when applied to target aggressive tumors.
Glycolysis can promote tumor development and is associated with immune escape and chemotherapy resistance, which may partly explain the underlying mechanism leading to adverse outcomes in the glycolysis group.[46] In the process of glycolysis, aerobic glycolysis enters tumor cells to provide stable energy for the growth of tumor cells.[47] Several studies indicated that the growth of tumors is highly dependent on glycolysis. Therefore, inhibitors including glycolytic enzymes and metabolic regulators that target glycolysis can effectively inhibit cell proliferation.[48,49] Tumor cells activated M2-TAM through lactate (a glycolytic product) through a bystander effect, which further intrigued PD-L1/PD-1 signaling-mediated immune escape. Therefore, tumor-specific aerobic glycolysis is expected to become a potential therapeutic target for tumor therapy. In the study, our results indicated that PCa metabolic subtypes with higher expression of glycolysis genes but lower expression of cholesterol-producing genes seemed to be more aggressive and more aggressive, and sensitive to chemotherapy because we have observed that this subgroup has a poor prognosis. Our research also shows that there are a variety of metabolic phenotypes related to glycolysis and cholesterol synthesis in PCa. Research suggested that glycolysis in tumors is significantly associated with the TME.[50–52] Hypoxia in the TME means that tumor cells rely on increased glycolysis to meet their energy needs. Several studies reported that accelerated glycolysis satisfied the need for the rapid proliferation of cancer cells and provided a favorable microenvironment for tumor progression.[50,53] In the study, our findings supported that altered gene expression along the glycolysis-cholestanol synthesis axis is linked with immune infiltration in PCa. However, our study has several limitations. Firstly, the prognosis of the patients analyzed in this study may not only depend on metabolic subgroups. It may be influenced by other genetic factors not considered in this study, such as germline mutations that cause PCa and affect prognosis and treatment.[54] Secondly, Our findings are mainly predicted by RNA sequencing and have not yet been used clinically. Thirdly, because current risk stratification models that can predict oncological outcomes cannot accurately describe the prognosis of every patient and every stage of the disease, there is a need for testing tools and treatments that are personalized and precise.
In conclusion, these findings reaffirm the important role of cholesterol metabolism in the biology of PCa, especially in patients with poor immunotherapy. We proved that the genes involved in cholesterol synthesis are highly expressed in tumor tissues of some PCa patients, and the prognosis showed better, confirming the correlation between cholesterol production and the progression and classification of PCa.
Author contribution
Y.W.Y; J.K.S; Q.H.W wrote the main manuscript text. Y.W.Y; J.K.S prepared Figures 1-8. Y.W.Y; J.K.S contributed to data analysis. All authors reviewed the manuscript.
Data curation: Jukun Song.
Formal analysis: Yiwen Yuan, Jukun Song.
Writing – original draft: Yiwen Yuan, Jukun Song, Qinghua Wu.
Writing – review & editing: Yiwen Yuan.
Acknowledgments
All authors thank the family for participating in the study. No sources of funding were required for this work.
Supplementary Material
Abbreviations:
- ICGC =
- international cancer genome consortium
- MPC =
- mitochondrial pyruvate carrier
- PCa =
- prostate cancer
- PFI =
- progression-free interval
- TCGA =
- the cancer genome atlas
- TME =
- tumor microenvironment
The datasets generated during and/or analyzed during the current study are publicly available.
Supplemental Digital Content is available for this article.
The authors have no conflicts of interest to disclose.
This work was supported by Top Talent Support Program for young and middle-aged people of Wuxi Health Committee (NO. BJ2020048), the Maternal and Child Research Project of Wuxi Health Committee (NO. FYKY201902) and the Project of Transforming Medicine Institution of Wuxi (NO. LCYJ202221).
How to cite this article: Yuan Y, Song J, Wu Q. Aberrant gene expression pattern in the glycolysis-cholesterol synthesis axis Is linked with immune infiltration and prognosis in Prostate Cancer: A bioinformatics analysis. Medicine 2022;101:43(e31416).
References
- [1].Chen YL, Chao TT, Wu YN, et al. nNOS-positive minor-branches of the dorsal penile nerves is associated with erectile function in the bilateral cavernous injury model of rats. Sci Rep. 2018;8:929. [DOI] [PMC free article] [PubMed] [Google Scholar]
- [2].Siegel RL, Miller KD, Jemal A. Cancer statistics, 2020. CA Cancer J Clin. 2020;70:7–30. [DOI] [PubMed] [Google Scholar]
- [3].Jemal A, Bray F, Center MM, et al. Global cancer statistics. CA Cancer J Clin. 2011;61:69–90. [DOI] [PubMed] [Google Scholar]
- [4].Talkar SS, Patravale VB. Gene therapy for prostate cancer: a review. Endocr Metab Immune Disord Drug Targets. 2020. [DOI] [PubMed] [Google Scholar]
- [5].Siegel RL, Miller KD, Fuchs HE, et al. Cancer statistics, 2021. CA Cancer J Clin. 2021;71:7–33. [DOI] [PubMed] [Google Scholar]
- [6].Zhang X. Interactions between cancer cells and bone microenvironment promote bone metastasis in prostate cancer. Cancer Commun (Lond). 2019;39:76. [DOI] [PMC free article] [PubMed] [Google Scholar]
- [7].Tomasetti M, Monaco F, Manzella N, et al. MicroRNA-126 induces autophagy by altering cell metabolism in malignant mesothelioma. Oncotarget. 2016;7:36338–52. [DOI] [PMC free article] [PubMed] [Google Scholar]
- [8].Yu L, Chen X, Sun X, et al. The glycolytic switch in tumors: how many players are involved? J Cancer. 2017;8:3430–40. [DOI] [PMC free article] [PubMed] [Google Scholar]
- [9].Schafer CC, Wang Y, Hough KP, et al. Indoleamine 2,3-dioxygenase regulates anti-tumor immunity in lung cancer by metabolic reprogramming of immune cells in the tumor microenvironment. Oncotarget. 2016;7:75407–24. [DOI] [PMC free article] [PubMed] [Google Scholar]
- [10].Ma X, Bi E, Lu Y, et al. Cholesterol induces CD8(+) T cell exhaustion in the tumor microenvironment. Cell Metab. 2019;30:143–156 e145. [DOI] [PMC free article] [PubMed] [Google Scholar]
- [11].Li C, He C, Xu Y, et al. Alternol eliminates excessive ATP production by disturbing Krebs cycle in prostate cancer. Prostate. 2019;79:628–39. [DOI] [PMC free article] [PubMed] [Google Scholar]
- [12].Linehan WM, Ricketts CJ. The metabolic basis of kidney cancer. Semin Cancer Biol. 2013;23:46–55. [DOI] [PMC free article] [PubMed] [Google Scholar]
- [13].Liu KT, Yeh IJ, Chou SK, et al. Regulatory mechanism of fatty acidCoA metabolic enzymes under endoplasmic reticulum stress in lung cancer. Oncol Rep. 2018;40:2674–82. [DOI] [PubMed] [Google Scholar]
- [14].Han X, Zheng T, Foss FM, et al. Genetic polymorphisms in the metabolic pathway and non-Hodgkin lymphoma survival. Am J Hematol. 2010;85:51–6. [DOI] [PMC free article] [PubMed] [Google Scholar]
- [15].Ren S, Wei GH, Liu D, et al. Whole-genome and transcriptome sequencing of prostate cancer identify new genetic alterations driving disease progression. Eur Urol. 2018;73:322–39. [DOI] [PubMed] [Google Scholar]
- [16].Ross-Adams H, Lamb AD, Dunning MJ, et al. Integration of copy number and transcriptomics provides risk stratification in prostate cancer: a discovery and validation cohort study. EBioMedicine. 2015;2:1133–44. [DOI] [PMC free article] [PubMed] [Google Scholar]
- [17].Wagner GP, Kin K, Lynch VJ. Measurement of mRNA abundance using RNA-seq data: RPKM measure is inconsistent among samples. Theory Biosci. 2012;131:281–5. [DOI] [PubMed] [Google Scholar]
- [18].Johnson WE, Li C, Rabinovic A. Adjusting batch effects in microarray expression data using empirical Bayes methods. Biostatistics. 2007;8:118–27. [DOI] [PubMed] [Google Scholar]
- [19].Liberzon A, Subramanian A, Pinchback R, et al. Molecular signatures database (MSigDB) 3.0. Bioinformatics. 2011;27:1739–40. [DOI] [PMC free article] [PubMed] [Google Scholar]
- [20].Wilkerson MD, Hayes DN. ConsensusClusterPlus: a class discovery tool with confidence assessments and item tracking. Bioinformatics. 2010;26:1572–3. [DOI] [PMC free article] [PubMed] [Google Scholar]
- [21].Yoshihara K, Shahmoradgoli M, Martinez E, et al. Inferring tumour purity and stromal and immune cell admixture from expression data. Nat Commun. 2013;4:2612. [DOI] [PMC free article] [PubMed] [Google Scholar]
- [22].Newman AM, Liu CL, Green MR, et al. Robust enumeration of cell subsets from tissue expression profiles. Nat Methods. 2015;12:453–7. [DOI] [PMC free article] [PubMed] [Google Scholar]
- [23].Subramanian A, Tamayo P, Mootha VK, et al. Gene set enrichment analysis: a knowledge-based approach for interpreting genome-wide expression profiles. Proc Natl Acad Sci USA. 2005;102:15545–50. [DOI] [PMC free article] [PubMed] [Google Scholar]
- [24].Liu Y. The context of prostate cancer genomics in personalized medicine. Oncol Lett. 2017;13:3347–53. [DOI] [PMC free article] [PubMed] [Google Scholar]
- [25].Kristiansen G. Markers of clinical utility in the differential diagnosis and prognosis of prostate cancer. Mod Pathol. 2018;31:S143–155. [DOI] [PubMed] [Google Scholar]
- [26].Sboner A, Demichelis F, Calza S, et al. Molecular sampling of prostate cancer: a dilemma for predicting disease progression. BMC Med Genomics. 2010;3:8. [DOI] [PMC free article] [PubMed] [Google Scholar]
- [27].Watanabe J, Ishibe A, Suwa Y, et al. Hernia incidence following a randomized clinical trial of single-incision versus multi-port laparoscopic colectomy. Surg Endosc. 2020. [DOI] [PubMed] [Google Scholar]
- [28].Tompkins SC, Sheldon RD, Rauckhorst AJ, et al. Disrupting mitochondrial pyruvate uptake directs glutamine into the TCA cycle away from glutathione synthesis and impairs hepatocellular tumorigenesis. Cell Rep. 2019;28:2608–2619 e2606. [DOI] [PMC free article] [PubMed] [Google Scholar]
- [29].Mayakonda A, Koeffler HP. Maftools: efficient analysis, visualization and summarization of MAF files from large-scale cohort based cancer studies. BioRxiv. 2016:052662. [Google Scholar]
- [30].Zhong Y, Li X, Yu D, et al. Application of mitochondrial pyruvate carrier blocker UK5099 creates metabolic reprogram and greater stem-like properties in LnCap prostate cancer cells in vitro. Oncotarget. 2015;6:37758–69. [DOI] [PMC free article] [PubMed] [Google Scholar]
- [31].Zhong PC, Shu R, Wu HW, et al. Altered gene expression in glycolysis-cholesterol synthesis axis correlates with outcome of triple-negative breast cancer. Exp Biol Med (Maywood). 2020:1535370220975206. [DOI] [PMC free article] [PubMed] [Google Scholar]
- [32].Bensard CL, Wisidagama DR, Olson KA, et al. Regulation of tumor initiation by the mitochondrial pyruvate carrier. Cell Metab. 2020;31:284–300 e287. [DOI] [PMC free article] [PubMed] [Google Scholar]
- [33].Bindea G, Mlecnik B, Tosolini M, et al. Spatiotemporal dynamics of intratumoral immune cells reveal the immune landscape in human cancer. Immunity. 2013;39:782–95. [DOI] [PubMed] [Google Scholar]
- [34].Patel SP, Kurzrock R. PD-L1 expression as a predictive biomarker in cancer immunotherapy. Mol Cancer Ther. 2015;14:847–56. [DOI] [PubMed] [Google Scholar]
- [35].Langfelder P, Horvath S. WGCNA: an R package for weighted correlation network analysis. BMC Bioinf. 2008;9:559. [DOI] [PMC free article] [PubMed] [Google Scholar]
- [36].Pan S, Zhan Y, Chen X, et al. Identification of biomarkers for controlling cancer stem cell characteristics in bladder cancer by network analysis of transcriptome data stemness indices. Front Oncol. 2019;9:613. [DOI] [PMC free article] [PubMed] [Google Scholar]
- [37].Stinnesbeck M, Kristiansen A, Ellinger J, et al. Prognostic role of TSPAN1, KIAA1324 and ESRP1 in prostate cancer. APMIS. 2021. [DOI] [PMC free article] [PubMed] [Google Scholar]
- [38].Wu X, Lv D, Eftekhar M, et al. A new risk stratification system of prostate cancer to identify high-risk biochemical recurrence patients. Transl Androl Urol. 2020;9:2572–86. [DOI] [PMC free article] [PubMed] [Google Scholar]
- [39].Xu N, Wu YP, Yin HB, et al. Molecular network-based identification of competing endogenous RNAs and mRNA signatures that predict survival in prostate cancer. J Transl Med. 2018;16:274. [DOI] [PMC free article] [PubMed] [Google Scholar]
- [40].Siegel DA, O’Neil ME, Richards TB, et al. Prostate cancer incidence and survival, by stage and race/ethnicity—United States, 2001-2017. MMWR Morb Mortal Wkly Rep. 2020;69:1473–80. [DOI] [PMC free article] [PubMed] [Google Scholar]
- [41].Zhang Z, Tan X, Luo J, et al. The miR-30a-5p/CLCF1 axis regulates sorafenib resistance and aerobic glycolysis in hepatocellular carcinoma. Cell Death Dis. 2020;11:902. [DOI] [PMC free article] [PubMed] [Google Scholar]
- [42].Warmoes MO, Locasale JW. Heterogeneity of glycolysis in cancers and therapeutic opportunities. Biochem Pharmacol. 2014;92:12–21. [DOI] [PMC free article] [PubMed] [Google Scholar]
- [43].Hu J, Lei H, Fei X, et al. NES1/KLK10 gene represses proliferation, enhances apoptosis and down-regulates glucose metabolism of PC3 prostate cancer cells. Sci Rep. 2015;5:17426. [DOI] [PMC free article] [PubMed] [Google Scholar]
- [44].Di Francesco S, Robuffo I, Caruso M, et al. Metabolic alterations, aggressive hormone-naive prostate cancer and cardiovascular disease: a complex relationship. Medicina (Kaunas). 2019;55. [DOI] [PMC free article] [PubMed] [Google Scholar]
- [45].Figiel S, Pinault M, Domingo I, et al. Fatty acid profile in peri-prostatic adipose tissue and prostate cancer aggressiveness in African-Caribbean and Caucasian patients. Eur J Cancer. 2018;91:107–15. [DOI] [PubMed] [Google Scholar]
- [46].Shan T, Chen S, Chen X, et al. M2TAM subsets altered by lactic acid promote Tcell apoptosis through the PDL1/PD1 pathway. Oncol Rep. 2020;44:1885–94. [DOI] [PMC free article] [PubMed] [Google Scholar]
- [47].Zhu G, Wang D, Li S, et al. Acute effect of lactic acid on tumor-endothelial cell metabolic coupling in the tumor microenvironment. Oncol Lett. 2016;12:3478–84. [DOI] [PMC free article] [PubMed] [Google Scholar]
- [48].Alhallak K, Rebello LG, Muldoon TJ, et al. Optical redox ratio identifies metastatic potential-dependent changes in breast cancer cell metabolism. Biomed Opt Express. 2016;7:4364–74. [DOI] [PMC free article] [PubMed] [Google Scholar]
- [49].Zhang J, Zhang J, Wei Y, et al. ACTL6A regulates follicle-stimulating hormone-driven glycolysis in ovarian cancer cells via PGK1. Cell Death Dis. 2019;10:811. [DOI] [PMC free article] [PubMed] [Google Scholar]
- [50].Chen S, Cao G, Wu W, et al. Mining novel cell glycolysis related gene markers that can predict the survival of colon adenocarcinoma patients. Biosci Rep. 2020;40. [DOI] [PMC free article] [PubMed] [Google Scholar]
- [51].Jiang Z, Liu Z, Li M, et al. Increased glycolysis correlates with elevated immune activity in tumor immune microenvironment. EBioMedicine. 2019;42:431–42. [DOI] [PMC free article] [PubMed] [Google Scholar]
- [52].Zhang Y, Yu G, Chu H, et al. Macrophage-associated PGK1 phosphorylation promotes aerobic glycolysis and tumorigenesis. Mol Cell. 2018;71:201–215 e207. [DOI] [PubMed] [Google Scholar]
- [53].Kim SL, Lee ST, Min IS, et al. Lipocalin 2 negatively regulates cell proliferation and epithelial to mesenchymal transition through changing metabolic gene expression in colorectal cancer. Cancer Sci. 2017;108:2176–86. [DOI] [PMC free article] [PubMed] [Google Scholar]
- [54].Crocetto F, Barone B, Caputo VF, et al. BRCA germline mutations in prostate cancer: the future is tailored. Diagnostics (Basel). 2021;11. [DOI] [PMC free article] [PubMed] [Google Scholar]
Associated Data
This section collects any data citations, data availability statements, or supplementary materials included in this article.


