


ABSTRACT
Aims
This study investigated the association of capillary blood glucose (CBG)‐assessed time in range (TIR) (3.9–10.0 mmol/L) with insulin sensitivity and islet β‐cell function.
Materials and Methods
We recruited 455 patients with type 2 diabetes mellitus. Seven‐point glucose‐profile data (pre‐ and 120 min post‐main meals, bedtime) were collected over three consecutive days. Plasma glucose and serum insulin concentrations were measured at 0, 60, and 120 min after a 100 g standard steamed bread meal test. The homeostasis model assessment of insulin resistance (HOMA‐IR) and Matsuda index were computed to evaluate insulin resistance. The HOMA of β‐cell function (HOMA‐β) and the area under the curve between insulin and blood glucose (IAUC0−120/GAUC0−120) were used to estimate β‐cell function.
Results
TIR was positively correlated with the 60 and 120 min insulin values, IAUC0−120, the Matsuda index, HOMA‐β, and IAUC0−120/GAUC0−120 (r s: 0.154, 0.129, 0.137, 0.194, 0.341, and 0.334, respectively; P < 0.05) but inversely correlated with HOMA‐IR (r s: –0.239, P < 0.001). After adjusting for confounders, multinomial multiple logistic regression analysis revealed that the odds ratios (ORs) of achieving the target time in range (>70%) increased by 12% (95% confidence interval [CI]: 3–21%), 7% (95% CI: 1–14%), 10% (95% CI: 5–16%), and 45% (95% CI: 25–68%) for each 10 mIU/L increase in the 60 and 120 min insulin values, 10 unit increase in HOMA‐β, and unit increase in IAUC0−120/GAUC0−120, respectively (P < 0.05). Nevertheless, the OR decreased by 10% (95% CI: 1–18%) for each unit increase in HOMA‐IR (P < 0.05).
Conclusions
Insulin resistance and islet β‐cell function are related to capillary blood glucose‐assessed TIR.
Keywords: Insulin resistance, Time in range, β‐Cell function
1. To our knowledge this is the first study looking at insulin resistance and TIR in patients with T2DM. 2. Insulin resistance is negatively correlated with TIR in patients with T2DM 3. Impaired ‐cell function has negative effects on TIR in patients with T2DM

INTRODUCTION
Hemoglobin A1c (HbA1c) is the gold standard for evaluating glycemic control in clinical practice, despite certain limitations. HbA1c is not a reliable indicator for patients with anemia, hemoglobinopathy, or pregnancy 1 . Moreover, it can only reflect the average blood glucose status 2–3 months before detection; hence, it fails to provide relevant information regarding fluctuations in daily blood glucose control 2 , 3 . Continuous glucose monitoring (CGM) devices, which capture blood glucose fluctuations over several days, are currently the optimal technology for reflecting a patient's recent blood glucose fluctuations. With the wide application of CGM in recent years, several parameters reflecting blood‐glucose variability have emerged. Time in range (TIR) is one of the important parameters; it refers to the percentage of time spent with the blood glucose concentration within the target blood glucose range, usually 3.9–10.0 mmol/L, within 24 h 1 , 4 . As a novel measurement for blood glucose variability, TIR is a suitable supplement to HbA1c. It is potentially useful in adjusting the effect of hemoglobin change on HbA1c 4 . Moreover, some studies have found TIR to be linearly correlated with HbA1c 5 , 6 , 7 .
Multiple studies have suggested that TIR is closely related to the occurrence of chronic complications in patients with diabetes 8 , 9 , 10 , 11 , 12 . However, few studies have explored the factors influencing TIR. Blood glucose regulation is affected by insulin sensitivity and β‐cell function. Glycemic fluctuation has proven to be associated with impaired β‐cell function 13 . A recent study suggested that TIR calculated using CGM was associated with islet secretory function in patients with type 2 diabetes mellitus 14 . However, the association between insulin sensitivity and TIR in patients with type 2 diabetes mellitus remains unclear.
In diabetes management, the benefits and role of CGM in patients with type 2 diabetes mellitus are less clear than those in patients with type 1 diabetes mellitus 15 , despite CGM being considered the optimal tool for calculating TIR. Furthermore, due to the high cost of CGM, capillary blood glucose (CBG) remains the main blood glucose monitoring approach for patients with type 2 diabetes mellitus in China. A study has reported that TIR evaluated using CGM approximates that evaluated using reference blood glucose measurements in patients with type 1 diabetes mellitus 16 .
In this study, the insulin concentration was measured, and the TIR was calculated using seven‐point glucose‐profile data (pre‐ and 120 min post‐main meals as well as at bedtime) and a fingertip glucometer over three consecutive days in individuals with type 2 diabetes mellitus. We aimed to investigate whether TIR, evaluated using an affordable approach, may have some bearing on insulin sensitivity and islet β‐cell function.
SUBJECTS, MATERIALS, AND METHODS
Participants
We recruited 455 patients with type 2 diabetes mellitus admitted to the Department of Endocrinology of the Sixth Affiliated Hospital, South China University of Technology, between January 2015 and January 2020. Type 2 diabetes mellitus was diagnosed according to the World Health Organization 1999 criteria 17 . Our inclusion criteria were as follows: (1) age ≥ 18 years and (2) stable diabetes treatment over the preceding 3 months. The exclusion criteria included the following: (1) positive test for glutamic acid decarboxylase antibody; (2) recent use of insulin‐secretagog agents, insulin, or glucagon‐like peptide‐1 receptor agonists, which potentially affects insulin secretion; (3) complicated with diabetic ketosis or hyperglycemic hyperosmolar state; (4) liver function test results ≥3 times the upper limit of normal or estimated glomerular filtration rate (eGFR) <60 mL/min/1.73 m2; (5) pregnancy; (6) use of glucocorticoids for more than 7 days within the previous 3 months before recruitment. Patients were enrolled after providing informed consent. This study was conducted according to the principles of the Declaration of Helsinki, and the study protocol was approved by the Ethics Committee of the Sixth Affiliated Hospital, South China University of Technology (Approval No. 2018001).
Clinical and biochemical indexes
Data regarding medical history and anthropometric parameters were collected by experienced clinicians. Medical history included sex, age, diabetes duration, and diabetes treatment program. Anthropometric parameters included height, weight, and blood pressure. Body mass index (BMI, weight/height2) was computed. Venous blood samples were drawn in the morning after fasting for 10 h. Plasma glucose levels and lipid profiles, including total cholesterol (TC), triglycerides (TG), high‐density lipoprotein cholesterol (HDL‐C), and low‐density lipoprotein cholesterol (LDL‐C), were assessed using an automatic biochemical analyzer (AU 5800; Beckman Coulter, Brea, CA, USA). HbA1c was measured by high‐performance liquid chromatography using an ADAMS‐A1c HA‐8180 analyzer (Arkray Inc., Kyoto, Japan). Insulin was assayed using the electrochemiluminescence immunoassay (MAGLUMI 4000 Plus; Snibe, Shenzhen, China).
Capillary blood glucose‐data collection and analysis
Seven‐point (pre‐ and 120 min post‐main meal as well as at bedtime) glucose profiles for the first 3 days after admission were assessed by nurses using the Roche ACCU‐CHEK instrument to avoid inaccurate measurements resulting from improper use by patients. The daily mean blood glucose (MBG) was estimated, and the blood glucose target was set at 3.9–10.0 mmol/L. TIR was computed by calculating the percentage time in which the seven‐point glucose profile was 3.9–10.0 mmol/L 9 . The amount of time the blood glucose was within the target range (3.9–10.0 mmol/L) divided by 21 (total monitoring time) and multiplied by 100% was the TIR value. Furthermore, other glucose metrics, including time above range (TAR, >10.0 mmol/L) and time below range (TBR, <3.9 mmol/L), were similarly computed. All participants received a standardized diet prepared by the nutrition department and had three meals at fixed times (breakfast, 7–8 a.m.; lunch, 11 a.m.–12 p.m.; and dinner, 5–6 p.m.). The total energy intake was 25 kcal/kg/day (55% of daily energy intake as carbohydrates, 15% as protein, and 30% as fat). Breakfast, lunch, and dinner calories accounted for 20%, 40%, and 40% of total energy intake, respectively.
Standard steamed bread meal test
The standard steamed bread meal was made of 100 g flour, which contains carbohydrates approximately equivalent to 75 g glucose. The changes in blood glucose, insulin, or C‐peptide caused by eating a 100 g standard steamed bread meal were similar to the experimental results obtained by taking 75 g glucose 18 . Therefore, in China, the standard steamed bread meal test is often used in clinical practice instead of OGTT to evaluate blood glucose and islet function in patients previously diagnosed with diabetes to avoid the digestive tract symptoms caused by the intake of large amounts of oral glucose. The standard steamed bread meal test was conducted following an overnight fast (10–12 h) to evaluate the islet reserve function on the second day of admission. Antidiabetic treatments were paused, and samples of venous blood were collected at 0, 60, and 120 min for plasma glucose and serum insulin concentration measurements.
Insulin sensitivity and β‐cell function indexes
The homeostasis model assessment of insulin resistance (HOMA‐IR) and Matsuda index were used to estimate insulin sensitivity. They were calculated using the following formulas: (1) HOMA‐IR = G0 (mmol/L) × I0 (mIU/L)/22.5, where G0 is the fasting glucose value and I0 is fasting insulin 19 , and (2) Matsuda index = 10,000/√G0 (mg/dL) × I0 (mIU/L) × mG (mg/dL) × mI (mIU/L), where mG is the mean glucose value and mI is the mean insulin value 20 .
The homeostasis model assessment of pancreatic β‐cell function (HOMA‐β) was calculated using the following formula: (20 × I0 [mIU/L])/(G [mmol/L] – 3.5) 19 . The areas under the curves for insulin (IAUC0−120) and glucose (GAUC0−120) in the steamed bread meal test were calculated using trapezoidal methods, and total insulin secretion was assessed using IAUC0−120/GAUC0−120.
Statistical analyses
SPSS statistical software (version 22.0; SPSS, IBM Corp, Armonk, NY, USA) was used for data analyses. All continuous variables verified by the Kolmogorov–Smirnov test revealed non‐normal distributions. According to the quartiles of TIR, the patients were divided into four groups. The Jonckheere–Terpstra test was applied to analyze the trends of continuous variables across the four groups. The trends of rates between groups were assessed using the Cochran–Armitage trend test. Relationships between variables were estimated using Spearman's correlation coefficient (rs). The independent correlation between TIR, insulin sensitivity, and β‐cell function was analyzed using multinomial logistic regression analysis. Odds ratios (ORs) with 95% confidence intervals (CIs) were computed after adjusting for confounding variables, including sex, age, BMI, blood pressure, diabetes duration, lipid profile, and HbA1c. Two‐tailed P values were considered statistically significant at P < 0.05.
RESULTS
Comparison of clinical and metabolic characteristics among different groups
Table 1 shows the clinical characteristics of the overall cohort and the four subgroups based on TIR‐level quartiles. For all enrolled patients, the median values for age, diabetes duration, and HbA1c were 59 (interquartile range [IQR]: 51–66) years, 5.3 (IQR: 2.8–10.0) years, and 6.9% (IQR: 6.2–7.8%), respectively. Participants with higher TIR values had shorter diabetes durations; higher TBR; higher HDL‐C; and lower TC, HbA1c, TAR, and MBG values. No significant differences were observed in the sex ratio, age, BMI, systolic blood pressure, diastolic blood pressure, TG, and LDL among the quartiles. Plasma glucose and insulin responses to the 100 g standard steamed bread meal test are presented in Figure 1. In general, glucose values at all time points decreased across a progressively higher TIR quartiles (P for trend <0.001 for all); the 60 and 120 min insulin values increased across progressively higher TIR quartiles (P for trend <0.05 for both). Table 2 shows the indicators of insulin sensitivity and β‐cell function. Across ascending TIR quartiles, the Matsuda index, HOMA‐β, and IAUC0−120/GAUC0−120 increased (all P for trend <0.001), whereas HOMA‐IR decreased (P for trend <0.001).
Table 1.
Clinical and metabolic characteristics of study participants stratified by quartiles of TIR
| All participants | Q1 (≤52%) | Q2 (57–67%) | Q3 (71–81%) | Q4(≥86%) | Z/x 2 value | P for trend | |
|---|---|---|---|---|---|---|---|
| N | 455 | 119 | 112 | 114 | 110 | ||
| Male (N, %) | 223 (49.0) | 64 (53.7) | 50 (45.5) | 47 (41.2) | 62 (56.3) | −0.12 | 0.905 |
| Age (years) | 59.3 (50.7, 66.1) | 58.3 (48.7, 65.3) | 60.6 (53.4, 67.6) | 60.9 (54.1, 67.5) | 55.6 (47.2, 64.8) | −0.98 | 0.326 |
| BMI (kg/m2) | 24.9 (22.8, 27.5) | 25.2 (23.1, 27.9) | 25.2 (22.5, 27.9) | 25.1 (23.2, 27.1) | 24.2 (22.6, 26.7) | −1.91 | 0.057 |
| SBP (mmHg) | 131 (122, 141) | 132 (122, 143) | 132 (124, 141) | 132 (122, 143) | 128 (121, 137) | −1.47 | 0.142 |
| DBP (mmHg) | 79 (73, 86) | 80 (72, 88) | 80 (76, 87) | 79 (72, 85) | 78 (70, 84) | −1.85 | 0.064 |
| Diabetes duration (years) | 5.3 (2.8, 10.0) | 6.5 (3.8, 10.3) | 6.1 (2.6, 10.1) | 5.1 (3.1, 10.3) | 4.0 (1.7, 7.3) | −3.54 | <0.001 |
| TG (mmol/L) | 1.7 (1.1, 2.6) | 2.1 (1.3, 3.1) | 1.7 (1.2, 2.5) | 1.6 (1.1, 2.5) | 1.4 (1.0, 2.3) | −1.43 | 0.152 |
| TC(mmol/L) | 4.9 (4.1, 5.8) | 5.2 (4.2, 5.9) | 4.8 (4.2, 5.7) | 4.8 (3.9, 5.6) | 4.9 (4.2, 5.75) | −3.88 | <0.001 |
| HDL‐C (mmol/L) | 1.3 (1.1, 1.5) | 1.2 (1.0, 1.5) | 1.3 (1.1, 1.5) | 1.3 (1.2, 1.5) | 1.3 (1.2, 1.5) | 2.07 | 0.038 |
| LDL‐C (mmol/L) | 2.6 (2.0, 3.3) | 2.6 (2.0, 3.3) | 2.6 (2.1, 3.3) | 2.5 (1.9, 3.2) | 2.7 (1.9, 3.4) | −0.09 | 0.927 |
| HbA1c (%) | 6.9 (6.2, 7.8) | 8.6 (8.0, 9.8) | 7.2 (7.1, 7.4) | 6.5 (6.4, 6.7) | 5.8 (5.6, 6.0) | −24.41 | <0.001 |
| TIR (%) | 66.7 (52.4, 81.0) | 38.1 (14.3, 47.6) | 66.7 (61.9, 66.7) | 81.0 (76.2, 81.0) | 90.5 (90.5, 95.2) | 24.86 | <0.001 |
| TAR (%) | 28.6 (14.3, 47.6) | 62.0 (47.6, 85.7) | 33.3 (33.3, 38.1) | 19.0 (19.0, 23.8) | 4.8 (0, 4.8) | −24.78 | <0.001 |
| TBR (%) | 0 (0, 4.8) | 0 (0, 4.8) | 0 (0, 4.8) | 0 (0, 4.8) | 4.8 (0, 4.8) | 3.65 | <0.001 |
| MBG (mmol/L) | 10.8 (8.9, 13.7) | 13.9 (11.4, 16.4) | 11.2 (9.6, 14.1) | 10.2 (8.7, 11.7) | 8.9 (7.7, 10.7) | −11.36 | <0.001 |
| GAUC0−120 (mmol/L h) | 27.4 (22.0, 34.8) | 35.6 (28.5, 42.1) | 28.3 (23.8,35.6) | 25.5 (21.4, 29.5) | 22.0 (18.7, 27.2) | −11.21 | <0.001 |
| IAUC0−120 (mIU/L h) | 45.0 (31.3, 71.9) | 41.0 (26.9, 62.4) | 46.0 (33.0, 69.0) | 46.0 (33.0, 69.0) | 53.0 (34.5, 82.4) | 2.60 | 0.009 |
Values are expressed as medians (IQRs) or n (%). BMI, body mass index; DBP, diastolic blood pressure; GAUC, glucose area under the curve; HbA1c, hemoglobin A1c; HDL‐C, high‐density lipoprotein; IAUC, insulin area under the curve; LDL‐C, low‐density lipoprotein; MBG, mean blood glucose; SBP, systolic blood pressure; TAR, time above range; TBR, time below range; TC, total cholesterol; TG, triglycerides; TIR, time in range.
Figure 1.
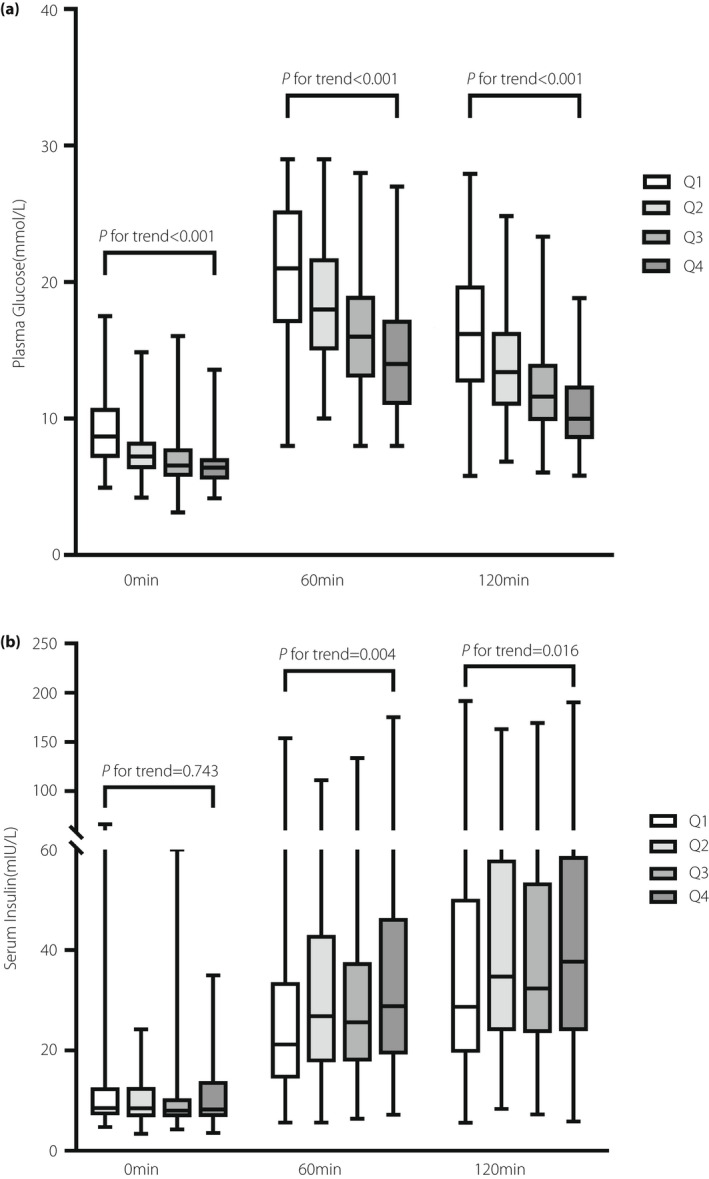
Plasma glucose and insulin responses during the 100 g standard steamed bread meal test. (a) Plasma glucose (mmol/L) and (b) serum insulin values (mIU/L) among the four groups divided according to TIR quartiles (Q1–Q4). Data are shown in the box. Q1 (TIR ≤ 52%), Q2 (57–67%), Q3 (71–81%), and Q4 (≥86%).
Table 2.
Indexes of insulin sensitivity and ß‐cell function across TIR quartiles
| All participants | Q1 (≤52%) | Q2 (57–67%) | Q3 (71–81%) | Q4 (≥86%) | Z value | P for trend | |
|---|---|---|---|---|---|---|---|
| N | 455 | 119 | 112 | 114 | 110 | ||
| Indexes of insulin sensitivity | |||||||
| Matsuda index | 4.1 (2.8, 6.0) | 3.4 (2.6, 4.9) | 3.8 (2.6, 5.6) | 4.5 (3.2, 6.4) | 4.8 (2.8, 7.2) | 3.99 | <0.001 |
| HOMA‐IR | 2.7 (2.0, 4.2) | 3.4 (2.5, 5.3) | 2.7 (2.1, 4.1) | 2.4 (1.9, 3.4) | 2.4 (1.7, 4.0) | −4.79 | <0.001 |
| Indexes of insulin secretion | |||||||
| HOMA‐β | 48.3 (32.0, 79.6) | 36.1 (20.4, 56.1) | 46.4 (32.8, 76.9) | 52.4 (35.0, 83.3) | 69.4 (43.1, 106.2) | 7.05 | <0.001 |
| IAUC0−120/GAU0−120 | 1.8 (1.1, 2.9) | 1.1 (0.7, 1.9) | 1.9 (1.3, 2.9) | 1.9 (1.3, 2.9) | 2.4 (1.3, 3.7) | 6.79 | <0.001 |
Values are expressed as medians (IQRs). GAUC, glucose area under the curve; HOMA‐IR, homeostasis model assessment of insulin resistance; HOMA‐β, homeostasis model assessment of β‐cell function; IAUC, insulin area under the curve.
Correlation of TIR with insulin sensitivity and β‐cell function indexes
Spearman's correlation test was employed to determine the relationships between glycemic control parameters and insulin sensitivity and β‐cell function indexes. As shown in Table 3, TIR was positively correlated with 60 and 120 min insulin values, IAUC0−120, Matsuda index, HOMA‐β, and IAUC0−120/GAUC0−120 (rs = 0.154, 0.129, 0.137, 0.194, 0.341, and 0.334, respectively, P < 0.05) but inversely correlated with HOMA‐IR (rs = −0.239, P < 0.001).
Table 3.
Correlation of TIR with insulin sensitivity and ß‐cell function indexes
| INS0 | INS60 | INS120 | IAUC0−120 | HOMA‐IR | Matsuda index | HOMA‐β | IAUC0−120/GAUC0−120 | ||
|---|---|---|---|---|---|---|---|---|---|
| TIR | r S | −0.025 | 0.154 | 0.129 | 0.137 | −0.239 | 0.194 | 0.341 | 0.334 |
| P | 0.597 | 0.001 | 0.006 | 0.003 | <0.001 | <0.001 | <0.001 | <0.001 | |
| TAR | r S | 0.028 | −0.155 | −0.13 | −0.137 | 0.241 | −0.193 | −0.335 | −0.333 |
| P | 0.551 | 0.001 | 0.006 | 0.003 | <0.001 | <0.001 | <0.001 | <0.001 | |
| TBR | r S | −0.003 | 0.040 | 0.035 | 0.031 | −0.027 | 0.006 | 0.006 | 0.05 |
| P | 0.947 | 0.397 | 0.455 | 0.505 | 0.568 | 0.89 | 0.897 | 0.291 | |
| HbA1c | r S | 0.027 | −0.162 | −0.138 | −0.145 | 0.252 | −0.201 | −0.353 | −0.346 |
| P | 0.564 | 0.001 | 0.003 | 0.002 | <0.001 | <0.001 | <0.001 | <0.001 |
Spearman's correlation test was used to determine the relationship. GAUC, glucose area under the curve; HbA1c, hemoglobin A1c; IAUC, insulin area under the curve; INS, insulin; TAR, time above range; TBR, time below range; TIR, time in range.
Independent factors influencing the achievement of the target TIR (TIR > 70%)
According to international guidelines, the target TIR should be >70% for the general population with type 2 diabetes mellitus 4 ; therefore, patients were divided into standard and substandard groups using this cutoff point. The standard group comprised patients who achieved a TIR > 70%, while the substandard group comprised patients with a TIR < 70%. The substandard group was treated as the reference category in multinomial logistic regression models. In model 2 (an adjusted model that included sex, age, BMI, blood pressure, diabetes duration, lipid profile, and HbA1c), the ORs of TIR achieving the recommended target increased by 12% (95% CI: 3–21%), 7% (95% CI: 1–14%), 10% (95% CI: 5–16%), and 45% (95% CI: 25–68%) for each 10 mIU/L increase in 60 and 120 min insulin values, 10 unit increase in HOMA‐β, and unit increase in IAUC0−120/GAUC0−120, respectively (P < 0.05). Nevertheless, the OR decreased by 10% (95% CI: 1–18%) for each unit increase in HOMA‐IR (P < 0.05) (Figure 2).
Figure 2.
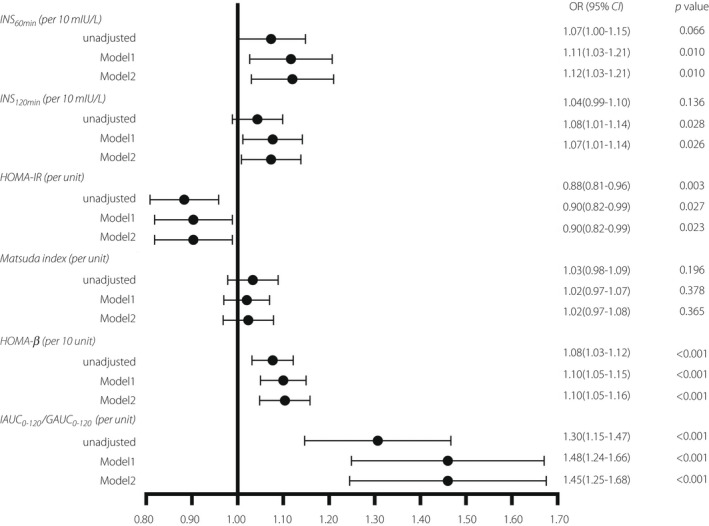
Independent factors influencing the achievement of the target TIR (TIR > 70%). Multinomial logistic regression analysis models were applied to investigate the associations of target TIR with insulin sensitivity and β‐cell function. Model 1 was adjusted for sex, age, BMI, blood pressure, diabetes duration, lipid profile. Model 2 includes all variables in model 1 plus HbA1c. INS, insulin; GAUC, glucose area under the curve; IAUC, insulin area under the curve.
DISCUSSION
Our study demonstrated that insulin sensitivity and insulin secretion (independent of confounders such as HbA1c) were associated with TIR calculated using the seven‐point glucose profile.
In addition to being a simple and intuitive indicator that patients can easily understand, TIR is also closely associated with the personal needs and quality of life of persons with diabetes. Focusing exclusively on HbA1c may result in the oversight of some potential risks (such as hypoglycemia) and the clinical value of certain treatment options that may ameliorate blood glucose fluctuations without a significant effect on HbA1c. Compared with HbA1c, TIR can better reflect the effect of acute blood glucose interventions; hence, TIR calculation based on HbA1c measurement is potentially superior in improving patient blood glucose control. CGM technology provides continuous and comprehensive information regarding daily blood glucose fluctuations, addressing the shortcomings of HbA1c and traditional self‐monitoring of blood glucose (SMBG) 21 . However, due to its high cost, it cannot be used widely 22 , 23 . Compared with CGM, the glycemic variability index, calculated using the seven‐point glucose profile, is more difficult and less accurate at detecting latent hyperglycemia or hypoglycemia at night; nonetheless, it has the advantages of a low cost and easy access. In China, CGM has not been used widely as medical insurance does not cover CGM in some areas, and some patients consider it inconvenient to wear sensors. For most patients with type 2 diabetes mellitus, capillary blood glucose is still considered the most valuable tool for monitoring blood glucose and guiding the adjustment of hypoglycemic drugs 24 , 25 . A recent study suggested that TIR calculated by SMBG was also negatively correlated with HbA1c 26 . Moreover, the mean TIR values were similar when measured using eight‐point glucose testing (overnight monitoring was added based on the seven‐point glucose profile) and measured with CGM (50% and 49%, respectively) in a study conducted by the Diabetes Research in Children Network 27 . TIR detected either by CGM or SMBG was defined as a potential predictor of chronic complications in diabetes mellitus. A significant inverse relationship between TIR (assessed by CGM) and the prevalence and severity of retinopathy independent of HbA1c was confirmed in a type 2 diabetes mellitus study with large sample sizes 8 . Another study conducted with the Diabetes Control and Complications Trial cohort yielded a similar result in which TIR (assessed by SMBG) was related to the incidence of retinopathy and nephropathy 9 .
A previous study suggested that insulin resistance was related to glycemic variability in women with gestational diabetes mellitus 28 . To the best of our knowledge, this study is the first to demonstrate that insulin resistance is negatively correlated with TIR in patients with type 2 diabetes mellitus. Because TIR had the potential to be influenced by various factors in this study, we performed a multinomial regression analysis after adjusting for the potential risk factors. The results suggest that HOMA‐IR is a risk factor for the achievement of the target TIR (TIR > 70%). HOMA‐IR is used in the fasting state, while the Matsuda index is used in dynamic trials. In early type 2 diabetes mellitus and even in normal glucose tolerance, the Matsuda index was better than HOMA‐IR in evaluating insulin sensitivity 29 . However, our study suggested that the achievement of the target TIR was more strongly correlated with HOMA‐IR than with the Matsuda index. We could infer that insulin sensitivity in the fasting state may be preferentially reflected in the achievement of the target TIR compared with the dynamic state.
In this study, Spearman's analysis confirmed that 60 and 120 min insulin values, IAUC0−120, HOMA‐β, and IAUC0−120/GAUC0−120 were positively associated with TIR. Furthermore, multinomial regression analysis revealed that 60 and 120 min insulin values, HOMA‐β, and IAUC0−120/GAUC0−120 were independent protective factors for the achievement of the target TIR (TIR > 70%), indicating that a relatively favorable islet reserve function is instrumental in controlling glucose fluctuations. Our results are consistent with those of two studies, which found that postprandial β‐cell function affects glucose fluctuations estimated by CGM in individuals with type 2 diabetes mellitus 13 , 14 . The consistency in the results is possibly related to the similar clinical characteristics of the patients who participated in these studies. First, the patients in these studies were treated with oral hypoglycemic agents, implying that they had preservation of residual β‐cell function. A recent study indicated that patients with a higher postprandial C‐peptide peak exhibited significantly increased TIR compared with those with a lower C‐peptide peak, despite the low C peptide level in patients with type 1 diabetes mellitus 30 . Second, the patients who participated in these studies had diabetes for a relatively short time (<10 years). Patients with type 2 diabetes mellitus for a longer duration potentially exhibit a lower TIR. In a study conducted on patients with type 2 diabetes mellitus (median disease duration: 13 years), diabetic duration was an independent explanatory factor for TIR 31 .
However, TIR alone cannot be used as an index for assessing glycemic control because it depends more on the time spent in hyperglycemia than on that spent in hypoglycemia 32 . A previous study revealed that the correlation between HbA1c and TAR was stronger and more consistent than that between HbA1c and TIR 33 . Moreover, severe hypoglycemia is associated with an elevated risk of cardiovascular disease and dementia 34 , 35 ; therefore, TAR and TBR are also important indicators of blood glucose control. Our study found that TAR was negatively correlated with 60 and 120 min insulin values, IAUC0−120, the Matsuda index, HOMA‐β, and IAUC0−120/GAUC0−120 and positively correlated with HOMA‐IR. However, TBR had no relationship with the above indexes. In patients with type 2 diabetes mellitus, to some extent, insulin sensitivity and β‐cell function potentially influence TAR.
Insulin sensitivity and β‐cell function play important roles in the regulation of glucose homeostasis 36 . A glucose‐concentration increase stimulates insulin secretion and subsequently reduces blood sugar levels in a time‐ and concentration‐dependent manner. Moreover, both insulin secretion and action are inhibited by persistent hyperinsulinemia 37 . Conversely, chronic hyperglycemia (i.e., glucose toxicity) attenuates insulin secretion by islet β‐cells during hyperglycemia 38 , 39 . Furthermore, insulin resistance also potentially damages β‐cell function by way of glucose toxicity 38 , 39 .
Our study had several strengths, including the collection of detailed clinical patient characteristics by trained clinicians and the centralization of biochemical analyses conducted with fresh rather than stored samples. However, certain limitations should be noted. First, this was a cross‐sectional study; therefore, causality between TIR and islet dysfunction could not be confirmed. Second, participants underwent the standard steamed bread meal test to assess glucose tolerance. The hyperinsulinemic‐euglycemic clamp is considered a reference standard for the evaluation of insulin sensitivity. Nevertheless, the clamp procedure is unsuitable for large sample studies because it is invasive, expensive, and laborious. Moreover, the participants enrolled in this study were hospitalized patients from our center; thus, our findings were limited in that they merely reflected the status of inpatients with type 2 diabetes mellitus in southern China. Hence, this study's findings may not apply to other ethnic groups or all patients with diabetes. Furthermore, the retrospective collection of 3‐day capillary blood glucose data for TIR measurement after hospital admission may not adequately reflect the participants' historical glucose control. To save hospital stays and medical resources, the standard steamed bread meal test was performed on the second day after admission, which may slightly impact TIR. However, this study excluded patients who were using insulin‐secretagog agents, insulin, or glucagon‐like peptide‐1 receptor agonists, so we estimate that the influence on the final result was not significant. Consequently, multicenter, large‐scale, prospective clinical trials are required to fully elucidate the correlation between TIR and impaired islet function in the future.
In conclusion, this study indicated that impaired insulin sensitivity and pancreatic β‐cell function potentially have negative effects on capillary blood glucose‐assessed TIR in Chinese patients with type 2 diabetes mellitus who use oral hypoglycemic agents (except for insulin‐secretagog agents). Our findings suggest that improved insulin resistance and pancreatic β‐cell function are potential therapeutic targets for controlling glycemic fluctuations to prevent chronic type 2 diabetes mellitus complications.
DISCLOSURE
The authors declare no conflict of interest.
Approval of the research protocol: According to the principles of the Declaration of Helsinki, this study protocol was approved by the Ethics Committee of the Sixth Affiliated Hospital, South China University of Technology.
Informed consent: patients were enrolled after providing informed consent.
Registry and the registration no. of the study/trial: July 12, 2018; approval No. 2018001.
Animal studies: NA.
ACKNOWLEDGMENTS
The authors are grateful to all the staff for helping with this study. They are thankful for all participants and their dedication to data collection and laboratory measurements. This research did not receive any specific grant from funding agencies in the public, commercial, or not‐for‐profit sectors.
Jingwen Ye and Jiajin Deng contributed equally to this work.
REFERENCES
- 1. Danne T, Nimri R, Battelino T, et al. International consensus on use of continuous glucose monitoring. Diabetes Care 2017; 40(1): 1631–1640. [DOI] [PMC free article] [PubMed] [Google Scholar]
- 2. Wright LA, Hirsch IB. Metrics beyond hemoglobin A1C in diabetes management: time in range, hypoglycemia, and other parameters. Diabetes Technol Ther 2017; 19: S16–S26. [DOI] [PMC free article] [PubMed] [Google Scholar]
- 3. Beck RW, Connor CG, Mullen DM, et al. The fallacy of average: how using HbA(1c) alone to assess glycemic control can be misleading. Diabetes Care 2017; 40: 994–999. [DOI] [PMC free article] [PubMed] [Google Scholar]
- 4. Battelino T, Danne T, Bergenstal RM, et al. Clinical targets for continuous glucose monitoring data interpretation: recommendations from the international consensus on time in range. Diabetes Care 2019; 42: 1593–1603. [DOI] [PMC free article] [PubMed] [Google Scholar]
- 5. Beck RW, Bergenstal RM, Cheng P, et al. The relationships between time in range, hyperglycemia metrics, and HbA1c. J Diabetes Sci Technol 2019; 13: 614–626. [DOI] [PMC free article] [PubMed] [Google Scholar]
- 6. Vigersky RA, McMahon C. The relationship of hemoglobin A1C to time‐in‐range in patients with diabetes. Diabetes Technol Ther 2019; 21: 81–85. [DOI] [PubMed] [Google Scholar]
- 7. Valenzano M, Cibrario Bertolotti I, Valenzano A, et al. Time in range‐A1c hemoglobin relationship in continuous glucose monitoring of type 1 diabetes: a real‐world study. BMJ Open Diabetes Res Care 2021; 9(1): e001045. [DOI] [PMC free article] [PubMed] [Google Scholar]
- 8. Lu J, Ma X, Zhou J, et al. Association of time in range, as assessed by continuous glucose monitoring, with diabetic retinopathy in type 2 diabetes. Diabetes Care 2018; 41: 2370–2376;. [DOI] [PubMed] [Google Scholar]
- 9. Beck RW, Bergenstal RM, Riddlesworth TD, et al. Validation of time in range as an outcome measure for diabetes clinical trials. Diabetes Care 2019; 42: 400–405. [DOI] [PMC free article] [PubMed] [Google Scholar]
- 10. Guo Q, Zang P, Xu S, et al. Time in range, as a novel metric of glycemic control, is reversely associated with presence of diabetic cardiovascular autonomic neuropathy independent of HbA1c in Chinese type 2 diabetes. J Diabetes Res 2020; 2020: 5817074. [DOI] [PMC free article] [PubMed] [Google Scholar]
- 11. Lu J, Ma X, Shen Y, et al. Time in range is associated with carotid intima‐media thickness in type 2 diabetes. Diabetes Technol Ther 2020; 22: 72–78. [DOI] [PubMed] [Google Scholar]
- 12. Lu J, Wang C, Shen Y, et al. Time in range in relation to all‐cause and cardiovascular mortality in patients with type 2 diabetes: A prospective cohort study. Diabetes Care 2021; 44: 549–555. [DOI] [PMC free article] [PubMed] [Google Scholar]
- 13. Kohnert KD, Augstein P, Zander E, et al. Glycemic variability correlates strongly with postprandial beta‐cell dysfunction in a segment of type 2 diabetic patients using oral hypoglycemic agents. Diabetes Care 2009; 32: 1058–1062. [DOI] [PMC free article] [PubMed] [Google Scholar]
- 14. Xu SY, Li K, Zhang Z, et al. Association between time in range, a novel measurement of glycemic control and islet secretory function in chinese patients with type 2 diabetes mellitus‐an observational study. Diabetes Res Clin Pract 2021; 173: 108684. [DOI] [PubMed] [Google Scholar]
- 15. Selvin E. The prognostic value of time in range in type 2 diabetes. Diabetes Care 2021; 44: 319–320. [DOI] [PMC free article] [PubMed] [Google Scholar]
- 16. Beck RW, Calhoun P, Kollman C. Use of continuous glucose monitoring as an outcome measure in clinical trials. Diabetes Technol Ther 2012; 14: 877–882. [DOI] [PMC free article] [PubMed] [Google Scholar]
- 17. Alberti KG, Zimmet PZ. Definition, diagnosis and classification of diabetes mellitus and its complications. Part 1: diagnosis and classification of diabetes mellitus provisional report of a WHO consultation. Diabetic medicine 1998; 15: 539–553. [DOI] [PubMed] [Google Scholar]
- 18. Collaborative Study Groups for islet B‐cell function . The observation of glucose, insulin and C peptide of steam bread test among healthy population. Chin Med J 1982; 62: 643–647. [Google Scholar]
- 19. Matthews DR, Hosker JP, Rudenski AS, et al. Homeostasis model assessment: Insulin resistance and beta‐cell function from fasting plasma glucose and insulin concentrations in man. Diabetologia 1985; 28: 412–419. [DOI] [PubMed] [Google Scholar]
- 20. Matsuda M, DeFronzo RA. Insulin sensitivity indices obtained from oral glucose tolerance testing: comparison with the euglycemic insulin clamp. Diabetes Care 1999; 22: 1462–1470. [DOI] [PubMed] [Google Scholar]
- 21. El‐Laboudi AH, Godsland IF, Johnston DG, et al. Measures of glycemic variability in type 1 diabetes and the effect of real‐time continuous glucose monitoring. Diabetes Technol Ther 2016; 18: 806–812. [DOI] [PubMed] [Google Scholar]
- 22. Klatman EL, Jenkins AJ, Ahmedani MY, et al. Blood glucose meters and test strips: Global market and challenges to access in low‐resource settings. Lancet Diabetes Endocrinol 2019; 7: 150–160. [DOI] [PubMed] [Google Scholar]
- 23. Weinstock RS, Braffett BH, McGuigan P, et al. Self‐monitoring of blood glucose in youth‐onset type 2 diabetes: results from the TODAY study. Diabetes Care 2019; 42: 903–909. [DOI] [PMC free article] [PubMed] [Google Scholar]
- 24. Machry RV, Rados DV, Gregório GR, et al. Self‐monitoring blood glucose improves glycemic control in type 2 diabetes without intensive treatment: A systematic review and meta‐analysis. Diabetes Res Clin Pract 2018; 142: 173–187. [DOI] [PubMed] [Google Scholar]
- 25. Ji L, Su Q, Feng B, et al. Glycemic control and self‐monitoring of blood glucose in Chinese patients with type 2 diabetes on insulin: baseline results from the COMPASS study. Diabetes Res Clin Pract 2016; 112: 82–87. [DOI] [PubMed] [Google Scholar]
- 26. Cutruzzolà A, Irace C, Parise M, et al. Time spent in target range assessed by self‐monitoring blood glucose associates with glycated hemoglobin in insulin treated patients with diabetes. Nutr Metab Cardiovasc Dis 2020; 30: 1800–1805. [DOI] [PubMed] [Google Scholar]
- 27. Fiallo‐Scharer R. Eight‐point glucose testing versus the continuous glucose monitoring system in evaluation of glycemic control in type 1 diabetes. J Clin Endocrinol Metab 2005; 90: 3387–3391. [DOI] [PubMed] [Google Scholar]
- 28. Su JB, Wang XQ, Chen JF, et al. Glycemic variability in gestational diabetes mellitus and its association with β cell function. Endocrine 2013; 43: 370–375. [DOI] [PubMed] [Google Scholar]
- 29. Ohn JH, Kwak SH, Cho YM, et al. 10‐year trajectory of β‐cell function and insulin sensitivity in the development of type 2 diabetes: a community‐based prospective cohort study. Lancet Diabetes Endocrinol 2016; 4: 27–34. [DOI] [PubMed] [Google Scholar]
- 30. Rickels MR, Evans‐Molina C, Bahnson HT, et al. High residual C‐peptide likely contributes to glycemic control in type 1 diabetes. J Clin Invest 2020; 130: 1850–1862. [DOI] [PMC free article] [PubMed] [Google Scholar]
- 31. Kuroda N, Kusunoki Y, Osugi K, et al. Relationships between time in range, glycemic variability including hypoglycemia and types of diabetes therapy in Japanese patients with type 2 diabetes mellitus: hyogo diabetes hypoglycemia cognition complications study. J Diabetes Investig 2021; 12: 244–253. [DOI] [PMC free article] [PubMed] [Google Scholar]
- 32. Helleputte S, De Backer T, Calders P, et al. The added and interpretative value of CGM‐derived parameters in type 1 diabetes depends on the level of glycemic control. Endocr Pract 2021; 27: 44–50. [DOI] [PubMed] [Google Scholar]
- 33. Rodbard D. Glucose time in range, time above range, and time below range depend on mean or median glucose or HbA1c, glucose coefficient of variation, and shape of the glucose distribution. Diabetes Technol Ther 2020; 22: 492–500. [DOI] [PubMed] [Google Scholar]
- 34. Tsujimoto T, Yamamoto‐Honda R, Kajio H, et al. Vital signs, QT prolongation, and newly diagnosed cardiovascular disease during severe hypoglycemia in type 1 and type 2 diabetic patients. Diabetes Care 2014; 37: 217–225. [DOI] [PubMed] [Google Scholar]
- 35. Yaffe K, Falvey CM, Hamilton N, et al. Association between hypoglycemia and dementia in a biracial cohort of older adults with diabetes mellitus. JAMA Intern Med 2013; 173: 1300–1306. [DOI] [PMC free article] [PubMed] [Google Scholar]
- 36. Ferrannini E. Insulin resistance versus insulin deficiency in non‐insulin‐dependent diabetes mellitus: problems and prospects. Endocr Rev 1998; 19: 477–490. [DOI] [PubMed] [Google Scholar]
- 37. Del Prato S, Leonetti F, Simonson DC, et al. Effect of sustained physiologic hyperinsulinaemia and hyperglycaemia on insulin secretion and insulin sensitivity in man. Diabetologia 1994; 37: 1025–1035. [DOI] [PubMed] [Google Scholar]
- 38. Yki‐Järvinen H. Glucose toxicity. Endocr Rev 1992; 13: 415–431. [DOI] [PubMed] [Google Scholar]
- 39. Unger RH, Grundy S. Hyperglycaemia as an inducer as well as a consequence of impaired islet cell function and insulin resistance: implications for the management of diabetes. Diabetologia 1985; 28: 119–121. [DOI] [PubMed] [Google Scholar]