

Abstract
Patients with STAT1 gain-of-function (GOF) pathogenic variants have enhanced or prolonged STAT1 phosphorylation following cytokine stimulation and exhibit increased yet heterogeneous susceptibility to infections, autoimmunity, and cancer. Although disease phenotypes are diverse and other genetic factors contribute, how STAT1 GOF affects cytokine sensitivity and cell biology remains poorly defined. In this study, we analyzed the immune and immunometabolic profiles of two patients with known pathogenic heterozygous STAT1 GOF mutation variants. A systems immunology approach of peripheral blood cells from these patients revealed major changes in multiple immune cell compartments relative to healthy adult and pediatric donors. Although many phenotypes of STAT1 GOF donors were shared, including increased Th1 cells but decreased class-switched B cells and plasmacytoid dendritic cell populations, others were heterogeneous. Mechanistically, hypersensitivity for cytokine-induced STAT1 phosphorylation in memory T cell populations was particularly evident in response to IL-6 in one STAT1 GOF patient. Immune cell metabolism directly influences cell function, and the STAT1 GOF patients shared an immunometabolic phenotype of heightened glucose transporter 1 (GLUT1) and carnitine palmitoyl transferase 1A (CPT1a) expression across multiple immune cell lineages. Interestingly, the metabolic phenotypes of the pediatric STAT1 GOF donors more closely resembled or exceeded those of healthy adult than healthy age-similar pediatric donors, which had low expression of these metabolic markers. These results define new features of STAT1 GOF patients, including a differential hypersensitivity for IL-6 and a shared increase in markers of metabolism in many immune cell types that suggests a role for STAT1 in metabolic regulation of immunity.
INTRODUCTION
A class of recently discovered inborn errors of immunity (IEIs) involve abnormal cellular signaling through mutations in members of the STAT family. STAT proteins are latent transcription factors that require cytokine stimulation to be recruited to receptors via their SH2 domains. Subsequent tyrosine phosphorylation by JAKs leads to formation of multimers and translocation into the nucleus, where the STAT complexes bind specific DNA sequences and regulate gene transcription. JAK/STAT signaling pathways are activated by a wide range of cytokines, with STAT1 phosphorylation occurring following cell stimulation with IFNs α, β, γ, and λ, IL-27, and IL-6 (1–4). STAT1 gain-of-function (GOF) mutations are recognized as IEIs that present with a wide range of clinical phenotypes (5). Characterization of 274 patients with pathogenic STAT1 GOF mutations identified significant infectious complications within this patient cohort including bacterial, viral, chronic mucocutaneous candidiasis (CMC), and invasive fungal infections (6). Patients with STAT1 GOF mutations may also have autoimmune manifestations, including hypothyroidism, type 1 diabetes, hematologic cytopenias, cancers, and systemic lupus erythematosus (5, 6). Invasive infections, cerebral aneurysms, and cancer were the strongest predictors in poor outcome in affected patients (6). Importantly, neither genotype–phenotype correlation nor the risk factors for poor outcomes in STAT1 GOF patients have been described to date. Moreover, the mechanisms that drive these diverse phenotypes remain uncertain.
Pathogenic STAT1 GOF mutations lead to increased STAT1 phosphorylation (3, 5, 7) and downstream p-STAT1–driven target gene transcription. Basal STAT1 phosphorylation may, however, be modest and increased activity can require cytokine stimulation. Processes that lead to increased STAT1 activity in response to cytokines include impairment of dephosphorylation, increased STAT1 protein levels, and premature nuclear import of p-STAT1 (8). Increased STAT1 signaling may affect development of specific T cell subsets, and low levels of circulating IL-17A–producing T cells are identified in the large majority (82%) of patients and contribute to the predisposition to fungal infection in these families (6). However, the predisposition to viral and intracellular infections that depend on strong type I and type II IFN responses remains a paradox without clear explanation.
In this study, we applied a systems immunology approach to deeply characterize signaling, metabolism, activation state, and differentiation state of the peripheral blood immune cells of two patients with pathogenic STAT1 GOF variants. Given the limited deep characterization of the immune milieu in this disease, we used high-dimensional mass cytometry to comprehensively characterize the lymphoid and myeloid compartments of these patients. Using this approach, we tracked major mononuclear cell type frequencies and activation states, including markers of cell metabolism (9–13 and K.J. Kramer, E.M. Wilfong, K. Voss, S.M. Barone, A.R. Shiakolas, N. Raju, C.E. Roe, N. Suryadevara, L. Walker, S.C. Wall, et al., manuscript posted on bioRxiv, DOI: 10.1101/2021.07.28.453981), and cytokine responses. These studies illustrate the effects of p-STAT1 perturbations on a global cellular level and showed that all immune cell types were affected by STAT1 variants, with some shared and some distinct phenotypes. Although cell populations and sensitivity to cytokines were heterogeneous, a hyperactive response to IL-6 was particularly notable in one patient. In addition, both pediatric STAT1 GOF patients had elevated markers of glucose and lipid metabolism across multiple cell types that more closely resembled adult rather than pediatric healthy donor controls. These studies provide new details on altered immune cell populations and heterogeneously increased responsiveness to IL-6 in STAT1 GOF patients. They also show shared phenotypes that suggest an immunometabolic role for STAT1 that may have important implications relevant to the diverse clinical presentations of these patients.
MATERIALS AND METHODS
Donor PBMC collection
PBMCs were collected from healthy volunteers with written informed consent under Institutional Review Board protocol numbers 131311 and 191562. The patients with STAT1 GOF were collected with written informed consent under Institutional Review Board protocol number 182228. Samples were de-identified prior to processing, and no other information was obtained from healthy individuals outside of a brief health survey. The healthy donor controls were adults and not age-matched pediatric patients. IRB consent for healthy donors does not allow for further identifiers.
Tissue collection and processing
Blood was collected by venipuncture into heparinized collection tubes (Becton Dickinson; 100 ml/donor). Whole blood was diluted 1:4 with PBS before being overlaid onto a Ficoll-Paque Plus density gradient (GE Lifesciences). Blood was then centrifuged at 400 × g for 30 min without braking. Buffy coats were isolated, washed with PBS, and centrifuged at 500 × g for 10 min. Cell pellets were then resuspended in ACK (ammonium-chloride-potassium) lysis buffer for 5 min, washed, and cryopreserved at 1 × 10⁷ cells/ml at −80°C in 10% DMSO in FBS.
Metal isotope-tagged Abs
All Abs used for mass cytometry analysis are listed in Supplemental Table I. Preconjugated Abs to metal isotopes were purchased from Fluidigm or from commercial suppliers in purified form and conjugated in-house using the Maxpar X8 chelating polymer kit (Fluidigm) according to the manufacturer’s instructions.
Cell preparation and mass cytometry acquisition
Cryopreserved samples were rapidly thawed in a 37°C water bath and resuspended in complete RPMI 1640 supplemented with 10% FBS and 50 U/ml penicillin-streptomycin (Thermo Scientific HyClone). Cell suspensions were processed and stained as previously described (13–15). Briefly, cells were washed once with serum-free RPMI 1640 and subsequently stained with a 103Rh Cell-ID intercalator (Fluidigm) at a final concentration of 1 μM for 5 min at room temperature. Staining was quenched with complete RPMI 1640 before washing with PBS/1% BSA. Cells were resuspended in PBS/BSA and added to the appropriate Ab mixture of cell-surface staining Abs (Supplemental Table I) and incubated at room temperature for 30 min. Samples were washed in PBS/BSA before fixation in 2% paraformaldehyde for 10 min at room temperature. Cells were again washed in PBS and fixed in ice-cold methanol with gentle vortexing before storage at −20°C. On the day of data collection, samples stored at −20°C were washed in PBS/BSA and resuspended in an Ab mixture of intracellular stains for 30 min. Iridium Cell-ID intercalator was added at a final concentration of 125 nM and incubated at room temperature for at least 30 min. Cells were then washed and resuspended in ultrapure deionized water, mixed with 10% EQ four element calibration beads (Fluidigm), and filtered through a 40-μm FACS filter tube before data collection. Data were collected on a Helios CyTOF 3.0 (Fluidigm). Quality control and tuning processes were performed following the guidelines for the daily instrument operation. Data were collected as FCS (flow cytometry standard) files.
Cytokine stimulation and phospho-specific cytometry
Phospho-specific mass cytometry was performed as previously described (13). Cryopreserved samples were thawed in a water bath as above. Cell pellets were resuspended in complete RPMI 1640 (10% FBS, penicillin-streptomycin) and rested at 37°C for 15 min. Cell suspensions were then washed in PBS and stained in 1 μM rhodium Cell-ID intercalator in PBS for 5 min. Cells were again washed in PBS/BSA and aliquoted equally into cytokine stimulation solutions. Briefly, these conditions included PBS (unstimulated), recombinant human IFN-α (20 ng/ml), recombinant human IFN-γ (20 ng/ml), recombinant human IL-6 (20 ng/ml), recombinant human IL-10 (20 ng/ml), or hydrogen peroxide (10 μM). Stimulation conditions were allowed to proceed for indicated times before immediate fixation in 1.6% paraformaldehyde to halt phospho-protein dissociation. Samples were then washed in PBS/BSA, stained with a mixture of cell-surface Abs, and fixed in ice-cold methanol as above. On the day of collection, samples were stained with a mixture of intracellular Abs. Iridium intercalation, resuspension in EQ calibration beads, and sample collection proceeded as above.
Fluorescence cytometry was performed using a similar, previously published fluorescence cell barcoding protocol (16). Cells were then analyzed using a five-laser LSR II fluorescence cytometer (BD Biosciences).
Data preprocessing
Raw mass cytometry files were normalized using the MATLAB bead normalization tool (17). Files were then uploaded to the cloud-based analysis platform Cytobank. Before automated high-dimensional data analysis, the mass cytometry data were transformed with a cofactor of 5 using an inverse hyperbolic sine (arcsinh) function. Cell doublets were first excluded using Gaussian parameters (center, offset, width, residual) as reported (13). Intact cells were gated based on DNA content (191Ir and 193 Ir). Dead cells were excluded based on rhodium intercalation. Immune subsets were then manually gated using biaxial gating strategies.
Fluorescently barcoded samples were debarcoded and assigned to individual wells on a 48-well plate using the DebarcodeR algorithm (18).
Dimensionality reduction
Analysis by t-distributed stochastic neighbor embedding (t-SNE) was performed using the Cytobank platform. For each respective panel, 1,000–33,000 total cells of interest (CD45+ CD3+ T cells, CD45+ CD19+ B cells, or CD45+ CD3−CD19−CD56− myeloid cells) were pregated before analysis. Dimensionality reduction was performed using all markers within each panel. Metabolic and phospho-protein markers were excluded to assess individual marker expression. Each t-SNE map was generated using a perplexity of 30, theta of 0.5, and 10,000 iterations.
Statistical analysis
All statistical analysis was performed in Cytobank, R version 3.6.1, or GraphPad Prism version 8.4.3. Where appropriate, median intensity values were transformed using the arcsinh scale normalized to the minimum intensity value across all markers. Patient values outside of the range of five pooled healthy donor samples were considered significant. Where indicated, two-way ANOVA with a Tukey correction was performed to compared differences between multiple groups. A p value <0.05 was considered statistically significant.
Study approval
Written informed consent was obtained from all participants prior to participation, and this study was conducted in accordance with the Declaration of Helsinki, approved by the Institutional Review Board at Vanderbilt University Medical Center.
RESULTS
Patient descriptions
We studied two patients with heterozygous STAT1 GOF mutations and distinct clinical histories to further define potential immunopathogenic mechanisms of STAT1 GOF–associated disease (Table I). Patient 1 (P1) presented as a previously healthy male at 9 mo of age with persistent fever. Laboratory and clinical evaluation demonstrated pancytopenia, a significant transaminitis, elevated ferritin, hepatosplenomegaly, and coagulopathy to meet diagnostic criteria for hemophagocytic lymphohistiocytosis (HLH) syndrome. Evaluation of infectious triggers of HLH identified disseminated histoplasmosis through detection of histoplasma Ag in peripheral blood. He was successfully treated with dexamethasone to control his elevated immune response, as well as liposomal amphotericin B with transition to itraconazole to successfully treat the disseminated histoplasmosis. Of note, although the vast majority STAT1 GOF patients develop CMC, he had no evidence or known history of this disease. Clinical immunologic evaluation at the time of initial presentation demonstrated decreased NK function by a clinical chromium release assay, but normal CD107a degranulation. Clinical B cell phenotyping revealed low frequencies of non-switched memory B cells, switched memory B cells, and total memory B cells. T cell functional testing demonstrated moderately decreased CD3+ T cell proliferation in response to tetanus toxin, and normal mitogen stimulation to PHA and PWM. He demonstrated a modestly decreased CD45+ total lymphocyte proliferation to Candida; however, his CD3+ T cell response was normal, overall suggesting a normal response. A primary immunodeficiency next-generation sequencing panel identified a de novo pathogenic variant in STAT1 (c.800C>T; p.Ala267Val) (Table I) previously identified in patients with CMC to result in GOF (19–23). This missense mutation in the coiled-coiled domain has previously been shown to lead to enhanced phosphorylation in response to IFN (α and γ) and to impair dephosphorylation of p-STAT1 protein, leading to the described GOF (24, 25). PBMC samples were collected 6 mo after discontinuing immune suppression and when the patient had controlled his histoplasma infection (by negative histoplasma Ag measurement) in attempts to minimize the impact of recent dexamethasone. However, the patient remained lymphopenic at the time of collection.
TABLE I.
Patient characteristics and clinical phenotypes
| Patient 1 | Patient 2 | |
|---|---|---|
|
| ||
| Age at time of work up | 9 mo | 9 y old |
| Sex | Male | Male |
| Genetic variants | 1) STAT1 c.800C>T; p.Ala267Val, heterozygous, pathogenic, ExAC frequency not reported 2) DNMT3B c.1538C>T (p.Ala513Val), heterozygous, pathogenic, ExAC frequency 0.06% 3) LRBA c.3178A>G (p.Ile1060Val), heterozygous, uncertain significance, ExAC frequency 0.01% 4) TRNT1 c.1057-7C>G (intronic), heterozygous, uncertain significance, ExAC frequency 0.02% |
1) STAT1 c.866A>G; p.Tyr289Cys, heterozygous, pathogenic, ExAC frequency 0.00% 2) LIG4 c.613del (p.Ser205Leufs*29), heterozygous, pathogenic, ExAC frequency 0.03% 3) ATM c.496 + 4T>C (intronic), heterozygous, likely benign, ExAC frequency 0.02% |
| Absolute lymphocyte count | 0.49 × 10³/μl | 1.79 × 10³/μl |
| CD3+ (1700–3600) | 186/mm3 | 1342/mm3 |
| CD4+ (1000–2800) | 108/mm3 | 770/mm3 |
| CD8+ (800–15000) | 69/mm3 | 465/mm3 |
| CD16+CD56+ (200–700) | 198/mm3 | 394/mm3 |
| CD19+ (500–1500) | 821/mm3 | 18/mm3 |
| T cell proliferation to mitogens | Normal to PHA and PWM | Normal to PHA and PWM |
| T cell response to Candida | Decreased in CD45+, normal in CD3+ | Absent |
| T cell response to tetanus | Decreased | Absent |
| NK function (chromium release assay) | Decreased | Decreased |
| CD107a Degranulation | Normal | Normal |
| IgG (320–1150 mg/dl) | 412 | 1188 |
| IgM (40–150 mg/dl) | 24 | 44 |
| IgA (0–90 mg/dl) | 11 | 133 |
| Diphtheria titers (IU/ml) | 1.7 (Protective) | 2.2 (Protective) |
| Tetanus titers (IU/ml) | 0.8 (Protective) | 6.8 (Protective) |
| Streptococcus pneumoniae titers (IU/ml) | 12/13 Serotypes in PCV-13 (protective) | 12/13 Serotypes in PCV-13 (protective) |
ExAC, exome aggregation consortium.
Patient 2 (P2) is male and presented at 8 y of age with an episode of HSV dermatitis of the eyelid followed by aseptic meningitis. Although varicella zoster virus (VZV) was not directly detected in his cerebrospinal fluid (CSF) via PCR, his VZV cerebrospinal fluid IgG index was elevated, suggestive of VZV meningitis. Similar to P1, he has no evidence of current or prior CMC. Immune evaluations demonstrated low frequency and absolute number of NK cells with diminished function by a chromium release assay, yet normal CD107a expression. T cell and B cell populations were quantitatively within normal range, including memory and naive subsets. He demonstrated normal Ig levels, with appropriate postvaccine titers. A primary immunodeficiency next-generation sequencing panel revealed a pathogenic variant in STAT1, c.866A>G (p.Tyr289Cys), in the coiled-coiled domain. Familial testing was not performed. This variant has been reported to increase STAT1 phosphorylation and has also been reported in individuals with CMC (3, 6). PBMCs from P2 were collected at a baseline several years after treatment for the episodes of HSV dermatitis and VZV meningitis and while not experiencing detectable immune or infectious complications.
Although the two STAT GOF patients had known pathogenic variants, they had distinct histories and neither had been reported with CMC that can characterize this disease. To test the whether STAT1 was activated in these patients, we performed phospho-flow cytometry on T cell, B cell, NK cell, and macrophage populations in comparison with heathy pediatric (HP) or healthy adult (HA) donors (Fig. 1). Both patients with STAT1 GOF mutations exhibited increased basal p-STAT1 compared with HA individuals in T, B, NK, and myeloid cells, with T cells and NK cells appearing most strongly affected. T cells from P1 exhibited 5-fold higher basal p-STAT1 compared with the median p-STAT1 levels in HA donors (0.1, interquartile range [IQR] = 0.3), whereas T cells from P2 exhibited a 7-fold increase in basal p-STAT1 compared with the median phosphorylation of HA donor T cells. Basal STAT1 signaling did not appear greatly impacted in the B cell compartment in either patient, as B cells had a comparatively modest increase in p-STAT1 signaling of 1.4-fold (P1) and 1.9-fold (P2) over the median p-STAT1 compared with HA controls. NK cells from P1 exhibited 2.9-fold increased STAT1 phosphorylation and NK cells from P2 displayed 4-fold increased phosphorylation compared with the median of HA controls (0.2, IQR = 0.4). Myeloid cells had the greatest basal STAT1 phosphorylation (median = 0.4; IQR = 0.6). Similar to the lymphoid populations, myeloid cells expressed 2-fold greater p-STAT1 in P1 and 3-fold higher p-STAT1 in P2. Interestingly, basal p-STAT3 and p-STAT5 were also increased in both patient samples across these immune cell types, indicating broadly increased STAT signaling and immune activity in the patients with STAT1 GOF mutations that may be a consequence of altered cytokine profiles and signaling. These data show that STAT1 GOF mutations may have direct and indirect impacts on other STAT signaling pathways. These two patients cannot reflect the diversity of phenotypes observed in STAT1 GOF, but the distinct clinical phenotypes and activated STAT proteins prompted a detailed analyses of immune cell phenotypes, metabolism, and response to cytokines.
FIGURE 1. Patients with STAT1 GOF mutations exhibit elevated basal STAT phosphorylation across multiple immune subsets.

(A) Representative histogram plots indicating the basal expression of p-STAT1 (top), p-STAT3 (middle), or p-STAT5 (bottom) within indicated manually gated immune cell populations. (B) Quantification of the arcsinh-transformed median intensity values of indicated p-STAT proteins normalized to the minimum expression value across all immune subsets. Bars represent median intensity values. Error bars indicate the interquartile range.
STAT1 GOF patients have altered T cell subsets and activation states
We performed detailed immunophenotyping with high-dimensional mass cytometry to determine how STAT1 GOF influenced immune cell populations in these two patients (gating schema in Supplemental Fig. 1). Immune phenotyping was performed via CyTOF with three different Ab panels to characterize T, B, and myeloid cell subsets, activation states, and metabolism in detail (Supplemental Table I). Similar to current literature, there was a large degree of heterogeneity among the cell subsets between the two patients with STAT1 GOF mutations (6, 8, 26). T cells from five HA donors, two HP donors, P1, and P2 were analyzed with individual data points shown for each immune phenotyping repeat. Despite different clinical phenotypes, dimensionality reduction using t-SNE plots in P1 and P2 demonstrated several similarities when compared with HP and HA individuals (Fig. 2A). For each patient with a STAT1 GOF mutation, the T cell populations in the t-SNE plots demonstrated a notable alteration in naive (Tn) and memory T cell populations compared with healthy donors. As expected, given the dependence of memory cell populations on age, the frequency of Tn cells of P1 and P2 more closely resembled the HP controls compared with HA controls (Fig. 2B). In the CD8+ population, the frequency of central memory T (Tcm) and effector memory T (Tem) cells in P1 and P2 followed a similar patter to the HP controls. However, in the CD4+ population, there was a relative increase of Tcm cells for P1 and P2 and a decrease of Tem populations for P2 compared with both HP and HA controls. In the CD4+ pool, P1 consisted of 16% Tcm and 6% Tem cells; P2 consisted of 23% Tcm and 4% Tem cells; the HP had 2% Tcm and 6% Tem cells; and the HA had 12% Tcm and 16% Tem cells.
FIGURE 2. STAT1 GOF patients demonstrate comparable alterations in memory, helper, and activated T cell subsets.

(A) Representative t-SNE-CUDA plots depicting the density of CD45+CD3+ cells (heat) from a representative healthy adult (HA) donor (far left), healthy pediatric (HP) donor (middle left), patient 1 (middle right), or patient 2 (right). Density contours indicate the cells from each patient overlaid onto a contour plot of cells pooled from each sample. T cell memory populations are indicated in manually gated populations overlaid onto the t-SNE-CUDA plot on the far right. (B) Bar charts demonstrating the frequency of CD8+ (left) and CD4+ (right) central memory (Tcm), effector memory (Tem), and naive T (Tn) cell populations in five healthy adult controls, two healthy pediatric controls, and two to three replicated in two patients with STAT1 GOF mutations. (C and D) Heatmaps indicating the arcsinh transformed median values of 27 phenotypic markers expressed in CD8+ Tcm, Tem, or Tn populations (C) or CD4+ T cells (D) manually gated from healthy adult donor PMBCs (gray), healthy pediatric PBMCs (white), patient 1 (P1) (blue), or patient 2 (P2) (red). Graphs above each heatmap indicate the arcsinh fold change expression of each marker relative to the minimum median mass intensity. (E) Representative t-SNE-CUDA plot (left) overlaying manually gated helper T cell populations onto pooled CD45+CD3+ cells as in (A). Bar graphs (right) indicate the frequency of each manually gated T helper subset within the CD4+ T cell pool from five healthy donors, two healthy pediatric donors, and one to two replicates in STAT1 GOF patients. For all components within the figure, all values represent the median statistic. Errors bars indicate the interquartile range. A two-way ANOVA was used to compare groups. *p < 0.05, **p < 0.01.
Not only were T cell memory frequencies altered in the patients with STAT1 GOF, but T cells appeared more activated in these patients. Both CD4+ and CD8+ Tn, Tcm, and Tem cells from P1 and P2 had elevated levels of a wide range of T cell signaling and activation markers, including CD3, CD27, and CD38 (Fig. 2C, 2D) compared with both HP and HA controls. Specifically, CD8+ Tcm cells from both patients expressed higher levels of CD3 (P1, 1.3-fold; P2, 1.3-fold), CD38 (P1, 3-fold; P2, 2-fold), ICOS (P1, 2-fold; P2, 2-fold), and CD27 (P1, 1.5-fold; P2, 1.6-fold) compared with HA individual populations (Fig. 2C). Similar trends were identified in CD8+ Tem and Tn populations as well as Tcm, Tem, and Tn subsets in the CD4+ T cell compartment (Fig. 2D). Interestingly, CD95 was more abundantly expressed on Tem cells in the patients with STAT1 GOF compared with HA and HP individuals. CD95 was upregulated in the CD8+ Tem cells for both STAT1 GOF patients (P1, 1.3-fold; P2, 1.5-fold) and was elevated in the CD4+ Tem population of P2 (1.5-fold) compared with HA donors. These data suggest an increased activation state or chronic stimulation across T cell populations in patients with STAT1 GOF.
Th cell differentiation into functional subsets in STAT1 GOF patients was next investigated. Using surface markers characteristic of CD4+ subsets, effector (Th1, Th2, Th17, T follicular helper [Tfh]) and regulatory T cell (Treg) populations in P1 and P2 were compared with healthy donors (Fig. 2E, Supplemental Fig. 1A). Whereas the frequencies of CXCR3+ Th1-like T cells were more abundant in P1 and P2, CCR4+ Th2-like cells appeared to be diminished in P1 and P2 compared with all healthy donors. Th17 cells were also less frequent in P2, consistent with what has been previously described in STAT1 GOF mutations (6). Notably, the circulating CXCR5+PD-1+ Tfh cell population in P1 and P2 more closely resembled the HP individuals and had elevated frequencies compared with HA individuals. The frequency of Tfh cells was much more elevated in P2 (5%) than P1 (2%). Lastly, the frequency of Tregs in P1 was slightly higher than HA and HP donors while few Tregs were evident in P2. Taken together, these data show that STAT1 GOF can alter heterogeneous T cell populations and activation states, yet with shared increased frequencies of some populations such as Th1 cells.
STAT1 GOF and B cell, NK cell, and myeloid immunophenotyping
Given the alterations of T cell populations caused in patients with STAT1 GOF mutations, we next examined other immune cell populations. The T cell panel of Abs for mass cytometry also included the NK cell markers CD16 and CD56, and these data were also examined to assess potential changes in NK cell populations. The NK cell populations for both P1 and P2 were diminished compared with HA and HP controls. No consistent difference in abundance of CD56+ and CD56− NK cells was observed between the two STAT1 GOF patients compared with either HA or HP donors; however, P1 appeared to possess a higher frequency of mature CD56− NK cells and a lower frequency of CD56+ NK cells compared with P2 or healthy donors (Fig. 3A, 3B, Supplemental Fig. 1A). In both cases, however, NK cells in the STAT1 GOF patients had elevated expression of CD127, CD95, and HLA-DR to suggest activated states (Fig. 3C). A separate panel of Abs focused on B cell surface markers was used to identify B cell populations by mass cytometry (Supplemental Table I). Dimensionality reduction using t-SNE plots showed distinct patterns in the frequencies of B cell subsets in patients with STAT1 GOF (Fig. 4A). Identification of each population showed that both patients had more mature B cells than did HA donors, as well as more naive B cells than HA donors. Notably, however, class-switched memory B cells were greatly reduced to only 3% in P1 and P2, compared with 16% in HA individuals and 13% in HP donors (Fig. 4B, Supplemental Fig. 1B). Few individual markers were consistently altered within a given population except for CD38, which was increased in the class-switched B cells and naive B cells that were present in patients with STAT1 GOF (Fig. 4C). Finally, a myeloid cell–focused panel of Abs was used to examine the innate cell populations (Fig. 5). Myeloid cell populations showed increased frequencies of inflammatory monocytes and classical dendritic cell (cDC) populations were noted in the patients with STAT1 GOF with P1 having more cDCs, and P2 having more inflammatory monocytes (Fig. 5A, 5B, Supplemental Fig. 1C). Plasmacytoid DCs (pDCs) were infrequent but further reduced in both patients. With the exception of granulocytes, the expression of S100A9 and HLA-DR was relatively elevated to suggest that myeloid cells were also broadly activated (Fig. 5C). Taken together, these data show shifts in multiple immune cell populations to more activated or mature states that reflect a general increase in inflammatory tone.
FIGURE 3. Quantification of NK cell populations in patients with STAT1 GOF mutations.

(A) Representative biaxial plots indicating the frequencies of CD16+CD56− regulatory NK cells and CD16+CD56+ cytotoxic NK cells in healthy donor or patient PBMCs. (B) Bar charts indicating the frequency of NK cells subsets in n = 5 healthy donors and three to four replicates within each STAT1 GOF patient. (C) Heatmaps indicating the arcsinh-transformed median values of 27 phenotypic markers expressed in manually gated CD56+ or CD56− NK cell populations. Graphs above each heatmap indicate the median arcsinh fold change expression of each marker relative to the minimum median mass intensity. All statistics represent the median value. Errors bars indicate the interquartile range. A two-way ANOVA was used to compare groups. *p < 0.05, **p < 0.01, ***p < 0.001. HA, healthy adult. HP, healthy pediatric.
FIGURE 4. Deficit of class-switched B cells in patients with STAT1 GOF mutations.

(A) Representative t-SNE-CUDA plots depicting the density of CD45+CD19+CD20+ cells (heat) from each individual healthy adult (HA) donor (far left), healthy pediatric (HP) donor (middle left), patient 1 (middle right), or patient 2 (right). Density contours indicate the individual patient’s cells overlaid onto a contour plot of cells pooled from each sample. B cell populations are indicated in manually gated subsets overlaid onto the t-SNE-CUDA plot on the far right. (B) Bar charts demonstrating the frequency of manually gated B cell populations in five healthy adult controls, two healthy pediatric controls, and two patients with STAT1 GOF mutations. (C) Heatmaps indicating the arcsinh-transformed median values of 24 phenotypic markers expressed in manually gated populations of immature B cells (Imm), mature B cells (Mat), naive B cells (Naive), class-switched B cells (CS), non–class-switched B cells (Non-CS) and plasmablasts (PB). Graphs above each heatmap indicate the arcsinh fold change expression of each marker relative to the minimum median mass intensity. For all components of the figure, all values represent the median statistic. Errors bars indicate the interquartile range. A two-way ANOVA was used to compare groups. *p < 0.05, **p < 0.01, ***p < 0.001, ****p < 0.0001.
FIGURE 5. Myeloid populations in patients with STAT1 GOF mutations have increased immature monocytes and classic dendritic cells.

(A) Representative t-SNE plots depicting the density of CD45+CD3−CD19−CD56− cells (heat) from each individual healthy adult (HA) donor (far left), healthy pediatric (HP) donor (middle left), P1 (middle right), or P2 (right). Density contours indicate the individual patient’s cells overlaid onto a contour plot of cells pooled from each sample. Myeloid populations are indicated in manually gated subsets overlaid onto the t-SNE-CUDA plot on the far right. (B) Bar charts demonstrating the median frequency of manually gated B cell populations in five healthy controls and two patients with STAT1 GOF mutations. (C) Heatmaps indicating the arcsinh-transformed median values of 29 phenotypic markers expressed in manually gated populations of monocytes (mono), inflammatory monocytes (i-mono), granulocytes (gran), classical dendritic cells (cDC), and plasmacytoid dendritic cells (pDC). Graphs above each heatmap indicate the median arcsinh fold change expression of each marker relative to the minimum median mass intensity. For all components of the figure, all values represent the median statistic. Errors bars indicate the interquartile range. A two-way ANOVA was used to compare groups. *p < 0.05, **p < 0.01.
Increased markers of active cell metabolism in pediatric STAT1 GOF
T cell metabolism increases upon stimulation to support bioenergetics, biosynthesis, and cell signaling, and these processes may be affected by STAT1 (27, 28). Early after activation both glucose and mitochondrial metabolism increase, with glucose metabolism decreasing and mitochondrial lipid oxidation becoming dominant as T cells transition to memory phenotypes (9). To assess how STAT1 GOF affected these metabolic processes, expression of the glucose transporter 1 (GLUT1) and the mitochondrial lipid transporter, carnitine palmitoyl transferase 1A (CPT1a) was measured by mass cytometry. We focused on GLUT1 and CPT1a because STAT1 can bind to near or on promoter regions for these genes, as determined by analysis of Encyclopedia of DNA Elements (ENCODE) project (29, 30) data (Supplemental Fig. 2), and we previously showed them to be representative of diverse metabolic phenotypes in vivo (9). Interestingly, both patients with STAT1 GOF mutations expressed higher levels of GLUT1 and CPT1a across different cell subtypes compared with healthy individuals, especially when compared with the HP donors (Fig. 6A, 6B). Notably in the T cell subsets specifically, both P1 and P2 demonstrate higher expression of GLUT1 and CPT1a than both the adult and pediatric healthy donors among the Tem, Temra (Tem CD45RA+), Th17, Tfh, and Treg populations (Fig. 6C, 6D). P1 demonstrated a >2-fold elevated GLUT1 expression in CD8+ and CD4+ T cells, Tregs, CD4/CD8 double-negative T (DNT) cells, double-positive T (DPT) cells, NKT cells, and γδ T cells compared with HP controls. P1 also had a >2-fold elevated CPT1a in CD4+ T cells and DNT, DPT, γδ T, NK, and B cell subsets. P2 demonstrated even higher GLUT1 and CPT1a expression among CD8+ and CD4+ T cells, Tregs, and DNT, DPT, NKT, and γδ T cells compared with P1. Consistent with a distinct metabolic role, CPT1a showed an expression pattern different from GLUT1. CPT1a expression was notably higher across multiple cell types in HA than HP samples (Fig. 6A, 6B). Interestingly, both STAT1 GOF patient samples had similar or greater CPT1a expression to HA. This was evident in both CD4 and CD8 cell populations as well as CD4 T cell subsets (Fig. 6C, 6D). Taken together, these data suggest early activation states or a failure of memory T cells to downregulate GLUT1 after prolonged stimulation in STAT1 GOF leading to an activated metabolism in multiple immune cell types and point to STAT1 as a key regulator of immune cell metabolism in humans.
FIGURE 6. Increased expression of cell metabolic markers in patients with STAT1 GOF mutations.

(A) Representative t-SNE-CUDA plot depicting the density of CD45+ cells (heat) pooled from five healthy adult (HA) donors, two healthy pediatric (HP) donors, and each patient (left). Manually gated populations were overlaid onto t-SNE contours indicating each immune subset’s position on the t-SNE plot. Right, Heatmaps of indicated expression values of indicated markers on the t-SNE-CUDA plot. (B) Heatmaps indicating the arcsinh-transformed median expression values of GLUT1 (left) and CPT1a (right) on indicated immune populations in healthy donors and STAT1 GOF patients. Graphs above each heatmap indicate the median arcsinh fold change expression of each marker relative to the minimum median mass intensity across all immune subsets. (C) Quantification of the median arcsinh-transformed intensities of GLUT1 (left) and CPT1a (right) in manually gated CD8+ (top) and CD4+ (bottom) naive and memory populations. (D) Quantification of the median arcsinh-transformed intensity values of GLUT1 (left) and CPT1a (right) in manually gated Th subsets as indicated. For all components of the figure, all values represent the median statistic. Errors bars indicate the interquartile range.
Stimulation with IFN-γ and IL-6 demonstrates differential phosphorylation of STAT1 GOF
We next tested the STAT activity of different immune cell populations in response to cytokine stimulation. PBMCs were left unstimulated or treated for 15 min with IFN-α and IFN-γ, cytokines that classically signal directly through STAT1, IL-6, which classically signals through STAT3 but can also activate STAT1, or hydrogen peroxide to broadly inhibit phosphatases and act as a positive control. Cells were analyzed by mass cytometry using phospho-specific Abs to measure the phosphorylation of STAT1 and STAT3 in distinct cell populations (Fig. 7, Supplemental Table II). IFN-α and IFN-γ both increased p-STAT1 and this was heightened from healthy control in P2. P1 generally failed to induce extensive phosphorylation of STAT1 or STAT3 or exhibited modest response to all stimuli, including the positive control hydrogen peroxide (Fig. 7A–C). IL-6 also activates STAT signaling and although this cytokine canonically activates STAT3, it can also activate STAT1 (31). The HA donors demonstrated an expected increase in p-STAT1 following IL-6 stimulation. Whereas this response was reduced in P1, P2 had a markedly broader and strong increase in p-STAT1 following treatment with IL-6. In contrast, the T cell response of STAT3 to IL-6 was similar or less effective in P1 and P2 (Fig. 7A–C). These effects were less clear for pDCs and monocytes/cDCs, which showed modest IFN-induced p-STAT3 to IFN-α and IFN-γ, respectively. P2 had the greatest IFN-α–and IFN-γ–induced phosphorylation of STAT1 across all T cell types and subsets. NK cells from P1 and P2 also showed heightened IFN-γ–induced STAT1 phosphorylation.
FIGURE 7. Stimulation with IFN-γ and IL-6 demonstrates differential phosphorylation of STAT in STAT1 GOF patients.
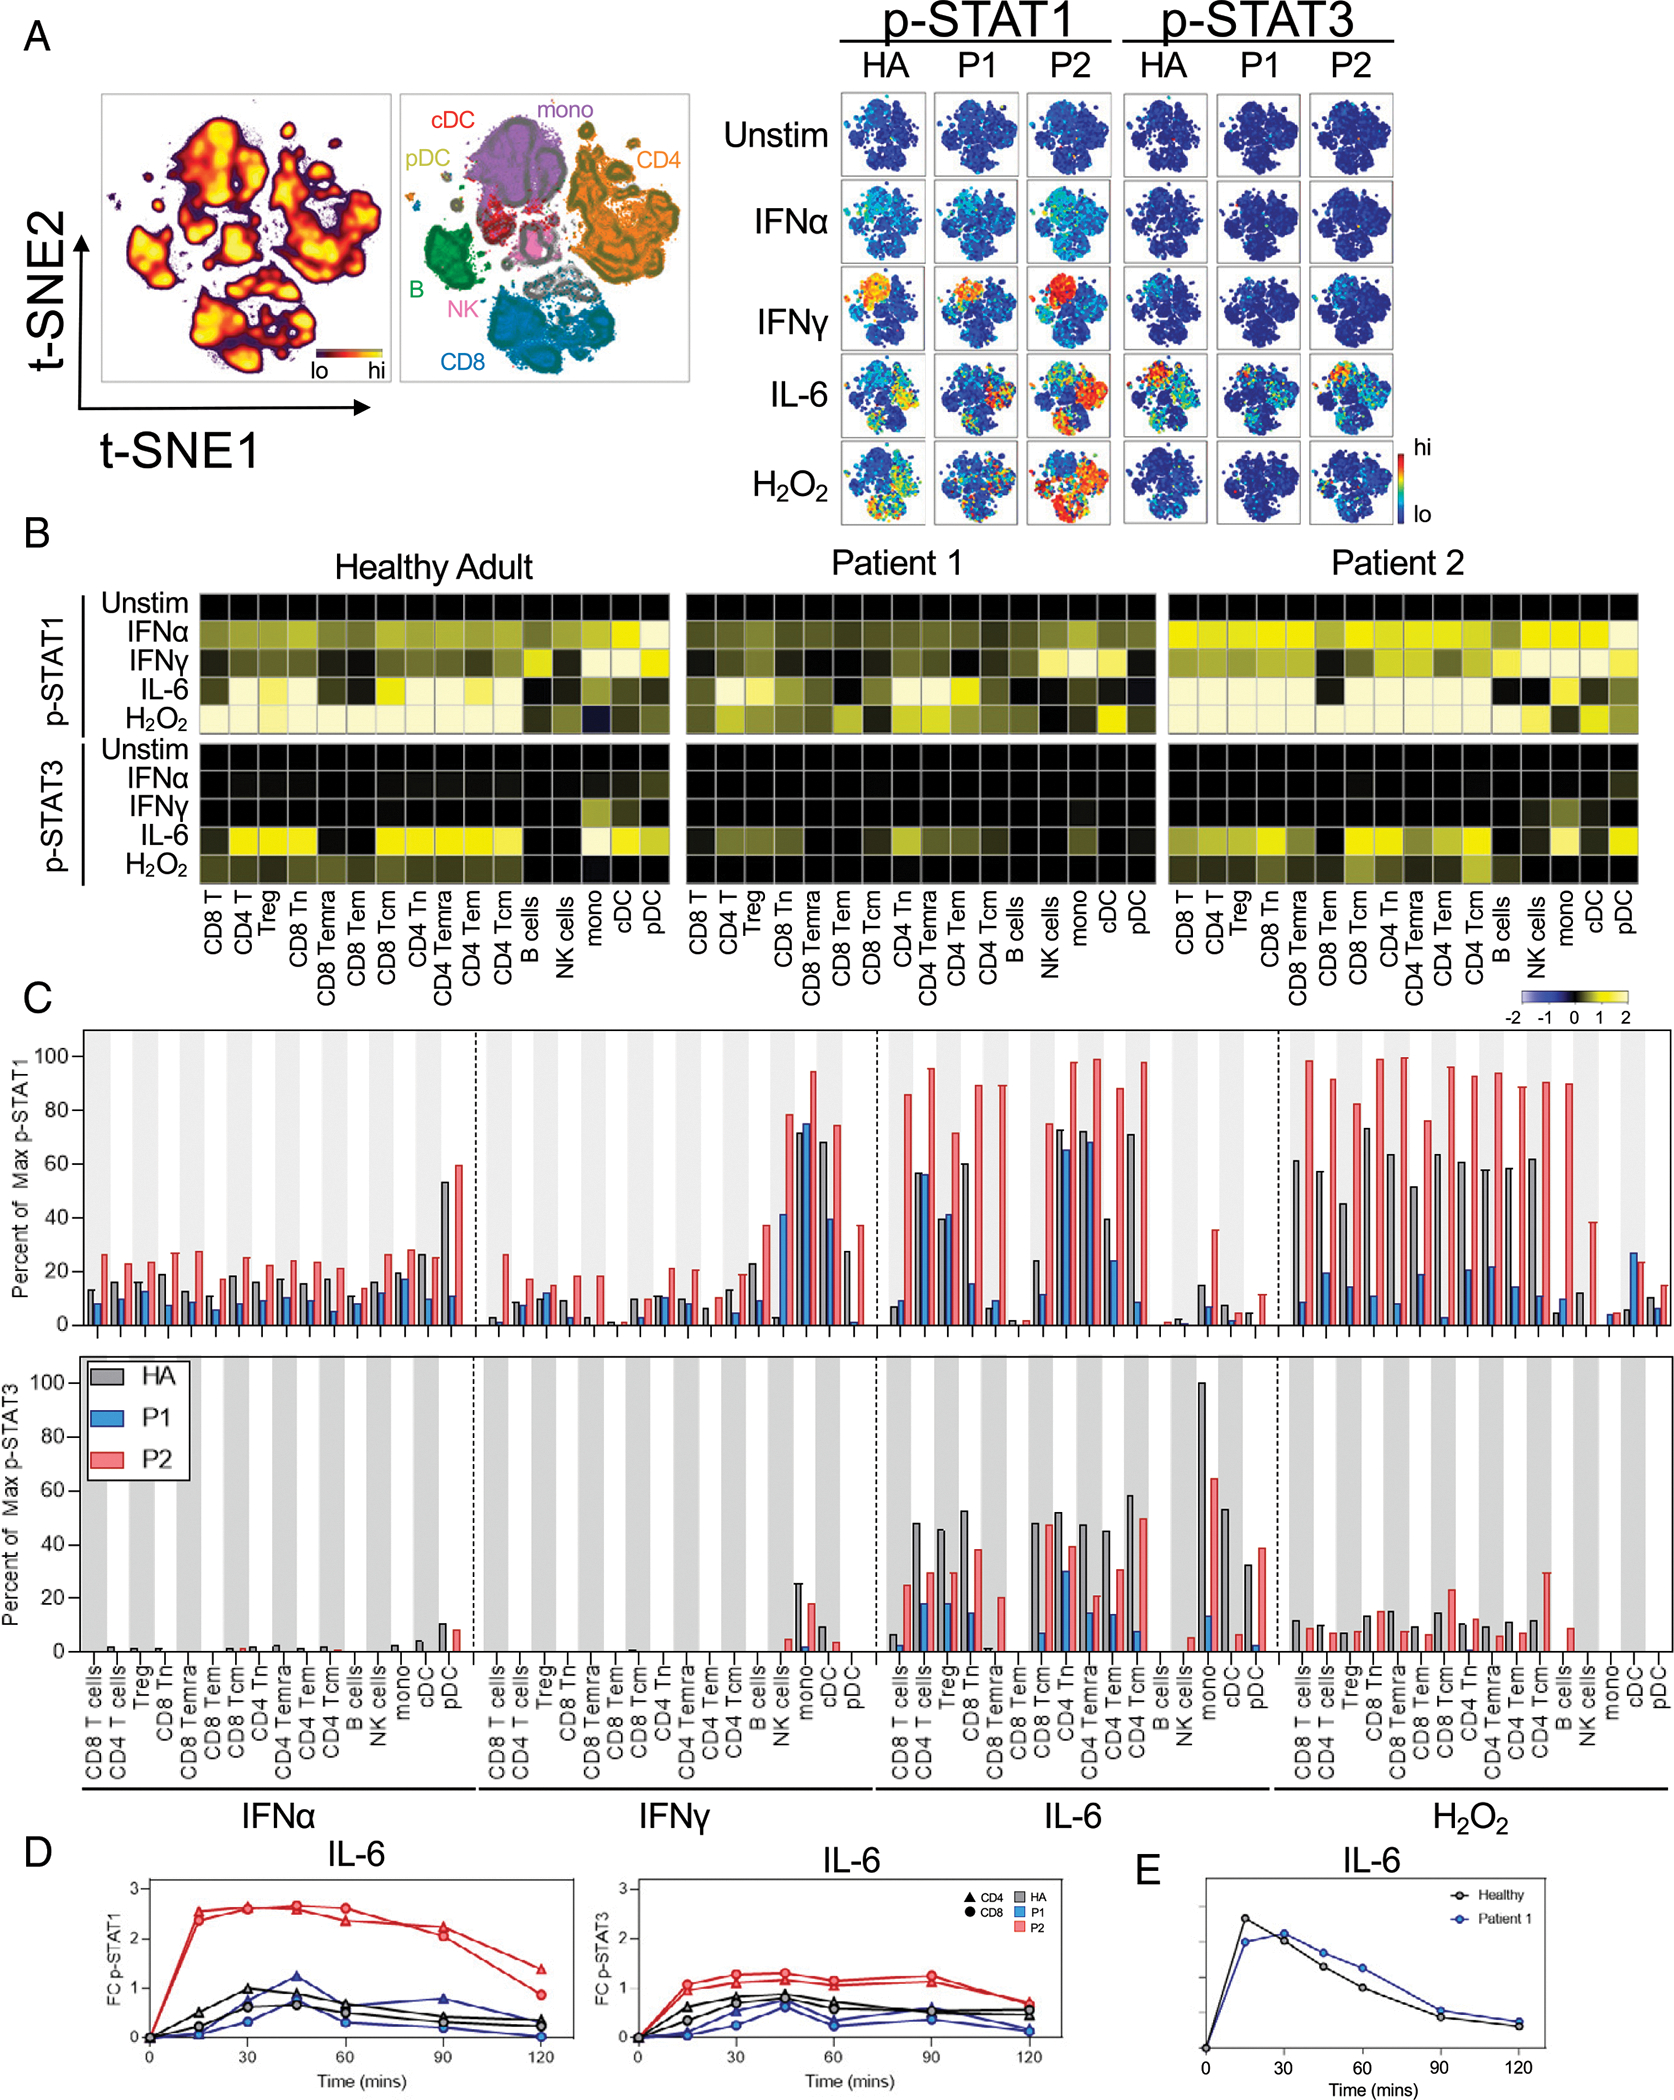
Representative t-SNE plot indicating the density of each CD45+ immune population in the graph (left). Manually gated populations were overlaid onto t-SNE contours indicating each immune subset’s location along the t-SNE axes. Heatmaps on the t-SNE axes indicating the expression of p-STAT1 or p-STAT3 under each given stimulation condition. (B) Heatmaps indicate the median arcsinh-transformed expression values of p-STAT1 (top) or p-STAT3 (bottom) within each indicated manually gated immune population exposed to the indicated cytokine for 15 min. Each value is normalized to each individual’s unstimulated condition. (C) Quantification of the percent of the maximum possible p-STAT1 signal (top) or p-STAT3 signal (bottom) achieved across all manually gated immune subsets and stimulation conditions as indicated. (D) Time course of p-STAT1 (right) or p-STAT3 signaling in response to IL-6 stimulation. Phospho-protein values were arcsinh transformed and normalized to each individual’s baseline (time point 0) median intensity values. Triangles indicate manually gated CD4+ T cells. Circles indicate manually gated CD8+ T cells. All quantification of data used the arcsinh-transformed median mass intensity from mass cytometry data where indicated. (E) Time course of p-STAT1 in P1 in response to IL-6 stimulation using fluorescence flow cytometry. The indicated p-STAT mean fluorescence intensity was normalized and arcsinh transformed each individual’s unstimulated (0 min) value for each T cell population.
It was possible that the 15-min stimulation time point was too brief and P1 would have delayed STAT phosphorylation, CyTOF was insufficiently sensitive, or compensatory mechanisms may dampen all STAT signaling in P1. Given the possibility that immune cells in STAT1 GOF mutations may show altered STAT1 phosphorylation kinetics, we next assessed the temporal regulation of STAT phosphorylation conferred by these STAT1 variants. We next used mass cytometry to compare the kinetics of IL-6–induced STAT phosphorylation in both patients with STAT1 GOF (Fig. 7D). Strikingly, both CD4+ and CD8+ T cells in P2 responded robustly to IL-6, reaching maximum 2.6-fold p-STAT1 above baseline at 15 min after induction. This response was maintained for >90 min, with a significant response maintained to at least 120 min after stimulation. In comparison, the STAT1 response in P1 peaked at 45 min poststimulation before slowly falling to baseline after the 120-min time course. STAT1 phosphorylation in P1 was tested at multiple time points using fluorescent flow cytometry following treatment with IL-6 (Fig. 7E, Supplemental Fig. 1D). P1 cells did have cytokine-induced p-STAT1, but these were similar in level to those of HA donors. IL-6 can thus lead to ro-bust and sustained activation of p-STAT1 more than that induced by IFN-γ and was exacerbated in STAT1 GOF P2, which may contribute to disease pathogenesis, although this effect is context specific and may be considered on an individual patient basis.
DISCUSSION
We have identified profound and specific impacts on the immune systems in two patients with STAT1 GOF mutations through deep immune profiling. These changes included enhanced and altered T cell activation and an overall shift in multiple hematopoietic cell lineages and including the balance of memory and Th cells. The findings in the present study highlight a unique immune and immunometabolic phenotype and pattern of cytokine response that may play a role in T cell differentiation and memory in STAT1 GOF patients. Cell surface and metabolic markers that reflect the distinct pathways of glycolysis and lipid oxidation (9) suggested that both pediatric patients with STAT1 GOF mutations had a more metabolically activated phenotype that more closely resembled adult donors than age-similar pediatric donors. STAT1 GOF patients can show heterogeneous clinical phenotypes, and our results describe two examples with an in-depth systems immunology approach (Table II).
TABLE II.
Summary of STAT1 GOF patients here and previously described cohorts
| Patient 1 | Patient 2 | Previously Described in STAT1 GOF cohorts | |
|---|---|---|---|
|
| |||
| Location of the variant | CCD | CCD | CCD (52.6%) (8) |
| Infections | |||
| CMC | no | no | yes (98% of patients) (6,8) |
| Bacterial | no | no | yes (74% of patients) (6) |
| Fungal (non-CMC) | yes | no | yes (10% of patients) (6) |
| Viral | no | yes | yes (38% of patients) (6) |
| Autoimmunity | |||
| Thyroid disease | no | no | yes (22% of patients) (6) |
| Diabetes | no | no | yes (4% of patients) (6) |
| Malignancy | no | no | yes (6% of patients) (6) |
| HLH | yes | no | yes (44) |
| Dysgammagloulinemia | no | no | high serum IgG (in 20%) or low (in 3% of the patients tested), impaired antigenspecific antibodies against tetanus, diphtheria toxoid, or poliovirus (23% of the patients) (8) |
| Immune phenotyping (relative frequencies) | |||
| CD8+ T cells | low | low | low in 16% of patients studied (6) |
| CD4+ T cells | low | low | low in 28% of patients studied (6) |
| CD4+ Tcm | high | high | high (47) |
| CD8+ Tcm | high | high | not described |
| CD4+ Tem | low | low | low (47) |
| CD8+ Tem | low | low | high (47) |
| Th17 subset | low | low | low in 82% of patients (8, 46) |
| Th1 subset | “variable” | “variable” | high (8, 46) |
| Th2 subset | low | low | low (8, 46) |
| TfH | high | high | “normal” (8, 46) |
| CD19+ B cells | low in 19% of patients studied (6) | ||
| Class switch memory B cells | low | low | low in 49% of patients studied (6) |
| NK cell population (CD56br and CD56dim) | high CD56−, low CD56+ | low | low total NK in 25% of patients studied (6); low CD56dim |
| NK cell dysfunction | yes | yes | yes |
| CD4+, CD8+ Tcm and Tem Activation Markers | |||
| CD44, CD27, CD38 | high | high | not described |
| NK Acitvation Markers | |||
| CD127,CD95, HLA-DR | high | high | not described |
| Myeloid Acitvation Markers | |||
| S100A9, HLA-DR | high | high | not described |
| Metabolism | |||
| GLUT1 expression | high | high | not described |
| CPT1a expression | high | high | not described |
| Stimulation Assays | |||
| elevated pSTAT1 to IFN | no | yes | yes (8) |
| elevated pSTAT1 to IL-6 | no | yes | yes (7) |
Percentages (%) are listed only when the data has been aggregated in larger cohort studies of patients with STAT1 GOF mutations
Immunometabolic phenotypes have not been previously described in STAT1 GOF patients and suggest that STAT1 may modulate the metabolism of multiple immune cell lineages. The facultative glucose transporters of the GLUT family are a key component of metabolic control, affecting T cell differentiation and activation (32). GLUT1 plays a key role for effector T cells, but is dispensable for Tregs, and it may instead diminish their function (32). The increased expression of GLUT1 in STAT1 GOF Tregs may indicate a more effector and less suppressive phenotype, and when combined with the lower percentage of Tregs in P2, may be responsible for the increased risk of autoimmune disease. Conversely, CPT1a protein is a mitochondrial lipid transporter responsible for catalyzing the rate-limiting step of the fatty acid oxidation pathway. This pathway plays an important role in cell proliferation and suppression of apoptosis. Our two patients had an overall pattern of increased GLUT1 and CTP1a expression across immune cells, indicating an activated glycolytic and fatty acid oxidation metabolic program similar to what was recently described for early activated T cells (9) despite that neither patient had clinical evidence of ongoing infection or inflammation. Previous chromatin immunoprecipitation sequencing analysis in the ENCODE database has suggested that STAT1 binds to the promoter region of GLUT1 and CPT1a in EBV-transformed B cells, perhaps explaining these metabolic differences (29, 30).
The JAK-STAT pathway is responsible for reacting to extracellular signals necessary for T cell proliferation and function (33, 34). IL-6 has been described to activate STAT1 and STAT3 (34), with STAT3 activation leading to T cell recruitment and survival, as well as maintenance of activated T cells in inflammatory tissues (35–38). IL-6 activation of STAT1 is more regulatory and determines transcriptional output of STAT3 (39–42). These activities suggest that IL-6 affects CD4+ T cell memory (34, 43–46). Although IL-6 signaling is not required for the generation or maintenance of memory T cells (43, 47), it has been demonstrated to promote the effector characteristics of CD4+ Tem cells (34). Phosphorylation of STAT1 in response to IL-6 is also diminished in activated and memory CD4+ T cells (34). In a murine model of the role of STAT proteins in activated T cells (34), strong IL-6 induction of p-STAT1 was observed in naive CD4+ T cells but was less in CD4+ Tcm and Tem cells. The regulation of IL-6–induced STAT1 phosphorylation in activated cells has been proposed to be limited by the tyrosine phosphatases PTPN2 (34). We hypothesize that the decreased rate of p-STAT1 dephosphorylation in P2 may similarly result in elevated and prolonged p-STAT1 signaling and impaired memory formation leading to his clinical phenotype, in particular his ability to not develop disease with initial infection but pathology with recurrent HSV and VZV.
STAT1 GOF is associated with a broad range of clinical presentations and findings. In this study, we demonstrate two examples of the wide clinical phenotype that patients with STAT1 GOF can present. Although common in this patient population, neither patient here had evidence of current or past CMC, which may be attributed to the early identification of STAT1 GOF mutations, as well as timely prophylaxis. The IFN response of STAT1 GOF patients and distinct mutations can be heterogeneous and may reflect multifactorial transcriptional and biological regulation (48, 49). The development of HLH is an infrequent manifestation of STAT1 GOF mutations (50). The mechanism of HLH development in STAT1 GOF is unknown, but possible suggested pathways include impaired NK cell function as seen in familial HLH (51) and abnormal IFN-γ signaling given the dominant role of this cytokine in driving immune dysregulation in patients with impaired cytotoxicity (52). Using our stimulation panel, we were able to demonstrate that IL-6 leads to a differing pattern of p-STAT1 response than IFN-γ stimulation in the patients with STAT1 GOF mutations than previously described (52). While recognizing our small sample size, given the degree of signal intensity in response to IL-6, follow-up assays are warranted to determine whether IL-6 is a potential additional target for control of the consequences of increased p-STAT1 in this patient cohort.
Our data suggest the role of IL-6 may become considered when discussing therapeutic interventions for this patient population. Treatment recommendations for patients with STAT1 GOF are not well established and include JAK inhibition and curative bone marrow transplant. NK cell dysfunction and/or deficiency is well described in STAT1 GOF patients (51) and is at least partially responsive to JAK inhibition (3). Long-term outcomes with JAK inhibition are lacking, and transplant survival rates to date have been very poor compared with other immune diseases, including familial HLH (50). With identification of IL-6 as a potential pathway to drive STAT1 GOF activity, further studies are needed to determine whether blockade can result in better immune modulation, particularly for those patients with HLH.
STAT1 GOF mutations are rare, and a limitation to our study is reliance on a two-patient cohort. As is the case when using patient samples, there are limitations to assays that can be performed, and samples are reflective of the state of the patient at the time of the blood drawn, including environmental exposures and other external factors. As such, we recognize that the phenotype of these patients could be affected by both cell-intrinsic and cell-extrinsic processes. Notably, across all of the stimulation assays P1 had a slightly diminished overall response in p-STAT1 compared with P2 and healthy individuals. These data suggest a general defect or potential repressive mechanism for cytokine signaling in this patient. Although prior immune modulation with corticosteroids may have affected his cellular response, P1 had not received corticosteroids for 6 mo prior to study samples being obtained. One possible explanation is that P1 has an intrinsic cellular defect in the ability to respond to certain cytokine stimulation. It has been demonstrated that repetitive IFN-γ stimulation in STAT1 GOF results in a blunted response (24). If a similar mechanism occurred in P1, he may have developed an improper IFN-γ–dependent immune challenge to histoplasmosis resulting in disseminated infection and would also explain his repressed in vitro p-STAT1 signaling to IFN-γ in our experiment.
Our findings based on two patients with STAT1 GOF mutations in the coiled-coil domain demonstrate that despite differing clinical presentations including age at first disease manifestation, many immune phenotypic features were shared by both patients. These shared phenotypes may be fundamental to STAT1 GOF pathology. There were also notable differences between P1 and P2, but as has been described in the literature, variability among the immune phenotype of STAT1 GOF patients is the norm and not the exception (6, 8, 26, 53). Our study adds unique data to this literature, including the demonstration of an activated phenotype and metabolism across T cell populations that could provide insight into mechanisms of disease, and why some patients have differing clinical phenotypes. With identification of IL-6 signaling playing a potential role in T cell maturation, further studies will are needed to determine whether IL-6 modulation could be used as a treatment modality. Finally, deep immunophenotyping beyond basic and clinically available lymphocyte subsets in patients with inborn errors of immunity IEIs such as STAT1 GOF can point to new discoveries in human immunity and inflammation and lead to improved knowledge of cytokines and cellular signaling, such as the IL-6 pathway, in normal and pathogenic hematopoiesis and cellular maturation.
Supplementary Material
ACKNOWLEDGMENTS
We thank our patients and their families for participation in this work, and for their willingness to contribute to our understanding of inborn errors of immunity. We also thank members of the Rathmell and Irish laboratories as well as members of the Human Immunology Discovery Initiative and Summer Brown for administrative and Institutional Review Board support.
This work was supported by the Department of Health and Human Services/National Institutes of Health/ National Cancer Institute Grants 5K12 CA090625-21 (to S.K.), R01 DK105550 (to J.C.R), and CA212447 (to T.B.), as well as by the Human Immunology Discovery Initiative of the Vanderbilt Center for Immunobiology.
Abbreviations used in this article:
- arcsinh
inverse hyperbolic sine
- cDC
classical dendritic cell
- CMC
chronic mucocutaneous candidiasis
- CPT1a
carnitine palmitoyl transferase 1A
- DNT
double-negative T
- DPT
double-positive T
- GLUT1
glucose transporter 1
- GOF
gain-of-function
- HA
healthy adult
- HLH
hemophagocytic lymphohistiocytosis
- HP
healthy pediatric
- IEI
inborn error of immunity
- IQR
interquartile range
- P1
patient 1
- P2
patient 2
- pDC
plasmacytoid DC
- t-SNE
t-distributed stochastic neighbor embedding
- Tcm
central memory T
- Tem
effector memory T
- Tfh
T follicular helper
- Tn
naive T
- Treg
regulatory T cell
- VZV
varicella zoster virus
Footnotes
DISCLOSURES
J.C.R. is a founder, scientific advisory board member, and stockholder of Sitryx Therapeutics, a scientific advisory board member and stockholder of Caribou Biosciences, a member of the scientific advisory board of Nirogy Therapeutics, has consulted for Merck, Pfizer, and Mitobridge within the past three years, and has received research support from Incyte Corp., Calithera Biosciences, and Tempest Therapeutics. J.M.I. was a co-founder and a board member of Cytobank Inc. and has engaged in sponsored research with Incyte Corp., Janssen Bio-tech, and Pharmacyclics. J.A.C. has served on advisory boards for X4 Pharmaceuticals, Horizon Therapeutics, and Sobi within the past three years. The other authors have no financial conflicts of interest.
The online version of this article contains supplemental material.
REFERENCES
- 1.Gadina M, Johnson C, Schwartz D, Bonelli M, Hasni S, Kanno Y, Changelian P, Laurence A, and O’Shea JJ. 2018. Translational and clinical advances in JAK-STAT biology: the present and future of jakinibs. J. Leukoc. Biol. 104: 499–514. [DOI] [PubMed] [Google Scholar]
- 2.Loh CY, Arya A, Naema AF, Wong WF, Sethi G, and Looi CY. 2019. Signal transducer and activator of transcription (STATs) proteins in cancer and inflammation: functions and therapeutic implication. Front. Oncol. 9: 48. [DOI] [PMC free article] [PubMed] [Google Scholar]
- 3.Vargas-Hernández A, Mace EM, Zimmerman O, Zerbe CS, Freeman AF, Rosenzweig S, Leiding JW, Torgerson T, Altman MC, Schussler E, et al. 2018. Ruxolitinib partially reverses functional natural killer cell deficiency in patients with signal transducer and activator of transcription 1 (STAT1) gain-of-function mutations. J. Allergy Clin. Immunol. 141: 2142–2155.e5. [DOI] [PMC free article] [PubMed] [Google Scholar]
- 4.Villarino AV, Kanno Y, Ferdinand JR, and O’Shea JJ. 2015. Mechanisms of Jak/STAT signaling in immunity and disease. J. Immunol. 194: 21–27. [DOI] [PMC free article] [PubMed] [Google Scholar]
- 5.Mizoguchi Y, and Okada S. 2021. Inborn errors of STAT1 immunity. Curr. Opin. Immunol. 72: 59–64. [DOI] [PubMed] [Google Scholar]
- 6.Toubiana J, Okada S, Hiller J, Oleastro M, Lagos Gomez M, Aldave Becerra JC, Ouachee-Chardin M, Fouyssac F, Girisha KM, Etzioni A, et al. ; International STAT1 Gain-of-Function Study Group. 2016. Heterozygous STAT1 gain-of-function mutations underlie an unexpectedly broad clinical phenotype. Blood 127: 3154–3164. [DOI] [PMC free article] [PubMed] [Google Scholar]
- 7.Liu L, Okada S, Kong XF, Kreins AY, Cypowyj S, Abhyankar A, Toubiana J, Itan Y, Audry M, Nitschke P, et al. 2011. Gain-of-function human STAT1 mutations impair IL-17 immunity and underlie chronic mucocutaneous candidiasis. J. Exp. Med. 208: 1635–1648. [DOI] [PMC free article] [PubMed] [Google Scholar]
- 8.Okada S, Asano T, Moriya K, Boisson-Dupuis S, Kobayashi M, Casanova JL, and Puel A. 2020. Human STAT1 gain-of-function heterozygous mutations: chronic mucocutaneous candidiasis and type I interferonopathy. J. Clin. Immunol. 40: 1065–1081. [DOI] [PMC free article] [PubMed] [Google Scholar]
- 9.Levine LS, Hiam-Galvez KJ, Marquez DM, Tenvooren I, Madden MZ, Contreras DC, Dahunsi DO, Irish JM, Oluwole OO, Rathmell JC, and Spitzer MH. 2021. Single-cell analysis by mass cytometry reveals metabolic states of early-activated CD8+ T cells during the primary immune response. Immunity 54: 829–844.e5. [DOI] [PMC free article] [PubMed] [Google Scholar]
- 10.Healey DCC, Cephus JY, Barone SM, Chowdhury NU, Dahunsi DO, Madden MZ, Ye X, Yu X, Olszewski K, Young K, et al. 2021. Targeting in vivo metabolic vulnerabilities of Th2 and Th17 cells reduces airway inflammation. J. Immunol. 206: 1127–1139. [DOI] [PMC free article] [PubMed] [Google Scholar]
- 11.Beckermann KE, Hongo R, Ye X, Young K, Carbonell K, Healey DCC, Siska PJ, Barone S, Roe CE, Smith CC, et al. 2020. CD28 costimulation drives tumor-infiltrating T cell glycolysis to promote inflammation. JCI Insight 5: e138729. [DOI] [PMC free article] [PubMed] [Google Scholar]
- 12.Siska PJ, Beckermann KE, Mason FM, Andrejeva G, Greenplate AR, Sendor AB, Chiang YJ, Corona AL, Gemta LF, Vincent BG, et al. 2017. Mitochondrial dysregulation and glycolytic insufficiency functionally impair CD8 T cells infiltrating human renal cell carcinoma. JCI Insight 2: e93411. [DOI] [PMC free article] [PubMed] [Google Scholar]
- 13.Roe CE, Hayes MJ, Barone SM, and Irish JM. 2020. Training novices in generation and analysis of high-dimensional human cell phospho-flow cytometry data. Curr. Protoc. Cytom. 93: e71. [DOI] [PMC free article] [PubMed] [Google Scholar]
- 14.Leelatian N, Doxie DB, Greenplate AR, Sinnaeve J, Ihrie RA, and Irish JM. 2017. Preparing viable single cells from human tissue and tumors for cytomic analysis. Curr. Protoc. Mol. Biol. 118: 25C.1.1–25C.1.23. [DOI] [PMC free article] [PubMed] [Google Scholar]
- 15.Leelatian N, Diggins KE, and Irish JM. 2015. Characterizing phenotypes and signaling networks of single human cells by mass cytometry. Methods Mol. Biol. 1346: 99–113. [DOI] [PMC free article] [PubMed] [Google Scholar]
- 16.Earl DC, Ferrell PB Jr., Leelatian N, Froese JT, Reisman BJ, Irish JM, and Bachmann BO. 2018. Discovery of human cell selective effector molecules using single cell multiplexed activity metabolomics. Nat. Commun. 9: 39. [DOI] [PMC free article] [PubMed] [Google Scholar]
- 17.Finck R, Simonds EF, Jager A, Krishnaswamy S, Sachs K, Fantl W, Pe’er D, Nolan GP, and Bendall SC. 2013. Normalization of mass cytometry data with bead standards. Cytometry A 83: 483–494. [DOI] [PMC free article] [PubMed] [Google Scholar]
- 18.Reisman BJ, Barone SM, Bachmann BO, and Irish JM. 2021. DebarcodeR increases fluorescent cell barcoding capacity and accuracy. Cytometry A 99: 946–953. [DOI] [PMC free article] [PubMed] [Google Scholar]
- 19.van de Veerdonk FL, Plantinga TS, Hoischen A, Smeekens SP, Joosten LA, Gilissen C, Arts P, Rosentul DC, Carmichael AJ, Smits-van der Graaf CA, et al. 2011. STAT1 mutations in autosomal dominant chronic mucocutaneous candidiasis. N. Engl. J. Med. 365: 54–61. [DOI] [PubMed] [Google Scholar]
- 20.Soltész B, Tóth B, Shabashova N, Bondarenko A, Okada S, Cypowyj S, Abhyankar A, Csorba G, Taskó S, Sarkadi AK, et al. 2013. New and recurrent gain-of-function STAT1 mutations in patients with chronic mucocutaneous candidiasis from Eastern and Central Europe. J. Med. Genet. 50: 567–578. [DOI] [PMC free article] [PubMed] [Google Scholar]
- 21.Mizoguchi Y, Tsumura M, Okada S, Hirata O, Minegishi S, Imai K, Hyakuna N, Muramatsu H, Kojima S, Ozaki Y, et al. 2014. Simple diagnosis of STAT1 gain-of-function alleles in patients with chronic mucocutaneous candidiasis. J. Leukoc. Biol. 95: 667–676. [DOI] [PMC free article] [PubMed] [Google Scholar]
- 22.Nielsen J, Kofod-Olsen E, Spaun E, Larsen CS, Christiansen M, and Mogensen TH. 2015. A STAT1-gain-of-function mutation causing Th17 deficiency with chronic mucocutaneous candidiasis, psoriasiform hyperkeratosis and dermatophytosis. [Published erratum appears in 2015 BMJ Case Rep. 2015: bcr2015211372corr1.] BMJ Case Rep. 2015: bcr2015211372. [DOI] [PMC free article] [PubMed] [Google Scholar]
- 23.Depner M, Fuchs S, Raabe J, Frede N, Glocker C, Doffinger R, Gkrania-Klotsas E, Kumararatne D, Atkinson TP, Schroeder HW Jr., et al. 2016. The extended clinical phenotype of 26 patients with chronic mucocutaneous candidiasis due to gain-of-function mutations in STAT1. J. Clin. Immunol. 36: 73–84. [DOI] [PMC free article] [PubMed] [Google Scholar]
- 24.Sampaio EP, Hsu AP, Pechacek J, Bax HI, Dias DL, Paulson ML, Chandrasekaran P, Rosen LB, Carvalho DS, Ding L, et al. 2013. Signal transducer and activator of transcription 1 (STAT1) gain-of-function mutations and disseminated coccidioidomycosis and histoplasmosis. J. Allergy Clin. Immunol. 131: 1624–1634. [DOI] [PMC free article] [PubMed] [Google Scholar]
- 25.Zheng J, van de Veerdonk FL, Crossland KL, Smeekens SP, Chan CM, Al Shehri T, Abinun M, Gennery AR, Mann J, Lendrem DW, et al. 2015. Gain-of-function STAT1 mutations impair STAT3 activity in patients with chronic mucocutaneous candidiasis (CMC). Eur. J. Immunol. 45: 2834–2846. [DOI] [PubMed] [Google Scholar]
- 26.Ma CS, Wong N, Rao G, Avery DT, Torpy J, Hambridge T, Bustamante J, Okada S, Stoddard JL, Deenick EK, et al. 2015. Monogenic mutations differentially affect the quantity and quality of T follicular helper cells in patients with human primary immunodeficiencies. J. Allergy Clin. Immunol. 136: 993–1006.e1. [DOI] [PMC free article] [PubMed] [Google Scholar]
- 27.Gerriets VA, and Rathmell JC. 2012. Metabolic pathways in T cell fate and function. Trends Immunol. 33: 168–173. [DOI] [PMC free article] [PubMed] [Google Scholar]
- 28.Huffaker TB, Ekiz HA, Barba C, Lee SH, Runtsch MC, Nelson MC, Bauer KM, Tang WW, Mosbruger TL, Cox JE, et al. 2021. A Stat1 bound enhancer promotes Nampt expression and function within tumor associated macrophages. Nat. Commun. 12: 2620. [DOI] [PMC free article] [PubMed] [Google Scholar]
- 29.ENCODE Project Consortium. 2011. A user’s guide to the encyclopedia of DNA elements (ENCODE). PLoS Biol. 9: e1001046. [DOI] [PMC free article] [PubMed] [Google Scholar]
- 30.ENCODE Project Consortium. 2012. An integrated encyclopedia of DNA elements in the human genome. Nature 489: 57–74. [DOI] [PMC free article] [PubMed] [Google Scholar]
- 31.Polak KL, Chernosky NM, Smigiel JM, Tamagno I, and Jackson MW. 2019. Balancing STAT activity as a therapeutic strategy. Cancers (Basel) 11: 1716. [DOI] [PMC free article] [PubMed] [Google Scholar]
- 32.Macintyre AN, Gerriets VA, Nichols AG, Michalek RD, Rudolph MC, Deoliveira D, Anderson SM, Abel ED, Chen BJ, Hale LP, and Rathmell JC. 2014. The glucose transporter Glut1 is selectively essential for CD4 T cell activation and effector function. Cell Metab. 20: 61–72. [DOI] [PMC free article] [PubMed] [Google Scholar]
- 33.O’Shea JJ, Schwartz DM, Villarino AV, Gadina M, McInnes IB, and Laurence A. 2015. The JAK-STAT pathway: impact on human disease and therapeutic intervention. Annu. Rev. Med. 66: 311–328. [DOI] [PMC free article] [PubMed] [Google Scholar]
- 34.Twohig JP, Cardus Figueras A, Andrews R, Wiede F, Cossins BC, Derrac Soria A, Lewis MJ, Townsend MJ, Millrine D, Li J, et al. 2019. Activation of naïve CD4+ T cells re-tunes STAT1 signaling to deliver unique cytokine responses in memory CD4+ T cells. Nat. Immunol. 20: 458–470. [DOI] [PMC free article] [PubMed] [Google Scholar]
- 35.Hunter CA, and Jones SA. 2015. IL-6 as a keystone cytokine in health and disease. [Published erratum appears in 2017 Nat. Immunol. 18: 1271.] Nat. Immunol. 16: 448–457. [DOI] [PubMed] [Google Scholar]
- 36.Teague TK, Schaefer BC, Hildeman D, Bender J, Mitchell T, Kappler JW, and Marrack P. 2000. Activation-induced inhibition of interleukin 6-mediated T cell survival and signal transducer and activator of transcription 1 signaling. J. Exp. Med. 191: 915–926. [DOI] [PMC free article] [PubMed] [Google Scholar]
- 37.Atreya R, Mudter J, Finotto S, Müllberg J, Jostock T, Wirtz S, Schütz M, Bartsch B, Holtmann M, Becker C, et al. 2000. Blockade of interleukin 6 trans signaling suppresses T-cell resistance against apoptosis in chronic intestinal inflammation: evidence in Crohn disease and experimental colitis in vivo. [Published erratum appears in 2010 Nat. Med. 16: 1341.] Nat. Med. 6: 583–588. [DOI] [PubMed] [Google Scholar]
- 38.Curnow SJ, Scheel-Toellner D, Jenkinson W, Raza K, Durrani OM, Faint JM, Rauz S, Wloka K, Pilling D, Rose-John S, et al. 2004. Inhibition of T cell apoptosis in the aqueous humor of patients with uveitis by IL-6/soluble IL-6 receptor trans-signaling. J. Immunol. 173: 5290–5297. [DOI] [PubMed] [Google Scholar]
- 39.Villarino AV, Kanno Y, and O’Shea JJ. 2017. Mechanisms and consequences of Jak-STAT signaling in the immune system. Nat. Immunol. 18: 374–384. [DOI] [PMC free article] [PubMed] [Google Scholar]
- 40.Costa-Pereira AP, Tininini S, Strobl B, Alonzi T, Schlaak JF, Is’harc H, Gesualdo I, Newman SJ, Kerr IM, and Poli V. 2002. Mutational switch of an IL-6 response to an interferon-γ-like response. Proc. Natl. Acad. Sci. USA 99: 8043–8047. [DOI] [PMC free article] [PubMed] [Google Scholar]
- 41.Hirahara K, Onodera A, Villarino AV, Bonelli M, Sciumé G, Laurence A, Sun HW, Brooks SR, Vahedi G, Shih HY, et al. 2015. Asymmetric action of STAT transcription factors drives transcriptional outputs and cytokine specificity. Immunity 42: 877–889. [DOI] [PMC free article] [PubMed] [Google Scholar]
- 42.Peters A, Fowler KD, Chalmin F, Merkler D, Kuchroo VK, and Pot C. 2015. IL-27 induces Th17 differentiation in the absence of STAT1 signaling. J. Immunol. 195: 4144–4153. [DOI] [PMC free article] [PubMed] [Google Scholar]
- 43.Nish SA, Schenten D, Wunderlich FT, Pope SD, Gao Y, Hoshi N, Yu S, Yan X, Lee HK, Pasman L, et al. 2014. T cell-intrinsic role of IL-6 signaling in primary and memory responses. eLife 3: e01949. [DOI] [PMC free article] [PubMed] [Google Scholar]
- 44.Longhi MP, Wright K, Lauder SN, Nowell MA, Jones GW, Godkin AJ, Jones SA, and Gallimore AM. 2008. Interleukin-6 is crucial for recall of influenza-specific memory CD4 T cells. PLoS Pathog. 4: e1000006. [DOI] [PMC free article] [PubMed] [Google Scholar]
- 45.Kasahara Y, Miyawaki T, Kato K, Kanegane H, Yachie A, Yokoi T, and Taniguchi N. 1990. Role of interleukin 6 for differential responsiveness of naive and memory CD4+ T cells in CD2-mediated activation. J. Exp. Med. 172: 1419–1424. [DOI] [PMC free article] [PubMed] [Google Scholar]
- 46.Beagley KW, Eldridge JH, Aicher WK, Mestecky J, Di Fabio S, Kiyono H, and McGhee JR. 1991. Peyer’s patch B cells with memory cell characteristics undergo terminal differentiation within 24 hours in response to interleukin-6. Cytokine 3: 107–116. [DOI] [PubMed] [Google Scholar]
- 47.Strutt TM, McKinstry KK, Kuang Y, Finn CM, Hwang JH, Dhume K, Sell S, and Swain SL. 2016. Direct IL-6 signals maximize protective secondary CD4 T cell responses against influenza. J. Immunol. 197: 3260–3270. [DOI] [PMC free article] [PubMed] [Google Scholar]
- 48.Scott O, Lindsay K, Erwood S, Mollica A, Roifman CM, Cohn RD, and Ivakine EA. 2021. STAT1 gain-of-function heterozygous cell models reveal diverse interferon-signature gene transcriptional responses. NPJ Genom. Med. 6: 34. [DOI] [PMC free article] [PubMed] [Google Scholar]
- 49.Giovannozzi S, Lemmens V, Hendrix J, Gijsbers R, and Schrijvers R. 2020. Live cell imaging demonstrates multiple routes to-ward a STAT1 gain-of-function phenotype. Front. Immunol. 11: 1114. [DOI] [PMC free article] [PubMed] [Google Scholar]
- 50.Leiding JW, Okada S, Hagin D, Abinun M, Shcherbina A, Balashov DN, Kim VHD, Ovadia A, Guthery SL, Pulsipher M, et al. ; Inborn Errors Working Party of the European Society for Blood and Marrow Transplantation and the Primary Immune Deficiency Treatment Consortium. 2018. Hematopoietic stem cell transplantation in patients with gain-of-function signal transducer and activator of transcription 1 mutations. J. Allergy Clin. Immunol. 141: 704–717.e5. [DOI] [PMC free article] [PubMed] [Google Scholar]
- 51.Tabellini G, Vairo D, Scomodon O, Tamassia N, Ferraro RM, Patrizi O, Gasperini S, Soresina A, Giardino G, Pignata C, et al. 2017. Impaired natural killer cell functions in patients with signal transducer and activator of transcription 1 (STAT1) gain-of-function mutations. J. Allergy Clin. Immunol. 140: 553–564.e4. [DOI] [PubMed] [Google Scholar]
- 52.Ovadia A, Sharfe N, Hawkins C, Laughlin S, and Roifman CM. 2018. Two different STAT1 gain-of-function mutations lead to diverse IFN-γ-mediated gene expression. NPJ Genom. Med. 3: 23. [DOI] [PMC free article] [PubMed] [Google Scholar]
- 53.Chen X, Xu Q, Li X, Wang L, Yang L, Chen Z, Zeng T, Xue X, Xu T, Wang Y, et al. 2020. Molecular and phenotypic characterization of nine patients with STAT1 GOF mutations in China. J. Clin. Immunol. 40: 82–95. [DOI] [PubMed] [Google Scholar]
Associated Data
This section collects any data citations, data availability statements, or supplementary materials included in this article.