

Abstract
As a complement to virtual screening, de novo design of small molecules is an alternative approach for identifying potential drug candidates. Here, we present a new 3D genetic algorithm to evolve molecules through breeding, mutation, fitness pressure, and selection. The method, termed DOCK_GA, builds upon and leverages powerful sampling, scoring, and searching routines previously implemented into DOCK6. Three primary experiments were used during development: Single‐molecule evolution evaluated three selection methods (elitism, tournament, and roulette), in four clinically relevant systems, in terms of mutation type and crossover success, chemical properties, ensemble diversity, and fitness convergence, among others. Large scale benchmarking assessed performance across 651 different protein‐ligand systems. Ensemble‐based evolution demonstrated using multiple inhibitors simultaneously to seed growth in a SARS‐CoV‐2 target. Key takeaways include: (1) The algorithm is robust as demonstrated by the successful evolution of molecules across a large diverse dataset. (2) Users have flexibility with regards to parent input, selection method, fitness function, and molecular descriptors. (3) The program is straightforward to run and only requires a single executable and input file at run‐time. (4) The elitism selection method yields more tightly clustered molecules in terms of 2D/3D similarity, with more favorable fitness, followed by tournament and roulette.
Keywords: chemical space, de novo design, DOCK, DOCK6, drug discovery, ensemble‐based evolution, fragment libraries, genetic algorithm, ligand similarity, molecular evolution, scoring functions, selection methods, structure‐based design
Computational design is a powerful approach for creating and optimizing potential drug candidates for clinically relevant targets. In this study, a new molecular evolution algorithm termed DOCK_GA was developed and implemented into the program DOCK6. The program performs 3D crossover (breeding) between two parents to create new offspring and uses functional group fragments to perform mutations in the context of a protein binding site. Molecular evolution is biased through fitness pruning and selection.
1. INTRODUCTION
Atomic‐level docking and virtual screening are powerful and well‐documented structure‐based computational approaches that have led to the identification of active compounds in early stages of drug discovery and development. 1 , 2 , 3 Since the early 1980s, the field has seen rapid growth due to a combination of ever increasing numbers of publicly available protein and nucleic acid drug‐target structures, 4 , 5 catalogs containing commercially available ligands, 6 , 7 and ever‐faster computers. 8 In our own work, we have employed virtual screening, in collaboration with experimental groups, to identify inhibitors targeting a variety of clinically relevant targets. 9 , 10 , 11 , 12 , 13 , 14 , 15 , 16 , 17 , 18 , 19 However, despite its proven utility, some caveats associated with virtual screening include: (1) publicly available catalogs cover only a fraction of chemical space and therefore may not contain compounds optimal for the specific site being targeted, (2) it is computationally prohibitive for most users to exhaustively screen massive libraries such as ZINC 20 containing billions of compounds, (3) catalog compounds may be subject to intellectual property protection.
As an alternative approach, de novo design methods (hereafter referred to simply as de novo) can be employed to generate, from‐scratch, new molecules directly in the context of the binding site environment. In principle, from‐scratch assembly of compounds from drug‐like fragments, synthetic building blocks, or in some cases individual atoms, will enable a highly directed and therefore more fruitful search through chemical space. 21 , 22 , 23 , 24 , 25 , 26 As we have shown previously with a version of DOCK6 27 with extensive de novo functionality developed and implemented by our group (termed DOCK_DN), 21 outcomes from de novo molecular construction can also be used to create compounds that can be found in existing vendor catalogs. Our research and those of many other de novo methods, including the programs AutoGrow, 24 , 25 BOMB, 28 BREED, 29 CONCERTS, 30 DOCK_DN, 21 FLUX, 31 , 32 GANDI, 33 GenStar, 34 GroupBuild, 35 LEGEND, 36 , 37 LUDI, 38 , 39 Molecule Evoluator, 40 OpenGrowth, 23 PRO_LIGAND, 41 SKELGEN, 42 SMoG, 43 and SPROUT, 44 , 45 validate that computer‐based methods can be used effectively to create reasonable, chemically sound molecules. More recently there have been a number of de novo programs that have been reported that rely on Artificial Intelligence to overcome the abovementioned hurdles involved in virtual screening. 46 , 47
Under the umbrella of de novo are a class of methods based on evolutionary principles (termed genetic algorithms). Examples of previously reported methods that specifically employ a genetic algorithm include the programs ADAPT, 48 Autogrow4, 49 Chemical Genesis, 50 CoG, 51 , 52 Globus, 53 LEA, 54 LEA3D, 55 , 56 LigBuilder, 57 , 58 Nachbar, 59 SYNOPSIS, 60 TOPAS, 61 and an algorithm published by Kawai et al. 62 , 63 Some therapeutic application examples using de novo include the identification of inhibitors targeting HIV‐1 RT (SYNOPSIS), 60 HIV‐1 protease (BREED), 29 and Thrombin (LUDI, TOPAS). 38 , 39 , 61 , 64 In the present work, we present the development, validation and optimization of a powerful new genetic algorithm framework for DOCK6 (termed DOCK_GA) built around molecular evolution as outlined by Holland 65 which employs basic evolutionary principles such as breeding, mutation, and natural selection. Early inspiration for the present work was the 2001 paper by Pegg, Haresco, and Kuntz that introduced the program ADAPT. 48 The ADAPT approach employs a 2‐D graph representation of molecules comprised of nodes representing fragments and edges representing bonds connecting the fragments. Specifically, the authors utilized an earlier version of DOCK to generate molecules in 2D space, a process referred to as breeding, energy‐minimized in 3D space, and subsequently docked and scored in the binding site. In addition, the scoring fitness function was also augmented to include chemical descriptors such as molecular weight, #ligand rotatable bonds, #hydrogen bond donors/acceptors, and ClogP. However, breeding in ADAPT occurred outside of the protein thus evolution was not tightly coupled to the biologically significant binding site as might be desired. Additionally, ADAPT is no longer under active development. We hypothesized that an actively developed genetic algorithm devised around the latest version of DOCK would not only lead to improvements over the original ADAPT algorithm but be a desirably alternative to other reported approaches. More specifically, our goal is to leverage DOCK6's well‐validated conformational sampling routine (anchor and grow), 27 , 66 fragment‐based chemical searching algorithm, 21 and powerful similarity‐based scoring functions 67 , 68 , 69 to drive molecular growth and evolution.
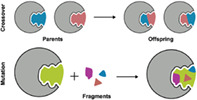
As illustrated in Figure 1, DOCK_GA evolves molecules according to two main criteria: (i) crossover (i.e., breeding) combines two “parents” together across geometrically compatible rotatable bonds and (ii) mutation utilizes a fragment library of building blocks to explore chemical space. The program leverages the DOCK_DN 21 infrastructure including fragment libraries, local bond environment checks to maintain chemical feasibility, and chemical descriptor filters to prevent construction of non‐drug‐like molecules. Key features of the code include: (1) molecular construction in 3D space in the context of the targeted binding site, (2) customizable fitness functions that can include a variety of scoring functions and descriptors, (3) multiple mutation types including internal fragment replacement (scaffold hopping), 70 (4) different selection methods to drive evolution, and (5) modularity of functions and routines. Importantly, the majority of DOCK_GA is housed directly within the central DOCK6 infrastructure, which facilitates simplified execution of the software for users via straightforward and standardized protocols and input files. The algorithms presented in this work, along with example input files and test cases, and source code, have been implemented into the latest DOCK6 release and will be made available for download for free to registered academic users at http://dock.compbio.ucsf.edu/.
FIGURE 1.
Schematic showing the two main DOCK6 search routines for the genetic algorithm. Crossover (above) exchanges segments of molecules between a pair of parents where bonds geometrically overlap to create two offspring with a blended molecular composition. Mutations (below) delete, add, substitute, or replace functionality on parents and/or offspring based on a library consisting of drug‐like fragments
2. ALGORITHM THEORY AND IMPLEMENTATION
2.1. Terminology and basic input parameters
Evolution in DOCK_GA can be initiated or seeded, using a single molecule (single‐molecule evolution) as input, or an ensemble of molecules (ensemble‐based evolution). A partial (incomplete) molecule can also be used. As in DOCK6, ligands are stored in mol2 format and employ Sybyl atom types. 71 The input molecule(s) specified at the very first generation are referred to as the “initial parent(s)” while those that survive to seed successive generations are referred to simply as “parent(s).” Products of successful crossover and/or mutation are considered “offspring.” The molecules that are retained through the selection method, referred to as “survivors,” are used to seed growth for the next generation, and subsequently become “parents” of the next iteration of molecules created from the algorithm.
These calculations require the same protein docking grid(s) as used in DOCK6, which are prepared prior to running any calculations using a standardized protocol. 27 DOCK_GA is fragment‐based, and molecules are defined as collections of segments connected by rotatable bonds (fragments) as specified in the DOCK6 flex definition file (flex.defn). Throughout this document, key input filenames and parameter names are highlighted in italics. A representative input file, specifying key parameter values employed in this work, is provided as Supporting Information (Table S1). The program requires a properly prepared fragment library, which is typically generated using the same DOCK_DN infrastructure as previously described. 21 Briefly, library fragments are arranged into three classes: (a) sidechains with one attachment point (ga_fraglib_sidechain_file), (b) linkers with two attachment points (ga_fraglib_linker_file), and (c) scaffolds with three or more attachment points (ga_fraglib_scaffold_file). 21
2.2. Initial generation
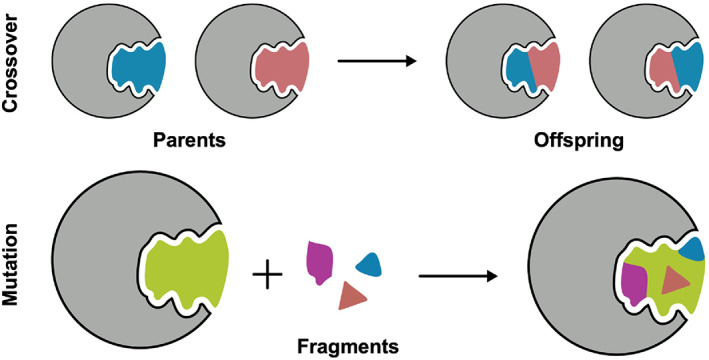
Figure 2 schematically outlines the overall flow of the DOCK_GA program. The initial parent(s) should have reasonable 3D input geometries and already be bound (and thus compatible) to the target of interest. Input geometries of parents can be generated from x‐ray structures or computationally docked poses. The initial generation is assigned partial atomic charges using the Gasteiger 72 function, which is also used to assign atomic charges for molecules created as a result of crossover or mutations, as needed. The initial generation then undergoes a brief energy minimization to check for compatibility with the binding site and similarity‐based pruning (Hungarian algorithm) 67 is employed to ensure evolution initiates from chemically distinct molecules. The algorithm proceeds until a user‐defined number of generations have been reached (ga_max_generations).
FIGURE 2.
Flowchart outlining key aspects of DOCK_GA. See text for a description of each stage
2.3. Crossover
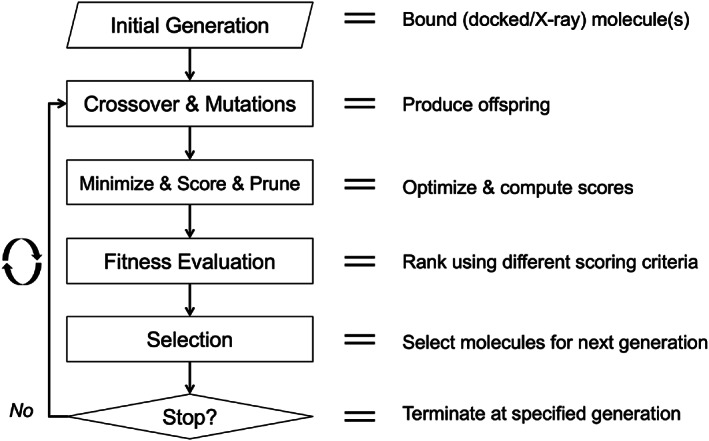
Parental crossover (ga_xover_on) occurs between two molecules with geometrically overlapping same‐order DOCK rotatable bonds in the context of the protein (Figure 3A). This is important to emphasize because many de novo design and genetic algorithms do not construct molecules in 3D directly in the binding site environment. Distance tolerance (ga_bond_tolerance) and angle tolerance (ga_angle_cutoff) parameters control if bond‐pair overlap between two molecules under consideration is tight enough for a potential new bond to even be considered. As highlighted in Figure 3A, each successful single‐point crossover event produces two offspring where the substructures on each side of the overlapping bond are swapped. 29 Parent pair combinations for potential crossover can be selected randomly (ga_xover_sampling_method_rand = yes) or exhaustively. In the present work, the random method was employed with crossovers being attempted until a user defined number of offspring were generated (ga_xover_max = 150). For exhaustive crossover, because all possible parent pairs are examined, the procedure is very memory intensive and should therefore be used with only a few initial parents. Prior to crossover, each parent pair is subjected to a 3D similarity‐based filter, which again leverages the Hungarian algorithm, 67 to avoid redundant offspring. Each offspring undergoes a torsion environment check, as described in DOCK_DN, 21 to determine if the newly formed bond is in an allowable torsion environment table (ga_torenv_table). Once crossover event(s) are successful for a pair of parents, those parents cannot crossover with any other parents in the ensemble for that specific generation. It should be emphasized that crossover requires at least two compatible (non‐identical) molecules. Thus, when only a single molecule is used as input for the initial generation the algorithm proceeds directly to mutation (ga_mutate_parents) until suitable offspring can be created. Single‐molecule evolution also requires specification of the number of generations allowed without crossover (ga_max_num_gen_with_no_crossover).
FIGURE 3.
An example of (A) crossover, where two parents (left) crossover at a geometrically and chemically compatible rotatable bond denoted by the dashed line to produce two offspring (right). Examples of the four mutation methods: (B) deletion, (C) addition, (D) substitution, and (E) replacement. The blue outlined pentagons represent the portion of the molecules to be augmented and the purple outlined circles represent the portion of the molecules manipulated and added by the mutation routines
2.4. Mutations
Following crossover, parents and offspring can undergo fragment‐based mutations to generate new molecules (Figure 3B–E) which, if successful, will diversify the molecular make‐up of the population over successive generations. Mutations also increase the chances for successful crossover, especially if the parents at the start of each generation do not have a significant number of overlapping bonds. As highlighted in Figure 3B–E, DOCK_GA has four possible mutation types: (1) deletion, (2) addition, (3) substitution, and (4) replacements, which are described below. The user can specify which mutation(s) types should be attempted. For a given attempt, the specific molecule for mutation, the specific segment for mutation, and the specific mutation type are all randomly selected from the existing population. However, depending on the number of attachment points in a segment, and its location in the molecule (terminal vs. non‐terminal), only certain mutation types may be permitted. For example, for completely rigid molecules, only additions can be performed.
Deletion (ga_mutate_deletion) (Figure 3B) can involve removal of a single terminal segment or in some cases multiple segments, provided the deletion itself does not result in disconnected segments. The modified molecule is subsequently capped with a hydrogen atom at the point of segment removal and examined to ensure that the deletion event did not result in unphysical torsions (ga_torenv_table). No more than 50% of the molecule by molecular weight may be deleted in any one move. Addition (ga_mutate_addition) (Figure 3C) is performed by randomly replacing a hydrogen atom with a sidechain from the fragment library regardless of the segment type (terminal vs. non‐terminal). Currently, additions only involve single layer growth per addition attempt. Over multiple generations however, successive additions can lead to growth that encompass multiple layers. Substitution (ga_mutate_substitution) (Figure 3D) occurs by combining deletion and addition events in succession. Both single and multisegmented substitutions are possible. For a single segment, only a sidechain would be deleted and then replaced. For multiple segments (for which one must be terminal), the number of deleted segments must equal the number of added segments. Replacement (ga_mutate_replacement) (Figure 3E) involves taking a nonterminal segment and replacing it with a library fragment of similar shape and number of connection points. 70 This mutation type is facilitated by using heavy atoms of the segment for replacement as “spheres” to orient fragments for subsequent consideration. Analogous to crossover, docked fragments for replacement are only considered if the new connection points are well aligned with the bonds of the molecule prior to mutation.
Similar to crossover, for a mutation to be considered successful, all torsions in a newly constructed molecule must be allowable (ga_torenv_table). Molecules undergo fragment‐based mutations until the number of successful mutations for parents and offspring reach a user‐defined target (ga_pmut_rate and ga_omut_rate, respectively) or the maximum number of mutations is reached (ga_max_mut_cycles). The user also has control over the number of fragments that are randomly selected for addition, substitution, or replacement (ga_num_random_picks). The number of individual mutations that can be attempted on any given molecule can also be specified (ga_max_root_size) with only the single best scoring molecule being retained.
2.5. Minimize & score & prune
As viable offspring are produced from crossover and mutations their partial atomic charges are updated (Gasteiger method), 72 poses are energy minimized and scored, molecular descriptors are computed, and additional pruning routines are applied to promote drug‐likeness in the growing ensemble. Energy minimizations incorporated a harmonic restraint (simplex_coefficient_restraint), which helps keep offspring tethered close to their initial parent poses, and included the ligand translational, rotational, and torsional degrees of freedom. As in standard docking, a repulsive‐only ligand internal energy term was added to the scoring function to avoid intramolecular clashes. In terms of scoring, DOCK_GA employs a customizable master scoring function based on a user‐definable combination of DOCK6 functions (termed Descriptor Score). 27 Available functions include single‐grid energy (SGE), multi‐grid energy (MGE), footprint similarity (FPS), 68 pharmacophore matching similarity (FMS), 69 Hungarian matching similarity (HMS), 67 volume overlap similarity (VOS), 17 and Tanimoto similarity (TAN), and combinations thereof. 27
After minimization and scoring, ligands with unfavorable repulsive internal energy (internal_energy_cutoff) or total energy (ga_energy_cutoff) are pruned. The HMS scoring function is also employed at this stage to compute the 3D similarity between all parents and offspring, and within groups of offspring, in order to prune (remove) redundant molecules within each generation. Briefly, the Hungarian method in DOCK6 67 can be used to determine the optimal one‐to‐one correspondence between sets of atoms of the same atom type. As one example of its utility, the algorithm can be used to compute a symmetry corrected root mean square deviation (RMSD). As shown in Equation (1), and outlined in greater detail in Allen and Rizzo 67 symmetry corrected RMSD for subsets of matched atoms (RMSD matched) can be used to compute a 3D similarity score (HMS score) between two different molecules when used in conjunction with the total number of unmatched atoms (#unmatched), and the number of heavy atoms of the molecule being considered as a reference (#ref atoms). User‐defined criteria in terms of an RMSD cutoff for matched atoms (ga_heur_matched_rmsd) and number of unmatched atoms (ga_heur_unmatched_num) help control the aggressiveness of the pruning. The values for the constants in Equation (1) (C1 = −5, C2 = 1) were originally chosen 67 so that the two HMS score terms would be approximately equal in weight and higher similarity would result in a more negative score (−5 equals perfect overlap).
| (1) |
Finally, a hard filter is used to remove molecules with properties outside of user‐defined limits for molecular weight (ga_constraint_mol_wt), number of DOCK rotatable bonds (ga_constraint_rot_bon), number of H‐bond donors (ga_constraint_H_don), number of H‐bond acceptors (ga_constraint_H_accept), and formal charge (ga_constraint_formal_charge). If any input parents have properties that fall outside of the hard filter ranges, a warning is printed but the molecules are allowed to pass which provide an opportunity for mutations to generate compliant offspring.
Table 1 shows values for some of the key DOCK_GA parameters used in the five major algorithm stages outlined in Figure 2 (Initial Generation, Crossover & Mutation, Minimize & Score & Prune, Fitness Evaluation, Selection). For completeness, an input file listing all of the parameters used in a representative elitism experiment is provided as Supporting Information (Table S1).
TABLE 1.
Key DOCK_GA parameter values used in this work
| Parameter | Description | Value |
|---|---|---|
| ga_max_generations | Max number of generations per run | 500, 25 |
| ga_xover_max | Max number of offspring allowed via crossover | 150 |
| ga_bond_tolerance | User‐specified cutoff for allowable bond distance (squared) | 0.5 Å2 |
| ga_angle_cutoff | User‐specified cutoff for allowable bond vector angles | 0.14 radians |
| ga_pmut_rate | Parent mutation rate | 0.4 |
| ga_omut_rate | Offspring mutation rate | 0.7 |
| ga_max_mut_cycles | Max mutation attempts | 10 |
| internal_energy_cutoff | Max repulsive internal energy of ligand | 100 kcal/mol |
| simplex_coefficient_restraint | Harmonic restraint for RMSD tether | 10 kcal/mol Å2 |
| ga_num_random_picks | N fragments randomly selected for add, sub, or rep | 10 |
| ga_max_root_size | Max root size | 5 |
| ga_energy_cutoff | Upper bound for energy pruning | 100 kcal/mol |
| ga_heur_unmatched_num | N unmatched atoms for HMS pruning | 1, 5 |
| ga_heur_matched_rmsd | RMSD of matched atoms for HMS pruning | 0.5, 2.0 Å |
| ga_constraint_mol_wt | The upper bound for MW | 550 |
| ga_constraint_rot_bon | The upper bound for # rot bonds | 20 |
| ga_constraint_H_accept | The upper bound for # of hydrogen acceptors | 10 |
| ga_constraint_H_don | The upper bound for # of hydrogen donors | 5 |
| ga_constraint_formal_charge | The upper and lower bound for formal charge | ±4 |
| ga_ensemble_size | The number of survivors to carry to next generation | 100 |
| ga_max_num_gen_with_no_crossover | Max generations without crossover | 500 |
2.6. Fitness evaluation
In preparation for selection (see next section) parents and offspring are rank‐ordered using a fitness function. At this time, the function used for fitness is the same as that used for energy minimization minus the ligand internal energy. If desired, fitness can include any of the similarity scores discussed above. In the present work, a simple two‐term fitness function was employed as shown in Equation (2) with C1 = 1 and C2 = −15.
| (2) |
Here, single‐grid energy (SGE) 73 represents protein‐ligand intermolecular interactions which are computed using a docking grid comprised of van der Waals (6–9 potential) and Coulombic (distant dependent dielectric = 4r) energy terms. Volume overlap score (VOS) 14 , 17 , 74 represents the 3D spatial overlap between newly constructed molecules and a user‐defined reference in terms of their hydrophobic and hydrophilic atoms, and positively and negatively charged atoms. In the present work, VOS references were based on the crystallographic ligand pose in each system tested (each pdb code). VOS scores are between 0 (no overlap) and 1 (complete overlap). Thus, with the present C2 coefficient, up to −15 kcal/mol will be added to the score for molecules with perfect reference overlap. This combination allows for energetically favorable growth to occur while biasing evolution to remain near the targeted binding site.
2.7. Selection
Genetic algorithms that construct new molecules suffer from exponential growth, which will quickly lead to an intractable number of compounds. To avoid computational bottleneck, only a small subset of molecules is “selected” to become survivors (i.e., parents) for the next generation. In order to provide the user with greater control over diversity and fitness, DOCK_GA currently has three major selection methods: (1) elitism, (2) tournament, and (3) roulette, as shown in Figure 4, with the number of molecules to be passed to the next generation defined by the user (ga_ensemble_size), which is set to 100 molecules per generation for all experiments presented. Elitism (Figure 4A) retains only those molecules with the best fitness scores, based on rank‐order. 40 , 59 The method employs three sub‐selection types: max (the maximum number of parents are retained), number (x number of parents are retained, ga_elitism_number), or percent (% of parents are retained, ga_elitism_percent). In terms of ranking, parents and offspring may be combined, or treated separately, which is true of all DOCK_GA selection methods. The flexibility to sample two different subsets of the same selection method permits distinct molecule propagation and therefore unique molecule evolution even if the same initial parents are utilized. Elitism was employed, in the present work, using sub‐selection type max (ga_elitism_option) max and combined ensembles only. In tournament (Figure 4B), the fitness scores for two randomly selected molecules are compared and the more fit molecule is retained. 63 , 75 Tournament experiments discussed here employed combined ensembles. Finally, in roulette (Figure 4C), a stochastic probability fitness proportionate selection method is utilized. 54 , 76 Briefly, a random number (R 1 in Figure 4C) is used to select a molecule based on its rank‐ordered position on a roulette wheel. A second random number (R 2) is then used to accept or reject the molecule based on its position relative to other molecules on a number line. For simplicity, Figure 4C only illustrates the combined method. All roulette results present here employed combined ensembles.
FIGURE 4.
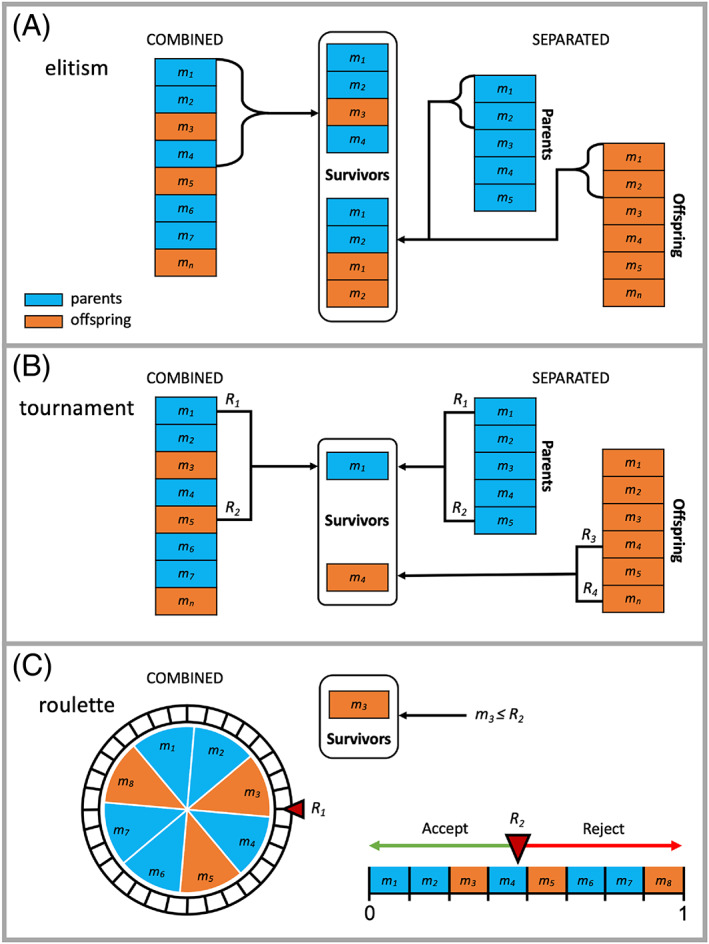
Graphical representations of each selection method in which blue denotes a parent molecule, orange denotes an offspring molecule sorted by fitness score (m 1 best to m n worst), and R denotes a random number. (A) Elitism selects the best‐ranked molecules based on their location in a combined population comprised of parents and offspring (left) or from individually ranked populations (right) until a specified size criteria are met. (B) Tournament employs random numbers to select two molecules to compete to remain in the population based on their scores from combined (left) or separated (right) populations. (C) Roulette randomly selects a molecule (R 1) and uses a second random number (R 2) to accept or reject the selection based on the location of the molecule on a normalized number line. Both combined and separated populations may be used (only the combined method is illustrated here)
3. COMPUTATIONAL DETAILS
3.1. Fragment library generation
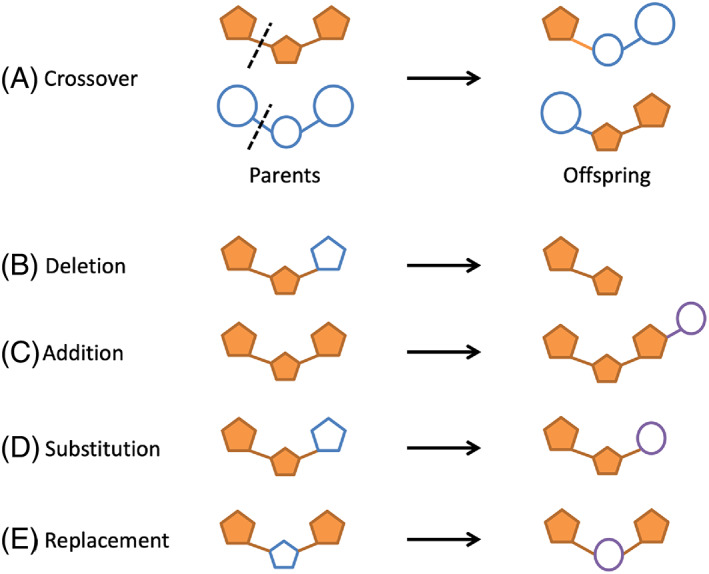
Fragment libraries employed in this work were generated by segmenting approximately ~13.1 M drug‐like molecules from the ZINC database, 20 as described previously in Allen et al. 21 Figure 5 graphically illustrates the procedure using the small molecule epinephrine as an example. The procedure is entirely automated and entails segmentation along rotatable bonds as defined by DOCK6, fingerprinting of each fragment, removal of duplicate fragments, and organization into groups comprised of sidechains (1 connection point), linkers (2 connection points), and scaffolds (3+ connection points). Frequency cutoffs of >13,000 (sidechains and linkers) and >1300 (scaffolds) were used to retain only the most common fragments seen in the original library of 13.1M molecules. These cutoffs resulted in 167 sidechains, 147 linkers, and 122 scaffolds. A companion “allowable torsion environment” table (ga_torenv_table) is generated concurrently which helps to ensure that newly formed bonds due to crossover and/or mutations are chemically reasonable. In addition, the ga_torenv_table was augmented to include torsion types for the initial parents if they are not already present in the standard library, preventing them from being immediately pruned. Library generation in the present work utilized an updated DOCK6 rotatable bond flex definition file (flex.defn) parameter file for segmentation, and a smaller cutoff frequency criteria for scaffolds (to promote replacements), which resulted in a larger number of allowable torsions (11,208 vs. 10,838) and additional scaffolds (122 vs. 18) than employed in previous work. 21
FIGURE 5.
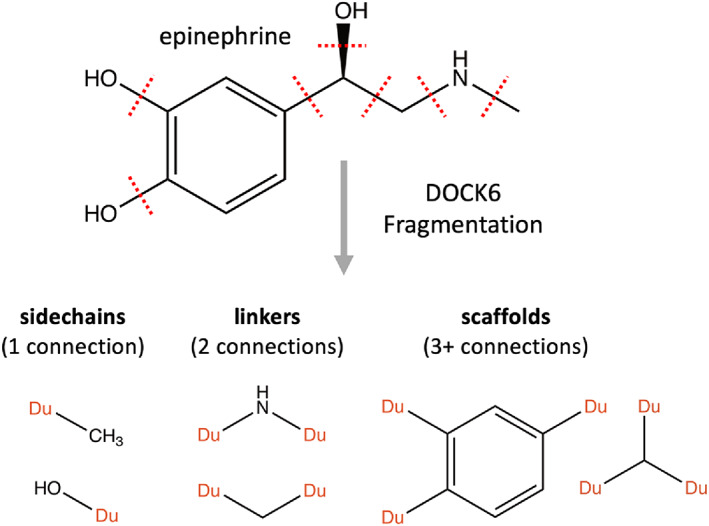
Fragment library generation example illustrating how epinephrine can be segmented based on DOCK6 rotatable bonds definitions into sidechains (1 connection point), linkers (2 connection points), and scaffolds (3+ connection points)
3.2. Test set systems and preparation
Development and testing of DOCK_GA involved hundreds of experiments run under different conditions. The majority of our analysis was based on single‐molecule evolution simulations initiated from four clinically relevant protein‐ligand crystal complexes selected from our previously described SB2012 test set: 27 , 77 neuraminidase (NA) complexed with zanamivir (pdb 1A4G), 78 epidermal growth factor receptor (EGFR) complexed with erlotinib (pdb 1M17), 79 factor XA (FXA) complexed with apixaban (pdb 2P16), 80 and cyclooxygenase‐2 (COX2) complexed with indomethacin (pdb 4COX). 81 Molecular properties for the cognate ligands in these four systems are listed in Table 2. All test set complexes were prepared as previously described 27 , 77 and each DOCK_GA run for the in‐depth experiments involved 500 generations where the initial parent (cognate ligand) was used as the reference.
TABLE 2.
Molecular properties for cognate ligands from four protein systems
| Ligand (pdb code) | MW a | RB b | HA c | HD d |
|---|---|---|---|---|
| Zanamivir (1A4G) | 332.3 | 11 | 11 | 9 |
| Erlotinib (1M17) | 393.4 | 12 | 7 | 1 |
| Apixaban (2P16) | 459.5 | 7 | 9 | 2 |
| Indomethacin (4COX) | 356.8 | 6 | 6 | 0 |
MW = molecular weight (g/mol).
RB = number rotatable bonds as defined by DOCK6 flex.defn file.
HA = number H‐bond acceptors (N plus O).
HD = number H‐bond donors (H bonded to N or O).
As a means to assess the program's ability to successfully evolve a large and diverse group of ligands in a wide variety of binding site environments, single‐molecule evolution was also initiated starting from 651 systems (651 individual pdb codes), also taken from the SB2012 test set. 27 , 77 The 651 x‐ray complexes contained ligands of varying flexibility (5–20 rotatable bonds), formal charge (−2 to +2e), and MW (125–600 Da). For these large‐scale experiments, DOCK_GA simulations were run for a total of 2637.9 CPU h (~4 h per system) on 12 node 40 core Intel Xeon Gold 6148 on the SeaWulf cluster housed and managed at the Stony Brook University High Performance Computing Center. DOCK_GA runs for these large‐scale‐based experiments were 25 generations.
To demonstrate DOCK_GA can also be used for ensemble‐based evolution, starting from a collection of known binders, we downloaded 23 structures from the Diamond Light Source/COVID Moonshot effort, 82 , 83 of the SARS‐CoV‐2 main protease (Mpro) complexed with a variety of non‐covalent ligands that target the A‐active site (pdb codes 5R7Y, 5R7Z, 5RE4, 5R80, 5R81, 5R82, 5RE9, 5REB, 5RGH, 5RGI, 5RGK, 5R83, 5REH, 5R84, 5REZ, 5RF1, 5RG1, 5RF2, 5RF3, 5RF6, 5RF7, 5RFE, and 5RHD). Fortunately, the 23 complexes were already aligned to a common reference frame (protein backbones were already well‐overlaid). To prepare the system for evolution, all 23 non‐covalent ligands were energy minimized in a single protein (entry 5R7Y) and the ligand from this entry was also used as the reference for the fitness function shown in Equation (2). 84 DOCK_GA runs for the ensemble‐based experiments were 15 generations.
3.3. GA utilities
To assist with analysis, a function called “GA utilities” was implemented into DOCK_GA, which computes the chemical/structural similarity between molecules in an ensemble (or between ensembles). At this time, GA utilities can be used to compute pairwise Tanimoto coefficients to assess topological similarity, compute pairwise Hungarian matching similarity (HMS) scores to assess structural similarity, and assign Gasteiger charges for any input molecule. The functions have been incorporated under the umbrella of DOCK_GA but currently should only be used to process one generation at a time, as a post‐process analysis.
4. RESULTS AND DISCUSSION
4.1. Single‐molecule evolution
To interrogate the behavior of DOCK_GA under different conditions, we employed the four test systems described above (Test Set Systems and Preparation) to seed molecular evolution for 500 generations using three distinct selection protocols (elitism/max‐combined, tournament/combined, and roulette/combined). Further, due to the stochastic nature of the algorithms, evolution can also be varied by the use of a different pseudo‐random number to perform functions such as crossover, mutations, as well as selection. To explore how the results might be affected, three distinct random seeds (0, 2, and 3) were employed for a subset of experiments.
4.2. Mutation success and crossover
Table 3 shows average success rates for the four different mutation types (accepted/attempted) along with the average number of survivors containing a crossover event (children with crossover / total population size) subdivided by the four protein‐ligand test systems and three selection method across 500 generations. Here, since evolution was initiated from only a single species, it should be emphasized that early generations necessarily involve only mutations since at least two chemically distinct molecules must be accessible before crossovers can be attempted.
TABLE 3.
Success rates for different mutation types and number of survivors containing a crossover
| Del % a | Add % | Sub % | Rep % | Crossover % b | ||
|---|---|---|---|---|---|---|
| 1A4G (NA) | Elitism | 64.1 | 4.0 | 80.4 | 5.8 | 8.65 |
| Tournament | 81.4 | 36.5 | 90.4 | 9.1 | 44.09 | |
| Roulette | 72.3 | 50.3 | 91.3 | 13.8 | 60.10 | |
| 1M17 (EGFR) | Elitism | 84.6 | 6.1 | 66.4 | 10.2 | 8.62 |
| Tournament | 71.4 | 35.7 | 76.2 | 4.5 | 42.93 | |
| Roulette | 84.3 | 41.9 | 87.0 | 8.7 | 56.88 | |
| 2P16 (FXA) | Elitism | 78.0 | 7.2 | 49.0 | 6.3 | 6.06 |
| Tournament | 92.1 | 34.9 | 83.9 | 7.0 | 44.28 | |
| Roulette | 78.0 | 42.3 | 76.4 | 9.1 | 56.58 | |
| 4COX (COX2) | Elitism | 67.7 | 5.1 | 60.8 | 7.8 | 9.43 |
| Tournament | 67.6 | 26.2 | 77.2 | 6.2 | 44.51 | |
| Roulette | 54.3 | 35.8 | 83.1 | 6.7 | 53.69 | |
| Average | 74.65 | 27.17 | 76.84 | 7.93 | 36.32 |
Average success rates for different mutation types (accepted/attempted) after final fitness pruning for structurally dissimilar molecules.
Average survivors with crossover (children with crossover/total population size). Molecules evolved in 1A4G (NA), 1M17 (EGFR), 2P16 (FXA), and 4COX (COX2) using elitism, tournament, and roulette selection methods. Data represents averages over 500 generations. Results from one seed are shown (seed 0).
On a global scale, across all systems and selection methods tested, the most successful mutations were substitutions (77%) > deletions (75%) > additions (27%) > replacements (8%). Compared to addition, substitution is a two‐step process (deletion followed by addition) thus the size of the parent before mutation (MW, rotatable bonds) would not be expected to be a major factor in terms of exceeding MW cutoffs after mutation. The significant difference between substitution (77%) and addition (27%) supports this hypothesis, however it is also true that successful substitutions in all cases are lower for elitism (64%) compared to the corresponding simulations with tournament (82%) or roulette (84%). Here, the overall larger size for molecules obtained via elitism (shown below) is expected to negatively impact the “addition” part of substitution. In contrast, deletions varied only marginally across the different selection methods (72%–78%). Deletions are only expected to be rejected if too much of a molecule was removed which would lead to a degraded score as a result of decreased favorable protein‐ligand contacts. For pure addition, the success rates varied significantly depending on which selection method was used (6%–42%). For elitism (6%), the low number obtained is again likely a function of the larger‐sized parents for which adding additional fragments would more likely exceed MW cutoffs. In contrast, the generally smaller molecules from tournament and roulette lead to more successful (33%–42%) additions. Replacement was the least successful mutation event observed with only 2 of the 12 simulations in Table 3 averaging above 10%. We hypothesize that the low acceptance rates primarily reflect the requirement for a relatively tight geometric match between the bonds on the fragment being replaced with those on candidate fragment. Strategies for increasing replacement success rates could include evaluation of less stringent bond tolerances, although our initial tests showed tight overlaps were necessary to retain geometric integrity of children prior to minimization. A more promising strategy would likely involve increasing the size and diversity of the fragment libraries. Replacements involving more than one rigid fragment at a time would also be desirable and are currently under investigation.
The last column in Table 3 shows the average number of survivors containing a crossover event relative to the total population. The magnitude for crossover (36%) is most similar to addition (27%), and similar to the trends seen with addition the percentages are lowest for elitism (8%) followed by tournament (44%) and roulette (56%). As before, we hypothesize that the larger‐sized molecules from elitism undergoing crossover would be less likely to pass the MW cutoff relative to smaller molecules from tournament or roulette. It should be emphasized that the statistics shown in Table 3 represent only a lower bound for crossover success since they are based solely on the number of retained survivors. Molecules created via crossover are also subject to similarity‐based pruning and score‐based pruning.
4.3. Offspring survival
One of the primary objectives of DOCK_GA is to create and retain energetically and geometrically fit, chemically distinct offspring at each generation as successful offspring production drives molecular evolution. Offspring are products of both breeding and mutation events. However, as shown in Figure 6, the number of unique offspring produced at each generation varies greatly depending on which selection method is employed. Overall, the behavior within each selection method was relatively uniform across the four test systems. In contrast, the behavior between the three selection methods was markedly different. A number of routines in DOCK6 rely on a random seed (e.g., simplex minimizer, fragment selection), thus, for completeness, we performed additional simulations for each test case using two different random seeds (seed 2, seed 3). For each selection method, in all cases, the number of unique offspring per generation were remarkably similar (seed 0 vs. 2 vs. 3). It is also important to emphasize that the specified selection method is only employed when the combined ensemble exceeds a user‐defined maximum size (ga_ensemble_size), which in this case was 100 molecules. In addition, these graphs plot only the number of unique offspring within that specific generation and do not include parents from previous generations.
FIGURE 6.
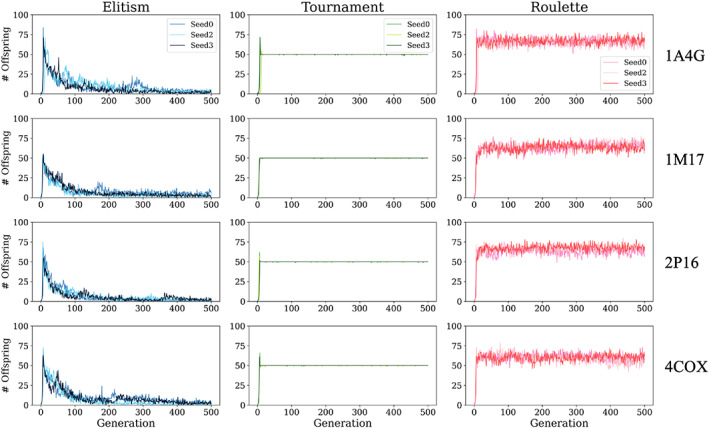
Number of “unique offspring” per generation after selection (100 molecules max per generation) for molecules evolved in 1A4G (NA), 1M17 (EGFR), 2P16 (FXA), and 4COX (COX2) using elitism (blue), tournament (green), and roulette (pink) selection methods. Results from three seeds are shown (seed 0, 2, and 3)
For elitism (Figure 6, left), as systems evolve, the large number of unique offspring retained (~50–75 molecules) in earlier generations quickly decrease and begin to converge by around generation 100 (10–15 new molecules). Elitism retains only the most energetically favorable offspring thus the outcome is rapid convergence to a local optimum. 85 As discussed below, from a structural standpoint, single‐molecule evolution with elitism tends to yield tightly coupled congeneric series most influenced by offspring in the early generations although not necessarily the initial parent (Gen 0). If desired, greater diversity from elitism can be obtained by utilizing multiple random seeds or including a diverse ensemble of initial parents. For elitism (seed 0), the total number of unique molecules generated under these conditions was 4500 (1A4G), 4499 (1M17), 3192 (2P16), and 4954 (4COX).
In sharp contrast, single‐molecule evolution employing tournament selection (Figure 6, middle) maintains 50 unique offspring per generation which is 50% of the generation max (100). As expected, even with different random seeds, tournament maintains a strict 50% offspring retention. The only exception is for very early generations in which slightly more offspring may be retained to account for the initially small ensemble sizes (<100). Overall, tournament allows more opportunities for less energetically fit offspring to compete for survival which maintains greater chemical and structural diversity than for elitism (discussed below). As before, if greater diversity is desired, multiple random seeds and/or initial parents can be employed. For tournament (seed 0), the total number of unique molecules generated was 24,769 (1A4G), 24,832 (1M17), 24,786 (2P16), and 24,799 (4COX).
For roulette (Figure 6, right), a consistent offspring retention rate was also obtained which averaged 60–65 molecules. Since molecules are not passed to successive generations based solely on fitness, the majority of survivors in each roulette ensemble (100 max) are expected to be offspring. This is due to the overwhelming offspring to parent ratio prior to selection and the random nature of the algorithm (Figure 4C). Thus, it is reasonable that roulette selection would lead to distributions >50%. We hypothesize that the plateau behavior is attributable to the fitness proportionate selection method being bounded by a maximum number of allowable crossover events (ga_xover_max = 150) and a maximum number of mutation attempts (ga_max_mut_cycles = 5) per generation. As discussed further below, roulette ensembles tend to have the greatest overall variability in terms of molecular properties, chemical diversity, docking poses, and fitness scores. For roulette (seed 0), the total number of unique molecules generated was 32,891 (1A4G), 31,574 (1M17), 31,338 (2P16), and 31,143 (4COX).
4.4. Chemical properties and similarity of survivors
To assess the drug‐like characteristics for the survivors generated using different selection methods, we computed several chemical properties including molecular weight, number of rotatable bonds, number of hydrogen bond acceptors, and number of hydrogen bond donors as shown in Figure 7. It is important to note that in addition to scoring, clustering, and pruning criteria, molecules constructed at each generation are only retained if they also conform to a set of user‐defined upper boundary conditions (Table 1) for each property which in this case were: MW (550 Da), #Rotatable Bonds (20), #H‐bond Acceptors (10), and #H‐bond Donors (5). Thus, no molecules in Figure 7 will exceed these upper bounds. For simplicity, results from only one random seed are shown (seed 0).
FIGURE 7.
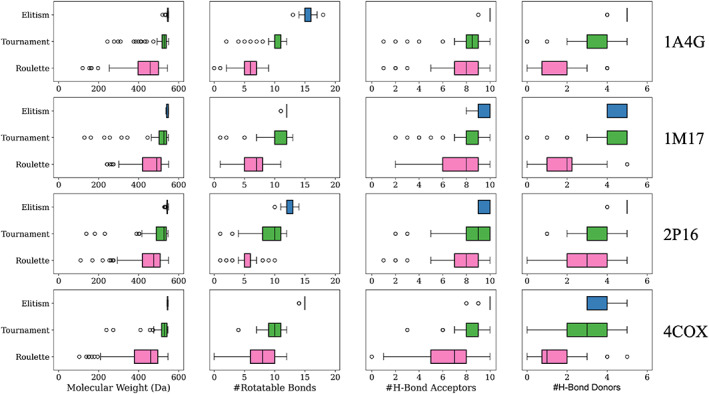
Chemical property distributions at generation 500 (N = 100) for molecules evolved in 1A4G (NA), 1M17 (EGFR), 2P16 (FXA), and 4COX (COX2) using elitism (blue), tournament (green), and roulette (pink) selection methods. The user‐defined parameters utilized are as follows: molecular weight ≤550 Da, rotatable bonds ≤20, hydrogen bond acceptors ≤10, and hydrogen bond donors ≤5. The box represents the interquartile range and the line within represents the median of the data. The whiskers represent the full range of the data excluding outliers. The outliers of each set are represented as white dots. Results from one seed are shown (seed 0)
As a general rule, the genetic algorithm has a propensity to maximize interactions between offspring and protein by constructing and preserving larger molecules that extend towards the user‐defined upper bound cutoffs for each chemical descriptor. The DOCK6 scoring function is known to favor larger molecules (MW bias) because the van der Waals component of the fitness function rewards more contacts. At the extreme, all molecules constructed using elitism (Figure 7, blue) have MW near 550 Da. Interestingly, the maximum number of rotatable bonds (20) was not attained under the present conditions, most likely because of the interplay between weight and flexibility. For example, the addition of a benzene fragment will increase the MW far more than a hydroxyl group but contribute the same number of rotatable bonds. In terms of the distributions, descriptor ranges from elitism (Figure 7, blue) were generally narrow which we hypothesize is indicative of greater chemical similarity. In addition, in all but one case (#H‐bond donors, 1M17), properties for molecules constructed using elitism were much closer to their maximum allowable value compared to the other two selection methods. In contrast, tournament (Figure 7, green) yielded broader descriptor ranges with lower mean values. Properties for molecules obtained via the roulette method (Figure 7, pink) had the widest distributions and the lowest mean values.
Because molecules may have comparable chemical properties, but be chemically similar or chemically distinct, we also examined 2D similarity between survivors (Figure 8) using the DOCK6 Tanimoto function, 21 which scales from 0 (no similarity) to 1 (chemically identical). 86 , 87 The goal was to test the hypothesis that elitism would yield more similar molecules, followed by tournament and roulette. Chemical similarity was evaluated for one early generation (Gen050, 100 × 100) for comparison with the last generation (Gen500, 100 × 100) using a probability density function in which the area under the curve is normalized to 1, which highlights chemical variance. Generation 50 was chosen for the early ensemble because, although the number of survivors had reached the max ensemble size (100), the chemical properties themselves had not yet converged.
FIGURE 8.
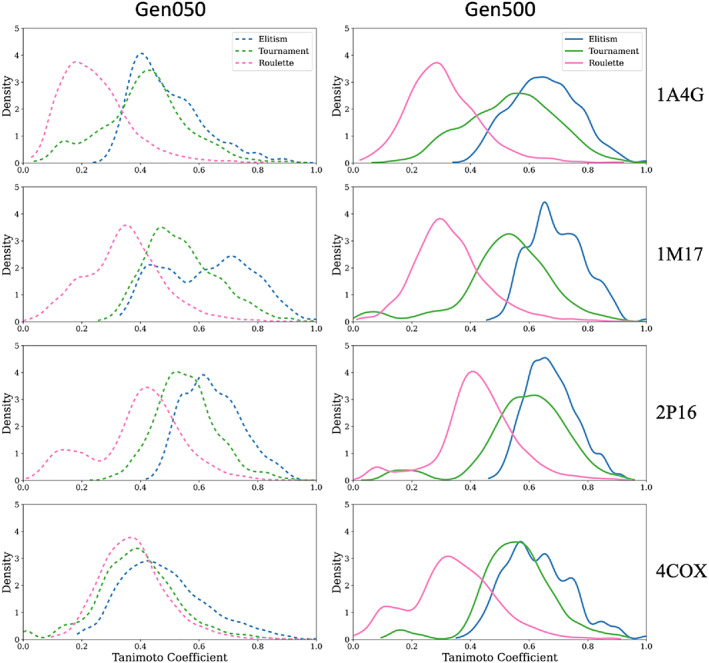
Tanimoto similarity plotted as probability density functions (GA utilities) to assess topological (2D) convergence. Data represents all pairwise scores (100 × 100 = 10,000 pairs) based on molecules in the ensemble at generation 50 (dashed) relative to those at generation 500 (solid) from 1A4G (NA), 1M17 (EGFR), 2P16 (FXA), and 4COX (COX2) simulations using elitism (blue), tournament (green), and roulette (pink) selection methods. Results from one seed are shown (seed 0)
As hypothesized, elitism (Figure 8, solid blue) showed the highest level of chemical similarity (higher Tanimoto) at the last generation (Gen500), followed by tournament (Figure 8, solid green) and roulette (Figure 8, solid pink). In all cases, there was striking separation between the three different selection methods. In particular, distributions for elitism were much more focused (less varied density). The similar trends obtained across all four test systems (elitism > tournament > roulette) strongly suggests chemical diversity will be influenced by which selection method is employed, regardless of the binding site environment. Somewhat surprisingly, results from the early generation (Gen050) show a similar but less pronounced trend, with the elitism distributions being right‐shifted (Figure 8, dashed blue) and the roulette distributions being left‐shifted (Figure 8, dashed pink). In addition, a comparison between the Gen050 (dashed) and Gen500 (solid) distributions illustrate that, in some cases, there is a dramatic shift from low to high Tanimoto, particularly in 1A4G and 4COX. The roulette algorithm (Figure 8, dashed pink), stands out as showing the least deviation between Gen050 and Gen500. Taken together, the unique offspring (Figure 6), chemical properties (Figure 7), and pairwise similarity (Figure 8) analysis highlight how the different selection methods provide orthogonal means to generate drug‐like ensembles starting from only a single input molecule.
4.5. Fitness convergence
A strategic use of genetic algorithms is their ability to optimize properties, subject to a fitness function, until some desired level of convergence (or threshold) is achieved. Given the varied outcomes discussed above with regards to number of unique offspring per generation (Figure 6), chemical properties (Figure 7), and similarity of survivors (Figure 8), we expected that “convergence” behavior, in terms of energy (Equation 2), would also be affected by which selection method was employed. In particular, we expected that use of elitism would show the fastest energetic convergence and yield, on average, more favorably‐scored ligands, use of roulette would require the most generations to reach energetic convergence and yield ligands with worse fitness scores, and tournament would likely be in‐between.
Figure 9 plots mean ensemble fitness for the top 25 scored compounds, with their standard deviations, for the three selection methods and four test systems examined. The standard deviations for the entire ensemble at each generation (N = 100 molecules) are also plotted for comparison (light colors). As hypothesized, elitism (Figure 9 left, dark blue) shows rapid convergence for the top 25 molecules, with minimal variation in fitness score (Figure 9 left, cyan), and yields lower (more favorable) energies across all test systems. As previously noted, the fitness function (Equation 2) combines protein‐ligand interactions (van der Waals plus Coulombic) with a volume overlap term to the cognate (x‐ray) ligand. Thus, more favorably fitness reflects enhanced interactions with the binding site. Tournament (Figure 9 middle, dark green) yielded a similar trend in terms of the shape of convergence, and for 1M17 and 4COX, the mean values at generation 500 were similar to elitism. The dramatically larger standard deviations for tournament (Figure 9 middle, light green), however, highlight the much wider range of fitness scores within each individual ensemble. In general, roulette (Figure 9 right) showed the largest variability in terms of standard deviation across all 100 molecules in each generation (pink) or only the top 25 (red). In all cases, average fitness scores obtained with roulette were less favorable than elitism or tournament. Regardless of selection method, across all systems, reasonably plateaued fitness was seen by about 250 generations. In some cases, plateaued fitness was reached in as early as 100 generations.
FIGURE 9.
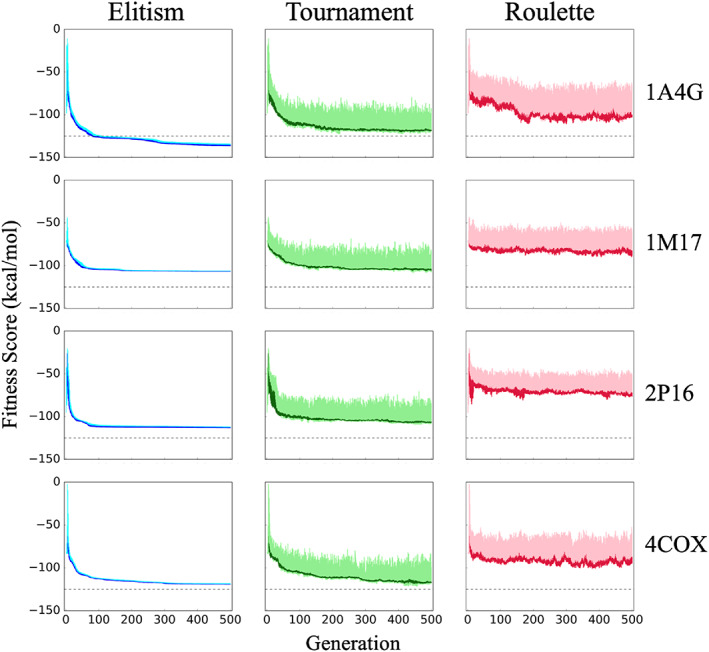
Mean fitness scores with standard deviation, for the top 25 molecules evolved in 1A4G (NA), 1M17 (EGFR), 2P16 (FXA), and 4COX (COX2) using elitism (blue), tournament (green), and roulette (red) selection methods over 500 generations. Light colors represent the standard deviation for the entire ensemble (100 molecules). The dashed line at −125 kcal/mol is provided as a point of reference to help visualize convergence. Results from one seed are shown (seed 0)
We also examined convergence behavior using multiple random seeds (see Supporting Information, Figure S1). On one hand, use of different seeds leads to similar convergence trends for a given selection method. For example, in all cases, multiple roulette runs yielded the least favorable fitness (Figure S1). In addition, in most cases, multiple elitism runs yielded fitness scores that were more favorable than tournament (Figure S1). Further, the mean values at which the fitness plateau is reached, in general, are more consistent for elitism followed by tournament and roulette (Figure S1). On the other hand, the large variation in mean fitness observed using roulette for evolution in 1A4G and 2P16 (Figure S1, magenta vs. black lines) suggests that multiple random seeds can, in some cases, lead to ensembles with very different fitness properties. Therefore, multiple runs would be useful to help gauge whether or not more favorable fitness minima can be sampled in a given system.
4.6. 3D structural convergence
The trends observed with regards to fitness convergence (Figure 9), topological similarity (Figure 8), chemical properties (Figure 7), and offspring survival (Figure 6) suggest that the ligand structures themselves, including their 3D spatial relationship to each binding site, will likely be more similar when using elitism versus the other two selection methods. To help quantify structural convergence, we employed the DOCK6 Hungarian matching similarity (HMS) scoring function for which a value of −5 indicates perfect overlap between any two molecules. 67 HMS scores can be through of as an RMSD‐like geometric measure of similarity between molecules with differing topology and numbers of atoms. Based on our experience, HMS scores of −2 and below are indicative of reasonable‐to‐high “geometric” similarity. Figure 10 plots HMS distributions derived from all pairwise combinations (100 × 100 molecules = 10,000 scores) in generation 50 (Gen050, dashed) and generation 500 (Gen500, solid) for each system and selection method. To the right of each plot are the accompanying ensemble of 3D structures (N = 100 ligands each, protein residues hidden for clarity). The initial parent at Gen 0 (crystallographic seed ligand) is shown for comparison.
FIGURE 10.
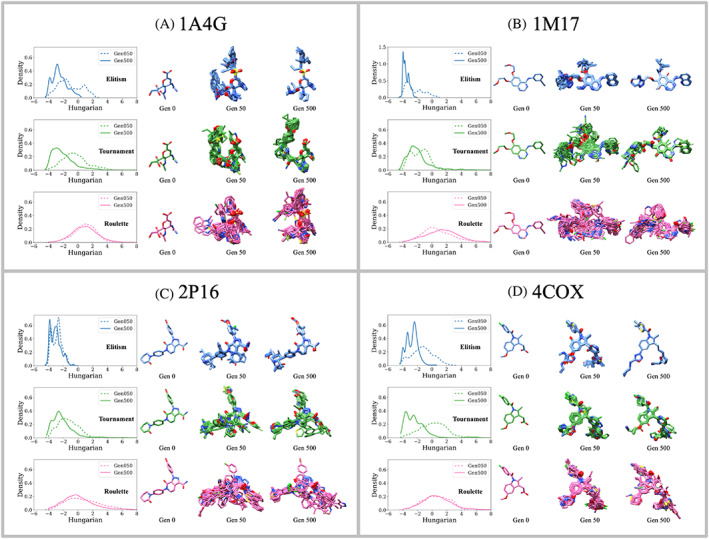
Hungarian Matching Similarity (HMS) distributions for two ensembles (Generation 50 and 500) plotted as probability density functions (GA utilities), along with their associated molecules, to assess structural (3D) convergence. Data represents all pairwise scores (100 × 100 = 10,000 pairs) based on molecules in the ensemble at generation 50 (dashed) relative to those at generation 500 (solid) from (A) 1A4G (NA), (B) 1M17 (EGFR), (C) 2P16 (FXA), and (D) 4COX (COX2) simulations using elitism (blue), tournament (green), and roulette (pink) selection methods. Generation 0 shows the initial crystallographic ligand (starting molecule pose). Generation 50 and 500 each show 100 overlaid poses. Protein residues hidden for clarity. Results from one seed are shown (seed 0)
As shown in Figure 10, the ensembles generated using elitism and tournament yield left‐shifted (more negative) HMS distributions at generation 500 (solid), compared to generation 50 (dashed), which corresponds to higher 3D structural convergence. This behavior mirrors what we observed with regards to 2D topological convergence assessed via Tanimoto scores (Figure 8, dashed vs. solid lines). In contrast, the HMS scores in Figure 10 for using roulette showed little difference between generations 50 and 500. At generation 500 (Figure 10 solid), use of elitism led to overall more negative HMS scores in the range from −4 to −2, indicating higher 3D similarity, especially for systems 1M17 and 2P16 which show larger more well‐defined HMS peaks at −4. In contrast the HMS distributions for roulette at generation 500 (Figure 10, pink lines) peak roughly around 0 or higher suggesting much lower 3D similarity.
Examination of the ligand structures themselves are in agreement with the HMS results. For example, at generation 500 the relative “tightness” with regards to spatial overlap across the different selection methods follow: elitism (most tight) > tournament (medium tight) > roulette (least tight). In addition, for elitism in all four cases, and for tournament in 2 out of 4 cases, the ensembles at generation 500 appear to be more tightly overlaid than generation 50. Elitism in particular at generation 500 yielded such striking structural overlap (Figure 10, blue ligands) that it appears that only a handful of molecules are overlaid when in fact the plots show 100 unique ligands (see discussion below). As expected, ligands generated using roulette showed the least structural convergence. Under the current conditions, depending on the desired outcome, a protocol that employed roulette to generate diverse ensembles near the beginning of a genetic algorithm run would be useful to help kick‐start molecular evolution down different paths. We are currently exploring protocols that allow users to choose combinations of selection methods that can be turned on and off at will or based on current ensemble properties.
4.7. Chemical diversity of top scoring molecules within a congeneric series
Although DOCK_GA was originally intended to be used for de novo design, the results in Figure 10 also suggest that the genetic algorithm can be a useful tool for ligand refinement. As an example, Figure 11 shows a subset of results obtained for system 1M17 (EGFR) starting from the complex with erlotinib. The positions labeled R1–R4 and X indicate primary positions on the erlotinib scaffold modified by the algorithm, and the shaded functional groups across each row (each selection method) highlight differences between the top‐scoring compound (leftmost compound, DOCK scores in kcal/mol) and the four next best‐scored candidates. The accompanying Tanimoto coefficients quantify 2D similarity between each candidate with the top‐scoring compound from each method.
FIGURE 11.
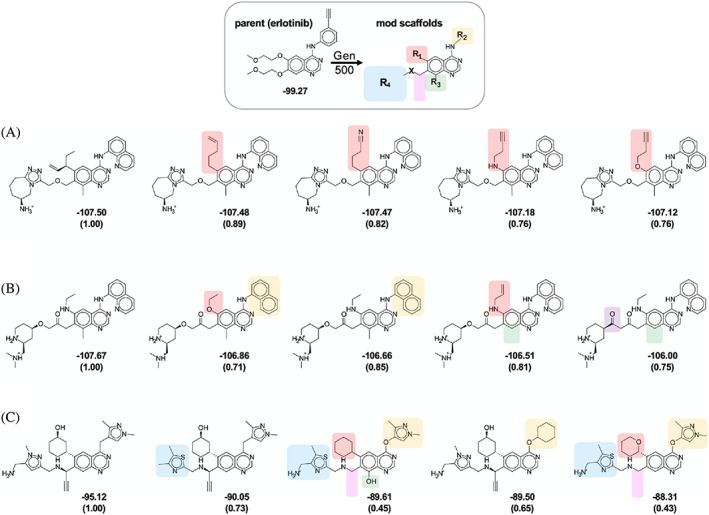
The 5 top scoring molecules at generation 500 (Gen500) from simulations in 1M17 (EGFR) starting from erlotinib (top) using (A) elitism, (B) tournament, and (C) roulette selection methods. Values under each 2D picture represent fitness scores (kcal/mol) and Tanimoto coefficients, which are computed relative to the most favorable compound (left most compound) from each simulation. Shaded groups across a given row (selection method) highlight functional group differences at each position between each top‐scoring compound with the next best‐scored candidates. Results from one seed are shown (seed 0)
As shown in Figure 11, under the current conditions, the key quinazoline scaffold of erlotinib is retained in all top‐scoring molecules across all three selection methods. At the other positions, functional groups vary according to which method is employed. Following the trend in tight chemical (Figure 7), topological (Figure 8), and structural convergence (Figure 10) discussed earlier, the 5 top‐scoring molecules here from elitism (Figure 11A) differ only in their R1 position which results in relatively small variation in Tanimoto (Tc = 0.76–0.89). Compared to erlotinib, the groups initially at R2 and R4 were replaced by bulkier quinoline and positively charged triazole‐azepane rings, respectively. The original quinazoline was also methylated at position R3. Interestingly, the 5 top‐scoring molecules generated with tournament (Figure 11B) showed some similarities to elitism. For example, all of the top 5 had either a quinoline or naphthalene group at R2, and 3 of the top 5 were methylated at position R3. A charged group was also placed at position R4 (in this case an amine substituted piperidine). On the other hand, smaller functionality was placed at position R1. Overall, the results are consistent with tournament's tendency to yield structurally conserved molecules (Figure 10) while providing increased chemical diversity (Figures 7 and 8). Compared to elitism, the top 5 tournament‐generated compounds showed a somewhat wider range of Tanimoto scores relative to the top‐scoring compound (Tc = 0.71–0.85). As expected, use of roulette (Figure 11C) led to the greatest amount of chemical diversity (Tc = 0.43–0.73). In these examples, compared to elitism or tournament, roulette led to smaller functionality at positions R2 and R4. A bulkier 6‐membered saturated ring was also placed at position R1. However, despite the overall greater R‐group variability, the top‐5 compounds obtained using roulette visually appear very similar in these examples.
It is interesting to note that in 14 out of the 15 top‐scoring molecules in Figure 11, a positively charged amine group was added at the R4 position. To assess if these additions and other changes (e.g., diazoles placed at R2 using roulette) would lead to additional electrostatic interactions with the EGFR binding site, relative to the initial parent erlotinib, we visualized H‐bonding patterns between all molecules in each ensemble (N = 100 molecule each) with nearby residues as shown in Figure 12. As expected, all three molecules preserved the key quinazoline ring H‐bond with Met793 (Figure 12A) made by erlotinib while yielding additional H‐bonds with the target. For example, with elitism (Figure 12B), one additional H‐bond was observed at positions Cys773. Using tournament (Figure 12C), new H‐bonds were observed at Cys773, Glu804, Phe795, and Thr854. And for roulette (Figure 12D), new H‐bonds were observed at Asp105, Cys773, Leu745, Phe795, and Asp855. Overall, the results highlight how different selections methods can lead to different H‐bonding patterns, and underscores how visualization of DOCK_GA ensembles can be used to identify hotspots, which would be a useful tool to help guide synthetic chemistry.
FIGURE 12.
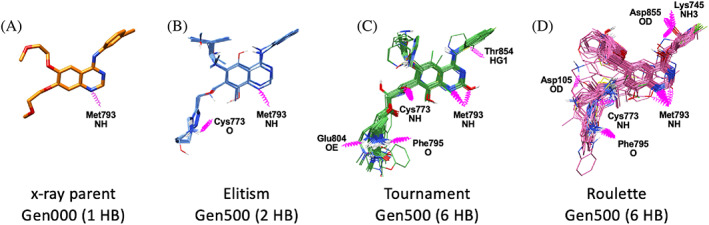
H‐bond patterns (magenta springs) in the 1M17 (EGFR) binding pocket for (A) erlotinib from generation 0 (x‐ray pose) versus ligand ensembles (100 overlaid compounds each) at generation 500 from simulations employing (B) elitism (C) tournament, and (D) roulette selection methods. Labels indicate which amino acids and atoms are involved. Protein residues hidden for clarity. Results from one seed are shown (seed 0)
4.8. Large‐scale benchmarking
To assess the robustness of DOCK_GA we performed evolution starting from a large group of 651 protein‐ligand systems taken from our published SB2012 testset (Figure 13). The primary goal was three‐fold: (1) evaluate if the default parameters would lead to single‐molecule evolution when initiated from a diverse group of ligands in a wide variety of binding site environments, (2) determine how long it would take for systems to reach the maximum specified ensemble size of 100 molecules, and (3) assess if a relatively short run of 25 generations was sufficient to evolve new molecules with equal or more favorable fitness scores when compared to the initial parent. It is important to note that the specified “selection” method is not initiated until the current ensemble size exceeds the defined maximum value. Thus, the number of molecules obtained at different generations for the 651 systems plotted in Figure 13A are independent of which selection method is employed. Further, it should be emphasized that the data plotted Figure 13A represents the number of “total” molecules retained at each generation, in contrast to Figure 6 which plots the number of “unique” molecules.
FIGURE 13.
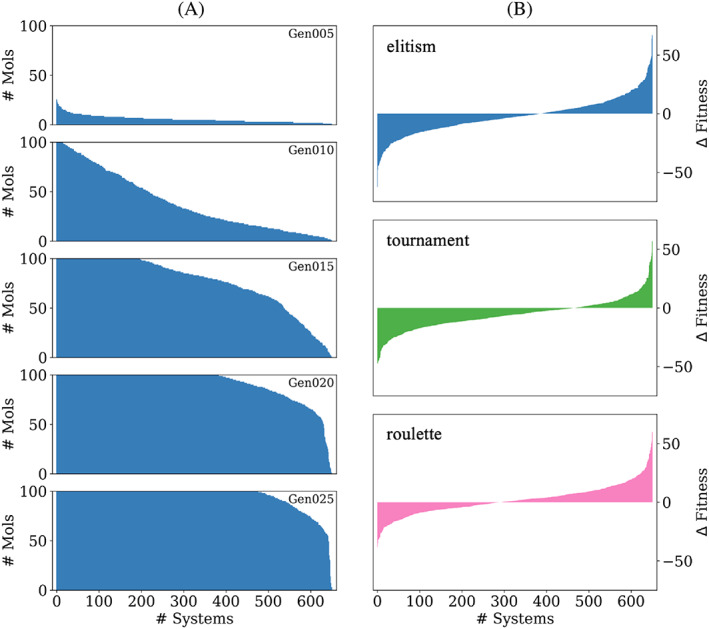
(A) Number of total molecules retained at generation 5, 10, 15, 20, and 25 across 651 different protein‐ligand systems. (B) Change in fitness between the average of the top 25 molecules at generation 25 minus the initial parent ranked from most to least favorable for elitism (top), tournament (middle), and roulette (bottom). Results from one seed are shown (seed 0)
As shown in Figure 13A, by generation 005, evolution occurred in all but a handful of systems although no systems had yet reached 100 molecules. By generation 015 however, about 200 systems had an ensemble of size 100. Importantly, by generation 025, 73.3% systems had reached an ensemble size of 100. Interestingly, only 1 system out of 651 failed to yield any offspring. Examination of the output revealed that the initial parent in system 1W9U had a relatively large MW (674.7) and number of H‐bond acceptors (N = 19) and donors (N = 9) compared to the input parameter cutoffs (Table 1). Thus, the only possible initial mutations that could have been accepted in this case would have been deletions or substitutions that would reduce these properties to below the specified cutoffs. In this one particular instance, 25 generations were not sufficient. Overall, the results in Figure 13A suggest that the tested DOCK_GA parameters (Table 1, Table S1) are sufficient to evolve and generate offspring relatively quickly.
Figure 13B plots the change in fitness (Δ fitness) for these 651 systems, defined here as the average fitness for the top 25 molecules at generation 25 minus the initial parent (offspring_average – initial parent). In a few cases, less than 25 molecules were generated and in these instances all molecules were used to compute the average. The Δ fitness in Figure 13B is rank ordered independently for each selection method, which emphasizes differences between the methods, with negative values indicating that top‐scored offspring have more favorable scores than the initial parent. Elitism might have been expected to yield the largest number of systems with more favorable Δ fitness given its tendency to yield more favorable scores as discussed earlier (Figure 9). Somewhat surprisingly however, at generation 25, tournament yielded the greatest number of systems with negative Δ fitness (465 systems, 71.4%) followed by elitism (386, 59.3%) and roulette (292, 44.9%). We hypothesize that elitism would eventually overtake tournament with longer runs and that running for additional generations would likely increase the number of systems with negative Δ fitness. In any event, Figure 13B show that all three selection methods are capable of producing more favorable offspring in only 25 generations. More importantly, the considerable number of systems successfully simulated here (N = 650 out of 651) validates that the DOCK_GA program can be used to perform molecular evolution in a wide variety of protein‐ligand systems.
Figure 14 highlights a particularly interesting example in which a more energetically favorable offspring was generated which makes a key interaction in the binding site not seen in the initial parent. Here, starting from the neutral N‐benzylamide parent ligand complexed with thrombin (pdb 1MUE), an offspring in generation 24 was identified which contains a piperidine moiety that mimics the guanidine seen in other reported inhibitors, including the FDA approved drug argatroban and compound CVS1578 (pdb 1BA8). Figure 14 top panels compare the molecular footprints (per‐residue interaction energies) for the parent (1MUE, magenta), the evolved ligand (Gen024, cyan), and CVS1578 (1BA8, orange) which highlights the resulting mimicry in terms of the electrostatic (ES) patterns at position Asp189.B (gray arrow). Figure 14 bottom panel compares the accompanying 3D poses for these three ligands, their H‐bonding patterns, and DOCK_GA scores which show a dramatic favorable increase in overall interaction energy (−59.1 to −66.2 kcal/mol), as well as the ES component (−1.9 to −10.4 kcal/mol), as this particular parent evolved.
FIGURE 14.
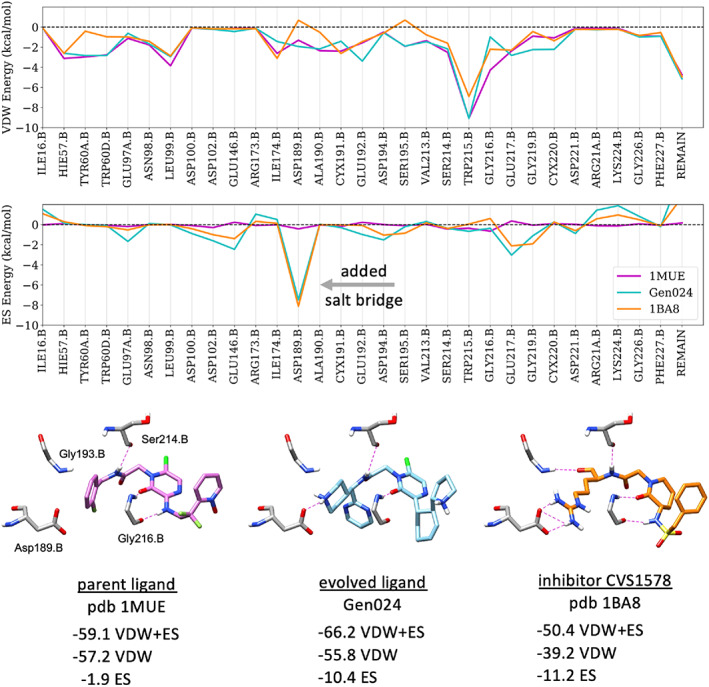
(Top) Footprint comparison plots in thrombin showing dominant van der Waals (VDW) and electrostatic (ES) per‐residue interactions (plus remainder, REMAIN) for the initial parent from pdb 1MUE (purple), an evolved ligand taken from generation 24 (cyan) in 1MUE, and inhibitor CVS1578 from pdb 1BA8 (orange) scored in 1MUE. Residue numbering for thrombin taken directly from 1MUE. Energies in kcal/mol. (Bottom) Corresponding DOCK_GA poses (H‐bonds in dashed magenta) and interaction energies (kcal/mol) for the three ligands in 1MUE.
4.9. Ensemble‐based evolution
All of the validation tests presented thus far have initiated evolution from a single parent. However, evolution can also be initiated from an ensemble (ensemble‐based evolution) which enables multiple sources of experimental information to be used simultaneously. For example, ensemble‐based evolution could be seeded with a group of crystallographic ligands known to bind to the same protein, a group of molecular fragments, or promising results from a virtual screen. To demonstrate this capability, 23 small molecules bound in the A‐site of the main protease (Mpro) of SARS‐CoV2, taken from publicly available crystal structures provided by the COVID Moonshot effort, 82 , 83 were evolved as shown in Figure 15. These ensemble‐based simulations employed the exact same conditions as the previously discussed single‐molecule runs. Readers should note that when different crystallographic structures are used to construct the initial ensemble for ensemble‐based evolution, if necessary, proteins should first be aligned to a common reference structure (typically through backbone alignment) before extracting the ligands.
FIGURE 15.
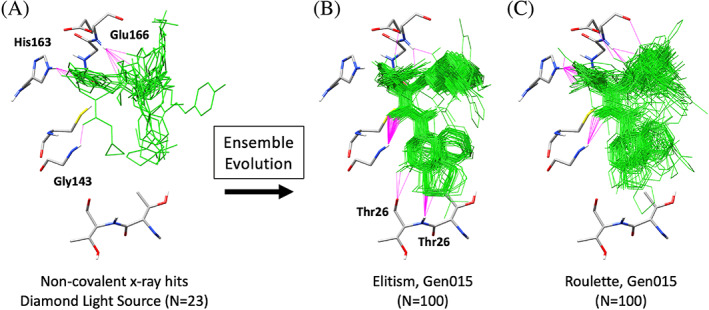
(A) Experimental binding poses for 23 non‐covalent molecules used to seed ensemble‐based evolution in the A‐site of Mpro of SARS‐CoV2. (B) Elitism ensemble of 100 molecules at generation 15. (C) Roulette ensemble of 100 molecules at generation 15. H‐bonds between ligands (green) and key residues (gray) in the Mpro binding site shown in magenta. Results from one seed are shown (seed 0)
As shown in Figure 15A, molecules in the initial parent ensemble make H‐bond interactions with the backbone of Glu166, the imidazole ring of His163 localized in the top of the A‐site, and in one case the backbone of Gly143. Interestingly, after 15 generations using elitism (Figure 15B), the resulting molecules all made H‐bonds with Gly143 and they had expanded towards the bottom of the A‐site to make H‐bonds with Thr26. No elitism compounds in this generation appeared to H‐bond with His163. In contrast, evolution using roulette (Figure 15C) maintained the initial H‐bond with His163 seen in the parents and, to a lesser extent than elitism, they also made showed H‐bonds Gly143. However, no roulette‐generated molecules in generation 15 appeared to H‐bond with Thr26. A few of these roulette examples interacted with Glu166 similar to the parents (Figure 15C vs. A). The results highlight again the potential benefit of using different selection methods, to generate a variety of favorably‐scored molecules, with different H‐bonding potential. In recent work reported by Zhang et al., 88 free energy perturbation methods were used to successfully re‐design the anti‐epileptic drug perampanel, a weak inhibitor of SARS‐CoV‐2 Mpro, to H‐bond with the Thr26 backbone at O and NH. It is interesting to note that the offspring obtained here, after 15 generations using elitism (Figure 15B), evolved to yield the same interactions.
5. CONCLUSIONS
This work presents a new genetic algorithm to facilitate molecular evolution of small organic molecules, in the context of a 3D protein‐ligand binding site, over multiple generations. Termed DOCK_GA, the method has been implemented into the actively developed program DOCK6 which enabled us to exploit and adapt existing DOCK functions including library generation, conformational sampling, chemical searching, and scoring. The program is organized (Figure 2) around five algorithmic stages (Initial Generation, Crossover & Mutation, Minimize & Score & Prune, Fitness Evaluation, Selection). The chemical evolution of molecules (Figure 3) is accomplished via two primary mechanisms: crossover (breeding) which blends parents together at overlapping compatible bonds, and mutation (deletion, addition, substitution, and replacement) which modifies functionality. A key feature of the algorithm, used to avoid combinatorial explosion, involves specifying one of three selection types based on elitism, tournament, or roulette selection procedures (Figure 4). To assess the performance and behavior of DOCK_GA we employed three primary groups of experiments based on (i) single‐molecule evolution in four clinically‐relevant systems, (ii) large‐scale benchmarking using 651 systems, and (iii) ensemble‐based evolution in a COVID drug target.
In the first group of experiments, we employed single‐molecule evolution for 500 generations, under three different selection methods, starting from crystallographic structures of zanamivir complexed with neuraminidase, erlotinib with epidermal growth factor receptor, apixaban with factor XA, and indomethacin with cyclooxygenase‐2. Numerous aspects were examined. In terms of mutation type success (Table 3), across all systems and selection methods, substitutions were more frequent (77%), followed by deletions (75%), additions (27%), and replacements (8%). For elitism, additions were particularly low (6%), likely as a result of the method generating larger offspring which makes additions in future generations less likely. For the same reason, the number of survivors containing a crossover (Table 3) were lower for elitism (8%), then the overall average (36%). The number of unique offspring retained per generation (Figure 6) for tournament and roulette remained relatively stable at 50–65 molecules while elitism showed a quick exponential drop which plateaued at 10–15 molecules around generation 100. In terms of chemical properties (Figure 7), at generation 500, elitism yielded molecules with larger MW, more #rotatable bonds, greater numbers of #H‐bond donors and acceptors, and much tighter distributions. Elitism also yielded more chemically similar molecules, as judged by higher pair‐wise Tanimoto coefficients (Figure 8). In terms of fitness convergence (Figure 9 and Figure S1), all selection methods yielded reasonably plateaued scores by about 250 generation. As expected, elitism also yielded the most favorably‐scored molecules with much smaller standard deviations. In terms of 3D structural convergence (Figure 10), elitism led to the highest structural similarity among members in the final ensemble, as judged by more negative pair‐wise Hungarian matching similarity (HMS) scores. An examination of the five top‐scoring molecules from each run, for compounds evolved from erlotinib (Figure 11), showed that the resulting congeneric series from elitism yielded higher Tanimoto scores (0.76–0.89) than tournament (0.71–0.85) or roulette (0.43–0.73). An examination of H‐bonding patterns (Figure 12) showed that roulette and tournament yielded more diverse interactions than elitism.
In the second group of experiments, we performed large‐scale benchmarking starting from 651 complexes taken from our SB2012 test set (651 unique pdb codes), and evolved molecules under the different selection methods for 25 generations. As before, single‐molecule evolution was employed. The goal was to test the algorithm with a larger more diverse dataset and to determine production efficiency in terms of number of molecules generated, and range of efficacy in terms of fitness, over a relatively short number of generations. Importantly, 73.3% of the 651 systems had produced 100 offspring by generation 25 (Figure 13A) effectively demonstrating that DOCK_GA can be employed in a wide‐variety of systems. Only one system failed to yield any offspring. The large number of systems for which the top‐scoring compounds had more favorable fitness at generation 25 relative to the initial parents (tournament 71.4% > elitism 59.3% > roulette 44.9%) further validates the infrastructure for molecular design (Figure 13B). For thrombin (Figure 14), we showed an interesting example in which a ligand evolved to make a new salt bridge as other reported inhibitors (CVS1578, argatroban).
In the third group of experiments, we performed evolution in the main protease (Mpro) of SARS‐CoV2 (Figure 15) starting from co‐crystalized ligands extracted from 23 x‐ray structures aligned to a common reference frame. The objective was to demonstrate “ensemble‐based evolution” in which multiple ligands are used to seed growth. Evolution in Mpro led to molecules that expanded into the binding site and made interactions with key residues that in some cases were similar (roulette) or different (elitism) than the initial parent ensemble (Figure 15). Interestingly, for elitism in particular, although they shared some spatial overlap with the parents near the top of the binding site, molecules evolved to make H‐bond interactions with the backbone of residue Thr26 at the bottom of the pocket in a manner similar to a group of potent Mpro inhibitors previously reported by Zhang et al. 88 The ability to evolve new compounds against clinically relevant targets, starting from an ensemble of previously reported inhibitors, allows users to more easily incorporate prior experimental binding information in their molecular design.
The outcomes of this work suggest DOCK_GA is a powerful evolutionary algorithm that will be a useful tool to design new molecules against a wide variety of clinically relevant targets. Key takeaways include: (1) From a development perspective, the algorithm is robust as demonstrated by the successful evolution of molecules under different starting conditions across a large and diverse protein dataset. (2) From a features perspective, users have flexibility with regards to control of parent input (single molecule or ensemble), selection method, fitness function (energy and/or similarity‐based), and molecular descriptors that promote drug‐likeness. (3) From a user perspective, the program is straightforward to run. All functions are integrated into the well‐validated DOCK6 infrastructure and require only a single executable and input file at run‐time. No additional software is required beyond that provided in the standard distribution. (4) Finally, from an application perspective, elitism would be recommended over roulette if users are interested in generating tightly clustered molecules in terms of chemical and structural similarity with more favorable fitness, and vice versa, with tournament being in between.
As with all molecular modeling software, the choice of which parameters to employ, and their specific values, can be daunting for users. Based on the testing outlined in this work, we believe the values in Table 1 and Table S1 are sound starting points for many applications. Nevertheless, as noted by a reviewer, users may wish to “tune” the input parameters to achieve a desired outcome. Some of the most straightforward parameters to explore include varying cutoffs that control ligand molecular weight, number of hydrogen bond donors and acceptors, number of rotatable bonds, and formal charge. Other parameters to explore include varying the number of generations and increasing the number of molecules retained each generation which could promote additional crossover events. Depending on the selection method, larger ensembles could lead to greater diversity (roulette) or faster convergence (elitism or tournament). Beyond varying input parameters, the choice of fragment libraries used for mutations will have a large effect on molecular evolution. As an example, use of smaller and more focused fragment libraries derived from previously reported kinase inhibitors could be used to guide evolution towards compounds containing chemical moieties known to be important for kinase activity. Finally, the choice of scoring function specified will have a significant effect on the search outcomes. While the present work employed only a simple two‐term function (Equation 2), users may wish to explore including other DOCK6 functions to help direct evolution towards a known ligand reference with activity, for example, in terms of overlap based on molecular footprints, pharmacophores, Hungarian matching similarity, or combinations (see Methods).
Ongoing work planned for future release involve adapting DOCK_GA routines to limit which regions of a molecule can be modified, compute additional cheminformatics properties, permit evolution of covalently bound ligands, and perform more intelligent functional group swapping during substitution and replacement. Other planned efforts involve developing procedures to dynamically modulate mutation types and mutation rates during evolution, evaluating niching methods 89 , 90 , 91 , 92 to better balance individual scoring function terms for offspring selection, and assessing the utility of using mass extinction events to re‐seed evolution upon reaching a fitness and/or similarity convergence threshold.
As a final comment, we would emphasize that beyond suggesting only a few specific molecules to synthesize, DOCK_GA can be used as a powerful “hypothesis generator” for exploring chemical space. For example, we have found that visualization of interaction patterns made by an evolved ensemble is a practical way to pinpoint how an existing compound might be modified so that the same binding site residues can be engaged in a similar manner, for example, through salt bridges, H‐bonding, hydrophobic packing, or other means. Further, top‐scoring compounds generated by DOCK_GA can be used as input for more sophisticated atomistic simulation methods, such as molecular dynamics, to further gauge geometric and energetic compatibility with a target. Tutorials, input files, best practices, and planned work for future releases of the algorithms described in this work can be found at the Rizzo lab wiki located at https://ringo.ams.stonybrook.edu.
FUNDING INFORMATION
National Institutes of Health; Contract/grant numbers: T32GM136572 (to Lauren E. Prentis and John D. Bickel) and R35GM126906 (to Robert C. Rizzo).
Supporting information
Figure S1 Convergence results using multiple random seeds. The graph below shows results for four test systems using three different random seeds.
Table S1 DOCK6 genetic algorithm input file. The input below is a representative example of a complete parameter file used to execute the genetic algorithm with the elitism selection method described in the main text. Parameters unique to the genetic algorithm are shaded in gray. Interested users should consult the Rizzo lab website for the most up to date DOCK6 tutorials located at https://ringo.ams.stonybrook.edu/index.php/Main_Page.
ACKNOWLEDGMENTS
The authors thank Trent E. Balius, T. Dwight McGee Jr., and members of the Rizzo Lab members for helpful conversations and computational assistance. Early inspiration for this study came from prior work by Pegg, Haresco, and Kuntz (J. Computer‐Aided Mol. Design 2001, 15, 911–933). The authors would like to thank Stony Brook Research Computing and Cyberinfrastructure, and the Institute for Advanced Computational Science at Stony Brook University for access to the high‐performance LIred and SeaWulf computing systems, the latter of which was made possible by a $1.4M National Science Foundation grant (#1531492). This work was funded in part by the Stony Brook University Office of the Vice President for Research, NIH training grant T32GM136572 (to Lauren E. Prentis and John D. Bickel), and NIH grant R35GM126906 (to Robert C. Rizzo).
Prentis L. E., Singleton C. D., Bickel J. D., Allen W. J., Rizzo R. C., J. Comput. Chem. 2022, 43(29), 1942. 10.1002/jcc.26993
Lauren E. Prentis and Courtney D. Singleton contributed equally to this work.
Funding information National Institutes of Health, Grant/Award Numbers: R35GM126906, T32GM136572
DATA AVAILABILITY STATEMENT
The source code used in this study has been implemented into the latest version of DOCK6 for public release and will be available to registered users at http://dock.compbio.ucsf.edu/. The protein‐ligand systems studied here, derived from the RSCB PDB at https://www.rcsb.org/, were taken from our previously published SB2012 testset available at https://ringo.ams.stonybrook.edu/index.php/Rizzo_Lab_Downloads. Other data that support the findings of this study are available from the corresponding author upon reasonable request.
REFERENCES
- 1. Kuntz I. D., Science 1992, 257, 1078. [DOI] [PubMed] [Google Scholar]
- 2. Jorgensen W. L., Science 2004, 303, 1813. [DOI] [PubMed] [Google Scholar]
- 3. Shoichet B. K., Nature 2004, 432, 862. [DOI] [PMC free article] [PubMed] [Google Scholar]
- 4. Berman H. M., Westbrook J., Feng Z., Gilliland G., Bhat T. N., Weissig H., Shindyalov I. N., Bourne P. E., Nucleic Acids Res. 2000, 28, 235. [DOI] [PMC free article] [PubMed] [Google Scholar]
- 5. Burley S. K., Bhikadiya C., Bi C., Bittrich S., Chen L., Crichlow G. V., Christie C. H., Dalenberg K., Di Costanzo L., Duarte J. M., Dutta S., Feng Z., Ganesan S., Goodsell D. S., Ghosh S., Green R. K., Guranovic V., Guzenko D., Hudson B. P., Lawson C. L., Liang Y., Lowe R., Namkoong H., Peisach E., Persikova I., Randle C., Rose A., Rose Y., Sali A., Segura J., Sekharan M., Shao C., Tao Y. P., Voigt M., Westbrook J. D., Young J. Y., Zardecki C., Zhuravleva M., Nucleic Acids Res. 2021, 49, D437. [DOI] [PMC free article] [PubMed] [Google Scholar]
- 6. Overington J., J. Comput. Aid. Mol. Des. 2009, 23, 195. [DOI] [PubMed] [Google Scholar]
- 7. Wassermann A. M., Bajorath J., Expert Opin. Drug Discov. 2011, 6, 683. [DOI] [PubMed] [Google Scholar]
- 8. Leiserson C. E., Thompson N. C., Emer J. S., Kuszmaul B. C., Lampson B. W., Sanchez D., Schardl T. B., Science 2020, 368, eaam9744. [DOI] [PubMed] [Google Scholar]
- 9. Berger W. T., Ralph B. P., Kaczocha M., Sun J., Balius T. E., Rizzo R. C., Haj‐Dahmane S., Ojima I., Deutsch D. G., PLoS One 2012, 7, e50968. [DOI] [PMC free article] [PubMed] [Google Scholar]
- 10. Holden P. M., Kaur H., Goyal R., Gochin M., Rizzo R. C., Bioorg. Med. Chem. Lett. 2012, 22, 3011. [DOI] [PMC free article] [PubMed] [Google Scholar]
- 11. Holden P. M., Allen W. J., Gochin M., Rizzo R. C., Bioorg. Med. Chem. 2014, 22, 651. [DOI] [PMC free article] [PubMed] [Google Scholar]
- 12. Allen W. J., Yi H. A., Gochin M., Jacobs A., Rizzo R. C., Bioorg. Med. Chem. Lett. 2015, 25, 2853. [DOI] [PMC free article] [PubMed] [Google Scholar]
- 13. Teng Y. H., Berger W. T., Nesbitt N. M., Kumar K., Balius T. E., Rizzo R. C., Tonge P. J., Ojima I., Swaminathan S., Bioorg. Med. Chem. 2015, 23, 5489. [DOI] [PubMed] [Google Scholar]
- 14. Zhou Y., McGillick B. E., Teng Y. G., Haranahalli K., Ojima I., Swaminathan S., Rizzo R. C., Bioorg. Med. Chem. 2016, 24, 4875. [DOI] [PubMed] [Google Scholar]
- 15. McGee T. D. Jr., Yi H. A., Allen W. J., Jacobs A., Rizzo R. C., Bioorg. Med. Chem. Lett. 2017, 27, 3177. [DOI] [PMC free article] [PubMed] [Google Scholar]
- 16. Guo J., Collins S., Miller W. T., Rizzo R. C., Biochemistry 2018, 57, 4934. [DOI] [PMC free article] [PubMed] [Google Scholar]
- 17. Zhou Y., Elmes M. W., Sweeney J. M., Joseph O. M., Che J., Hsu H. C., Li H., Deutsch D. G., Ojima I., Kaczocha M., Rizzo R. C., Biochemistry 2019, 58, 4304. [DOI] [PMC free article] [PubMed] [Google Scholar]
- 18. Singleton C. D., Humby M. S., Yi H. A., Rizzo R. C., Jacobs A., J. Virol. 2019, 93, e00676‐19. [DOI] [PMC free article] [PubMed] [Google Scholar]
- 19. Telehany S. M., Humby M. S., McGee T. D. Jr., Riley S. P., Jacobs A., Rizzo R. C., Biochemistry 2020, 59, 3709. [DOI] [PMC free article] [PubMed] [Google Scholar]
- 20. Irwin J. J., Shoichet B. K., J. Chem. Inform. Model. 2005, 45, 177. [DOI] [PMC free article] [PubMed] [Google Scholar]
- 21. Allen W. J., Fochtman B. C., Balius T. E., Rizzo R. C., J. Comput. Chem. 2017, 38, 2641. [DOI] [PMC free article] [PubMed] [Google Scholar]
- 22. Bohacek R., McMartin C., Glunz P., Rich D. H., in Rational Drug Design (Eds: Truhlar D. G., Howe W. J., Hopfinger A. J., Blaney J., Dammkoehler R. A.), Springer New York, New York, NY: 1999, p. 103. [Google Scholar]
- 23. Chéron N., Jasty N., Shakhnovich E. I., J. Med. Chem. 2016, 59, 4171. [DOI] [PubMed] [Google Scholar]
- 24. Durrant J., Amaro R. E., McCammon J. A., Chem. Biol. Drug Des. 2009, 73, 168. [DOI] [PMC free article] [PubMed] [Google Scholar]
- 25. Durrant J. D., Lindert S., McCammon J. A., J. Mol. Graphics Modell. 2013, 44, 104. [DOI] [PMC free article] [PubMed] [Google Scholar]
- 26. Luo Z., Wang R., Lai L., J. Chem. Inform. Comput. Sci. 1996, 36, 1187. [DOI] [PubMed] [Google Scholar]
- 27. Allen W. J., Balius T. E., Mukherjee S., Brozell S. R., Moustakas D. T., Lang P. T., Case D. A., Kuntz I. D., Rizzo R. C., J. Comput. Chem. 2015, 36, 1132. [DOI] [PMC free article] [PubMed] [Google Scholar]
- 28. Barreiro G., Kim J. T., Guimaraes C. R., Bailey C. M., Domaoal R. A., Wang L., Anderson K. S., Jorgensen W. L., J. Med. Chem. 2007, 50, 5324. [DOI] [PMC free article] [PubMed] [Google Scholar]
- 29. Pierce A. C., Rao G., Bemis G. W., J. Med. Chem. 2004, 47, 2768. [DOI] [PubMed] [Google Scholar]
- 30. Pearlman D. A., Murcko M. A., J. Med. Chem. 1996, 39, 1651. [DOI] [PubMed] [Google Scholar]
- 31. Fechner U., Schneider G., J. Chem. Inform. Model. 2006, 46, 699. [DOI] [PubMed] [Google Scholar]
- 32. Fechner U., Schneider G., J. Chem. Inform. Model. 2007, 47, 656. [DOI] [PubMed] [Google Scholar]
- 33. Dey F., Caflisch A., J. Chem. Inform. Model. 2008, 48, 679. [DOI] [PubMed] [Google Scholar]
- 34. Rotstein S. H., Murcko M. A., J. Comput.‐Aided Mol. Des. 1993, 7, 23. [DOI] [PubMed] [Google Scholar]
- 35. Rotstein S. H., Murcko M. A., J. Med. Chem. 1993, 36, 1700. [DOI] [PubMed] [Google Scholar]
- 36. Nishibata Y., Itai A., Tetrahedron 1991, 47, 8985. [Google Scholar]
- 37. Nishibata Y., Itai A., J. Med. Chem. 1993, 36, 2921. [DOI] [PubMed] [Google Scholar]
- 38. Böhm H.‐J., J. Comput.‐Aided Mol. Des. 1992, 6, 61. [DOI] [PubMed] [Google Scholar]
- 39. Bohm H. J., J. Comput.‐Aided Mol. Des. 1992, 6, 593. [DOI] [PubMed] [Google Scholar]
- 40. Lameijer E.‐W., Kok J. N., Bäck T., Ijzerman A. P., J. Chem. Inform. Model. 2006, 46, 545. [DOI] [PubMed] [Google Scholar]
- 41. Waszkowycz B., Clark D. E., Frenkel D., Li J., Murray C. W., Robson B., Westhead D. R., J. Med. Chem. 1994, 37, 3994. [DOI] [PubMed] [Google Scholar]
- 42. Todorov N. P., Dean P. M., J. Comput.‐Aided Mol. Des. 1997, 11, 175. [DOI] [PubMed] [Google Scholar]
- 43. DeWitte R. S., Ishchenko A. V., Shakhnovich E. I., J. Am. Chem. Soc. 1997, 119, 4608. [Google Scholar]
- 44. Gillet V. J., Myatt G., Zsoldos Z., Johnson A. P., Perspect. Drug Discov. 1995, 3, 34. [Google Scholar]
- 45. Mata P., Gillet V. J., Johnson A. P., Lampreia J., Myatt G. J., Sike S., Stebbings A. L., J. Chem. Inform. Comput. Sci. 1995, 35, 479. [Google Scholar]
- 46. Blaschke T., Arus‐Pous J., Chen H., Margreitter C., Tyrchan C., Engkvist O., Papadopoulos K., Patronov A., J. Chem. Inf. Model. 2020, 60, 5918. [DOI] [PubMed] [Google Scholar]
- 47. Grisoni F., Huisman B. J. H., Button A. L., Moret M., Atz K., Merk D., Schneider G., Sci. Adv. 2021, 7, eabg3338. [DOI] [PMC free article] [PubMed] [Google Scholar]
- 48. Pegg S. H., Haresco J., Kuntz I., J. Comput.‐Aided Mol. Des. 2001, 15, 911. [DOI] [PubMed] [Google Scholar]
- 49. Spiegel J. O., Durrant J. D., Aust. J. Chem. 2020, 12, 25. [Google Scholar]
- 50. Glen R. C., Payne A. W. R., J. Comput.‐Aided Mol. Des. 1995, 9, 181. [DOI] [PubMed] [Google Scholar]
- 51. Brown N., McKay B., Gasteiger J., J. Comput.‐Aided Mol. Des. 2004, 18, 761. [DOI] [PubMed] [Google Scholar]
- 52. Brown N., McKay B., Gilardoni F., Gasteiger J., J. Chem. Inform. Comput. Sci. 2004, 44, 1079. [DOI] [PubMed] [Google Scholar]
- 53. Al G., John L., Todd W., Nanotechnology 1999, 10, 290. [Google Scholar]
- 54. Douguet D., Thoreau E., Grassy G., J. Comput.‐Aided Mol. Des. 2000, 14, 449. [DOI] [PubMed] [Google Scholar]
- 55. Douguet D., Munier‐Lehmann H., Labesse G., Pochet S., J. Med. Chem. 2005, 48, 2457. [DOI] [PubMed] [Google Scholar]
- 56. Douguet D., Nucleic Acids Res. 2010, 38, W615. [DOI] [PMC free article] [PubMed] [Google Scholar]
- 57. Wang R., Gao Y., Lai L., J. Mol. Model. 2000, 6, 498. [Google Scholar]
- 58. Yuan Y., Pei J., Lai L., J. Chem. Inf. Model. 2011, 51, 1083. [DOI] [PubMed] [Google Scholar]
- 59. Nachbar R. B., Genet. Program. Evol. Mach. 2000, 1, 57. [Google Scholar]
- 60. Vinkers H. M., de Jonge M. R., Daeyaert F. F. D., Heeres J., Koymans L. M. H., van Lenthe J. H., Lewi P. J., Timmerman H., Van Aken K., Janssen P. A. J., J. Med. Chem. 2003, 46, 2765. [DOI] [PubMed] [Google Scholar]
- 61. Schneider G., Lee M.‐L., Stahl M., Schneider P., J. Comput.‐Aided Mol. Des. 2000, 14, 487. [DOI] [PubMed] [Google Scholar]
- 62. Kawai K., Yoshimaru K., Takahashi Y., J. Comput. Chem. Jpn. 2011, 10, 79. [Google Scholar]
- 63. Kawai K., Nagata N., Takahashi Y., J. Chem. Inform. Model. 2014, 54, 49. [DOI] [PubMed] [Google Scholar]
- 64. Babine R. E., Bleckman T. M., Kissinger C. R., Showalter R., Pelletier L. A., Lewis C., Tucker K., Moomaw E., Parge H. E., Villafranca J. E., Bioorg. Med. Chem. Lett. 1995, 5, 1719. [Google Scholar]
- 65. Holland J. H., Adaptation in Natural and Artificial Systems. An Introductory Analysis with Application to Biology, Control, and Artificial Intelligence, University of Michigan Press, Ann Arbor, MI: 1975. [Google Scholar]
- 66. Ewing T. J. A., Makino S., Skillman A. G., Kuntz I. D., J. Comput.‐Aided Mol. Des. 2001, 15, 411. [DOI] [PubMed] [Google Scholar]
- 67. Allen W. J., Rizzo R. C., J. Chem. Inform. Model. 2014, 54, 518. [DOI] [PMC free article] [PubMed] [Google Scholar]
- 68. Balius T. E., Allen W. J., Mukherjee S., Rizzo R. C., J. Comput. Chem. 2013, 34, 1226. [DOI] [PMC free article] [PubMed] [Google Scholar]
- 69. Jiang L., Rizzo R. C., J. Phys. Chem. B 2015, 119, 1083. [DOI] [PMC free article] [PubMed] [Google Scholar]
- 70. Maass P., Schulz‐Gasch T., Stahl M., Rarey M., J. Chem. Inform. Model. 2007, 47, 390. [DOI] [PubMed] [Google Scholar]
- 71. Tripos , Tripos MOL2 File Format, Tripos, St. Louis, MO: 2009. [Google Scholar]
- 72. Gasteiger J., Marsili M., Tetrahedron 1980, 36, 3219. [Google Scholar]
- 73. Meng E. C., Shoichet B. K., Kuntz I. D., J. Comput. Chem. 1992, 13, 505. [Google Scholar]
- 74. Sastry G. M., Dixon S. L., Sherman W., J. Chem. Inf. Model. 2011, 51, 2455. [DOI] [PubMed] [Google Scholar]
- 75. Kamphausen S., Holtge N., Wirsching F., Morys‐Wortmann C., Riester D., Goetz R., Thurk M., Schwienhorst A., J. Comput.‐Aided Mol. Des. 2002, 16, 551. [DOI] [PubMed] [Google Scholar]
- 76. Lipowski A., Lipowska D., Phys. A: Stat. Mech. Appl. 2012, 391, 2193. [Google Scholar]
- 77. Mukherjee S., Balius T. E., Rizzo R. C., J. Chem. Inform. Model. 2010, 50, 1986. [DOI] [PMC free article] [PubMed] [Google Scholar]
- 78. Taylor N. R., Cleasby A., Singh O., Skarzynski T., Wonacott A. J., Smith P. W., Sollis S. L., Howes P. D., Cherry P. C., Bethell R., Colman P., Varghese J., J. Med. Chem. 1998, 41, 798. [DOI] [PubMed] [Google Scholar]
- 79. Stamos J., Sliwkowski M. X., Eigenbrot C., J. Biol. Chem. 2002, 277, 46265. [DOI] [PubMed] [Google Scholar]
- 80. Pinto D. J. P., Orwat M. J., Koch S., Rossi K. A., Alexander R. S., Smallwood A., Wong P. C., Rendina A. R., Luettgen J. M., Knabb R. M., He K., Xin B., Wexler R. R., Lam P. Y. S., J. Med. Chem. 2007, 50, 5339. [DOI] [PubMed] [Google Scholar]
- 81. Kurumbail R. G., Stevens A. M., Gierse J. K., McDonald J. J., Stegeman R. A., Pak J. Y., Gildehaus D., Miyashiro J. M., Penning T. D., Seibert K., Isakson P. C., Stallings W. C., Nature 1996, 384, 644. [DOI] [PubMed] [Google Scholar]
- 82. The COVID Moonshot Consortium , Achdout H., Aimon A., Bar‐David E., Barr H., Ben‐Shmuel A., Bennett J., Bobby M. L., Brun J., Sarma B. V. N. B. S., Calmiano M., Carbery A., Cattermole E., Chodera J. D., Clyde A., Coffland J. E., Cohen G., Cole J., Contini A., Cox L., Cvitkovic M., Dias A., Douangamath A., Duberstein S., Dudgeon T., Dunnett L., Eastman P. K., Erez N., Fairhead M., Fearon D., Fedorov O., Ferla M., Foster H., R. Foster, R. Gabizon, Gehrtz P., Gileadi C., Giroud C., Glass W. G., Glen R., Glinert I., Gorichko M., Gorrie‐Stone T., Griffen E. J., Heer J., Hill M., Horrell S., Hurley M. F. D., Israely T., Jajack A., Jnoff E., John T., Kantsadi A. L., Kenny P. W., Kiappes J. L., Koekemoer L., Kovar B., Krojer T., Lee A. A., Lefker B. A., Levy H., London N., Lukacik P., Macdonald H. B., Maclean B., Malla T. R., Matviiuk T., Mccorkindale W., Melamed S., Michurin O., Mikolajek H., Morris A., Morris G. M., Morwitzer M. J., Moustakas D., Neto J. B., Oleinikovas V., Overheul G. J., Owen D., Pai R., Pan J., Paran N., Perry B., Pingle M., Pinjari J., Politi B., Powell A., Psenak V., Puni R., Rangel V. L., Reddi R. N., Reid S. P., Resnick E., Robinson M. C., Robinson R. P., Rufa D., Schofield C., Shaikh A., Shi J., Shurrush K., Sittner A., Skyner R., Smalley A., Smilova M. D., Spencer J., Strain‐Damerell C., Swamy V., Tamir H., Tennant R., Thompson A., Thompson W., Tomasio S., Tumber A., Vakonakis I., van Rij R. P., Varghese F. S., Vaschetto M., Vitner E. B., Voelz V., von Delft A., von Delft F., Walsh M., Ward W., Weatherall C., Weiss S., Wild C. F., Wittmann M., Wright N., Yahalom‐Ronen Y., Zaidmann D., Zidane H., Zitzmann N., COVID Moonshot: Open Science Discovery of SARS‐CoV‐2 Main Protease Inhibitors by Combining Crowdsourcing, High‐Throughput Experiments, Computational Simulations, and Machine Learning. bioRxiv 2020, 2020.10.29.339317.
- 83. Walsh M. A., Grimes J. M., Stuart D. I., Biochem. Biophys. Res. Commun. 2021, 538, 40. [DOI] [PMC free article] [PubMed] [Google Scholar]
- 84. Douangamath A., Fearon D., Gehrtz P., Krojer T., Lukacik P., Owen C. D., Resnick E., Strain‐Damerell C., Aimon A., Abranyi‐Balogh P., Brandao‐Neto J., Carbery A., Davison G., Dias A., Downes T. D., Dunnett L., Fairhead M., Firth J. D., Jones S. P., Keeley A., Keseru G. M., Klein H. F., Martin M. P., Noble M. E. M., O'Brien P., Powell A., Reddi R. N., Skyner R., Snee M., Waring M. J., Wild C., London N., von Delft F., Walsh M. A., Nat. Commun. 2020, 11, 5047. [DOI] [PMC free article] [PubMed] [Google Scholar]
- 85. Liu J., Cai Z., Liu J., in Proceedings of the 3rd World Congress on Intelligent Control and Automation (Cat. No. 00EX393), 26 June–2 July 2000, 1, 495.
- 86. Lipkus A. H., J. Math. Chem. 1999, 26, 263. [Google Scholar]
- 87. Willett P., Barnard J. M., Downs G. M., J. Chem. Inf. Comp. Sci. 1998, 38, 983. [Google Scholar]
- 88. Zhang C. H., Stone E. A., Deshmukh M., Ippolito J. A., Ghahremanpour M. M., Tirado‐Rives J., Spasov K. A., Zhang S., Takeo Y., Kudalkar S. N., Liang Z., Isaacs F., Lindenbach B., Miller S. J., Anderson K. S., Jorgensen W. L., ACS Cent. Sci. 2021, 7, 467. [DOI] [PMC free article] [PubMed] [Google Scholar]
- 89. Deb K., Pratap A., Agarwal S., Meyarivan T., IEEE Trans. Evol. Comput. 2002, 6, 182. [Google Scholar]
- 90. Cedeño W., Vemuri V. R., Theor. Comput. Sci. 1999, 229, 177. [Google Scholar]
- 91. Mengshoel O. J., Goldberg D. E., Evol. Comput. 2008, 16, 315. [DOI] [PubMed] [Google Scholar]
- 92. Sareni B., Krähenbühl L., IEEE Tran. Evol. Comput. Inst. Electric. Electron. Eng. 1998, 2, 8. [Google Scholar]
Associated Data
This section collects any data citations, data availability statements, or supplementary materials included in this article.
Supplementary Materials
Figure S1 Convergence results using multiple random seeds. The graph below shows results for four test systems using three different random seeds.
Table S1 DOCK6 genetic algorithm input file. The input below is a representative example of a complete parameter file used to execute the genetic algorithm with the elitism selection method described in the main text. Parameters unique to the genetic algorithm are shaded in gray. Interested users should consult the Rizzo lab website for the most up to date DOCK6 tutorials located at https://ringo.ams.stonybrook.edu/index.php/Main_Page.
Data Availability Statement
The source code used in this study has been implemented into the latest version of DOCK6 for public release and will be available to registered users at http://dock.compbio.ucsf.edu/. The protein‐ligand systems studied here, derived from the RSCB PDB at https://www.rcsb.org/, were taken from our previously published SB2012 testset available at https://ringo.ams.stonybrook.edu/index.php/Rizzo_Lab_Downloads. Other data that support the findings of this study are available from the corresponding author upon reasonable request.