

Abstract
This report of the EFSA and the European Centre for Disease Prevention and Control presents the results of zoonoses monitoring activities carried out in 2020 in 27 EU Member States (MS) and nine non‐MS. Key statistics on zoonoses and zoonotic agents in humans, food, animals and feed are provided and interpreted historically. Two events impacted 2020 MS data collection and related statistics: the Coronavirus Disease 2019 (COVID‐19) pandemic and the withdrawal of the United Kingdom from the EU. In 2020, the first and second most reported zoonoses in humans were campylobacteriosis and salmonellosis, respectively. The EU trend for confirmed human cases of these two diseases was stable (flat) from 2016 to 2020. Fourteen of the 26 MS reporting data on Salmonella control programmes in poultry met the reduction targets for all poultry categories. Salmonella results for carcases of various species performed by competent authorities were more frequently positive than own‐checks conducted by food business operators. This was also the case for Campylobacter quantification results from broiler carcases for the MS group that submitted data from both samplers, whereas overall at EU level, those percentages were comparable. Yersiniosis was the third most reported zoonosis in humans, with 10‐fold less cases reported than salmonellosis, followed by Shiga toxin‐producing Escherichia coli (STEC) and Listeria monocytogenes infections. Illnesses caused by L. monocytogenes and West Nile virus infections were the most severe zoonotic diseases with the highest case fatality. In 2020, 27 MS reported 3,086 foodborne outbreaks (a 47.0% decrease from 2019) and 20,017 human cases (a 61.3% decrease). Salmonella remained the most frequently reported causative agent for foodborne outbreaks. Salmonella in ‘eggs and egg products’, norovirus in ‘crustaceans, shellfish, molluscs and products containing them’ and L. monocytogenes in ‘fish and fish products’ were the agent/food pairs of most concern. This report also provides updates on tuberculosis due to Mycobacterium bovis or Mycobacterium caprae, Brucella, Trichinella, Echinococcus, Toxoplasma, rabies, Coxiella burnetii (Q fever) and tularaemia.
Keywords: Campylobacter , foodborne outbreaks, Listeria, monitoring, parasites, Salmonella, zoonoses
Introduction
Legal basis of European Union‐coordinated zoonoses monitoring
The European Union (EU) system for the monitoring and collection of information on zoonoses is based on Zoonoses Directive 2003/99/EC 1 , which obliges EU Member States (MS) to collect relevant and, when applicable, comparable data on zoonoses, zoonotic agents, antimicrobial resistance and foodborne outbreaks. In addition, MS shall assess trends and sources of these agents, as well as outbreaks in their territory, submitting an annual report each year by the end of May to the European Commission covering the data collected. The European Commission should subsequently forward these reports to the European Food Safety Authority (EFSA). EFSA is assigned the tasks of examining these data and publishing the EU Annual Summary Reports. In 2004, the European Commission entrusted EFSA with the task of setting up an electronic reporting system and database for monitoring zoonoses (EFSA Mandate No 2004‐0178, continued by M‐2015‐0231 2 ).
Data collection on human diseases from MS is conducted in accordance with Decision 1082/2013/EU 3 on serious cross‐border threats to health. In October 2013, this Decision replaced Decision 2119/98/EC on setting up a network for the epidemiological surveillance and control of communicable diseases in the EU. The case definitions to be followed when reporting data on infectious diseases to the European Centre for Disease Prevention and Control (ECDC) are described in Decision 2018/945/EU 4 . ECDC has provided data on zoonotic infections in humans, as well as their analyses, for the EU Summary Reports since 2005. Since 2008, data on human cases have been received via The European Surveillance System (TESSy), maintained by ECDC.
Reporting requirements
According to List A of Annex I of Zoonoses Directive 2003/99/EC, data on animals, food and feed must be reported on a mandatory basis for the following eight zoonotic agents: Salmonella, Campylobacter, Listeria monocytogenes, Shiga toxin‐producing Escherichia coli (STEC), Mycobacterium bovis, Brucella, Trichinella and Echinococcus. In addition, and based on the epidemiological situations in the MS, data must be reported on the following agents and zoonoses (List B of Annex I of the Zoonoses Directive): (i) viral zoonoses: calicivirus, hepatitis A virus, influenza virus, rabies, viruses transmitted by arthropods; (ii) bacterial zoonoses: borreliosis and agents thereof, botulism and agents thereof, leptospirosis and agents thereof, psittacosis and agents thereof, tuberculosis due to agents other than M. bovis, vibriosis and agents thereof, yersiniosis and agents thereof; (iii) parasitic zoonoses: anisakiasis and agents thereof, cryptosporidiosis and agents thereof, cysticercosis and agents thereof, toxoplasmosis and agents thereof; and (iv) other zoonoses and zoonotic agents such as Francisella and Sarcocystis. Furthermore, MS provided data on certain other microbiological contaminants in foods: histamine, staphylococcal enterotoxins and Cronobacter sakazakii, for which food safety criteria are set down in the EU legislation.
The general rules on the monitoring of zoonoses and zoonotic agents in animals, food and feed are laid down in Article 4 of Chapter II ‘Monitoring of zoonoses and zoonotic agents’ of the Directive. Specific rules for coordinated monitoring programmes and for food business operators are laid down in Articles 5 and 6 of Chapter II. Specific rules for the monitoring of antimicrobial resistance are laid down in Article 7 of Chapter III ‘Antimicrobial resistance’, whereas rules for epidemiological investigation of foodborne outbreaks can be found in Article 8 of Chapter IV ‘foodborne outbreaks’.
According to Article 9 of Chapter V ‘Exchange of information’ of the Directive, MS shall assess trends and sources of zoonoses, zoonotic agents and antimicrobial resistance in their territory and each MS shall send to the European Commission every year by the end of May a report on trends and sources of zoonoses, zoonotic agents and antimicrobial resistance, covering the data collected under Articles 4, 7 and 8 over the previous year. Reports and any summaries of these shall be made publicly available. The requirements for these MS‐specific reports are described in Parts A–D of Annex IV as regards the monitoring of zoonoses, zoonotic agents and antimicrobial resistance carried out in accordance with Article 4 or 7, and in Part E of Annex IV as regards the monitoring of foodborne outbreaks carried out in accordance with Article 8.
Terms of Reference
In accordance with Article 9 of Directive 2003/99/EC, EFSA shall examine the submitted national reports and data of the EU MS 2020 zoonoses monitoring activities as described above and publish an EU Summary Report on the trends and sources of zoonoses, zoonotic agents and antimicrobial resistance in the EU.
The 2020 data on antimicrobial resistance in zoonotic agents submitted and validated by the MS are published in a separate EU Summary Report.
Data sources and report production
Since 2019, the annual EU Summary Reports on zoonoses, zoonotic agents and foodborne outbreaks have been renamed the ‘EU One Health Zoonoses Summary Report’ (EUOHZ), which is co‐authored by EFSA and ECDC.
The production of the EUOHZ 2020 report was supported by the Consortium ZOE (Zoonoses under a One health perspective in the EU) Work‐package 1 composed by the Istituto Superiore di Sanità (Rome, Italy), the Istituto Zooprofilattico Sperimentale delle Venezie (Padova, Italy), the French Agency for Food, Environmental and Occupational Health & Safety (Maisons‐Alfort, France), the Istituto Zooprofilattico Sperimentale dell’Abruzzo e del Molise (Teramo, Italy), the Istituto Zooprofilattico Sperimentale della Lombardia e dell’Emilia Romagna (Brescia, Italy) under the coordination of the Istituto Zooprofilattico Sperimentale dell’Abruzzo e del Molise (Teramo, Italy) (Consortium and Work‐package 3!Grignolleader).
The efforts made by the MS, the reporting non‐MS and the European Commission in the reporting of zoonoses data and in the preparation of this report are gratefully acknowledged.
The MS, other reporting countries, the European Commission, members of EFSA’s Scientific Panels on Biological Hazards (BIOHAZ) and Animal Health and Welfare (AHAW), and the relevant European Union Reference Laboratories (EURLs) were consulted while preparing the EUOHZ 2020.
The EUOHZ 2020 focuses on the most relevant information on zoonoses and foodborne outbreaks within the EU in 2020. If substantial changes compared with the previous years were observed, they have been reported.
In order to gather information about the possible impact of the COVID‐19 (Coronavirus Disease 2019) pandemic on zoonoses data collection in accordance with Directive 2003/99/EC, a questionnaire was submitted by EFSA and ECDC to the reporting countries. They were asked to evaluate whether in their country, the COVID‐19 pandemic might have had an impact on the monitoring or surveillance and reporting of zoonoses and foodborne outbreaks in 2020. Moreover, countries were asked whether, according to their experience, the collected 2020 data were comparable or not with the previous years’ data. The answers received were used to support the interpretation of the 2020 monitoring and surveillance results (Table 3).
Table 3.
Results of the survey on the impact of COVID‐19 on the surveillance/reporting of human cases of FWDs (brucellosis, campylobacteriosis, echinococcosis, listeriosis, salmonellosis, STEC infection, trichinellosis, congenital toxoplasmosis and yersiniosis) and comparability of collected data (2019, 2020)
| Country | Impact on surveillance and reporting | Comparability of 2020 and 2019 data | ||||||
|---|---|---|---|---|---|---|---|---|
| Yes | No | Unknown | Variable* | Low | Medium | High | Variable*/Unknown | |
| Austria | x | x | ||||||
| Belgium | x | x | ||||||
| Czechia | X | x | ||||||
| Denmark | x | x | ||||||
| Estonia | x | x | ||||||
| Finland | X | x | ||||||
| France | x | x | ||||||
| Germany | x | x | ||||||
| Greece | x | x | ||||||
| Hungary | x | x | ||||||
| Ireland | x | x | ||||||
| Italy | x | x | ||||||
| Latvia | x | x | ||||||
| Lithuania | X | x | ||||||
| Luxembourg | x | x | ||||||
| Malta | x | x | ||||||
| Netherlands | X | x | ||||||
| Romania | x | x | ||||||
| Slovakia | x | x | ||||||
| Slovenia | x | x | ||||||
| Spain | x | x | ||||||
| Sweden | x | x | ||||||
| Iceland | x | x | ||||||
| Norway | x | x | ||||||
Varies according to the zoonosis.
The 2020 data collection was also affected by the reduction in the number of EU MS from 28 to 27, due to the withdrawal of the United Kingdom (of Great Britain and Northern Ireland) from the EU 5 . On 1 February 2020, the United Kingdom became a third country. The following approaches were used to take account of this reduction in data volume at the EU level, for food, animals, feed and foodborne outbreaks (see below). In descriptive tables, data from the United Kingdom were included in the EU statistics for 2019 and previous years, whereas the 2020 statistical data from the United Kingdom, when available, were assigned to the non‐MS group. With regard to trend analyses of human data, only countries having contributed data for all the years of the considered period were taken into account in the analyses, whereas for trend analyses of the estimated prevalence of Salmonella in poultry populations covered by National Control Programs, any data provided by the reporting EU countries were taken into account in the model. United Kingdom data were only included when available for 2019 and previous years.
Human data collection for 2020
In the EUOHZ for 2020, the analyses of data from infections in humans were prepared by the Food‐ and Waterborne Diseases and Zoonoses (FWD) domain (brucellosis, campylobacteriosis, congenital toxoplasmosis, echinococcosis, listeriosis, salmonellosis, Shiga toxin‐producing E. coli infection, trichinellosis and yersiniosis), the Emerging and Vectorborne Diseases (EVD) domain (Q fever, rabies, tularaemia and West Nile virus (WNV) infection) and the tuberculosis (TB) domain (TB due to Mycobacterium bovis and M. caprae) at ECDC. Please note, as explained above, that the numbers presented in the report may differ from those in national reports due to differences in the case definitions used at EU and at national level, or due to differing dates of data submission and extraction. The latter may also result in some divergence in the case numbers presented in the different ECDC reports.
TESSy is a software platform that has been operational since April 2008 and in which data on 56 diseases and special health issues are collected. Both aggregated and case‐based data were reported to TESSy by Member States and other European countries. Although aggregated data did not include individual case‐based information, both reporting formats were included when possible to calculate the number of cases and country‐specific case notification rates. Human data used in the report were extracted from TESSy as of 15 July 2021 for EVD, as of 28 July 2021 for FWD and as of 30 September 2021 for TB due to M. bovis and M. caprae. The denominators used for calculating notification rates were the human population data from Eurostat’s 1 January 2021 update.
Data on human zoonoses cases were received from 27 MS and from two non‐MS (Iceland and Norway). Switzerland reported its data on human cases directly to EFSA. These aggregated data also include data from Liechtenstein. Since the United Kingdom became a third country on 1 February 2020, human data from the United Kingdom were not collected by ECDC for 2020.
The interpretation of data should consider data quality issues and the differences between MS surveillance systems; comparisons between countries should therefore be undertaken with caution.
Data collection on food, animals, feed and foodborne outbreaks
For the year 2020, 27 MS submitted data and national zoonoses reports on monitoring results in food, animals, feed and foodborne outbreaks. In addition, data and reports were submitted by four non‐MS and European Free Trade Association (EFTA) countries: Iceland, Norway, Switzerland and Liechtenstein. 6 For some food, animal and feed matrices, and for foodborne outbreaks, EFSA received data and reports from the following pre‐accession countries: Albania (no foodborne outbreak data), Bosnia and Herzegovina, North Macedonia, Montenegro and Serbia, as well as from the United Kingdom, which became a third country on 1 February 2020. Food, animal, feed and foodborne outbreak data for 2020 received by EFSA from the United Kingdom in the framework of Zoonoses Directive 2003/99/EC were excluded from EU 2020 statistics.
Data were submitted electronically to the EFSA zoonoses database, through EFSA’s Data Collection Framework (DCF). MS could also update data from previous years (before 2020).
The deadline for data submission was 31 May 2021. Two data validation procedures were implemented through 11 June 2021 and 15 July 2021, respectively. Validated data on food, animals and feed used in the report were extracted from the EFSA zoonoses database on 2 August 2021.
The draft EUOHZ report was sent to the MS for consultation on 13 October 2021 and comments were collected by 26 October 2021. The utmost effort was made to incorporate comments and data amendments within the available time frame. The report was finalised by 15 November 2021 and published online by EFSA and ECDC on 9 December 2021.
A detailed description of the terms used in the report is available in EFSA’s manuals for reporting on zoonoses (EFSA, 2021a,b,c).
The national zoonoses’ reports submitted in accordance with Directive 2003/99/EC are published on the EFSA website together with the EU One Health Zoonoses Report. They are available online at http://www.efsa.europa.eu/en/biological‐hazards‐data/reports.
Data analyses and presentation
Comparability and quality of data
Humans
For data on human infections, please note that the numbers presented in this report may differ from national zoonoses reports due to differences in case definitions used at EU and national level or because of differing dates of data submission and extraction. Results are not directly comparable among the MS.
Food–animals–feed and foodborne outbreaks
For data on food, animals and feed, please note that the numbers presented in this report may differ from national zoonoses reports due to differing dates of data submission and extraction.
The data obtained by the EFSA DCF can vary according to the level of data quality and harmonisation. Therefore, the type of data analyses suggested by EFSA for each zoonosis and matrix (food, animals, feed or foodborne outbreaks) strongly depended on this level of harmonisation and can either be a descriptive summary of submitted data, the following‐up of trends (trend watching) or the (quantitative) analysis of trends. Data analyses were carried out according to (Table 1), as adapted from Boelaert et al. (2016). Food, animals, feed and foodborne outbreak data can be classified into three categories according to the zoonotic agent monitored and the design of the monitoring or surveillance carried out. It follows that the type of data analyses that can be implemented is conditioned by these three distinct categories.
Table 1.
Categorisation of the data used in the EU One Health Zoonoses 2020 Summary Report (adapted from Boelaert et al., 2016)
| Category | Type of analysis | Type/comparability between MS | Examples | |
|---|---|---|---|---|
| I |
Descriptive summaries at the national level and EU level EU trend watching (trend monitoring) Spatial and temporal trend analyses at the EU level |
|
Programmed harmonised monitoring or surveillance Comparable between MS Results at the EU level are interpretable |
Salmonella national control programmes in poultry, bovine tuberculosis, bovine and small ruminant brucellosis, Trichinella in pigs at slaughterhouse |
| II |
Descriptive summaries at national level and EU level EU trend watching (trend monitoring) No EU trend analysis |
|
Monitoring or surveillance not fully harmonised Not fully comparable between MS Caution needed when interpreting results at the EU level |
foodborne outbreak data; Official samplings related to process hygiene criteria for carcases at the slaughterhouse for Salmonella and Campylobacter and to food safety criteria for Campylobacter, L. monocytogenes, Salmonella and STEC in the context of Regulation (EC) No 2073/2005; Rabies monitoring |
| III |
Descriptive summaries at national level and EU level No EU trend watching (trend monitoring) No EU trend analysis |

|
Non‐harmonised monitoring or surveillance data with no (harmonised) reporting requirements Not comparable between MS; extreme caution needed when interpreting results at the EU level |
Campylobacter, Yersinia, Q fever, Francisella tularensis, West Nile virus, Taenia spp., Toxoplasma and other zoonoses |


Rationale of the table of contents
In keeping with the rationale of zoonoses listing in Annex I of Directive 2003/99/EC, for the mandatory reporting of foodborne outbreaks and of the above‐mentioned categorisation of food, animal and feed data (Table 1), the following table of contents has been adopted for the 2020 EUOHZ report.
Zoonoses and zoonotic agents included in compulsory annual monitoring (Directive 2003/99/EC List A)
-
1
Campylobacter
-
2
Salmonella
-
3
Listeria
-
4
Shiga toxin‐producing Escherichia coli
-
5
Tuberculosis due to Mycobacterium bovis and Mycobacterium caprae
-
6
Brucella
-
7
Trichinella
-
8
Echinococcus
foodborne and waterborne outbreaks (according to Directive 2003/99/EC).
Zoonoses and zoonotic agents monitored according to the epidemiological situation (Directive 2003/99/EC List B)
-
1
Yersinia
-
2
Toxoplasma gondii
-
3
Rabies
-
4
Q fever
-
5
West Nile virus
-
6
Tularaemia
-
7
Other zoonoses and zoonotic agents
Microbiological contaminants subject to food safety criteria (Regulation (EC) No 2073/2005).
Chapter sections
The EU One Health Zoonoses 2020 Summary Report presents a harmonised structure for each chapter, starting with key facts. In addition, there is a section on ‘Monitoring and surveillance’ in the EU for the specific disease or for foodborne outbreaks. A ‘Results’ section summarises the major findings of 2020 as regards trends and sources. A summary table displaying the data for the last 5 years (2016–2020) for human cases and for major animal and food matrices is also presented. Each chapter also contains a ‘Discussion’ section and ends with a list of ‘Related projects and links’ with useful information for the specific disease. For foodborne and waterborne outbreaks, the main findings are presented and discussed in a joint ‘Results and discussion’ section and key messages are summarised in the ‘Conclusions’ section.
For each chapter, overview tables present the data reported by each reporting country. However, for the tables summarising MS‐specific results and providing EU‐level results, unless stated otherwise, data from industry own‐check programmes, hazard analysis and critical control point (HACCP) sampling, as well as data from suspect sampling, selective sampling and outbreak or clinical investigations are excluded. Moreover, regional data reported by countries without statistics at the national level were also excluded from these summary tables.
Data analyses
Statistical trend analyses in humans were carried out to evaluate the significance of temporal variations in the EU and the specifications of these analyses are explained in each separate chapter. The number of confirmed cases for the EU by month is presented as a trend figure. All countries that consistently reported cases – or reported zero cases over the whole reporting period – were included. The trend figure also shows a centred 12‐month moving average over the last 5 years, illustrating the overall trend by smoothing seasonal and random variations. Moreover, the same trend analysis was carried out separately for each country (MS and non‐MS countries). Analyses of data from humans were carried out for confirmed EU cases only, except for WNV infection, for which total cases (i.e., probable and confirmed cases) were considered.
The notification rates were calculated taking into account the coverage of the human population under surveillance (percentage of national coverage). For countries where surveillance did not apply to the whole population, estimated coverage – if provided – was used to calculate the country‐specific rate. Cases and populations of those countries not providing information on national coverage or reporting incomplete data were excluded from the EU notification rate.
Environmental Systems Research Institute (ESRI) ArcMap 10.5.1 was used to map the data. Choropleth maps with graduated colours over five class scales of values, according to the natural breaks function proposed by the ArcGIS software, were used to map the proportion of positive sample units across the EU and other reporting countries. In the maps included in the present report, EU MS were represented with a blue label, whereas all the non‐EU MS (including EFTA countries: Iceland, Norway, Switzerland and Liechtenstein; pre‐accession countries: Albania, Bosnia and Herzegovina, North Macedonia, Montenegro and Serbia; and the United Kingdom, which on 1 February 2020 became a third country) were represented with an orange label.
Statistical trend analysis of foodborne outbreaks was performed to evaluate the significance of temporal variations at the single MS level over the 2010–2020 period, as described in the foodborne outbreaks chapter.
All undisplayed summary tables and figures used to produce this report are published as supporting information and are available as downloadable files from the EFSA knowledge junction at the Zenodo general‐purpose open‐access repository at https://doi.org/10.5281/zenodo.5682809. All validated country‐specific data on food, animals, feed and foodborne outbreaks are also available at the above‐mentioned URL.
Summary of human zoonoses data for 2020
The numbers of confirmed human cases of the zoonoses presented in this report are summarised in Figure 1. In 2020, campylobacteriosis was the most commonly reported zoonosis, as it has been since 2005. It represented more than 60% of all the reported cases in 2020. It was followed by other bacterial diseases, with salmonellosis, yersiniosis and STEC infections being the most frequently reported. The severity of the diseases was descriptively analysed based on hospitalisations and the outcomes of reported cases (Table 2). Based on severity data, listeriosis and West Nile virus infection were the two most severe diseases with the highest case fatality and hospitalisation rates. Almost all confirmed cases with available hospitalisation data for these two diseases were hospitalised. About one out of every seven, and one out of every eight, confirmed listeriosis and WNV cases with known data were fatal.
Figure 1.

- Note: The total number of confirmed cases is indicated in parentheses at the end of each bar. (a): Regarding West Nile virus infection, the total number of cases was used (includes probable and confirmed cases).
Table 2.
Reported hospitalisations and case fatalities due to zoonoses in confirmed human cases in the EU, 2020
| Disease | Number of confirmed human cases | Hospitalisation | Deaths | ||||||||
|---|---|---|---|---|---|---|---|---|---|---|---|
| Status available (N) | Status available (%) | Number of reporting MS b | Reported hospitalised cases | Proportion hospitalised (%) | Outcome available (N) | Outcome available (%) | Number of reporting MS b | Reported deaths | Case fatality (%) | ||
| Campylobacteriosis | 120,946 | 41,037 | 33.9 | 14 | 8,605 | 21.0 | 83,744 | 69.2 | 15 | 45 | 0.05 |
| Salmonellosis | 52,702 | 20,562 | 39.0 | 13 | 6,149 | 29.9 | 30,355 | 57.6 | 15 | 57 | 0.19 |
| Yersiniosis | 5,668 | 1,214 | 21.4 | 12 | 353 | 29.1 | 3,072 | 54.2 | 13 | 2 | 0.07 |
| STEC infections | 4,446 | 1,593 | 35.8 | 16 | 652 | 40.9 | 3,094 | 69.6 | 19 | 13 | 0.42 |
| Listeriosis | 1,876 | 803 | 42.8 | 18 | 780 | 97.1 | 1,283 | 68.4 | 18 | 167 | 13.0 |
| Tularaemia | 641 | 123 | 19.2 | 9 | 64 | 52.0 | 200 | 31.2 | 10 | 0 | 0 |
| Echinococcosis | 488 | 73 | 15.0 | 12 | 44 | 60.3 | 204 | 41.8 | 14 | 0 | 0 |
| Q fever | 523 | NA | NA | NA | NA | NA | 235 | 44.9 | 14 | 5 | 2.1 |
| West Nile virus infection a | 322 | 239 | 74.2 | 8 | 219 | 91.6 | 322 | 100 | 8 | 39 | 12.1 |
| Brucellosis | 128 | 56 | 43.8 | 8 | 36 | 64.3 | 55 | 43.0 | 9 | 2 | 3.6 |
| Trichinellosis | 117 | 22 | 18.8 | 5 | 16 | 72.7 | 24 | 20.5 | 6 | 0 | 0 |
| Rabies | 0 | NA | NA | NA | NA | NA | NA | NA | NA | NA | NA |
MS: Member State(s); NA: Not applicable, as information is not collected for this disease.
Locally acquired infections – for West Nile virus infection, the total number of cases was used (includes probable and confirmed cases).
Not all countries observed cases for all diseases.
Comparison of human zoonoses data for 2019–2020
According to an MS survey conducted to interpret the possible impact of the COVID‐19 pandemic on surveillance activities and the reporting of FWD data (Table 3), in humans, for 10 out of 22 MS that provided answers to the survey, the pandemic impacted their surveillance/monitoring systems, whereas for seven MS, there were no reported effects due to the pandemic. The comparability of FWD data for 2020 and 2019 was considered low–medium for 15 MS, whereas for only three MS were the human data reported over the last 2 years considered comparable.
The comparison of data from 2020 and 2019 was influenced by the pandemic and by the withdrawal of the United Kingdom from the EU. In order to estimate the impact of both of these events on reported data, the absolute and relative difference between the number of cases and the notification rate reported in the EU for 2020 compared with 2019 for each disease was estimated (Table 4). For all zoonoses except trichinellosis and yersiniosis, there was a reduction in the notification rates (*100,000 population) in 2020 as compared with 2019. The relative fall in notification rates in the EU varied from −52.6% for brucellosis to −7.1% for listeriosis. For trichinellosis and yersiniosis, there was an increase of 39.1% and 6.0%, respectively, in the 2020 EU notification rate as compared with 2019. For each disease, the 2020/2019 relative difference in EU notification rates was also calculated based on EU 27 data only (i.e. excluding data reported by the United Kingdom for 2019) (Table 4) in order to provide evidence of the effect of the withdrawal of the United Kingdom from the EU.
Table 4.
2020/2019 absolute difference in the number of confirmed human cases by zoonosis and absolute and relative (%) difference in notification rates per 100,000 population for zoonoses reported in the EU, 2020
| Zoonosis | EU level a | Cases (N) | Rate | |||
|---|---|---|---|---|---|---|
| 2020 | 2020–2019 difference | 2020 | 2020–2019 difference | |||
| Absolute difference (%) | Relative difference (%) | |||||
| Campylobacteriosis | EU | 120,946 | –99,693 | 40.3 | –20.3 | –33.4 |
| EU‐27 | –40,975 | –13.7 | –25.4 | |||
| Salmonellosis | EU | 52,702 | –35,206 | 13.7 | –5.8 | –29.7 |
| EU‐27 | –25,488 | –6.7 | –32.8 | |||
| Yersiniosis | EU | 5,668 | –1,299 | 1.8 | 0.10 | 6.0 |
| EU‐27 | –1,136 | –0.27 | –13.4 | |||
| STEC infections | EU | 4,446 | –3,355 | 1.5 | –0.43 | –22.4 |
| EU‐27 | –1,768 | –0.33 | –18.2 | |||
| Listeriosis | EU | 1,876 | –745 | 0.42 | –0.03 | –7.1 |
| EU‐27 | –591 | –0.07 | –14.2 | |||
| Tularaemia | EU | 641 | –639 | 0.15 | –0.11 | –42.5 |
| EU‐27 | –639 | –0.15 | –50.0 | |||
| Q fever | EU | 523 | –428 | 0.12 | –0.07 | –36.7 |
| EU‐27 | –419 | –0.10 | –44.6 | |||
| Echinococcosis | EU | 488 | –278 | 0.14 | –0.03 | –16.2 |
| EU‐27 | –275 | –0.06 | –28.4 | |||
| West Nile virus b | EU | 322 | –68 | 0.07 | –0.01 | –12.9 |
| EU‐27 | –68 | –0.02 | –24.4 | |||
| Brucellosis | EU | 128 | –182 | 0.03 | –0.03 | –52.6 |
| EU‐27 | –158 | –0.04 | –55.3 | |||
| Trichinellosis | EU | 117 | 20 | 0.03 | 0.01 | 39.1 |
| EU‐27 | 20 | < 0.01 | 20.4 | |||
| Tuberculosis | EU | 88 | 64 | 0.02 | –0.01 | –32.0 |
| EU‐27 | 29 | –0.01 | –24.9 | |||
In 2019, data from the United Kingdom were collected because the UK was an EU MS, but since 1 February 2020, it has become a third country. To calculate the 2020/2019 difference, data from the United Kingdom for 2019 were included in this ‘EU’ calculation, whereas human data from the United Kingdom were not collected by ECDC for 2020 (‘EU‐27’).
For West Nile virus infection, the total number of cases was used (includes probable and confirmed cases).
The relative difference in human notification rates at the EU‐27 level allows for a more precise assessment of the impact of the COVID‐19 pandemic on zoonoses in the EU (Table 4). A fall in notification rates (≥ 30% relative decrease) was reported for brucellosis, tularaemia, Q fever and salmonellosis. For echinococcosis, campylobacteriosis, WNV infections, tuberculosis, STEC infections, listeriosis and yersiniosis, the drop was less relevant. For trichinellosis, an increase in the relative difference between the 2020 and 2019 EU (27) notification rates was observed.
According to the feedback provided by MS along with the survey and the evidence deriving from the scientific literature (Haldane et al., 2021; Müller et al., 2021; Ullrich et al., 2021), the COVID‐19 pandemic might have caused a drop in reported human cases and notification rates for almost all zoonotic diseases. Various factors, in fact, might have had an effect: national health care resilience (health workforce, laboratory and diagnostic capability, access to hospitals and medical assistance), the shutdown of domestic and international travel, restrictions on sporting and recreational/social events, the closing of restaurants and catering facilities (i.e. schools, workplaces), quarantine, lockdown and other non‐pharmaceutical mitigation measures (face masking, hand washing/sanitisation, physical distancing, restricted movement and social gatherings).
Instead, looking at the relative difference in notification rates in the EU (2019) and EU‐27 (2020), the withdrawal of the United Kingdom from the EU seems to have had little impact on salmonellosis and tuberculosis. For campylobacteriosis and STEC infection, the withdrawal of the United Kingdom from the EU seems to have had a positive impact in terms of reduction of the EU notification rate, probably related to a recurring high number of cases reported by the United Kingdom relative to population size. In contrast, for the remaining diseases, the withdrawal of the United Kingdom from the EU seems to have had a negative impact because an increase in the EU notification rate was noted, likely due to the low number of cases reported by the United Kingdom relative to population size.
Zoonoses included in compulsory annual monitoring (Directive 2003/99 List A)
1. Campylobacter
Tables and figures that are not presented in this chapter are published as supporting information to this report and are available as downloadable files from the EFSA Knowledge Junction on Zenodo at https://doi.org/10.5281/zenodo.5682809. Summary statistics of human surveillance data with downloadable files are retrievable using ECDC’s Surveillance Atlas of Infectious Diseases at http://atlas.ecdc.europa.eu/public/index.aspx

1.1. Key facts
-
•
Campylobacteriosis is the most commonly reported foodborne gastrointestinal infection in humans in the EU and has been so since 2005.
-
•
In 2020, Campylobacter reporting recorded the lowest number of human cases since campylobacteriosis surveillance began in 2007, owing to the impacts of the withdrawal of the United Kingdom from the EU and the COVID‐19 pandemic.
-
•
In 2020, the number of confirmed cases of human campylobacteriosis totalled 120,946, corresponding to an EU notification rate of 40.3 per 100,000 population. This is a decrease of 33.4% and 25.4% compared with the rate in 2019 (60.6 and 54.0 per 100,000 population) with and without the 2019 data from the United Kingdom, respectively.
-
•
A decrease in cases was observed in 2020, probably due to the COVID‐19 pandemic. However, the overall campylobacteriosis trend in 2016–2020 showed no statistically significant increase or decrease.
-
•
In most of the cases (98.5%), where the origin was known, the infection was acquired in the EU.
-
•
In 2020, Campylobacter was the fourth most frequent cause of foodborne outbreaks reported by 17 MS at EU level. In total, 317 outbreaks caused by Campylobacter were reported to EFSA, including 1,319 cases of illness, 112 hospitalisations and no deaths. Eleven outbreaks were reported with strong evidence and 306 with weak evidence. The most common food vehicles for the strong‐evidence campylobacteriosis foodborne outbreaks were ‘broiler meat’ and ‘raw milk’, as in previous years.
-
•
Twenty‐one MS reported data in the context of the Campylobacter process hygiene criterion, set out in Regulation (EC) No 2073/2005. In particular, 12 MS reported official controls from 6,384 neck skin samples. Of the results reported, 38.7% were Campylobacter‐positive, and 17.8% exceeded the limit of 1,000 colony forming unit (CFU)/g. Seventeen MS reported monitoring data based on sampling results collected from food business operators. A total of 46,259 test results from neck skin samples were reported. Of the results reported, 31.3% were Campylobacter‐positive, whereas 17.6% exceeded the limit of 1,000 CFU/g and this percentage was comparable with the results from official controls. Eight MS reported results from both samplers and showed 42.1% and 40.1% Campylobacter‐positive samples from official and food business operators, respectively. Overall for these eight MS, the number of samples exceeding the limit was significantly higher in official samples (16.6%) than those based on own‐checks (8.9%).
-
•
In 2020, 3,202 ‘ready‐to‐eat’ and 13,240 ‘non ready‐to‐eat’ results from food sampling unit were reported by seven and 16 MS, respectively. In the ‘ready‐to‐eat’ category, four Campylobacter‐positive sampling units were detected: two from ‘raw milk’, one from ‘meat products’ and one from ‘fruit, vegetables and juices’. In the ‘non ready‐to‐eat’ food category, 2,684 (20.3%) Campylobacter‐positive sampling unit was reported. The food category with the highest level of contamination was ‘meat and meat products’ with 25.2% positive units. Overall, Campylobacter was isolated from all fresh meat categories, with meat from broilers and turkeys showing the highest percentage of Campylobacter‐positive samples, 30.5% and 21.5%, respectively.
-
•
In 2020, Campylobacter spp. was detected by 17 MS and four non‐MS in more than 50 different animal categories. However, the vast majority of units tested (N = 13,625) were collected from broilers, where the observed proportion of positives was 24.5%. Although fewer samples were reported by a small number of countries for turkeys and pigs alone, these categories had the highest proportion of positives, 62.1% and 58.5%, respectively.
1.2. Surveillance and monitoring of Campylobacter in the EU
1.2.1. Humans
Notification of campylobacteriosis is mandatory in 22 EU MS, as well as in Iceland, Norway and Switzerland. In five MS, notification is based on a voluntary system (Belgium, France, Greece, Italy and the Netherlands). Greece started to report campylobacteriosis data in 2018. The surveillance systems for campylobacteriosis cover the whole population in all MS except for the four countries of France, Italy, the Netherlands and Spain. The estimated coverage of the surveillance system is 20% in France and 58% in the Netherlands. These estimated proportions of population coverage were used in the calculation of notification rates for these two MS. No estimates of population coverage in Italy and Spain were provided, so notification rates were not calculated for these two MS. The data for Switzerland include data from Liechtenstein and were reported to EFSA.
All countries reported case‐based data except Belgium, Bulgaria and Greece, which reported aggregated data. Both reporting formats were included in order to calculate the annual numbers of cases and the notification rates.
On 1 February 2020, the United Kingdom became a third country, whereas before it was an EU MS. Human data from the United Kingdom were not collected by the ECDC for 2020.
The diagnosis of human infection is generally based on cultures from human stool samples, using both culture and non‐culture methods (polymerase chain reaction (PCR)) for confirmation. Biochemical tests or molecular methods are used to determine the species of isolate reported to the National Public Health Reference Laboratories (NPHRL).
Almost all countries have noted a drop in the number of reported campylobacteriosis cases compared with previous years. The COVID‐19 pandemic had an impact on both surveillance (including diagnosis) and reporting. Conversely, France and Luxembourg observed an increase in the number of reported cases compared with 2019. France reported a higher number of cases in the summer when control measures against COVID‐19 were probably less severe since there was no lockdown during that period. In March 2020, Luxembourg introduced an electronic laboratory notification system and, despite the pandemic, campylobacteriosis notification has increased as expected.
1.2.2. Food and animals
Campylobacter is monitored along the food chain during the primary production stage (farm animals), during harvest/slaughter and processing and at the retail stage.
Campylobacter data in the context of Regulation (EC) No 2073/2005
A regulatory limit (microbiological process hygiene criterion (PHC)) of 1,000 CFU/g of Campylobacter on the neck skins of chilled broiler carcases was set by Regulation (EC) No 2073/2005 7 (point 2.1.9 of Chapter 2 of Annex I). This limit applies to a set of 50 pooled samples from 10 consecutive sampling sessions. As of 2020, a maximum number of 15 samples with values exceeding this limit are considered as acceptable. This criterion aims to stimulate action to lower Campylobacter counts on broiler carcases and to reduce the number of human campylobacteriosis cases caused by the consumption or handling of contaminated chicken/broiler meat. The PHC has been in force since 1 January 2018. Food business operators (FBOp) are required to use the criterion to validate and verify their food safety management procedures based on HACCP principles and Good Manufacturing Practices (GMP). FBOp must carry out corrective action if the criterion target is exceeded. Official samplings taken by the Competent Authorities (CA) serve to audit FBOp activities and to ensure that FBOp comply with regulatory requirements. On 14 December 2019, the Commission Implementing Regulation (EU) 2019/627 8 was introduced to harmonise sampling procedures for official controls. The results obtained from official controls, whose reporting is mandatory, allow for improved trend watching and trend analyses (Table 1). This legislation requires the CA to verify whether the FBOp is correctly implementing and checking the PHC on broiler carcases by choosing one of two approaches: implementing ad hoc official sampling 9 or collecting all the information from the samples taken by the FBOp relating to the total number of samples tested in order to establish the number of Campylobacter‐positive samples with a bacterial load of over 1,000 CFU/g in accordance with Article 5 of Regulation (EC) No 2073/2005.
Other monitoring data for food and animals
Campylobacter monitoring data at slaughter obtained from poultry caeca as part of annual antimicrobial resistance monitoring are collected using a randomised sampling scheme in order to provide data that are more harmonised.
Other Campylobacter monitoring data from food and animals submitted to EFSA in compliance with Chapter II ‘Monitoring of zoonoses and zoonotic agents’ of the Zoonoses Directive 2003/99/EC 10 are collected without a harmonised procedure. These data allow descriptive summaries at EU level, but they do not support EU‐level trend analyses and trend watching (Table 1).
In 2020, general data on food and animals reported to EFSA by MS and non‐MS were mainly from official sampling, industry sampling HACCP and own‐checks, as part of national monitoring and surveillance and/or organised surveys. In addition, for animal data, other reported samples were obtained from clinical investigations by private veterinarians and industry (e.g. artificial insemination centres).
The occurrence of Campylobacter reported in the main food categories for the year 2020 and for the 4‐year period of 2016–2019 was descriptively summarised, making a distinction between RTE and non‐RTE food. Data sets were extracted using the strategy of ‘objective sampling’, meaning that the reporting MS collected the samples as part of a planned strategy based on the selection of random samples that are statistically representative of the population to be analysed.
On 1 February 2020, the United Kingdom became a third country, whereas before it was an EU MS. Food, animal and feed data from the United Kingdom were collected by EFSA for 2020 as part of Zoonoses Directive 2003/99/EC.
The detection of Campylobacter in food and animals is generally based on culture and confirmation. Species identification is carried out using biochemical and molecular methods (PCR based), as well as matrix‐assisted laser desorption/ionisation time‐of flight mass spectrometry (MALDI‐TOF MS).
1.2.3. foodborne outbreaks of campylobacteriosis
The reporting of foodborne campylobacteriosis disease outbreaks in humans is mandatory, according to Zoonoses Directive 2003/99/EC.
1.3. Data analyses
Comparison between Competent Authority and Food Business Operator sampling results
A comparison was made of Campylobacter results exceeding 1,000 CFU/g from the neck skins of broiler carcases after chilling obtained by the CA and FBOp as part of the Campylobacter PHC in compliance with Regulation (EC) No 2073/2005. The significance of any differences was verified by the one‐tailed Fisher’s exact probability test, in cases where the expected values of any of the cells in a contingency table were below 5; otherwise, the one‐tailed z test was used. The official control sampling results by the CA and the own‐check results by the FBOp were expressed as prevalence ratios with an exact binomial confidence interval of 95%. A p‐value of < 0.10 (Clayton and Hills, 2013) was considered as significant in order to highlight every possible indication of differences between the data collected by the FBOp and the CA. R software (www.r‐project.org, version 4.0.5) was used to conduct the above analyses.
1.4. Results
1.4.1. Overview of key statistics, EU, 2016–2020
Table 5 summarises EU statistics on human campylobacteriosis, and on the occurrence and prevalence of Campylobacter in food and animals, respectively, during 2016–2020. In 2020, a substantial decrease was observed in notified human cases, caused in part by the impact of the COVID‐19 pandemic and the withdrawal of the United Kingdom from the EU. The food data of interest in this report were classified into two major categories: ‘meat and meat products’ and ‘milk and milk products’ and aggregated by year to obtain an annual overview of the volume of data submitted. The number of sampling units reported for the years 2019 and 2020 for ‘meat and meat products’ increased sharply compared with the previous years, which is likely the result of the Commission Implementing Regulation (EU) 2019/627 establishing compulsory reporting of Campylobacter PHC monitoring data (see above).
Table 5.
Summary of Campylobacter statistics related to humans and major food categories, EU, 2016–2020
| 2020 | 2019 a | 2018 a | 2017 a | 2016 a | Data source | |
|---|---|---|---|---|---|---|
| Humans | ||||||
| Total number of confirmed cases | 120,946 | 220,639 | 246,570 | 246,194 | 246,980 | ECDC |
| Total number of confirmed cases/100,000 population (notification rates) | 40.3 | 60.6 | 66.0 | 68.2 | 69.6 | ECDC |
| Number of reporting MS | 27 | 28 | 28 | 27 | 27 | ECDC |
| Infection acquired in the EU | 70,769 | 109,937 | 116,246 | 122,280 | 122,819 | ECDC |
| Infection acquired outside the EU | 1,586 | 6,514 | 7,685 | 6,583 | 5,966 | ECDC |
| Unknown travel status or unknown country of infection | 48,591 | 104,188 | 122,639 | 117,331 | 118,195 | ECDC |
| Number of foodborne outbreak‐related cases | 1,319 | 1,254 | 2,365 | 3,608 | 4,645 | EFSA |
| Total number of foodborne outbreaks | 317 | 319 | 537 | 395 | 474 | EFSA |
| Food b | ||||||
| Meat and meat products c | ||||||
| Number of sampling units | 65,895 | 57,027 | 26,514 | 21,521 | 18,253 | EFSA |
| Number of reporting MS | 25 | 25 | 26 | 22 | 21 | EFSA |
| Milk and milk products d | ||||||
| Number of sampling units | 2,145 | 2,749 | 3,227 | 2,317 | 2,062 | EFSA |
| Number of reporting MS | 11 | 11 | 13 | 13 | 11 | EFSA |
ECDC: European Centre for Disease Prevention and Control; EFSA: European Food Safety Authority.
When UK data were collected for the period 2016–2019, the UK was an EU MS, but on 1 February 2020, it became a third country. Data from the UK are taken into account for the years 2016–2019, but are not considered in the EU overview for 2020.
Summary statistics referring to MS were obtained by totalling all sampling units (single, batch, slaughter batch), sampling stages (farm, packing centre, processing plant, cutting plant, slaughterhouse, catering, hospital or medical care facility, restaurant or cafe or pub or bar or hotel or catering service, retail, wholesale, border control posts, school or kindergarten, unspecified), sampling strategies (census, convenience sampling, selective sampling, objective sampling and unspecified) and samplers (official sampling, official and industry sampling, private sampling, unspecified).
‘Meat and meat products’ refer to carcases and fresh meat/ready‐to‐eat (RTE), cooked and fermented products.
‘Milk and milk products’ refer to raw and pasteurised milk and all dairy products including cheeses.
A more detailed description of foodborne outbreak statistics can be found in the chapter on foodborne outbreaks.
1.4.2. Human campylobacteriosis
In 2020, 120,946 confirmed cases of human campylobacteriosis were reported by the 27 EU MS, corresponding to an EU notification rate of 40.3 cases per 100,000 population (Table 6). This is a decrease of 33.4% and 25.4% compared with the rate in 2019 (60.6 and 54.0 per 100,000 population) with and without data from the United Kingdom, respectively. The highest country‐specific notification rates in 2020 were observed in Czechia (163.8 cases per 100,000), Luxembourg (116.4), Slovakia (90.2) and Denmark (64.3). The lowest rates in 2020 were observed in Poland, Romania, Bulgaria, Cyprus, Greece, Latvia and Portugal (≤ 7.7 per 100,000) (Table 6).
Table 6.
Reported human cases of campylobacteriosis and notification rates per 100,000 population in EU‐MS and non‐MS countries, by country and by year, 2016–2020
| Country | 2020 | 2019 | 2018 | 2017 | 2016 | |||||||
|---|---|---|---|---|---|---|---|---|---|---|---|---|
| National coverage a | Data format a | Confirmed cases and rates | Confirmed cases and rates | Confirmed cases and rates | Confirmed cases and rates | Confirmed cases and rates | ||||||
| Cases | Rate | Cases | Rate | Cases | Rate | Cases | Rate | Cases | Rate | |||
| Austria | Y | C | 5,406 | 60.7 | 6,572 | 74.2 | 7,999 | 90.7 | 7,204 | 82.1 | 7,083 | 81.4 |
| Belgium | Y | A | 5,595 | 48.6 | 7,337 | 64.0 | 8,086 | 70.9 | 8,649 | 76.2 | 10,055 | 88.9 |
| Bulgaria | Y | A | 127 | 1.8 | 229 | 3.3 | 191 | 2.7 | 195 | 2.7 | 202 | 2.8 |
| Croatia | Y | C | 1,054 | 26.0 | 1,722 | 42.2 | 1,965 | 47.9 | 1,686 | 40.6 | 1,524 | 36.4 |
| Cyprus | Y | C | 18 | 2.0 | 21 | 2.4 | 26 | 3.0 | 20 | 2.3 | 21 | 2.5 |
| Czechia | Y | C | 17,517 | 163.8 | 22,894 | 215.0 | 22,895 | 215.8 | 24,326 | 230.0 | 24,084 | 228.2 |
| Denmark | Y | C | 3,742 | 64.3 | 5,402 | 93.0 | 4,559 | 78.9 | 4,255 | 74.0 | 4,712 | 82.6 |
| Estonia | Y | C | 265 | 19.9 | 347 | 26.2 | 411 | 31.2 | 285 | 21.7 | 298 | 22.6 |
| Finland | Y | C | 2,074 | 37.5 | 4,382 | 79.4 | 5,099 | 92.5 | 4,289 | 77.9 | 4,637 | 84.5 |
| France b | N | C | 7,920 | 58.8 | 7,712 | 57.4 | 7,491 | 55.9 | 6,579 | 49.2 | 6,698 | 50.3 |
| Germany | Y | C | 46,379 | 55.8 | 61,277 | 73.8 | 67,585 | 81.6 | 69,251 | 83.9 | 73,736 | 89.7 |
| Greece | Y | A | 218 | 2.0 | 366 | 3.4 | 357 | 3.3 | – | – | – | – |
| Hungary | Y | C | 4,461 | 45.7 | 6,400 | 65.5 | 7,117 | 72.8 | 7,807 | 79.7 | 8,556 | 87.0 |
| Ireland | Y | C | 2,419 | 48.7 | 2,776 | 56.6 | 3,044 | 63.0 | 2,779 | 58.1 | 2,511 | 53.1 |
| Italy c | N | C | 1,418 | – | 1,633 | – | 1,356 | – | 1,060 | – | 1,057 | – |
| Latvia | Y | C | 104 | 5.5 | 133 | 6.9 | 87 | 4.5 | 59 | 3.0 | 90 | 4.6 |
| Lithuania | Y | C | 1,183 | 42.3 | 1,221 | 43.7 | 919 | 32.7 | 990 | 34.8 | 1,225 | 42.4 |
| Luxembourg | Y | C | 729 | 116.4 | 271 | 44.1 | 625 | 103.8 | 613 | 103.8 | 518 | 89.9 |
| Malta | Y | C | 206 | 40.0 | 278 | 56.3 | 333 | 70.0 | 231 | 50.2 | 212 | 47.1 |
| Netherlands d | N | C | 2,549 | 25.2 | 3,415 | 34.1 | 3,091 | 34.6 | 2,890 | 32.5 | 3,383 | 38.3 |
| Poland | Y | C | 414 | 1.1 | 715 | 1.9 | 719 | 1.9 | 874 | 2.3 | 773 | 2.0 |
| Portugal | Y | C | 790 | 7.7 | 887 | 8.6 | 610 | 5.9 | 596 | 5.8 | 359 | 3.5 |
| Romania | Y | C | 300 | 1.6 | 805 | 4.1 | 573 | 2.9 | 467 | 2.4 | 517 | 2.6 |
| Slovakia | Y | C | 4,921 | 90.2 | 7,690 | 141.1 | 8,339 | 153.2 | 6,946 | 127.8 | 7,623 | 140.5 |
| Slovenia | Y | C | 811 | 38.7 | 1,085 | 52.1 | 1,305 | 63.1 | 1,408 | 68.2 | 1,642 | 79.5 |
| Spain(c)(e) | N | C | 6,891 | – | 9,658 | – | 18,410 | – | 18,860 | – | 15,542 | – |
| Sweden | Y | C | 3,435 | 33.3 | 6,693 | 65.4 | 8,132 | 80.4 | 10,608 | 106.1 | 11,021 | 111.9 |
| EU Total 27 | – | – | 120,946 | 40.3 | 161,921 | 54.0 | 181,324 | 58.1 | 182,927 | 61.0 | 188,079 | 64.4 |
| United Kingdom | – | – | – | – | 58,718 | 88.1 | 65,246 | 98.4 | 63,267 | 96.1 | 58,901 | 90.1 |
| EU Total f | – | – | 120,946 | 40.3 | 220,639 | 60.6 | 246,570 | 66.0 | 246,194 | 68.2 | 246,980 | 69.6 |
| Iceland | Y | C | 95 | 26.1 | 136 | 38.1 | 145 | 41.6 | 119 | 35.2 | 128 | 38.5 |
| Norway | Y | C | 2,422 | 45.1 | 4,154 | 78.0 | 3,668 | 69.3 | 3,883 | 73.8 | 2,317 | 44.5 |
| Switzerland g | Y | C | 6,200 | 71.7 | 7,223 | 84.2 | 7,675 | 90.1 | 7,221 | 85.4 | 7,984 | 95.4 |
–: Data not reported.
Y: yes; N: no; A: aggregated data; C: case‐based data.
Sentinel surveillance; notification rates calculated with an estimated coverage of 20%.
Sentinel surveillance; no information on the estimated coverage. So the notification rate cannot be estimated.
Sentinel surveillance; notification rates calculated with an estimated coverage of 52% in 2016–2018, 58% in 2019–2020.
Data not complete in 2020, rate not estimated.
Cases reported by the United Kingdom for the period 2016–2019 were also considered for this estimation (EU‐28). When UK data were collected for the period 2016–2019, the UK was an EU MS, but on 1 February 2020, it became a third country.
Switzerland provided data directly to EFSA. Human data for Switzerland include data from Liechtenstein.
For most (98.5%) of the reported campylobacteriosis cases of known origin, the infection was contracted in the EU (Table 5) as compared to 94.4% in 2019. Nineteen countries reported data on the importation of cases. The proportion of domestic cases with known data was over 95% in all countries except in the Nordic countries, which reported the highest proportion of travel‐associated cases: Finland (49.2%), Sweden (25.6%), Denmark (10.3%), Iceland (16.5%) and Norway (14.8%). A decrease of travel‐associated cases was observed in 2020 (3.7%) compared to 2019 (10.8%). Of the 2,676 travel‐associated cases among MS with a known country of infection, 1,090 cases (40.7%) were linked to travel within the EU, with most of the infections being acquired in Spain, Croatia, France and Austria (23.7%, 9.7%, 8.0% and 7.2%, respectively). Thailand, India, Morocco and Indonesia were the most frequently reported probable countries of infection outside the EU (29.5%, 8.3%, 7.8% and 6.1%, respectively). Campylobacteriosis cases were reported in all age groups, with the highest proportion of reported cases belonging to the youngest age group from 0 to 4 years (18,920 cases: 15.6%).
Between 2011 and 2020, the number of confirmed campylobacteriosis cases reported in the EU showed a clear seasonal trend, peaking in the summer months. Annual winter peaks were also observed in January from 2011 to 2020, although peak numbers were lower than those observed during the summer. A fall in cases was observed in 2020, particularly in March and April, probably due to the COVID‐19 pandemic. However, the overall campylobacteriosis trend in 2016–2020 showed no statistically significant increase or decrease (Figure 2). Finland, Hungary, Poland, Slovenia and Sweden reported significantly decreasing trends (p < 0.01) during the period 2016–2020. Latvia and Italy reported significantly increasing trends over the same period.
Figure 2.

- Source: Austria, Czechia, Denmark, Estonia, Finland, France, Germany, Hungary, Ireland, Italy, Latvia, Lithuania, Malta, the Netherlands, Poland, Romania, Slovakia, Slovenia and Sweden.
Information on hospitalisation status was provided for 33.9% of all campylobacteriosis cases by 14 MS in 2020. Of the cases with known hospitalisation status, 8,605 (21%) were hospitalised. The highest hospitalisation rates were reported in Latvia (93.3%), Poland (76.6%) and Cyprus (66.7%), where most of the reported cases were hospitalised. Outcomes were reported for 69.2% of all cases by 15 MS. Forty‐five deaths from campylobacteriosis were reported in 2020, resulting in an EU case fatality rate of 0.05%. The average percentage of fatal outcomes observed has remained unchanged over the past 5 years. Information on gender was provided for 120,514 confirmed cases in the EU: 54.1% were male and 45.9% female.
Campylobacter species information was provided by 20 MS for 64.7% of confirmed cases reported in the EU, an increase over 2019 (55.2%). Of these cases, 88.1% concerned Campylobacter jejuni, 10.6% Campylobacter coli, 0.16% Campylobacter fetus, 0.11% Campylobacter upsaliensis and 0.09% Campylobacter lari. Other Campylobacter species accounted for 0.94% of cases, but most of those cases were reported at national level as ‘C. jejuni /C. coli/C. lari not differentiated’. No information on species was provided by Belgium, Bulgaria, Denmark, Greece, Lithuania, Luxembourg and Sweden.
Human campylobacteriosis cases and cases associated with foodborne outbreaks
The reporting of foodborne campylobacteriosis outbreaks in humans is mandatory, in compliance with Zoonoses Directive 2003/99/EC, with data collected by reporting countries and submitted to EFSA. In TESSy, the cases reported are classified according to the EU case definition. All these cases visited a doctor and either confirmed by a laboratory test (confirmed cases) or not confirmed (probable case with classification based on the clinical symptoms and epidemiological link). Cases that never visited a doctor are not reported to TESSy. Moreover, there may be other missing probable cases in TESSy, as these data are not analysed or published and there is no incentive for reporting such cases. Information on which cases are linked to an outbreak and which are not is also not systematically collected. In practice, the cases reported to TESSy are considered mostly as sporadic cases In foodborne outbreaks, human cases are the people involved in the outbreak as defined by the investigators (case definition), and cases must be linked, or probably linked, to the same food source (Directive 2003/99/EC). This can include both people who are ill (whether or not confirmed microbiologically) and people with confirmed asymptomatic infections (EFSA, 2014).
Overall in 2020, 98.5% of the reported human campylobacteriosis cases, who acquired in the EU (70,769), were domestic infections (acquired within the home country) (Table 5). In 2020, Campylobacter was the fourth most frequently reported causative agent for foodborne outbreaks within the EU, with 317 outbreaks reported by 17 MS at EU level, 1,319 cases of illness, 112 hospitalisations (8.5%) and no deaths. If we compare the number of foodborne outbreak cases (1,319) reported to EFSA, with the number of cases of human campylobacteriosis acquired in the EU (70,769) including the proportion with unknown travel data (0.978 × 48,591), reported to the ECDC, it could be suggested that overall, within the EU, only 1.1% of human campylobacteriosis cases were reported through foodborne outbreak investigations in 2020.
C. jejuni and C. coli were identified in 142 and six outbreaks, respectively. However, most Campylobacter foodborne outbreaks were reported without species determination (169 outbreaks: 53.3%). Eleven campylobacteriosis outbreaks were reported with strong evidence and 306 with weak evidence. Of the former outbreaks, four were caused by ‘broiler meat’ and four by ‘milk’ (three by ‘raw milk’ and one by ‘pasteurised milk’). During the period 2011–2019, these were also the food vehicles causing most strong‐evidence foodborne campylobacteriosis outbreaks. Further details and statistics on campylobacteriosis outbreaks for 2020 can be found in the foodborne outbreaks chapter.
1.4.3. Campylobacter in food
Campylobacter data in the context of Regulation (EC) No 2073/2005
Table 7 shows Campylobacter PHC monitoring data, with the test results obtained using a culture‐based enumeration method (ISO 10272‐2), from the neck skins of chilled broiler carcases sampled at slaughterhouses within the EU. Twelve MS reported ad hoc official sampling results, 17 MS reported monitoring results from FBOp and eight MS (Belgium, Estonia, Greece, Ireland, Italy, Latvia, Romania and Spain) reported data from both samplers. In total, 52,643 neck skin units were tested, of which 32% were Campylobacter positive (N = 16,869).
Table 7.
Comparison of proportions (%) of Campylobacter‐positive samples and samples exceeding the Campylobacter PHC limit according to Regulation (EC) No. 2073/2005, by sampler, from reporting MS, EU, 2020
| Country | Competent Authority (CA) | Food business operator (FBOp) | p‐value b , c | Interpretation c | ||||||
|---|---|---|---|---|---|---|---|---|---|---|
| N samples Tested | N (%) samples positive | N (%) samples above 1,000 CFU/g | CI95 samples above 1,000 CFU/g | N samples Tested | N (%) samples positive | N (%) samples above 1,000 CFU/g | CI95 samples above 1,000 CFU/g | |||
| Austria | – | – | – | – | 795 | 248 (31.2) | 38 (4.8) | [3.4; 6.5] | – | – |
| Belgium | 643 | 238 (37.0) | 95 (14.8) | [12.1; 17.8] | 1,883 | 202 (10.7) | 202 (10.7) | [9.4; 12.2] | < 0.01 | CA > FBOp |
| Bulgaria | 650 | 160 (24.6) | 17 (2.6) | [1.5; 4.2] | – | – | – | – | – | – |
| Croatia | 1,058 | 324 (30.6) | 319 (30.2) | [27.4; 33.0] | – | – | – | – | – | – |
| Cyprus | 230 | 162 (70.4) | 87 (37.8) | [31.5; 44.4] | – | – | – | – | – | – |
| Czechia | – | – | – | – | 3,738 | 2,267 (60.7) | 1,255 (33.6) | [ 32.1; 35.1] | – | – |
| Denmark | – | – | – | – | 985 | 186 (18.9) | 69 (7.0) | [5.5; 8.8] | – | – |
| Estonia | 12 | 1 (8.3) | 0 | [0; 26.5] a | 260 | 10 (3.9) | 5 (1.9) | [0.63; 4.4] | NS | |
| Finland | – | – | – | – | 595 | 1 (0.17) | 1 (0.17) | [0; 0.93] | – | – |
| France | – | – | – | – | 15,481 | 4,405 (28.5) | 4,405 (28.5) | [27.7; 29.2] | – | – |
| Germany | – | – | – | – | 5,556 | 419 (7.5) | 419 (7.5) | [6.9; 8.3] | – | – |
| Greece | 155 | 35 (22.6) | 25 (16.1) | [10.7; 22.9] | 975 | 835 (85.6) | 94 (9.6) | [7.9; 11.7] | 0.01 | CA > FBOp |
| Ireland | 178 | 118 (66.3) | 19 (10.7) | [6.6; 16.2] | 1,026 | 388 (37.8) | 72 (7.0) | [5.5; 8.8] | 0.04 | CA > FBOp |
| Italy | 491 | 397 (80.9) | 157 (32.0) | [27.9; 36.3] | 6,591 | 3,078 (46.7) | 707 (10.7) | [10.0; 11.5] | < 0.001 | CA > FBOp |
| Latvia | 100 | 56 (56) | 18 (18.0) | [11.0; 26.95] | 297 | 121 (40.7) | 54 (18.2) | [14.0; 23.1] | NS | – |
| Netherlands | 284 | 73 (25.7) | 26 (9.2) | [6.1; 13.1] | – | – | – | – | – | – |
| Portugal | – | – | – | – | 3,601 | 868 (24.1) | 455 (12.6) | [11.6; 13.8] | – | – |
| Romania | 1,510 | 400 (26.5) | 62 (4.1) | [3.2; 5.2] | 2,090 | 612 (29.3) | 24 (1.2) | [0.74; 1.7] | < 0.001 | CA > FBOp |
| Slovenia | – | – | – | – | 784 | 564 (71.9) | 291 (37.1) | [33.7; 40.6] | – | – |
| Spain | 1,073 | 509 (47.4) | 313 (29.2) | [26.5; 32.0] | 695 | 292 (42.0) | 74 (10.7) | [8.5; 13.2] | < 0.001 | CA > FBOp |
| Sweden | – | – | – | – | 907 | 7 (0.77) | 7 (0.77) | [0.31; 1.6] | – | – |
| Total EU | 6,384 | 2,473 (38.7) | 1,138 (17.8) | [16,89; 18,79] | 46,259 | 14,503 (31.3) | 8,172 (17.6) | [17.3; 18.0] | NS | |
| Total EU providing CA and FBOp data | 4,162 | 1,754 (42.1) | 689 (16.6) | [15.4; 17.7] | 13,817 | 5,538 (40.1) | 1,232 (8.9) | [8.5; 9.4] | < 0.001 | CA > FBOp |
One‐sided, 97.5% confidence interval.
p‐value: NS, not significant.
Related to the percentage of positive samples above 1,000 CFU/g.
Ad hoc official sampling reported the test results for 6,384 units. The number of Campylobacter‐positive units totalled 2,473 (38.7%) with 1,138 (17.8%) exceeding the limit of 1,000 CFU/g. Moderate variability was observed in percentage test results exceeding the limit. In particular, one MS (Estonia) showed no units exceeding the limit and four MS (Croatia, Cyprus, Italy and Spain) showed a high number of units above the limit, ranging between 29.2% and 37.8%.
FBOp reported test results for 46,259 neck skin samples from own‐check sampling activities. The number of Campylobacter‐positive units detected totalled 14,503 (31.3%), with 8,172 (17.6%) exceeding the limit of 1,000 CFU/g. Two MS (Finland and Sweden) showed very low (< 1%) levels of positives exceeding the limit: 0.17% and 0.77%, respectively. Switzerland reported 183 positive units, of which 65 out of 780 tests exceeded the limit.
The eight MS (Belgium, Estonia, Greece, Ireland, Italy, Latvia, Romania and Spain) reporting results from both samplers showed 42.1% (N = 1,754) Campylobacter‐positive samples from carcases for official samples and 40.1% (N = 5,538) for samples collected by FBOp. The total number of units exceeding the limit in the eight MS was significantly higher in official samples (16.6%, N = 689) than in those based on own‐checks (8.9%, N = 1,232). For single MS, this was also the case for Belgium, Greece, Ireland, Italy, Romania and Spain.
When comparing all Campylobacter PHC monitoring data provided by 21 MS, the percentage of units exceeding the limit was comparable (not significantly different) between official samples (17.8%) and FBOp samples (17.6%).
Other food monitoring data
Table 8 summarises the reported occurrence of Campylobacter in the main food categories in 2020 and over the 4‐year period of 2016–2019 within the EU. A distinction is made between RTE and non‐RTE food, and fresh meat.
Table 8.
Occurrence of Campylobacter in the main food categories (RTE food – non‐RTE food), EU
| Food | 2020 | 2016–2019 a | ||||
|---|---|---|---|---|---|---|
| N reporting MS | N sampled units | Positive N (%) | N reporting MS | N sampled units | Positive N (%) | |
| RTE food | ||||||
| All | 7 | 3,202 | 4 (0.12) | 15 | 9,827 | 19 (0.19) |
| Meat and meat products | 4 | 414 | 1 (0.24) | 10 | 1,145 | 4 (0.35) |
| Meat and meat products from broilers | 2 | 10 | 0 | 3 | 29 | 0 |
| Meat and meat products from turkeys | 2 | 6 | 1 (16.7) | 2 | 9 | 0 |
| Other meat and meat products | 4 | 398 | 0 | 9 | 1,107 | 4 (0.4) |
| Milk and milk products | 7 | 774 | 2 (0.26) | 11 | 2,645 | 10 (0.38) |
| Milk | 4 | 307 | 2 (0.65) | 6 | 817 | 8 (0.98) |
| Raw milk b | 4 | 304 | 2 (0.66) | 6 | 801 | 8 (1.0) |
| Cheese | 4 | 458 | 0 | 7 | 1,819 | 2 (0.11) |
| Dairy products excluding cheeses (butter, cream, ice cream, whey, yoghurt and fermented dairy products) | 2 | 9 | 0 | 3 | 9 | 0 |
| Fruit, vegetables and juices | 3 | 1,173 | 1 (0.09) | 6 | 2,228 | 3 (0.13) |
| Salads | 3 | 327 | 0 | 5 | 339 | 1 (0.29) |
| Other processed food products and prepared dishes | 3 | 326 | 0 | 5 | 277 | 0 |
| Non‐RTE food | ||||||
| All | 16 | 13,240 | 2,684 (20.3) | 21 | 71,870 | 16,675 (23.2) |
| Meat and meat products | 16 | 10,547 | 2,658 (25.2) | 21 | 65,761 | 16,594 (25.2) |
| Meat and meat products from broilers | 14 | 7,298 | 2,223 (30.5) | 17 | 35,854 | 12,006 (33.5) |
| Meat and meat products from turkeys | 6 | 1,169 | 251 (21.5) | 10 | 3,892 | 981 (25.2) |
| Other meat and meat products | 12 | 2,080 | 184 (8.6) | 17 | 26,015 | 3,607 (13.9) |
| Milk and milk products | 7 | 713 | 5 (0.70) | 9 | 2,080 | 47 (2.3) |
| Fruit, vegetables and juices | 3 | 443 | 1 (0.23) | 7 | 2,036 | 4 (0.20) |
| Other food | 5 | 1,536 | 20 (1.3) | 8 | 1,981 | 30 (1.5) |
| Fresh meat | ||||||
| All | 15 | 9,506 | 2,463 (25.9) | 19 | 57,660 | 15,327 (26.6) |
| Fresh meat from broilers | 14 | 6,747 | 2,031 (30.1) | 18 | 33,344 | 11,253 (33.6) |
| Fresh meat from turkeys | 6 | 1,077 | 226 (21) | 9 | 3,439 | 892 (26) |
| Fresh meat from pigs | 6 | 406 | 15 (3.7) | 7 | 1,989 | 107 (5.4) |
| Fresh meat from bovines | 3 | 242 | 1 (0.4) | 9 | 3,611 | 43 (1.2) |
| Other fresh meat | 9 | 378 | 95 (25.1) | 12 | 15,277 | 3,032 (19.9) |
RTE: ready‐to‐eat.
When UK data were collected for the period, the UK was an EU MS, but on 1 February 2020, it became a third country. Data from the UK are taken into consideration for the period 2016–2019, but not for 2020 in this EU overview.
Raw RTE milk sampling units are a subset of RTE milk.
The proportion of Campylobacter‐positive samples in the RTE and non‐RTE categories was 0.12% and 20.3%, respectively. In fresh meat, 25.9% of sampling units were positive.
In 2020, most of the results from the 3,202 RTE food sampling units reported by seven MS came from ‘fruit, vegetables and juices’ (36.6%), followed by ‘milk and milk products’ (24.2%) and ‘meat and meat products’ (12.9%). In total, Campylobacter was detected in four RTE food samples: two in ‘raw milk’, one in ‘fruit, vegetables and juices’ and one in ‘meat and meat products’. During the period 2016–2019, for RTE food, the percentage of Campylobacter‐positive sampling units was low, at below 1% for all categories. Over the entire period, the highest percentage of Campylobacter‐positive units was for ‘raw milk’: eight positives out of 801 (1%) sample units tested.
The results reported in 2020 by 16 MS for non‐RTE food show that ‘meat and meat products’ was the most contaminated food category, followed by ‘milk and milk products’ and ‘fruit, vegetables and juices’. Similar results were observed for the period 2016–2019.
Sixteen MS reported results for fresh meat categories. The percentage of Campylobacter‐positive units was highest for fresh meat from broilers (30.1%) followed by ‘other fresh meat’ (25.1%) and meat from turkeys (21%). The percentage for fresh meat from pigs and bovines remained relatively low; 3.7% and 0.4%, respectively. Similar results were observed for the period 2016–2019, except for meat from turkeys where the positive percentage was higher than for ‘other fresh meat’.
1.4.4. Campylobacter in animals
Table 9 shows the number of positive Campylobacter spp. samples detected during 2020 in the five main animal species, as well as in the ‘other animals’ category containing more than 50 different animal groups. Of the 20,891 units tested, Campylobacter was detected in 4,638 (22.2%) units. In total, 17 MS and four non‐MS reported data, primarily relating to broilers (65.2%), followed by bovines, turkeys, cats and dogs, and pigs. Sixteen countries reported data for broilers whereas only a few countries provided data for the other animal species. The proportion of positive units was highest in turkeys (62.1%) and pigs (58.5%) followed by broilers (24.5%), cats and dogs (15%) and finally bovines (5.1%). Although fewer samples were tested in ‘other animals’, a considerable proportion of positive units were detected in sheep (30.6%, N = 1,077), wild boars (19.6%, N = 61) and wild birds (15.4%, N = 279).
Table 9.
Summary of Campylobacter statistics related to major animal species, reporting MS and non‐MS, 2020
| Animals | N reporting MS/non‐MS | N tested units a in EU | Positive units | |
|---|---|---|---|---|
| N | % | |||
| Broilers | 14/2 | 13,625 | 3,340 | 24.5 |
| Turkeys | 4/1 | 1,360 | 845 | 62.1 |
| Pigs | 3/0 | 147 | 86 | 58.5 |
| Bovines b | 3/1 | 2,613 | 134 | 5.1 |
| Cats and dogs | 4/3 | 538 | 81 | 15.1 |
| Other animals c | 5/3 | 2,608 | 152 | 5.8 |
MS: Member State.
Summary statistics were obtained by totalling all sampling units (single samples, batch samples, animals, slaughter animal batches and herds or flocks).
‘Artificial insemination stations’ at the ‘sampling stage’ were not included in the count of the units tested.
Badgers – wild, Bears – zoo animals, Birds – pets, Birds – wild, Birds – zoo animals, Camels – zoo animals, Canaries – pets, Cantabrian chamois – wild, Deer – wild, Deer wild ‐ fallow deer, Deer ‐ wild ‐ red deer, Deer ‐ wild ‐ roe deer, Deer ‐ zoo animals, Dolphins, Doves – wild, Elephants ‐ zoo animals, Falcons – wild, Ferrets – wild, Foxes, Foxes – wild, Giraffes ‐ zoo animals, Goats, Goats ‐ animals over 1 year, Guinea pigs – pets, Hares – wild, Hedgehogs – wild, Kangaroos ‐ zoo animals, Land game mammals, Lions ‐ zoo animals, Marine mammals – wild, Monkeys ‐ zoo animals, Other animals ‐ exotic pets, Other ruminants ‐ zoo animals, Parrots – pets, Parrots – wild, Peafowl, Pigeons, Pigeons – wild, Rabbits – farmed, Rabbits – pets, Rats – wild, Rhinoceroses ‐ zoo animals, Rodents ‐ zoo animals, Sheep, Sheep ‐ animals over 1 year, Sheep ‐ animals under 1 year (lambs), Solipeds, domestic – donkeys, Solipeds, domestic – horses, Swans – wild, Turtles – wild, Water buffalos, Wild boars – farmed, Wild boars – wild, zoo animals, all.
1.5. Discussion
Campylobacteriosis has been the most frequently reported zoonosis in humans across the EU since 2005. Despite comprehensive surveillance and national coverage in most MS, the number of reported cases is underestimated in the EU (Teunis et al., 2013). In 2019, in two‐thirds of the EU MS, the number of confirmed campylobacteriosis cases decreased. A fall in cases was also observed in 2020, probably due to the COVID‐19 pandemic and the withdrawal of the United Kingdom from the EU. However, the overall campylobacteriosis trend in 2016–2020 showed no statistically significant increase or decrease.
Compared with 2019, a major decrease in travel‐associated campylobacteriosis cases was observed. The lockdown measures put in place across the EU, as well as national/international mobility restrictions caused by air, sea and/or land border closures in some countries, could have contributed to this phenomenon.
Campylobacter has a characteristic seasonality with cases increasing sharply in the summer. Campylobacteriosis cases have been positively associated with temperature and, to a lesser degree, precipitation (Lake et al., 2019). However, a smaller but distinct winter peak has become apparent in the past 10 years in the EU, including in 2020. Disease onsets concerning cases that were notified during the winter peaks occurred predominantly in January. This points to exposure around the Christmas/New Year period. In some of the countries where a winter peak was observed, meat fondues or table‐top grilling are popular during the festive season and could promote the transmission of Campylobacter (Bless et al., 2017). The significant reduction in the number of cases observed in spring 2020 is probably due to the COVID‐19 pandemic and the implementation of lockdown measures across the EU.
Within the EU, over 8,500 campylobacteriosis cases were hospitalised and it was by far the foodborne agent associated with the highest number of hospitalisations. The proportion of hospitalised campylobacteriosis cases was higher than expected in some MS, where all or most of the confirmed cases were hospitalised. These MS also reported the lowest notification rates, indicating that surveillance focuses primarily on hospitalised (i.e. severe) cases. This can lead to the number of hospitalised cases being overestimated in some countries. As in previous years, C. jejuni and C. coli were the main species notified by MS, but there was still a high percentage (35.3%) of campylobacteriosis cases in which the Campylobacter species was not determined.
In 2020, as part of a food control strategy, it became mandatory to report data from the Campylobacter PHC on the neck skins of chilled broiler carcases, as stated in the Commission Implementing Regulation (EU) 2019/627. According to this legislation, the CA must verify whether the FBOp is correctly implementing the PHC, either by ad hoc official sampling or by collecting the relevant information on the test analyses carried out by the FBOp for own‐check purposes. Overall, 21 MS submitted their data, compared with 14 for 2019. Of this total, eight MSs reported both official and own‐check results, four only official results and nine only own‐check results. An increase in the number and percentage of Campylobacter‐positive units was noted compared with the numbers from 2019. In respect to the previous year, it is worth noting an increase in the number of samples reported and the number of MS declaring their data. This increase was expected, in the light of the need to comply with the EU regulation. The percentage of positives from broiler neck skins, as set out in the current report, is significantly lower than from broiler carcases in the 2008 EU harmonised survey: 75.8% (EFSA, 2010). This difference could be attributed to the different sampling methods, and to the sole use of the enumeration method for the Campylobacter PHC, negatively impacting the sensitivity of the tests performed. Better populated EU summary tables with more complete data sets from all MS will in future allow better trend watching and trend analyses.
Twelve MS reported official control monitoring data from 2020, showing that about one in six samples exceeded the limit of 1,000 CFU/g. Seventeen MS reported monitoring data based on sampling results collected from FBOp, in which also about one in six samples exceeded the limit of 1,000 CFU/g. For the MS that submitted data from both samplers, the results above the limit concerned one in six units for the CA and one in 11 for the FBOp, respectively, with the former results being significantly higher than the latter. This observed discrepancy deserves more thorough investigation in order to identify the factors that explain these differences and to implement proper control of Campylobacter during primary production. Monitoring Campylobacter for the purposes of improving biosecurity measures on farms is of paramount importance (Newell et al., 2011). With respect to this point, EFSA experts have updated the 2011 scientific opinion (EFSA BIOHAZ Panel, 2011) using more recent scientific data and have reviewed on‐farm control options for Campylobacter in broilers (EFSA BIOHAZ Panel, 2020a). The updated model resulted in lower estimates of the impact of interventions (control options) than the model used in the 2011 opinion. A 3‐log10 reduction in broiler caecal concentrations was estimated in order to reduce the relative risk within the EU of human campylobacteriosis attributable to broiler meat by 58% compared with an estimate of over 90% in the previous opinion.
Food contamination by Campylobacter in the EU is monitored according to Chapter II ‘Monitoring of zoonoses and zoonotic agents’ of the Zoonoses Directive 2003/99/EC. These data are collected without harmonised design between the MS. When considering monitoring data that were collected according to an ‘objective’ sampling, the overall percentages of Campylobacter positive units in RTE and non‐RTE foods were 0.12% and 20.3%, respectively. Although the presence of Campylobacter in RTE was very low and has remained stable over the years, the findings are of concern given that contaminated RTE products directly expose consumers to infection. The RTE food most frequently contaminated with Campylobacter was ‘raw milk’ with positive results for two units out of 304, confirming the trend of one in 100 reported over the period 2016–2019. Moreover, data showed positive results for one ‘meat and meat products’ and one ‘fruit, vegetables and juices’ confirming the previously observed sporadic contamination with Campylobacter in these categories. Overall, a low number of sampling units might have led to an underestimation of real RTE contamination by Campylobacter. In this case, future efforts to increase the sampling frequency of these food products would need to be encouraged. Monitoring data for non‐RTE food showed positive results for one in four ‘meat and meat products’, one in 150 ‘milk and milk products’ and one in 400 ‘fruit, vegetables and juices’. The contamination observed in certain fresh meat categories was very high, clearly underlining the key role of these products in campylobacteriosis epidemiology, either through direct handling or through contamination of other foods. The overall percentages of Campylobacter‐positive sampling units for fresh meat from broilers, turkeys and other fresh meat were very high, at 30.1%, 21% and 25.1%, respectively.
In 2020, 17 MS and four non‐MS reported data from several animal groups. Campylobacter spp. were detected in all the major animal categories: broilers, turkeys, pigs, bovines, cats and dogs. The broilers were tested most frequently and accounted for 65.2% of test results, followed by turkey samples, the number of which was 10 times lower. The highest percentage of positive units, however, was observed for turkeys and pigs, although this was partially distorted by the small sampling number. The percentage of positive samples from cats and dogs was 15%, higher than in 2019. The fluctuation in positive results is reasonable and can be associated with the different sampling strategies applied. Finally, a high percentage of positivity was found in sheep, wild boars and wild birds highlighting the widespread presence of Campylobacter in animals and confirming the multispecies epidemiological cycle (Kaakoush et al., 2015).
1.6. Related projects and internet sources
| Subject | For more information see | |
|---|---|---|
| Humans | EU One Health Zoonoses Reports | https://www.ecdc.europa.eu/en/all‐topics‐z/food‐and‐waterborne‐diseases‐and‐zoonoses/surveillance‐and‐disease‐data/eu‐one‐health |
| Fact sheet on Campylobacter | https://www.cdc.gov/campylobacter/index.html | |
| ECDC Surveillance Atlas of Infectious Diseases | http://atlas.ecdc.europa.eu/public/index.aspx | |
| EU case definition of campylobacteriosis | https://www.ecdc.europa.eu/en/surveillance‐and‐disease‐data/eu‐case‐definitions | |
| Food‐ and waterborne diseases and zoonoses | https://www.ecdc.europa.eu/en/food‐and‐waterborne‐diseases‐and‐zoonoses | |
| European Food‐ and Waterborne Diseases and Zoonoses Network (FWD‐Net) | https://www.ecdc.europa.eu/en/about‐us/partnerships‐and‐networks/disease‐and‐laboratory‐networks/fwd‐net | |
| World Health Organization – Campylobacter factsheet | https://www.who.int/news‐room/fact‐sheets/detail/campylobacter | |
| Food, animals | European Union Reference Laboratory (EURL) for Campylobacter | http://www.sva.se/en/service‐and‐products/eurl‐campylobacter |
| EFSA Scientific Opinion of the Panel on Biological Hazards (BIOHAZ), 2010 – Quantification of the risk posed by broiler meat to human campylobacteriosis in the EU | http://www.efsa.europa.eu/en/efsajournal/pub/1437 | |
| EFSA Scientific Opinion of the Panel on Biological Hazards (BIOHAZ), 2011 – Campylobacter in broiler meat production: control options and performance objectives and/or targets at different stages of the food chain | https://www.efsa.europa.eu/en/efsajournal/pub/2105 | |
| EFSA Scientific Opinion of the Panel on Biological Hazards (BIOHAZ), 2020 – Update and review of control options for Campylobacter in broilers at primary production | https://www.efsa.europa.eu/en/efsajournal/pub/6090 | |
| Annual national zoonoses country reports (reports of reporting countries on national trends and sources of zoonoses) | https://www.efsa.europa.eu/en/data‐report/biological‐hazards‐reports | |
| OIE‐Manual of Diagnostic Tests and Vaccines for Terrestrial Animals 2021 Chapter 3.10.4.‐ Infection with Campylobacter jejuni and Campylobacter coli | https://www.oie.int/fileadmin/Home/eng/Health_standards/tahm/3.10.04_CAMPYLO.pdf | |
| Food and Agriculture Organization of the United Nations‐ Food safety and quality: Risk Management Tool for the Control of Campylobacter and Salmonella in Chicken Meat | http://www.fao.org/food‐safety/resources/tools/details/en/c/1191129/ |
2. Salmonella
Tables and figures that are not presented in this chapter are published as supporting information for this report and are available as downloadable files EFSA Knowledge Junction on Zenodo at https://doi.org/10.5281/zenodo.5682809. Summary statistics on human surveillance data with downloadable files are retrievable using ECDC’s Surveillance Atlas of Infectious Diseases at http://atlas.ecdc.europa.eu/public/index.aspx

2.1. Key facts
-
•
Salmonellosis was the second most commonly reported foodborne gastrointestinal infection in humans after campylobacteriosis and was an important cause of foodborne outbreaks in EU MS and non‐MS countries.
-
•
In 2020, Salmonella reporting recorded the lowest number of human cases since 2007, when salmonellosis surveillance started, owing to the impacts of the withdrawal of the United Kingdom from the EU on the one hand and the COVID‐19 pandemic on the other hand.
-
•
In 2020, the number of confirmed cases of human salmonellosis was 52,702, corresponding to an EU notification rate of 13.7 per 100,000 population. This was a decrease of 29.7% and 32.8% compared with the rate in 2019 (19.5 and 20.4 per 100,000 population) with and without the 2019 data from the United Kingdom, respectively.
-
•
Notwithstanding, the overall trend for salmonellosis in 2016–2020 did not show any statistically significant increase or decrease.
-
•
The proportion of hospitalised cases was 29.9%, which was lower than in 2019, with an EU case fatality rate of 0.19%.
-
•
The top five Salmonella serovars involved in human infections overall were distributed as follows: S. Enteritidis (48.7%), S. Typhimurium (12.4%), monophasic S. Typhimurium (1,4,[5],12:i:‐) (11.1%), S. Infantis (2.5%) and S. Derby (1.2%).
-
•
In total, 694 foodborne outbreaks of Salmonella were reported by 22 MS in 2020, causing 3,686 illnesses, 812 hospitalisations and seven deaths. Salmonella caused 22.5% of all foodborne outbreaks in 2020. The majority (57.9%) of the reported foodborne outbreaks of Salmonella were caused by S. Enteritidis. The three food vehicles most commonly involved in strong‐evidence foodborne salmonellosis outbreaks were ‘eggs and egg products’, followed by ‘pig meat and products thereof’ and ‘bakery products’.
-
•
For 2020, 69,898 ‘ready‐to‐eat’ food sampling units collected according to an ‘objective sampling’ strategy were reported by 22 MS with 0.15% positive samples overall. Within each food category, 1.6% of ‘meat and meat products from broilers’, 0.8% of ‘spices and herbs’, 0.6% of ‘meat and meat products from pigs’, 0.5% of ‘meat and meat products from turkeys’ and 0.5% of ‘other meat and meats products’ were positive for Salmonella.
-
•
Sampling to verify compliance with process hygiene criteria, according to Regulation (EC) No 2073/2005 found significantly lower proportions of Salmonella‐positive carcases of pigs, broilers, turkey and cattle in samples collected by food business operators as own‐check controls, compared with the official control samples collected by the Competent Authorities at EU level.
-
•
Fourteen of the 26 MS reporting on Salmonella control programmes met the reduction targets for all poultry populations, compared to 18 in 2019. The number of MS that did not meet the Salmonella reduction targets was three for breeding flocks of Gallus gallus, seven for laying hen flocks, three for broiler flocks, one for breeding flocks of turkeys and three for fattening turkey flocks.
-
•
In the context of Salmonella control programmes in poultry, the prevalence of target Salmonella serovars in broiler and fattening turkey flocks reported by food business operators was significantly lower than that reported by the Competent Authorities at EU level.
-
•
A significant increase in the estimated prevalence of Salmonella was noted for laying hens and breeding turkeys in 2020 compared with 2014 and 2015, respectively, when prevalence reached the lowest level in these poultry populations. Flock prevalence trends for target Salmonella serovars were, in contrast, fairly stable over the last few years for all poultry populations.
-
•
Considering the top five serovars responsible for human infections and the major putative sources (broilers, cattle, turkeys, laying hens and pigs, isolated from both animals and food thereof), a panel of 17,877 serotyped isolates from food and food‐producing animals was reported. S. Enteritidis was primarily related to broiler sources and to layers and eggs. S. Typhimurium was mainly linked with broiler and pig sources. Monophasic S. Typhimurium (1,4,[5],12:i:‐) was related mainly to pig and secondly to broiler sources. S. Infantis was strictly related to broiler sources, whereas S. Derby was primarily linked with pigs.
2.2. Surveillance and monitoring of Salmonella in the EU
2.2.1. Humans
The notification of non‐typhoidal salmonellosis in humans is mandatory in 23 MS, Iceland, Norway and Switzerland, whereas in four MS (Belgium, France, Luxembourg and the Netherlands), reporting is based on a voluntary system. Surveillance systems for salmonellosis cover the whole population in all MS except in France, the Netherlands and Spain. The estimated coverage of the surveillance system is 48% in France and 64% in the Netherlands. These proportions of populations were used in the calculation of country‐specific and EU‐level notification rates. No estimate for population coverage in Spain was provided, so the notification rate was not calculated. For 2020, Spain did not receive data from all regions that usually report, due to COVID‐19, the case numbers therefore might not be complete. All countries reported case‐based data except Bulgaria, which reported aggregated data. Both reporting formats were included to calculate annual numbers of cases and notification rates.
Since 1 February 2020, the United Kingdom has become a third country, whereas before it was an EU MS. Human data from the United Kingdom were not collected by ECDC for 2020. In humans, Salmonella infections are generally diagnosed by culture from stool samples. All EU MS, except Bulgaria and Poland, reported serotyping data for the isolates.
2.2.2. Food, animals and feed
Data on Salmonella throughout the food chain are collected during the preharvest (farm animals and their feed), processing (cutting plants and slaughterhouses) and post‐harvest (retail and catering) stages.
Salmonella data in the context of Regulation (EC) No 2073/2005
Regulation (EC) No 2073/2005 lays down microbiological criteria, intended as food safety criteria (FSC) and process hygiene criteria (PHC), for Salmonella in specific food categories. Compliance with these criteria must be legally verified by the individual food business operator (FBOp) as part of their own HACCP programme, through own‐checks when implementing the general and specific hygiene measures of Regulation (EC) No 852/2004 11 . In addition, the Competent Authority (CA), through official sampling or oversight of data, should ensure that the FBOp complies with these regulatory requirements. The Salmonella FSC require that the pathogen not be detected in 25 or 10 g of different products (from five to 30 sampling units for the specified food categories) when they are on the market, during their shelf‐life. Moreover, according to Regulation (EC) No 1086/2011 12 , in fresh poultry meat (breeding Gallus gallus, laying hens, broilers, breeding and fattening turkeys), the FSC require the absence of target serovars (S. Enteritidis and S. Typhimurium including monophasic S. Typhimurium (1,4,[5],12:i:‐)) in a 25 g sample. The Salmonella PHC are regulated for carcases of pigs, cattle, sheep, goats, horses, broilers and turkeys. They evaluate the presence of the pathogen on a specific area of a tested carcase, or in a pooled sample of neck skin from broilers and turkeys, considering a set of 50 samples derived from 10 consecutive sampling sessions. Salmonella isolates collected from broilers and turkeys must be serotyped for the identification of S. Enteritidis and S. Typhimurium. Moreover, according to Regulation (EU) No 2019/6278, the CA has to verify whether the FBOp correctly implements and checks the PHC for carcases (points 2.1.3, 2.1.4 and 2.1.5 of Chapter 2 of Annex I of Regulation (EC) No 2073/2005) by choosing between different approaches: (i) implementing official sampling (at least 49 random samples collected in each slaughterhouse annually, or a reduced number of samples in small slaughterhouses based on a risk evaluation), (ii) collecting all information on Salmonella‐positive samples from own‐checks by the FBOp and/or (iii) collecting information on Salmonella‐positive samples as part of national control programmes in the MS with special guarantees (Regulation (EC) No 853/2004 13 ). Reporting these monitoring data from carcases in the context of official controls, regardless of the selected approach, is mandatory and the data collected in this context are analysed comparing the results of sampling by the CA and FBOp. These harmonised official control results, which must be reported, will allow better trend watching and trend analyses over the coming years.
The official control results for Salmonella had the following specified options for the different data elements: sampling context: ‘surveillance based on Regulation 2073’; sampler: ‘official sampling’, except for carcases for which the sampler had to be labelled as ‘official, based on Regulation 2019/627’ and/or ‘industry sampling’ or ‘HACCP and own‐check’, for the PHC; sampling context: ‘surveillance, based on Regulation (EC) No 2073/2005’; sampling unit type: ‘single’; sampling strategy: ‘objective sampling’; and corresponding to specific food matrices.
Data for compliance with Salmonella national control programmes in poultry populations
According to Regulation (EC) No 2160/2003 14 and its subsequent amendments, MS have to set up Salmonella national control programmes (NCP) aimed at reducing the prevalence of Salmonella serovars that are considered relevant for public health (from this point forward termed ‘target serovars’). Currently, prevalence targets have been defined for breeding flocks of Gallus gallus, laying hens, broilers and breeding and fattening turkeys and correspond to the maximum annual percentage of flocks positive for S. Enteritidis and S. Typhimurium, including its monophasic variants, except for breeding flocks of Gallus gallus, where S. Infantis, S. Virchow and S. Hadar are considered to be relevant as well. In particular, the prevalence target is equal to 1% or less for breeding flocks of Gallus gallus (Regulation (EU) No 200/2010 15 ), broilers (Regulation (EU) No 200/2012 16 ) and breeding and fattening turkeys (Regulation (EU) No 1190/2012 17 ); it is 2% for laying hens (Regulation (EU) No 517/2011 18 ). MS must annually report results for Salmonella NCP and, for broiler flocks and breeding and fattening turkey flocks, results for sampling conducted by the CA and FBOp must be reported separately. These NCP data facilitate descriptive summaries at the EU level and also enable spatial and temporal trends to be monitored at the EU level (Table 1). Moreover, prevalence data from the CA and FBOp’s samples are compared.
Other monitoring data for food, animals and feed including serovars
Food, animal and feed data other than those described above are not collected in a harmonised way, because there are no requirements for sampling strategies, sampling methods, analytical tests or reporting. Still, the MS have to report these data according to Directive 2003/99/EC on the monitoring of zoonoses at the most appropriate stage of the food chain even though there are no harmonised rules for this reporting. Regardless of the sampling strategy, these data have been descriptively summarised, and they do not serve the purpose of trend watching or trend analyses (Table 1).
The reported occurrence of Salmonella in the main food categories in terms of human exposure was descriptively summarised with a distinction being made between RTE and non‐RTE food with a comparison of data collected in 2020 and over the previous 4‐year period (2016–2019). Data sets were extracted with ‘objective sampling’ being specified as the sampling strategy, which means that the data refer to random samples, which should be representative of the population to be analysed and are collected according to a planned strategy.
The occurrence of Salmonella in animal populations was descriptively summarised considering all data collected in different sampling contexts and reported as different sample units (e.g. ‘holding’, ‘herd/flocks’, ‘animals’ and ‘slaughter animal batch’), with the exception of data related to poultry populations covered by control programmes, which were discussed separately.
Reported data on Salmonella serovars from animal and food samples were also descriptively summarised. MS are required to report the target serovars as part of their NCP in poultry populations, whereas for the samples collected in different contexts, serotyping is not mandatory and if it is performed, the reporting of serovar data is also not mandatory. Also, for the food sector, the FSC is the absence of Salmonella, except for fresh poultry meat, for which the criterion is the absence of the target serovars. The compulsory reporting of target serovars in the context of NCP in poultry populations and, as part of the FSC for fresh poultry meat, guarantees the consistency of such data over the years and among MS, but could result in the overestimation of these target serovars compared with the other serovars. Some MS may decide to not report non‐target serovars, which would lead to a possible reporting bias for target serovars in poultry populations and for fresh poultry meat.
Since 1 February 2020, the United Kingdom has become a third country, whereas before it was an EU MS. Food, animal and feed data from the United Kingdom were collected by EFSA for 2020 in the framework of Zoonoses Directive 2003/99/EC.
2.2.3. foodborne outbreaks of salmonellosis
The reporting of foodborne salmonellosis outbreaks in humans is mandatory according to Zoonoses Directive 2003/99/EC.
2.3. Data analyses
2.3.1. Comparison between Competent Authority and Food Business Operator sampling results
CA and FBOp Salmonella results in the context of NCP for those poultry populations requiring separate reporting (NCP for broilers, fattening turkeys and breeding turkeys) were compared, as were Salmonella PHC monitoring data from carcases (of pigs, cattle, goats, sheep, horses, broilers and turkeys). The significance of differences was verified by the one‐tailed Fisher’s exact probability test, in cases where the expected values in any of the cells of a contingency table were below five; otherwise, the z‐statistic one‐tailed test was performed. CA official control sampling results and own‐check results by FBOp were expressed as prevalence and exact binomial confidence interval (95% level). A p‐value of < 0.10 (Clayton and Hills, 2013) was considered significant to consider every possible evidence of differences between data collected by the FBOp and CA.
R software (www.r‐project.org, version 4.0.5) was used to conduct the above‐mentioned analyses.
2.3.2. Statistical trend analyses for poultry monitoring data
Statistical trend analyses have been carried out with the objectives of evaluating the significance of temporal variations in the EU‐level flock prevalence of Salmonella and target Salmonella serovars in poultry since the start of NCP implementation. For this analysis, the United Kingdom’s data were not considered for 2020, since from February 2020, the United Kingdom has been a third country.
The tested flocks were either positive or negative for target serovars and Salmonella, and so the status of the flocks is a dichotomous outcome variable. Therefore, the binomial probability distribution for the response variable was assumed and the logit link function was computed in the model for the trend analysis. The logit is defined as the logarithm of p/(1 – p), where p/(1 – p) is the odds of being positive for Salmonella.
According to temporal flock prevalence trends in the MS, polynomial or B‐spline basic models (in case of a supposed high degree of polynomial trend) for the logit of the probability of flocks being positive were fitted for the different poultry populations over the entire period of NCP implementation. Moreover, attention was paid to the period after achievement of the minimum prevalence reported to date, to capture any evidence of a significant increase in Salmonella prevalence. Marginal and conditional generalised linear models for repeated measures were used to perform these trend analyses (EFSA, 2009a, 2011). Details about the estimated parameters of the models, odds ratios, prevalence and graphical analyses (conditional and marginal) are reported in the supporting information for this report (‘Salmonella poultry outcome trend analyses’ xls file).
To investigate EU‐level prevalence considering the relevant heterogeneity among MS for flock prevalence of Salmonella and target serovars over time, the results obtained using the conditional generalised mixed model for longitudinal binary data were summarised and discussed in the report, for all poultry populations covered by the NCP. To take account of the different levels (baselines) of probability of MS having positive flocks, yet with similar patterns over time, a random MS‐specific intercept effect was included in the model. To consider the trend over time, the ‘time’ variable was included in the model as a fixed effect. The correlation between repeated observations in the same MS in subsequent years was considered using a first autoregressive or exchangeable structure of the correlation matrix for the residuals. To evaluate the significance of the overall effect of fixed factors specified in the model, Type III F‐tests were applied, whereas the receiver operating characteristic (ROC) curve was used to assess the goodness of fit of the model. A p‐value < 0.10 was considered to be significant for both random and fixed effects.
GLIMMIX and SGPLOT procedures in SAS 9.4 software were used to fit the models and to produce the graphical outputs, respectively.
2.3.3. Descriptive analyses of Salmonella serovars
With the aims of evaluating the distribution of Salmonella serovars across the food chain and identifying potential sources for human infections, descriptive analyses were undertaken using serovar data on food and food‐producing animals for the five most commonly reported Salmonella serovars from human cases acquired within the EU (domestically or during travel within the EU). For animal categories covered by the NCP, only serovar data reported in the context of these programmes were presented. For cattle, meat‐producing animals were considered, whereas for pigs, data from fattening animals were used. To interpret serovar data, it must be kept in mind that for NCP, mandatory reporting is limited to target serovars only and this could lead to a possible bias towards the reporting of these regulated serovars to the detriment of non‐regulated ones. Moreover, the MS use different approaches to serovar reporting. Some of them systematically notify all identified serovars, while others notify only a selection of serovars and still some others do not transmit such data. For all the other animal species–food matrices, serovar data are reported on a voluntary basis by the MS. Apart from possible reporting biases as regards serovars, reporting for animal or food categories could also be unbalanced and specific sources (e.g. cattle) may be under‐represented.
Sankey diagrams were provided to show the most commonly reported Salmonella serovars from humans in relation to their likely food and animal sources and in relation to the MS reporting them (geographical origin).
2.4. Results
2.4.1. Overview of key statistics, EU, 2016–2020
Table 10 summarises EU‐level statistics on human salmonellosis and on Salmonella in food and animals, respectively, during the 2016–2020 period. In 2020, a substantial decrease in notified human cases, caused in part by the impact of the COVID‐19 pandemic and by Britain's EU departure (the United Kingdom considered a third country since February 2020), was noted. Reported food data of interest were classified into the major categories and aggregated by year to obtain an annual overview of the volume of data submitted. All data collected from food and animal sources were considered regardless of the sampling strategy.
Table 10.
Summary of Salmonella statistics related to humans, major food categories and animal species, EU, 2016–2020
| 2020 | 2019 a | 2018 a | 2017 a | 2016 a | Data source | |
|---|---|---|---|---|---|---|
| Humans | ||||||
| Total number of confirmed cases | 52,702 | 87,908 | 91,858 | 91,587 | 94,425 | ECDC |
| Total number of confirmed cases/100,000 population (notification rates) | 13.7 | 19.5 | 19.6 | 19.4 | 20.0 | ECDC |
| Number of reporting MS | 27 | 28 | 28 | 28 | 28 | ECDC |
| Infection acquired in the EU | 33,309 | 58,157 | 59,763 | 59,642 | 52,851 | ECDC |
| Infection acquired outside the EU | 967 | 6,343 | 6,376 | 6,001 | 6,466 | ECDC |
| Unknown travel status or unknown country of infection | 18,426 | 23,408 | 25,719 | 25,944 | 35,108 | ECDC |
| Number of foodborne outbreak‐related cases | 3,686 | 10,240 | 11,631 | 9,607 | 11,428 | EFSA |
| Total number of foodborne outbreaks | 694 | 1,284 | 1,588 | 1,241 | 1,372 | EFSA |
| Food | ||||||
| Meat and meat products | ||||||
| Number of sampling units | 518,570 | 552,590 | 433,197 | 380,000 | 285,564 | EFSA |
| Number of reporting countries | 26 | 28 | 28 | 28 | 27 | EFSA |
| Milk and milk products | ||||||
| Number of sampling units | 38,492 | 46,797 | 44,078 | 30,796 | 24,337 | EFSA |
| Number of reporting countries | 24 | 25 | 24 | 24 | 24 | EFSA |
| Fish and fishery products | ||||||
| Number of sampling units | 16,557 | 14,010 | 17,123 | 13,507 | 12,287 | EFSA |
| Number of reporting countries | 23 | 24 | 22 | 22 | 21 | EFSA |
| Eggs and egg products | ||||||
| Number of sampling units | 11,579 | 12,093 | 10,611 | 15,435 | 10,933 | EFSA |
| Number of reporting countries | 18 | 21 | 21 | 23 | 20 | EFSA |
| Fruit and vegetables (and juices) | ||||||
| Number of sampling units | 17,222 | 17,068 | 10,888 | 7,579 | 7,515 | EFSA |
| Number of reporting countries | 23 | 22 | 22 | 25 | 20 | EFSA |
| Animals | ||||||
| Gallus gallus (fowl) | ||||||
| Number of sampling units | 620,141 | 752,172 | 720,717 | 736,534 | 699,116 | EFSA |
| Number of reporting countries | 26 | 27 | 27 | 28 | 27 | EFSA |
| Turkeys | ||||||
| Number of sampling units | 63,473 | 65,960 | 68,009 | 74,739 | 79,245 | EFSA |
| Number of reporting countries | 22 | 23 | 24 | 26 | 24 | EFSA |
| Ducks and geese | ||||||
| Number of sampling units | 412 | 8,700 | 9,846 | 5,743 | 2,640 | EFSA |
| Number of reporting countries | 6 | 9 | 6 | 8 | 11 | EFSA |
| Pigs | ||||||
| Number of sampling units | 17,234 | 18,619 | 17,868 | 19,239 | 24,653 | EFSA |
| Number of reporting countries | 10 | 14 | 14 | 17 | 17 | EFSA |
| Bovine animals | ||||||
| Number of sampling units | 28,363 | 86,871 | 30,302 | 654,593 | 53,198 | EFSA |
| Number of reporting countries | 11 | 14 | 14 | 15 | 16 | EFSA |
ECDC: European Centre for Disease Prevention and Control; EFSA: European Food Safety Authority.
When 2016–2019 UK data were collected, the UK was an EU MS, but since 1 February 2020, it has become a third country. Data from the UK are taken account of for the years 2016–2019, whereas for 2020, UK data were not considered in this EU overview.
More detailed descriptions of these statistics are provided in the results section of this chapter and in the chapter on FBO.
Humans
In total, the number of reported human salmonellosis cases and the notification rate were lower than in 2019 (Table 10). The number of reported human salmonellosis cases acquired in the EU (i.e. by domestic infection and through travel within the EU), the number of outbreak‐related cases and the total number of foodborne salmonellosis outbreaks were lower in 2020 than in 2019 and previous years.
Food categories
The number of sampling units reported in 2020 for the different food categories was fairly stable compared with 2019, also considering that for all food categories, with the exception of ‘fruit and vegetables (including juice)’, there was a reduction in the number of reporting MS. There was a slight reduction in the number of reported sampling units for ‘meat and meat products’ and ‘milk and milk products’. Conversely, for ‘fish and fishery products’, there was an opposite tendency and the number of sampled units reported in 2020 was higher than in 2019.
Animal categories
For all animal categories, there was a general reduction in the number of reporting MS. The number of sampling units related to the animal categories ‘turkeys’ and ‘pigs’ was fairly stable over the period 2016–2020. For the category ‘Gallus gallus’ (fowl), there was a reduction of 17.5% in terms of the number of sampled units compared to 2019, with the number of reporting countries decreasing from 27 to 26. For the ‘bovine’ category in 2020, there was a notable reduction in the number of sampling units (67.3% compared to 2019) and reporting MS (14 reporting MS in 2019, 11 in 2020). Similarly, for ‘ducks and geese’, in the last year, there was a very large decrease both for the number of reporting MS and for sampling units compared to the previous 3 years.
2.4.2. Human salmonellosis
In total, 52,702 human salmonellosis cases were reported by 27 EU MS in 2020, with an EU notification rate of 13.7 cases per 100,000 population (Table 11). This was a decrease of 29.7% and 32.8% compared with the rate in 2019 (19.5 and 20.4 per 100,000 population) with and without the data from the United Kingdom, respectively.
Table 11.
Reported human cases of confirmed salmonellosis and notification rates per 100,000 population in EU MS and non‐MS countries, by country and year, 2016–2020
| Country | 2020 | 2019 | 2018 | 2017 | 2016 | |||||||
|---|---|---|---|---|---|---|---|---|---|---|---|---|
| National coverage a | Data format a | Confirmed cases and rates | Confirmed cases and rates | Confirmed cases and rates | Confirmed cases and rates | Confirmed cases and rates | ||||||
| Cases | Rate | Cases | Rate | Cases | Rate | Cases | Rate | Cases | Rate | |||
| Austria | Y | C | 817 | 9.2 | 1,866 | 21.1 | 1,538 | 17.4 | 1,667 | 19.0 | 1,415 | 16.3 |
| Belgium | Y | C | 1,595 | 13.8 | 2,527 | 22.1 | 2,958 | 26.0 | 2,298 | 20.2 | 2,699 | 23.9 |
| Bulgaria | Y | A | 187 | 2.7 | 594 | 8.5 | 586 | 8.3 | 796 | 11.2 | 718 | 10.0 |
| Croatia | Y | C | 786 | 19.4 | 1,308 | 32.1 | 1,323 | 32.2 | 1,242 | 29.9 | 1,240 | 29.6 |
| Cyprus | Y | C | 70 | 7.9 | 62 | 7.1 | 44 | 5.1 | 59 | 6.9 | 77 | 9.1 |
| Czechia | Y | C | 10,520 | 98.4 | 13,009 | 122.2 | 10,901 | 102.7 | 11,473 | 108.5 | 11,610 | 110.0 |
| Denmark | Y | C | 614 | 10.5 | 1,119 | 19.3 | 1,168 | 20.2 | 1,067 | 18.6 | 1,081 | 18.9 |
| Estonia | Y | C | 91 | 6.8 | 150 | 11.3 | 314 | 23.8 | 265 | 20.1 | 351 | 26.7 |
| Finland | Y | C | 516 | 9.3 | 1,175 | 21.3 | 1,431 | 26.0 | 1,535 | 27.9 | 1,512 | 27.6 |
| France b | N | C | 7,071 | 21.9 | 8,935 | 27.7 | 8,936 | 27.8 | 7,993 | 24.9 | 8,876 | 27.7 |
| Germany | Y | C | 8,664 | 10.4 | 13,495 | 16.3 | 13,293 | 16.1 | 14,051 | 17.0 | 12,858 | 15.6 |
| Greece | Y | C | 382 | 3.6 | 643 | 6.0 | 640 | 6.0 | 672 | 6.2 | 735 | 6.8 |
| Hungary | Y | C | 2,964 | 30.3 | 4,452 | 45.6 | 4,161 | 42.6 | 3,922 | 40.0 | 4,722 | 48.0 |
| Ireland | Y | C | 214 | 4.3 | 347 | 7.1 | 352 | 7.3 | 379 | 7.9 | 299 | 6.3 |
| Italy | Y | C | 2,626 | 4.4 | 3,256 | 5.4 | 3,635 | 6.0 | 3,347 | 5.5 | 4,134 | 6.8 |
| Latvia | Y | C | 296 | 15.5 | 438 | 22.8 | 409 | 21.1 | 225 | 11.5 | 454 | 23.1 |
| Lithuania | Y | C | 498 | 17.8 | 736 | 26.3 | 779 | 27.7 | 1,005 | 35.3 | 1,076 | 37.3 |
| Luxembourg | Y | C | 93 | 14.9 | 131 | 21.3 | 135 | 22.4 | 118 | 20.0 | 108 | 18.7 |
| Malta | Y | C | 176 | 34.2 | 131 | 26.5 | 116 | 24.4 | 107 | 23.2 | 162 | 36.0 |
| Netherlands c | N | C | 695 | 6.2 | 1,197 | 10.8 | 1,061 | 9.6 | 954 | 8.7 | 1,150 | 10.6 |
| Poland | Y | C | 5,205 | 13.7 | 8,373 | 22.0 | 9,064 | 23.9 | 8,921 | 23.5 | 9,718 | 25.6 |
| Portugal | Y | C | 262 | 2.5 | 432 | 4.2 | 302 | 2.9 | 462 | 4.5 | 376 | 3.6 |
| Romania | Y | C | 408 | 2.1 | 1,383 | 7.1 | 1,410 | 7.2 | 1,154 | 5.9 | 1,479 | 7.5 |
| Slovakia | Y | C | 3,387 | 62.1 | 4,992 | 91.6 | 6,791 | 124.8 | 5,789 | 106.5 | 5,299 | 97.7 |
| Slovenia | Y | C | 214 | 10.2 | 362 | 17.4 | 274 | 13.3 | 275 | 13.3 | 311 | 15.1 |
| Spain d , e | N | C | 3,526 | – | 5,087 | – | 8,730 | – | 9,426 | – | 9,818 | – |
| Sweden | Y | C | 825 | 8.0 | 1,990 | 19.5 | 2,041 | 20.2 | 2,280 | 22.8 | 2,247 | 22.8 |
| EU Total 27 | – | – | 52,702 | 13.7 | 78,190 | 20.4 | 82,392 | 20.5 | 81,482 | 20.1 | 84,525 | 20.9 |
| United Kingdom | – | – | – | – | 9,718 | 14.6 | 9,466 | 14.3 | 10,105 | 15.3 | 9,900 | 15.1 |
| EU Total f | – | – | 52,702 | 13.7 | 87,908 | 19.5 | 91,858 | 19.6 | 91,587 | 19.4 | 94,425 | 20.0 |
| Iceland | Y | C | 32 | 8.8 | 50 | 14.0 | 63 | 18.1 | 64 | 18.9 | 39 | 11.7 |
| Norway | Y | C | 441 | 8.2 | 1,092 | 20.5 | 961 | 18.1 | 992 | 18.9 | 865 | 16.6 |
| Switzerland g | Y | C | 1,270 | 14.7 | 1,546 | 18.0 | 1,467 | 17.2 | 1,848 | 21.9 | 1,517 | 18.1 |
–: Data not reported.
Y: yes; N: no; A: aggregated data; C: case‐based data.
Sentinel system; notification rates calculated with an estimated population coverage of 48%.
Sentinel system; notification rates calculated with an estimated population coverage of 64%.
Sentinel surveillance; no information on estimated coverage for 2015–2019. Therefore, the notification rate cannot be estimated.
Data not complete in 2020, rate not estimated.
Cases reported by the United Kingdom in years 2016–2019 were also considered for this estimate (EU‐28). When 2016–2019 UK data were collected, the UK was an EU MS but since 1 February 2020, it has become a third country.
Switzerland provided data directly to EFSA. The human data for Switzerland include data from Liechtenstein.
As in the previous year, the highest notification rates in 2020 were reported by Czechia (98.4 cases per 100,000 population) and Slovakia (62.1 cases per 100,000 population), while the lowest rates were reported by Bulgaria, Greece, Ireland, Italy, Portugal and Romania (≤ 4.4 cases per 100,000 population).
The proportion of domestic vs. travel‐associated cases varied markedly between countries, but most of the confirmed salmonellosis cases were acquired in the EU (63.2%), whereas 1.8% reported travel outside the EU and 35% of infections were of unknown origin (Table 10). Considering all cases in EU MS and non‐MS countries, the highest proportions of domestic cases (over 95%) were reported by Malta, Czechia, Hungary, Latvia, the Netherlands, Slovakia and Germany. The highest proportions of travel‐associated cases were reported by five Nordic countries: Sweden (45.6%), Norway (40.1%), Finland (38.4%), Iceland (21.9%) and Denmark (20%). Of 1,249 travel‐associated cases with known information on the probable country of infection, 77.4% involved travel outside the EU. Thailand, Egypt, Turkey and Indonesia were the most frequently reported travel destinations outside the EU (23.5%, 7.8%, 3.9% and 3.7%, respectively). In the EU, Spain and Poland were the most common travel destinations for human cases.
A seasonal trend was observed for confirmed salmonellosis cases in the EU in 2011–2020, with more cases reported during summer months (Figure 3). A decrease in cases in 2020 was observed, probably due to the COVID‐19 pandemic. Notwithstanding, the overall trend for salmonellosis in 2016–2020 did not show any statistically significant increase or decrease.
Figure 3.

- Source: Austria, Belgium, Czechia, Denmark, Estonia, Greece, Finland, France, Ireland, Italy, Luxembourg, Latvia, Malta, the Netherlands, Poland, Portugal, Romania, Sweden, Slovenia, Slovakia.
Estonia, Finland and Sweden reported a significantly decreasing trend (p < 0.01) in the last 5 years (2016–2020). An increasing trend was not observed in any MS in 2016–2020.
The most affected age groups were 1–4 years (24.5%), 5–9 years (12.6%) and over 65 years old (17.8%). Even though 65.6% of specimens were faeces, it is important to underline that for 28.8% of the samples, information about the specimen was missing. The remaining consisted of 3.4% other, 1.8% blood, 1.3% urine and 0.06% cerebrospinal fluid and pus.
In total, 13 MS provided information on hospitalisation. The proportion of confirmed cases with known hospitalisation information was 39% at the EU level. Among these, the proportion of hospitalised cases was 29.9%, which was lower than in 2019. The highest proportions of hospitalised cases were reported, as in previous years, in Cyprus, Greece and Lithuania. Two of these countries also reported the lowest notification rates of salmonellosis, which might indicate that the surveillance systems in these countries primarily capture the more severe cases. Considering the cases with information on the specimen and hospitalisation, higher rates of cases were reported from blood (89.4%), pus (61.5%), urine (40.4%) and faeces (28.6%).
Overall, 15 MS provided data on the outcome of salmonellosis; this accounted for 57.6% of confirmed cases. Among these, eight reported 57 fatal cases, resulting in an EU case fatality rate of 0.19%.
Human salmonellosis cases and cases associated with foodborne outbreaks
In total, 52,702 confirmed human salmonellosis cases were reported to TESSy in 2020. Overall, 99.1% of reported human salmonellosis cases who acquired the infection in the EU (N = 33,309) (Table 10) were domestic (acquired within the home country) and 0.9% were acquired through travel in EU.
Salmonella was identified overall by 22 MS in 694 FBO, affecting 3,686 people in the EU, with 812 hospitalisations and seven deaths, as reported to EFSA. The majority (57.9%) of the FBO salmonellosis cases were caused by S. Enteritidis. Comparing the FBO outbreak cases (3,686) and confirmed cases, and human salmonellosis cases acquired in the EU (51,215), and also considering the estimated cases with unknown travel data (0.978 × 52,702) (Table 10), it could be suggested that overall in the EU in 2020, only 7.2% of human salmonellosis cases were reported through FBO investigations. It is important to clarify that the classification of cases for reporting is different between these two databases. In TESSy, the reported cases are classified based on the EU case definition. All these cases have visited a doctor and are either confirmed by a laboratory test (confirmed case) or not (probable case and classification is based on the clinical symptoms and epidemiological link). Cases that have never visited a doctor are not reported to TESSy. Moreover, there may be other missing probable cases in TESSy, as these data are not analysed or published and there is no incentive for reporting such cases. Information on which cases are linked to an outbreak and which are not is also not systematically collected. In practice, the cases reported to TESSy are considered mostly as sporadic cases. In foodborne outbreaks, the human cases are the people involved in the outbreak as defined by the investigators (case definition), and cases must be linked, or probably linked, to the same food source (Directive 2003/99/EC). This can include both diseased people (whether confirmed microbiologically or not) and people with confirmed asymptomatic infections (EFSA, 2014).
For the 84 strong‐evidence outbreaks in the EU in 2020 caused by Salmonella, 44.0% were due to ‘eggs and egg products’, 13.1% to ‘pig meat and products thereof’ and 10.7% to ‘bakery products’. Further details and statistics on salmonellosis foodborne outbreaks for 2020 can be found in the FBO chapter.
2.4.3. Salmonella in food
Data collected in the context of Regulation (EC) No 2073/2005 on microbiological criteria
Food safety criteria
The numbers of official single samples collected at manufacturing (N = 18,794 samples, notified by 14 MS) and distribution (N = 19,705 samples, notified by 15 MS), reported according to the criteria defined for this context, were similar in terms of the amount of reported data and the proportion of Salmonella‐positive samples (2.5%) (Table 12). Although Regulation (EC) No 2073/2005 requires the collection of samples for the assessment of FSC when food is placed on the market (distribution level), the number of samples collected at this stage was similar to that collected at the manufacturing phase. This finding could be due to the fact that, to facilitate the retrieval of samples to verify food safety criteria, they are also collected at the end of the manufacturing stage, when food is ready to be placed on the market, and not strictly at distribution.
Table 12.
Proportion (%) of Salmonella‐positive samples from official sampling as part of the verification of Salmonella FSC according to Regulation (EC) No 2073/2005, by stage in the food chain, EU, 2020
| Food matrices | Processing stage (at manufacturing) | Retail (at distribution) | ||||
|---|---|---|---|---|---|---|
| N of MS | N of tested samples | N (%) of tested positives | N of MS | N of tested samples | N (%) of tested positives | |
| Cheeses, butter and cream made from raw milk or milk that has undergone a lower heat treatment than pasteurisation | 6 | 1,574 | 10 (0.64) | 6 | 3,320 | 0 |
| Cooked crustaceans and molluscan shellfish | 4 | 401 | 0 | 8 | 552 | 0 |
| Dried follow‐on formulae | 1 | 60 | 0 | 2 | 166 | 0 |
| Dried infant formulae and dried dietary foods for special medical purposes intended for infants below 6 months of age | 3 | 71 | 0 | 4 | 403 | 0 |
| Egg products, excluding products where the manufacturing process or the composition of the product will eliminate the Salmonella risk | 7 | 203 | 1 (0.49) | 7 | 120 | 0 |
| Fresh poultry meat | 9 | 2,674 | 336 (12.6) | 9 | 4,754 | 349 (7.3) |
| Gelatine and collagen | 2 | 29 | 0 | 3 | 123 | 0 |
| Ice cream, excluding products where the manufacturing process or the composition of the product will eliminate the Salmonella risk | 7 | 529 | 0 | 8 | 727 | 1 (0.14) |
| Live bivalve molluscs and live echinoderms, tunicates and gastropods | 2 | 435 | 2 (0.46) | 3 | 128 | 0 |
| Meat products intended to be eaten raw, excluding products where the manufacturing process or the composition of the product will eliminate the Salmonella risk | 7 | 574 | 5 (0.87) | 8 | 907 | 3 (0.33) |
| Meat products made from poultry meat intended to be eaten cooked | 4 | 56 | 3 (5.4) | 4 | 276 | 21 (7.6) |
| Mechanically separated meat (MSM) | 6 | 145 | 18 (12.4) | 4 | 66 | 1 (1.5) |
| Milk powder and whey powder | 7 | 152 | 0 | 6 | 103 | 0 |
| Minced meat and meat preparations intended to be eaten raw | 1 | 93 | 0 | 2 | 112 | 0 |
| Minced meat and meat preparations made from other species than poultry intended to be eaten cooked | 9 | 4,581 | 54 (1.2) | 13 | 4,338 | 60 (1.4) |
| Minced meat and meat preparations made from poultry meat intended to be eaten cooked | 9 | 6,853 | 43 (0.63) | 12 | 1,107 | 63 (5.7) |
| Precut fruit and vegetables (ready‐to‐eat) | 6 | 251 | 0 | 11 | 1,329 | 0 |
| Ready‐to‐eat foods containing raw egg, excluding products where the manufacturing process or the composition of the product will eliminate the Salmonella risk | – | – | – | 2 | 35 | 0 |
| Sprouted seeds (ready‐to‐eat) | 5 | 47 | 0 | 6 | 226 | 1 (0.44) |
| Unpasteurised fruit and vegetable juices (ready‐ to‐eat) | 3 | 66 | 0 | 6 | 913 | 0 |
| EU Total | 14 | 18,794 | 472 (2.5) | 15 | 19,705 | 499 (2.5) |
MS: Member States; FSC: Food Safety Criteria; RTE: ready‐to‐eat.
At distribution level, the following three categories were those with the highest proportions of Salmonella‐positive samples: ‘meat products made from poultry meat intended to be eaten cooked’: 7.6%, ‘fresh poultry meat’: 7.3% and ‘minced meat and meat preparations made from poultry meat intended to be eaten cooked’: 5.7%. Then, for ‘mechanically separated meat (MSM)’ and ‘minced meat and meat preparations made from other species than poultry intended to be eaten cooked’ and ‘meat products intended to be eaten raw, excluding products where the manufacturing process or the composition of the product will eliminate the Salmonella risk’, about 1% of the collected official samples was positive for Salmonella. For the other food matrices covered by the Regulation, the percentage of positive samples was consistently lower than 0.4% and for the majority of them, no Salmonella‐positive samples were reported.
At manufacturing level, the highest percentages of Salmonella‐positive samples were reported from ‘fresh poultry meat’ (12.6%), ‘MSM’ (12.4%) and ‘meat products made from poultry intended to be eaten cooked’ (5.4%). For ‘minced meat and meat preparations made from other species than poultry meat intended to be eaten cooked’ and ‘meat products intended to be eaten raw, excluding products where the manufacturing process or the composition of the product will eliminate the Salmonella risk’, the percentage of Salmonella‐positive samples was about 1%. Lastly, some isolations of Salmonella were reported for ‘cheeses, butter and cream made from raw milk or milk that has undergone a lower heat treatment than pasteurisation’ (0.64%), ‘minced meat and meat preparations made from poultry meat intended to be eaten cooked’ (0.63%), ‘egg products, excluding products where the manufacturing process or the composition of the product will eliminate the Salmonella risk’ (0.49%) and ‘live bivalve molluscs and live echinoderms, tunicates and gastropods’ (0.46%).
As already pointed out in previous years, data reported for 2020 in the context of Regulation (EC) No 2073/2005 on microbiological criteria were unevenly distributed across MS and unrepresentative of the EU situation since, especially for some food matrices, the collected data were provided by few MS.
Process hygiene criteria
Carcases of pigs
Salmonella PHC monitoring data from pig carcases collected at the slaughterhouse after dressing but before chilling were provided by 20 MS. One MS (Cyprus) reported official control data only; 13 MS (Austria, Denmark, Estonia, France, Germany, Greece, Latvia, Luxembourg, Malta, the Netherlands, Portugal, Slovakia and Slovenia) reported FBOp own‐check data only, and six MS (Belgium, Bulgaria, Ireland, Italy, Romania and Spain) reported both samplers’ data (Table 13). Considering all data sent by the 20 MS, the overall proportion of Salmonella‐positive samples based on official controls was 3.6% (N = 12,319) and was significantly higher than that based on own‐checks (1.7%, N = 98,537). The same finding was made overall for the six MS that reported data collected by the CA (3.6%) and FBOp (1.8%), as well as considering data reported by Belgium, Ireland, Italy and Spain. Regardless of the sampler (CA or FBOp), the proportion of Salmonella‐positive pig carcases ranged from zero (reported by Cyprus, Greece, Latvia and Slovakia) to 14.3% reported by Spain for samples collected by the CA.
Table 13.
Comparisons of proportions (%) of Salmonella‐positive single samples from pig carcases after dressing, but before chilling, by sampler, reporting MS, EU, 2020
| Country | Competent authority (CA) | Food business operator (FBOp) | p‐value b | Interpretation | ||||
|---|---|---|---|---|---|---|---|---|
| N samples tested | N (%) samples positive | CI95 | N samples tested | N (%) samples positive | CI95 | |||
| Austria | – | – | – | 4,746 | 6 (0.13) | [0.05; 0.27] | – | – |
| Belgium | 1,069 | 56 (5.2) | [4.0; 6.8] | 3,701 | 51 (1.4) | [1.0; 1.8] | < 0.001 | CA > FBOp |
| Bulgaria | 1,781 | 2 (0.11) | [0.01; 0.41] | 226 | 0 | [0; 1.6] a | NS | |
| Cyprus | 5 | 0 | [–] | – | – | – | – | – |
| Denmark | – | – | – | 11,202 | 101 (0.90) | [0.73; 1.1] | – | – |
| Estonia | – | – | – | 1,538 | 5 (0.33) | [0.11; 0.76] | – | – |
| France | – | – | – | 14,347 | 687 (4.8) | [4.4; 5.2] | – | – |
| Germany | – | – | – | 22,164 | 105 (0.47) | [0.39; 0.57] | – | – |
| Greece | – | – | – | 312 | 0 | [0; 1.2] a | – | – |
| Ireland | 324 | 19 (5.9) | [3.6; 9.0] | 2,155 | 38 (1.8) | [1.3; 2.4] | < 0.001 | CA > FBOp |
| Italy | 6,149 | 241 (3.9) | [3.5; 4.4] | 13,344 | 188 (1.4) | [1.2; 1.6] | < 0.001 | CA > FBOp |
| Latvia | – | – | – | 439 | 0 | [0; 0.84] a | – | – |
| Luxembourg | – | – | – | 310 | 1 (0.32) | [0.01; 1.8] | – | – |
| Malta | – | – | – | 130 | 3 (2.3) | [0.48; 6.6] | – | – |
| Netherlands | – | – | – | 5,400 | 139 (2.6) | [2.2; 3.0] | – | – |
| Portugal | – | – | – | 8,793 | 97 (1.1) | [0.9; 1.3] | – | – |
| Romania | 2,131 | 1 (0.05) | [0; 0.26] | 3,265 | 4 (0.12) | [0.03; 0.31] | NS | |
| Slovakia | – | – | – | 2,661 | 0 | [0; 0.14] a | – | – |
| Slovenia | – | – | – | 933 | 21 (2.3) | [1.4; 3.4] | – | – |
| Spain | 860 | 123 (14.3) | [12.0; 16.8] | 2,871 | 186 (6.5) | [5.6; 7.4] | < 0.001 | CA > FBOp |
| Total EU | 12,319 | 442 (3.6) | [3.3; 3.9] | 98,537 | 1,632 (1.7) | [1.6; 1.7] | < 0.001 | CA > FBOp |
| Total EU providing CA and FBOp data | 12,314 | 442 (3.6) | [3.3; 3.9] | 25,562 | 467 (1.8) | [1.7; 2.0] | < 0.001 | CA > FBOp |
–: Data not reported.
[–]: The confidence interval is not provided because of the small sample size.
One‐sided, 97.5% confidence interval.
p‐value: NS, not significant.
Finland, Sweden and Norway, which are countries with special guarantees in relation to Salmonella on pig carcases (according to Regulation (EU) No 853/2004), reported the following monitoring results: Finland no positive samples out of 6,197 tested by the FBOp, Norway one positive out of 3,040 official samples (0.03%) and Sweden three positive out of 6,757 official samples (0.04%). Moreover, Switzerland reported zero positive out of 1,112 tested samples collected by the FBOp.
Carcases of broilers
As regards Salmonella PHC monitoring data from neck skin samples collected at the slaughterhouse from broiler carcases after chilling, 17 MS provided data. Six MS (Bulgaria, Cyprus, Czechia, Greece, Malta and Slovakia) reported official control data only; six MS (Austria, Estonia, France, Germany, Portugal and Slovenia) reported only FBOp own‐check data; and five MS (Belgium, Ireland, Italy, Romania and Spain) reported both samplers’ data (Table 14). Considering all data sent by the 17 MS, the overall proportion of Salmonella‐positive samples based on official controls was 15% (N = 5,928) and there was a notable difference with the proportion based on FBOp own‐check samples, which was significantly lower (3.3%, N = 45,531). Similarly, for all five MS that reported data collected by both samplers, the proportion detected in samples collected by the CA (14.6%) was significantly higher than that reported by the FBOp (4.1%). Regardless of the sampling context (CA or FBOp), the percentage of Salmonella‐positive broiler carcases ranged from zero (reported by Estonia, Ireland, Malta, Portugal, Spain and Sweden) to 40.3% reported by Slovakia for samples collected by the CA.
Table 14.
Comparisons of proportions (%) of Salmonella‐positive single samples from broiler carcases (neck skin samples) after chilling, by sampler, reporting MS, EU, 2020
| Country | Competent authority (CA) | Food business operator (FBOp) | p‐value b | Interpretation | ||||
|---|---|---|---|---|---|---|---|---|
| N samples Tested | N (%) samples Positive | CI95 | N samples Tested | N (%) samples Positive | CI95 | |||
| Austria | – | – | – | 1,010 | 269 (26.6) | [23.9; 29.5] | – | – |
| Belgium | 655 | 56 (8.6) | [6.5; 11.0] | 2,578 | 150 (5.8) | [5.0; 6.8] | 0.0053 | CA > FBOp |
| Bulgaria | 110 | 1 (0.91) | [0.02; 5.0] | – | – | – | – | – |
| Cyprus | 230 | 35 (15.2) | [10.8; 20.5] | – | – | – | – | – |
| Czechia | 1,035 | 13 (1.3) | [0.67; 2.1] | – | – | – | – | – |
| Estonia | – | – | – | 260 | 0 | [0; 1.4] a | – | – |
| France | – | – | – | 12,520 | 422 (3.4) | [3.1; 3.7] | – | – |
| Germany | – | – | – | 16,136 | 280 (1.7) | [1.5; 2.0] | – | – |
| Greece | 50 | 4 (8) | [2.2; 19.2] | – | – | – | – | – |
| Ireland | 258 | 0 | [0; 1.4] a | 1,045 | 0 | [0; 0.35] a | < 0.001 | CA > FBOp |
| Italy | 786 | 193 (24.6) | [21.6; 27.7] | 5,677 | 330 (5.8) | [5.2; 6.5] | < 0.001 | CA > FBOp |
| Malta | 63 | 0 | [0; 5.7] a | – | – | – | – | – |
| Portugal | – | – | – | 2,806 | 0 | [0; 0.13] a | – | – |
| Romania | 698 | 71 (10.2) | [8.0; 12.7] | 2,208 | 21 (0.95) | [0.59; 1.5] | < 0.001 | CA > FBOp |
| Slovakia | 745 | 300 (40.3) | [36.7; 43.9] | – | – | – | – | – |
| Slovenia | – | – | – | 636 | 25 (3.9) | [2.6; 5.8] | – | – |
| Spain | 1,298 | 219 (16.9) | [14.9; 19.0] | 655 | 0 | [0; 0.56] a | < 0.001 | CA > FBOp |
| Total EU | 5,928 | 892 (15.0) | [14.1; 16.0] | 45,531 | 1,497 (3.3) | [3.1; 3.5] | < 0.001 | CA > FBOp |
| Total EU providing CA and FBOp data | 3,695 | 539 (14.6) | [13.5; 15.8] | 12,163 | 501 (4.1) | [3.8; 4.5] | < 0.001 | CA > FBOp |
–: Data not reported.
One‐sided, 97.5% confidence interval.
p‐value: NS, not significant.
Finland, Sweden and Norway, which are countries with special guarantees in relation to Salmonella on broiler carcases (according to Regulation (EU) No 853/2004), reported the following monitoring results: Sweden no positive out of 2,154 tested samples collected by the CA, whereas Norway and Finland did not report data for broiler carcases. Moreover, Switzerland reported four positive out of 780 tested broiler samples collected by the FBOp (0.51%).
Carcases of turkeys
Considering Salmonella PHC monitoring data from neck skin samples collected at the slaughterhouse from turkey carcases after chilling, 10 MS provided data. Spain reported official control data only; five MS (Austria, France, Germany, Portugal and Slovenia) reported own‐check data collected from the FBOp only; and four MS (Belgium, Ireland, Italy and Romania) reported both samplers’ data (Table 15). Considering all data sent by the 10 MS, the overall percentage of Salmonella‐positive samples based on official controls was 15% (N = 466) and was significantly higher than the percentage based on own‐check samples by the FBOp (3.2%, N = 6,924). The same finding was made considering the overall proportion of positive samples of the four MS that reported data by both samplers, but this overall outcome was strongly influenced by the large Italian data set that contributed with high proportions of positive results from the CA and FBOp. High variability in terms of Salmonella‐positive turkey carcases was reported among the MS and the percentage ranged from zero, reported by Ireland, Portugal, Romania and Sweden, to 27.3%, reported by Italy for samples collected by the CA.
Table 15.
Comparisons of proportions (%) of Salmonella‐positive single samples from turkey carcases (neck skin samples) after chilling, by sampler, reporting MS, EU, 2020
| Country | Competent authority (CA) | Food business operator (FBOp) | p‐value b | Interpretation | ||||
|---|---|---|---|---|---|---|---|---|
| N samples tested | N (%) samples positive | CI95 | N samples tested | N (%) samples positive | CI95 | |||
| Austria | – | – | – | 140 | 1 (0.71) | [0.02; 3.9] | – | – |
| Belgium | 51 | 0 | [0; 7.0] a | 190 | 1 (0.53) | [0.01; 2.9] | NS | |
| France | – | – | – | 2,352 | 111 (4.7) | [3.9; 5.7] | – | – |
| Germany | – | – | – | 1,895 | 18 (0.95) | [0.56; 1.5] | – | – |
| Ireland | 14 | 0 | [0; 23.2] a | 176 | 0 | [0; 2.1] a | NS | |
| Italy | 99 | 27 (27.3) | [18.8; 37.2] | 1,110 | 89 (8.0) | [6.5; 9.8] | < 0.001 | CA > FBOp |
| Portugal | – | – | – | 839 | 0 | [0; 0.4] a | – | – |
| Romania | 40 | 0 | [0; 8.8] a | 40 | 0 | [0; 8.8] a | NS | |
| Slovenia | – | – | – | 182 | 4 (2.2) | [0.6; 5.5] | – | – |
| Spain | 262 | 43 (16.4) | [12.1; 21.5] | – | – | – | – | – |
| Total EU | 466 | 70 (15.0) | [11.9; 18.6] | 6,924 | 224 (3.2) | [2.8; 3.7] | < 0.001 | CA > FBOp |
| Total EU providing CA and FBOp data | 204 | 27 (13.2) | [8.9; 18.7] | 1516 | 90 (5.9) | [4.8; 7.3] | < 0.001 | CA > FBOp |
–: Data not reported.
One‐sided, 97.5% confidence interval.
p‐value: NS, not significant.
Finland, Sweden and Norway, which are countries with special guarantees in relation to Salmonella on turkey carcases (according to Regulation (EU) No 853/2004), reported the following monitoring results: Sweden no positive out of 138 tested samples collected by the CA, whereas Norway and Finland did not report data for turkey carcases. Moreover, Switzerland reported three positive out of 125 tested turkey samples collected by the FBOp (2.4%).
Carcases of cattle
As regards Salmonella PHC monitoring data from bovine carcases collected at the slaughterhouse after dressing, but before chilling, 18 MS provided data. Estonia and the Netherlands reported official control data only; 10 MS (Austria, Denmark, France, Germany, Ireland, Luxembourg, Malta, Portugal, Slovakia and Slovenia) reported FBOp own‐check data only; and six MS (Belgium, Bulgaria, Greece, Italy, Romania and Spain) reported both samplers’ data (Table 16). Considering all data sent by the 18 MS, the overall percentage of Salmonella‐positive samples based on official controls was 1.6% (N = 6,092) and was significantly higher than that based on own‐checks (0.18%, N = 67,514). The same finding was made considering all bovine carcase data sent by the six MS providing both CA (1.6%) and FBOp (0.09%) data, as well as data sent by Belgium, Italy and Spain. Regardless of the sampling context (CA or FBOp), the percentage of Salmonella‐positive bovine carcases ranged from zero, reported by seven MS (Bulgaria, Estonia, Greece, Luxembourg, Romania, Slovakia and Slovenia), to 12.3%, reported by Malta in samples collected by the FBOp.
Table 16.
Comparisons of proportions (%) of Salmonella‐positive single samples from bovine carcases after dressing but before chilling, by sampler, reporting MS, EU, 2020
| Country | Competent authority (CA) | Food business operator (FBOp) | p‐value b | Interpretation | ||||
|---|---|---|---|---|---|---|---|---|
| N samples tested | N (%) samples positive | CI95 | N samples tested | N (%) samples positive | CI95 | |||
| Austria | – | – | – | 2,678 | 2 (0.07) | [0.01; 0.27] | – | – |
| Belgium | 1,309 | 5 (0.38) | [0.12; 0.89] | 2,945 | 1 (0.03) | [0; 0.19] | 0.0123 | CA > FBOp |
| Bulgaria | 203 | 0 | [0; 1.8] a | 95 | 0 | [0; 3.8] a | NS | |
| Denmark | – | – | – | 4,104 | 11 (0.27) | [0.13; 0.48] | – | – |
| Estonia | 212 | 0 | [0; 1.7] a | – | – | – | – | – |
| France | – | – | – | 17,913 | 46 (0.26) | [0.19; 0.34] | – | – |
| Germany | – | – | – | 8,406 | 5 (0.06) | [0.02; 0.14] | – | – |
| Greece | 12 | 0 | [0; 26.5] a | 113 | 0 | [0; 3.2] a | NS | |
| Ireland | – | – | – | 6,216 | 1 (0.02) | [0; 0.09] | – | – |
| Italy | 2,292 | 83 (3.6) | [2.9; 4.5] | 15,057 | 19 (0.13) | [0.08; 0.20] | < 0.001 | CA > FBOp |
| Luxembourg | – | – | – | 270 | 0 | [0; 1.4] a | – | – |
| Malta | – | – | – | 130 | 16 (12.3) | [7.2; 19.2] | – | – |
| Netherlands | 101 | 2 (2) | [0.24; 7.0] | – | – | – | – | – |
| Portugal | – | – | – | 3,603 | 23 (0.64) | [0.41; 0.96] | – | – |
| Romania | 1,430 | 0 | [0; 0.26] a | 2,331 | 0 | [0; 0.16] a | NS | |
| Slovakia | – | – | – | 1,582 | 0 | [0; 0.23] a | – | – |
| Slovenia | – | – | – | 1,216 | 0 | [0; 0.30] a | – | – |
| Spain | 533 | 6 (1.1) | [0.41; 2.4] | 855 | 0 | [0; 0.43] a | 0.0032 | CA > FBOp |
| Total EU | 6,092 | 96 (1.6) | [1.3; 1.9] | 67,514 | 124 (0.18) | [0.15; 0.22] | < 0.001 | CA > FBOp |
| Total EU providing CA and FBOp data | 5,779 | 94 (1.6) | [1.3; 2.0] | 21,396 | 20 (0.09) | [0.06; 0.14] | < 0.001 | CA > FBOp |
–: Data not reported.
One‐sided, 97.5% confidence interval.
p‐value: NS, not significant.
Finland, Sweden and Norway, which are countries with special guarantees in relation to Salmonella on bovine carcases (according to Regulation (EU) No 853/2004), reported the following monitoring results: Finland no positive out of 3,268 tested samples collected by the FBOp, Norway no positive out of 2,865 tested samples collected by the CA and Sweden one positive out of 3,557 tested samples collected by CA.
Carcases of sheep
Salmonella PHC monitoring data from sheep carcases collected at the slaughterhouse after dressing but before chilling were provided by 15 MS. Ten MS reported FBOp own‐check data only (Austria, Bulgaria, France, Germany, Ireland, Luxembourg, Malta, Portugal, Slovakia and Slovenia) and five MS (Belgium, Greece, Italy, Romania and Spain) reported samples from both the CA and FBOp (Table 17). Considering all data sent by the 15 MS, the overall percentage of Salmonella‐positive samples based on own‐check controls was 0.55% (N = 16,829), but was not significantly higher than that based on official controls (0.45%, N = 1,115). At the level of the MS providing both CA and FBOp data, the percentage of Salmonella‐positive carcases reported by CA (1.1%) was significantly higher than that for own‐check controls by FBOp (0.1%) for Italy. Regardless of the sampling context (CA or FBOp), the percentage of Salmonella‐positive sheep carcases ranged from zero (reported by several MS) to 1.1% reported by Italy in samples collected by the CA.
Table 17.
Comparisons of proportions (%) of Salmonella‐positive single samples from sheep carcases after dressing but before chilling, by sampler, reporting MS, EU, 2020
| Country | Competent authority (CA) | Food business operator (FBOp) | p‐value b | Interpretation | ||||
|---|---|---|---|---|---|---|---|---|
| N samples tested | N (%) samples positive | CI95 | N samples tested | N (%) samples positive | CI95 | |||
| Austria | – | – | – | 315 | 2 (0.63) | [0.08; 2.3] | – | – |
| Belgium | 414 | 3 (0.72) | [0.15; 2.1] | 622 | 1 (0.16) | [0; 0.89] | NS | |
| Bulgaria | – | – | – | 258 | 0 | [0; 1.4] a | – | – |
| France | – | – | – | 6,392 | 65 (1.0) | [0.79; 1.3] | – | – |
| Germany | – | – | – | 659 | 1 (0.15) | [0; 0.84] | – | – |
| Greece | 25 | 0 | [0; 13.7] a | 80 | 0 | [0; 4.5] a | NS | |
| Ireland | – | – | – | 1,493 | 0 | [0; 0.25] a | – | – |
| Italy | 175 | 2 (1.1) | [0.14; 4.1] | 2,988 | 3 (0.1) | [0.02; 0.29] | 0.0272 | CA > FBOp |
| Luxembourg | – | – | – | 18 | 0 | [0; 18.5] a | – | – |
| Malta | – | – | – | 100 | 1 (1.0) | [0.03; 5.5] | – | – |
| Portugal | – | – | – | 2,844 | 19 (0.67) | [0.4; 1.0] | – | – |
| Romania | 390 | 0 | [0; 0.94] a | 530 | 0 | [0; 0.69] a | NS | |
| Slovakia | – | – | – | 292 | 0 | [0; 1.3] a | – | – |
| Slovenia | – | – | – | 73 | 0 | [0; 4.9] a | – | – |
| Spain | 111 | 0 | [0; 3.3] a | 165 | 0 | [0; 2.2] a | NS | |
| Total EU | 1,115 | 5 (0.45) | [0.15; 1.0] | 16,829 | 92 (0.55) | [0.44; 0.67] | NS | |
| Total EU providing CA and FBOp data | 1,115 | 5 (0.45) | [0.15; 1.0] | 4,385 | 4 (0.09) | [0.02; 0.23] | 0.0206 | CA > FBOp |
–: Data not reported.
One‐sided, 97.5% confidence interval.
p‐value: NS, not significant.
Carcases of goats
Salmonella PHC monitoring data for carcases of goats collected at the slaughterhouse after dressing, but before chilling, were provided by 10 MS. Spain reported official control data only; nine MS (Austria, France, Germany, Greece, Malta, Portugal, Slovakia and Slovenia) reported FBOp own‐check data only; and Belgium provided data collected by both the CA and FBOp (Table 18). Considering all data sent by the 10 MS, two of the 171 (1.2%) samples tested by the CA were positive for Salmonella, compared to 27 of the 913 samples collected by the FBOp (3%). France notified 25 out of the total of 27 positive samples collected by the FBOp. There was no significant difference between the proportion of positive samples from the CA and FBOp.
Table 18.
Comparisons of proportions (%) of Salmonella‐positive single samples from goat carcases after dressing but before chilling, by sampler, reporting MS, EU, 2020
| Country | Competent authority (CA) | Food business operator (FBOp) | p‐value b | Interpretation | ||||
|---|---|---|---|---|---|---|---|---|
| N samples tested | N (%) samples positive | CI95 | N samples tested | N (%) samples positive | CI95 | |||
| Austria | – | – | – | 6 | 0 | – | – | – |
| Belgium | 121 | 0 | [0; 3.0] a | 40 | 0 | [0; 8.8] a | NS | |
| France | – | – | – | 315 | 25 (7.9) | [5.2; 11.5] | – | – |
| Germany | – | – | – | 17 | 0 | [0; 19.5] a | – | – |
| Greece | – | – | – | 9 | 0 | – | – | – |
| Malta | – | – | – | 30 | 0 | [0; 11.6] a | – | – |
| Portugal | – | – | – | 483 | 2 (0.41) | [0.05; 1.5] | – | – |
| Slovakia | – | – | – | 4 | 0 | – | – | – |
| Slovenia | – | – | – | 9 | 0 | – | – | – |
| Spain | 50 | 2 (4.0) | [0.49; 13.7] | – | – | – | – | – |
| Total EU | 171 | 2 (1.2) | [0.14; 4.2] | 913 | 27 (3.0) | [2.0; 4.3] | NS | |
| Total EU providing CA and FBOp data | 121 | 0 | [0; 3.0] a | 40 | 0 | [0; 8.8] a | NS | |
–: Data not reported.
One‐sided, 97.5% confidence interval.
p‐value: NS, not significant.
Carcases of horses
Salmonella PHC monitoring data from horse carcases collected at the slaughterhouse after dressing, but before chilling, were provided by 10 MS. Spain reported official control data only; six MS (Austria, France, Germany, Ireland, Portugal and Slovenia) reported FBOp own‐check data only; and three MS (Belgium, Italy and Romania) reported both samplers’ data (Table 19). Considering all data sent by the 10 MS, the overall percentage of Salmonella‐positive samples based on FBOp own‐checks was 0.35% (N = 1,713), but was not significantly higher than that based on official controls (0.26%, N = 380). Regardless of the sampling context (CA or FBOp), the percentage of Salmonella‐positive horse carcases ranged from zero, reported by the majority of the reporting MS, to 1.4% reported by Ireland for samples collected by the FBOp.
Table 19.
Comparisons of proportions (%) of Salmonella‐positive single samples from horse carcases before chilling, by sampler, reporting MS, EU, 2020
| Country | Competent authority (CA) | Food business operator (FBOp) | p‐value b | Interpretation | ||||
|---|---|---|---|---|---|---|---|---|
| N samples tested | N (%) samples positive | CI95 | N samples tested | N (%) samples positive | CI95 | |||
| Austria | – | – | – | 1 | 0 | – | – | – |
| Belgium | 89 | 0 | [0; 4.1] a | 196 | 0 | [0; 1.9] a | NS | |
| France | – | – | – | 75 | 0 | [0; 4.8] a | – | – |
| Germany | – | – | – | 11 | 0 | [0; 28.5] a | – | – |
| Ireland | – | – | – | 73 | 1 (1.4) | [0.03; 7.4] | – | – |
| Italy | 82 | 0 | [0; 4.4] a | 963 | 1 (0.1) | [0; 0.58] | NS | |
| Portugal | – | – | – | 37 | 0 | [0; 9.5] a | – | – |
| Romania | 181 | 1 (0.55) | [0.01; 3.0] | 336 | 4 (1.2) | [0.33; 3.0] | NS | |
| Slovenia | – | – | – | 21 | 0 | [0; 16.1] a | – | – |
| Spain | 28 | 0 | [0; 12.3] a | – | – | – | – | – |
| Total EU | 380 | 1 (0.26) | [0.01; 1.5] | 1,713 | 6 (0.35) | [0.13; 0.76] | NS | |
| Total EU providing CA and FBOp data | 352 | 1 (0.28) | [0.01; 1.6] | 1,495 | 5 (0.33) | [0.11; 0.78] | NS | |
–: Data not reported.
One‐sided, 97.5% confidence interval.
p‐value: NS, not significant.
Occurrence in food
Monitoring data reported from food samples, which do not fit with the criteria described in the previous paragraphs, were described by merging investigations from all sampling stages (primary production, manufacturing, distribution, other and unspecified), all samplers except ‘HACCP and own‐checks’ and ‘private sampling’ and all sampling units (single, batch and slaughter animal batch). Only samples collected through ‘objective sampling’ were considered in this context.
RTE food and non‐RTE food
For 2020, 69,898 RTE and 207,750 non‐RTE food sampling units were reported from 22 and 25 MS with 0.15% and 2.4% positive samples, respectively (Table 20).
Table 20.
Occurrence of Salmonella in major food categories, EU, 2020
| Food | 2020 | 2016–2019 a | ||||
|---|---|---|---|---|---|---|
| N reporting MS | N sampled units | Positive N (%) | N reporting MS | N sampled units | Positive N (%) | |
| RTE food | ||||||
| All | 22 | 69,898 | 107 (0.15) | 25 | 254,420 | 726 (0.29) |
| Meat and meat products | 19 | 11,962 | 57 (0.48) | 23 | 63,021 | 297 (0.47) |
| Meat and meat products from broilers | 12 | 489 | 8 (1.64) | 18 | 5,290 | 17 (0.32) |
| Meat and meat products from turkeys | 10 | 219 | 1 (0.46) | 13 | 1,666 | 6 (0.36) |
| Meat and meat products from pigs | 16 | 4,056 | 23 (0.57) | 19 | 28,478 | 116 (0.41) |
| Meat and meat products from bovine animals | 14 | 620 | 1 (0.16) | 20 | 4,523 | 14 (0.31) |
| Mixed | 12 | 1,376 | 0 | 14 | 4,424 | 21 (0.47) |
| Other meat and meat products | 12 | 5,167 | 24 (0.46) | 17 | 18,325 | 122 (0.67) |
| Milk and milk products | 20 | 25,293 | 19 (0.08) | 24 | 78,603 | 102 (0.13) |
| Milk | 9 | 1,237 | 0 | 13 | 1,709 | 1 (0.06) |
| Raw milk b | 5 | 794 | 0 | 5 | 1,097 | 0 |
| Cheese | 18 | 12,566 | 18 (0.14) | 23 | 41,353 | 65 (0.16) |
| Dairy products excluding cheeses (butter, cream, ice cream, whey, yoghurt and fermented dairy products) | 19 | 11,475 | 1 (0.01) | 21 | 35,452 | 36 (0.11) |
| Fruits and vegetables and juices | 18 | 6,183 | 5 (0.08) | 19 | 17,386 | 17 (0.10) |
| Fish and fishery products | 19 | 3,161 | 0 | 22 | 12,320 | 12 (0.10) |
| Spices and herbs | 17 | 1,561 | 13 (0.83) | 18 | 5,349 | 48 (0.90) |
| Bakery products | 16 | 4,813 | 0 | 17 | 14,787 | 38 (0.26) |
| Salads | 12 | 3,519 | 2 (0.06) | 14 | 11,833 | 49 (0.41) |
| Other processed food products and prepared dishes | 15 | 7,771 | 8 (0.10) | 15 | 31,165 | 121 (0.39) |
| Eggs and egg products | 6 | 44 | 0 | 6 | 242 | 0 |
| Sprouts (sprouted seeds) | 10 | 388 | 1 (0.26) | 11 | 1,045 | 2 (0.19) |
| Cereals and nuts | 13 | 1,330 | 1 (0.08) | 14 | 2,118 | 2 (0.09) |
| Confections | 4 | 218 | 0 | 6 | 5,069 | 7 (0.14) |
| Infant formulae and follow‐on formulae–RTE | 13 | 1,294 | 0 | 17 | 4,559 | 22 (0.48) |
| Foodstuffs intended for special nutritional uses | 11 | 672 | 1 (0.15) | 14 | 1,836 | 1 (0.05) |
| Non‐RTE food | ||||||
| All | 25 | 207,750 | 4,931 (2.37) | 28 | 968,727 | 21,130 (2.18) |
| Meat and meat products | 24 | 186,577 | 4,856 (2.60) | 28 | 885,551 | 20,782 (2.35) |
| Meat and meat products from broilers | 24 | 41,750 | 2,751 (6.59) | 26 | 137,014 | 8,700 (6.35) |
| Meat and meat products from turkeys | 22 | 3,685 | 261 (7.08) | 24 | 22,807 | 1,229 (5.39) |
| Meat and meat products from pigs | 24 | 72,779 | 1,181 (1.62) | 28 | 368,796 | 6,689 (1.81) |
| Meat and meat products from bovine animals | 23 | 40,637 | 186 (0.46) | 25 | 119,470 | 409 (0.34) |
| Mixed | 14 | 4,503 | 57 (1.27) | 18 | 24,029 | 223 (0.93) |
| Other meat and meat products | 21 | 23,223 | 420 (1.81) | 24 | 213,435 | 3,532 (1.65) |
| Milk and milk products | 10 | 1,278 | 0 | 13 | 4,119 | 1 (0.02) |
| Fruits, vegetables and juices | 14 | 1,748 | 1 (0.06) | 20 | 7,825 | 53 (0.68) |
| Fish and fishery products | 19 | 7,352 | 31 (0.42) | 22 | 21,598 | 120 (0.56) |
| Eggs and egg products | 15 | 5,554 | 35 (0.63) | 21 | 28,190 | 78 (0.28) |
| Sprouts (sprouted seeds) | 4 | 371 | 2 (0.54) | 11 | 1,420 | 3 (0.21) |
| Infant formulae | 2 | 42 | 0 | 4 | 244 | 0 |
| Foodstuffs intended for special nutritional uses | 6 | 209 | 0 | 7 | 924 | 3 (0.32) |
| Cereals, dried seeds | 10 | 461 | 1 (0.22) | 17 | 2,748 | 61 (2.2) |
| Other processed food products and prepared dishes | 12 | 3,221 | 5 (0.16) | 17 | 10,713 | 13 (0.12) |
| Fresh meat | ||||||
| All | 24 | 149,636 | 4,043 (2.70) | 28 | 655,108 | 17,343 (2.65) |
| Fresh meat from broilers | 24 | 31,436 | 2,519 (8.01) | 26 | 114,178 | 7,748 (6.79) |
| Fresh meat from turkeys | 20 | 3,124 | 222 (7.11) | 21 | 17,019 | 1,019 (5.99) |
| Fresh meat from pigs | 22 | 62,341 | 1,004 (1.61) | 28 | 301,319 | 5,852 (1.94) |
| Fresh meat from bovine animals | 21 | 37,866 | 153 (0.40) | 24 | 99,817 | 282 (0.28) |
| Other fresh meat | 19 | 14,869 | 145 (0.9) | 22 | 122,775 | 2,442 (1.99) |
MS: Member States; RTE: ready‐to‐eat.
Since 1 February 2020, the United Kingdom has been a third country. The United Kingdom’s data are included for 2016–2019, whereas for 2020, the United Kingdom’s data are not included.
The raw RTE milk sampling units are a subset of RTE milk.
Within the category of RTE food, the highest percentages of positive samples were from ‘meat and meat products from broilers’ (1.6%), ‘spices and herbs’ (0.83%), ‘meat and meat products from pigs’ (0.57%), ‘meat and meat products from turkeys’ (0.46%) and ‘other meat and meat products’ (0.46%).
Within the category of non‐RTE food, the highest percentages of positive samples were reported for ‘meat and meat products from turkeys’ (7.1%), ‘meat and meat products from broilers’ (6.6%) and ‘meat and meat products from pigs’ (1.6%). Some isolations of Salmonella were also reported from ‘eggs and egg products’ (0.63%), ‘sprouts’ (0.54%) and ‘fish and fishery products’ (0.42%).
Comparing the results for the year 2020 and the 4‐year period of 2016–2019, the overall percentage of Salmonella‐positive samples decreased in RTE food in 2020. In detail, the greatest reductions in Salmonella positivity were found for ‘infant formulae and follow‐on formulae–RTE’, ‘mixed meat’, ‘salads’, ‘other processed food products and prepared dishes’, ‘bakery products’, ‘other meat and meat products’ and ‘meat and meat products from bovine animals’. In contrast, increases were reported for ‘meat and meat products from broilers’, ‘meat and meat products from pigs’ and ‘meat and meat products from turkeys’. Regarding non‐RTE food, the percentage of Salmonella‐positive sampling units could be considered rather comparable over the years except for ‘meat and meat products from turkeys’, ‘mixed meat’, ‘eggs and egg products’ and ‘sprouts’ for which an increase in the last year was reported. For most of the other non‐RTE matrices, a decrease in Salmonella isolation was reported.
Fresh meat
From fresh meat, 2.7% of sampling units were positive for 2020. Within this category, the highest percentages of positive samples were reported for ‘fresh meat from broilers’ (8.0%) and ‘fresh meat from turkeys’ (7.1%) and this was also the case for the years 2016–2019.
2.4.4. Salmonella in animals
Poultry monitoring data according to the Salmonella national control programmes
Achievement of Salmonella reduction targets
Breeding flocks of Gallus gallus
In total, 24 MS, and four non‐MS, including the United Kingdom, reported Salmonella NCP data from breeding flocks of Gallus gallus. Luxembourg and Malta do not have such flocks, whereas Poland has flocks, but did not report any data. In the EU in 2020, Salmonella was found in 256 (2.0%) of the 12,526 flocks tested, compared with 2.3% and 2.0% for 2019 and 2018, respectively. The prevalence of flocks that were positive for any of the five target serovars (S. Enteritidis, S. Typhimurium including its monophasic variant, S. Virchow, S. Infantis and S. Hadar) was 0.52% (or 65 flocks) for 2020, while it was 0.62% in 2019 and 0.54% in 2018. Therefore, 25.4% (65 of 256) of reported Salmonella‐positive breeding flocks were positive for target serovars. Fourteen MS and three non‐MS reported no flocks positive for target Salmonella serovars. All reporting countries, except Belgium, Greece and the Netherlands, met the flock prevalence target of maximum 1% (Figure 4). Among these, Belgium also did not meet the target in 2018 and 2017 and Greece in 2017. The most frequently reported target serovar was S. Enteritidis (EU flock prevalence of 0.23%), with 13 of the 29 notified positive flocks (44.8%) reported by the Netherlands (Figure 5). The total number of S. Enteritidis‐positive breeding flocks (29) decreased compared with 2019 (53) and 2018 (36), but for 2020, data from Poland were missing, which means that this decrease at EU level could be affected by this absence. For the Netherlands, the number of S. Enteritidis‐positive flocks in 2020 (13) increased compared to previous years since, for 2018, no positive flocks were reported, while nine positive flocks were notified in 2019. S. Typhimurium (including the monophasic variant) was the second most commonly reported target serovar (with 20 positive flocks and 16 of them notified by Belgium, France, the Netherlands and Spain) (Figure 6), followed by S. Infantis (with 11 positive flocks, five of them notified by the Netherlands) (Figure 7). With regard to the other target serovars, two flocks tested positive for S. Hadar (EU flock prevalence of 0.02%) and were reported by the Netherlands and three flocks tested positive for S. Virchow (EU flock prevalence of 0.02%), all reported by Spain.
Figure 4.

- Vertical bars indicate the target to be reached, which was fixed at 1% for all poultry populations with the exception of laying hens for which it was 2%.
Figure 5.

- No data: Country with breeding flocks of Gallus gallus but no data were reported; Not applicable: Country without breeding flocks of Gallus gallus; Unknown: No information about the presence of breeding flocks of Gallus gallus was available.
Figure 6.

- No data: Country with breeding flocks of Gallus gallus but no data were reported; Not applicable: Country without breeding flocks of Gallus gallus; Unknown: No information about the presence of breeding flocks of Gallus gallus was available.
Figure 7.

- No data: Country with breeding flocks of Gallus gallus but no data were reported; Not applicable: Country without breeding flocks of Gallus gallus; Unknown: No information about the presence of breeding flocks of Gallus gallus was available.
Flocks of laying hens
In total, 26 MS and four non‐MS, including the United Kingdom, reported Salmonella NCP data for laying hen flocks. No data were reported by Poland. Salmonella was found in 1,389 or 4.0% of flocks, compared with 1,529 or 3.9% in 2019. The EU prevalence of laying hen flocks that were positive for either of the two target serovars was 1.3% (N = 450), which was fairly stable compared with 2019, when 1.2% (N = 490) of tested flocks were positive for target serovars. Therefore, 32.4% (450 of 1,389) of reported Salmonella‐positive laying hen flocks were positive for target serovars. Five MS (Estonia, Ireland, Lithuania, Luxembourg and Slovenia) and two non‐MS reported no target Salmonella serovar‐positive laying hen flocks. Seven MS (Belgium, Croatia, Cyprus, Czechia, France, Latvia and Malta) did not meet the reduction target of 2% (Figure 4). The number of MS that did not meet the reduction target increased compared to previous years (six MS in 2018 and four in 2019). The most frequently reported target serovar was S. Enteritidis (EU flock prevalence of 0.88%) with 77.7% of the 301 S. Enteritidis‐positive flocks reported by seven MS (in descending order by number of isolates notified: France, Italy, the Netherlands, Spain, Germany, Czechia and Belgium). France alone accounted for 29.2% (N = 88) of the S. Enteritidis notified (Figure 8). For S. Typhimurium (including the monophasic variant), 149 positive flocks were reported (EU flock prevalence of 0.43%) and the majority (55.0%; N = 82) were reported by France (Figure 9), confirming the situation described in 2019.
Figure 8.

- No data: Country with laying hen flocks of Gallus gallus but no data were reported; Unknown: No information about the presence of laying hen flocks of Gallus gallus was available.
Figure 9.

- No data: Country with laying hen flocks of Gallus gallus but no data were reported; Unknown: No information about the presence of laying hen flocks of Gallus gallus was available.
Broiler flocks
In total, 26 MS and four non‐MS, including the United Kingdom, reported Salmonella NCP data from broiler flocks. No data were reported by Poland. Salmonella was found in 3.9% of the tested flocks (N = 10,420), compared with 3.6% in 2019 and 3.5% in 2018. The EU prevalence of broiler flocks positive for either of the two target Salmonella serovars was 0.25% (corresponding to 665 flocks), similar to the previous years (0.20% in 2019 and 2018). Therefore, 6.4% (665 of 10,420) of reported Salmonella‐positive broiler flocks were positive for target serovars. Eight MS (Bulgaria, Cyprus, Estonia, Finland, Ireland, Latvia, Lithuania and Sweden) reported no single target Salmonella serovar‐positive flocks. Three MS (Czechia, Luxembourg and Malta) did not meet the target of 1% or less of broiler flocks positive for S. Enteritidis and/or S. Typhimurium, unlike in the previous year, when only Czechia did not meet the target (Figure 4). As already reported in 2019, the EU prevalence was very similar for the two target serovars: in 2020, S. Typhimurium accounted for 53.2% of positive flocks for target serovars, whereas S. Enteritidis accounted for 46.8% (Figures 10 and 11). Alone, France accounted for 49.5% and 70.9% of all the EU‐positive broiler flocks for S. Enteritidis and S. Typhimurium, respectively.
Figure 10.

- No data: Country with broiler flocks of Gallus gallus but no data were reported; Unknown: No information about the presence of broiler flocks of Gallus gallus was available.
Figure 11.

- No data: Country with broiler flocks of Gallus gallus but no data were reported; Unknown: No information about the presence of broiler flocks of Gallus gallus was available.
Regulation (EC) No 200/2012 requires that MS separately report the results obtained by the FBOp and by the CA for broiler flocks. Most MS (22) reported both the overall merged results collected in the context of the NCP and separate results from the CA and FBOp investigations, for their broiler flocks. Four MS (Croatia, Hungary, Lithuania and the Netherlands) did not comply. Considering all data sent by the 22 MS, the EU flock prevalence of target Salmonella serovar‐positive flocks based on CA sampling was 1.1% (N = 4,359), which was significantly higher than that based on FBOp sampling, which was 0.25% (N = 235,019). The flock prevalence of target Salmonella serovars in broilers obtained by the CA was also significantly higher for Belgium, Czechia, France, Germany, Greece, Italy, Portugal, Romania, Slovakia and Spain. For the remaining reporting MS, the differences between the results of the two types of samplers were not significant or the sample sizes for one or both samplers were too small to be analysed (Table 21).
Table 21.
Comparisons of the prevalence of target Salmonella serovar‐positive broiler flocks, by sampler and by reporting MS, EU, 2020
| Country | Competent authority (CA) | Food business operator (FBOp) | p‐value b | Interpretation | ||||
|---|---|---|---|---|---|---|---|---|
| N flocks tested | N (%) flocks positive for target serovars | CI95 | N flocks tested | N (%) flocks positive for target serovars | CI95 | |||
| Austria | 97 | 1 (1.0) | [0.03; 5.6] | 5,898 | 6 (0.10) | [0.04; 0.22] | NS | |
| Belgium | 76 | 1 (1.3) | [0.03; 7.1] | 10,695 | 12 (0.11) | [0.06; 0.20] | 0.088 | CA > FBOp |
| Bulgaria | 162 | 0 | [0; 2.3] a | 162 | 0 | [0; 2.3] a | NS | |
| Cyprus | 9 | 0 | [–] | 1,176 | 0 | [0; 0.31] a | – | – |
| Czechia | 38 | 2 (5.3) | [0.64; 17.8] | 4,765 | 60 (1.3) | [0.96; 1.6] | 0.0857 | CA > FBOp |
| Denmark | 270 | 0 | [0; 1.4] a | 3,604 | 7 (0.19) | [0.08; 0.40] | NS | |
| Estonia | 183 | 0 | [0; 2.0] a | 502 | 0 | [0; 0.73] a | NS | |
| Finland | 645 | 0 | [0; 0.57] a | 3,472 | 0 | [0; 0.11] a | NS | |
| France | 742 | 12 (1.6) | [0.84; 2.8] | 65,498 | 393 (0.60) | [0.54; 0.66] | 0.0023 | CA > FBOp |
| Germany | 293 | 2 (0.68) | [0.08; 2.4] | 26,186 | 35 (0.13) | [0.09; 0.19] | 0.0631 | CA > FBOp |
| Greece | 107 | 3 (2.8) | [0.58; 8.0] | 8,836 | 0 | [0; 0.04] a | < 0.001 | CA > FBOp |
| Ireland | 110 | 0 | [0; 3.3] a | 3,478 | 0 | [0; 0.11] a | NS | |
| Italy | 458 | 2 (0.44) | [0.05; 1.6] | 27,828 | 9 (0.03) | [0.01; 0.06] | 0.0131 | CA > FBOp |
| Latvia | 4 | 0 | [–] | 795 | 0 | [0; 0.46] a | – | – |
| Luxembourg | 5 | 0 | [–] | 35 | 1 (2.9) | [0.07; 14.9] | – | – |
| Malta | 6 | 3 (50.0) | [–] | 434 | 4 (0.92) | [0.25; 2.3] | – | – |
| Portugal | 109 | 3 (2.8) | [0.57; 7.8] | 10,622 | 12 (0.11) | [0.06; 0.20] | < 0.001 | CA > FBOp |
| Romania | 384 | 6 (1.6) | [0.58; 3.4] | 12,432 | 4 (0.03) | [0.01; 0.08] | < 0.001 | CA > FBOp |
| Slovakia | 42 | 3 (7.1) | [1.5; 19.5] | 3,091 | 3 (0.10) | [0.02; 0.28] | < 0.001 | CA > FBOp |
| Slovenia | 32 | 0 | [0; 10.9] a | 2,561 | 14 (0.55) | [0.30; 0.92] | NS | |
| Spain | 427 | 9 (2.1) | [0.97; 4.0] | 38,802 | 28 (0.07) | [0.05; 0.10] | < 0.001 | CA > FBOp |
| Sweden | 160 | 0 | [0; 2.9] a | 4,147 | 0 | [0; 0.09] a | NS | |
| Total EU providing CA and FBOp data | 4,359 | 47 (1.1) | [0.79; 1.4] | 235,019 | 588 (0.25) | [0.23; 0.27] | < 0.001 | CA > FBOp |
–: Data not reported.
[–]: The confidence interval is not provided because of the small sample size.
One‐sided, 97.5% confidence interval.
p‐value: NS, not significant.
Breeding flocks of turkeys
For breeding turkeys, 11 MS and three non‐MS, including the United Kingdom, reported Salmonella NCP data. No data were reported by Poland, although it has such flocks. Salmonella was found in 63 (5.1%) of the 1,238 flocks tested, compared with 5.2% in 2019 and 3.8% in 2018, confirming the tendency towards an increase in the prevalence of Salmonella spp.‐positive flocks over the last few years in this category. In 2020, the prevalence of flocks positive for either of the two target Salmonella serovars was 0.48% (N = 6), compared with 0.30% and 0.47% in 2019 and 2018, respectively. Therefore, 9.5% (six of 63) of reported breeding turkey flocks with Salmonella were positive for target serovars and all of them were positive for S. Typhimurium. Four of these positive flocks were notified by Italy and two by France (Figure 12). The other nine MS reported no target Salmonella serovar‐positive flocks. All reporting MS met the reduction target of 1% or less of breeding flocks of turkeys positive for S. Enteritidis and/or S. Typhimurium, except Italy (Figure 4).
Figure 12.

- No data: Country with breeding turkey flocks but no data were reported; Not applicable: Country without breeding turkey flocks; Unknown: No information about the presence of breeding turkey flocks was available.
According to Regulation (EC) No 1190/2012, Salmonella NCP monitoring data for breeding turkey flocks must be reported separately for sampling performed by the CA and FBOp, in addition to the overall merged data. Seven MS (Germany, Greece, Ireland, Italy, Slovakia, Spain and Sweden) complied with this requirement, whereas four reporting MS did not; Bulgaria only reported data collected by CA and Finland, France and Hungary only reported the merged data set. Considering all data sent by the eight MS (Table 22), the EU prevalence of target Salmonella serovar‐positive flocks based on CA sampling was 0.97% (N = 310), which was not significantly different than that based on FBOp sampling (0.18%, N = 552). Conversely, for Italy, the results based on CA sampling (2.1%, N = 143), were significantly higher than those based on FBOp sampling (0.33%, N = 306).
Table 22.
Comparisons of the prevalence of target Salmonella serovar‐positive flocks of breeding turkeys, by sampler and by reporting MS, EU, 2020
| Country | Competent authority (CA) | Food business operator (FBOp) | p‐value b | Interpretation | ||||
|---|---|---|---|---|---|---|---|---|
| N flocks tested | N (%) flocks positive for target serovars | CI95 | N flocks tested | N (%) flocks positive for target serovars | CI95 | |||
| Bulgaria | 1 | 0 | [–] | – | – | – | – | – |
| Germany | 68 | 0 | [0; 5.3] a | 97 | 0 | [0; 3.7] a | – | – |
| Greece | 3 | 0 | [–] | 9 | 0 | [–] | – | – |
| Ireland | 4 | 0 | [–] | 4 | 0 | [–] | – | – |
| Italy | 143 | 3 (2.1) | [0.43; 6.0] | 306 | 1 (0.33) | [0.01; 1.8] | 0,0974 | CA > FBOp |
| Slovakia | 36 | 0 | [0; 9.7] a | 45 | 0 | [0; 7.9] a | – | – |
| Spain | 51 | 0 | [0; 7.0] a | 87 | 0 | [0; 4.2] a | – | – |
| Sweden | 4 | 0 | [–] | 4 | 0 | [–] | – | – |
| Total EU | 310 | 3 (0.97) | [0.20; 2.8] | 552 | 1 (0.18) | [0; 1.0] | NS | |
| Total EU providing CA and FBOp data | 309 | 3 (0.97) | [0.2; 2.8] | 552 | 1 (0.18) | [0; 1.0] | NS | |
–: Data not reported.
[–]: The confidence interval is not provided because of the small sample size.
One‐sided, 97.5% confidence interval.
p‐value: NS, not significant.
Flocks of fattening turkeys
For fattening turkey flocks, 21 MS and four non‐MS, including the United Kingdom, provided data. Although Poland had flocks, no data were reported. In the EU in 2020, Salmonella was found in 2,777 (8.8%) fattening turkey flocks, compared with 5.8% in 2019 and 6.3% in 2018. The EU prevalence of flocks positive for either of the two target Salmonella serovars was 0.38% (N = 121), compared with 0.24% in 2019 and 0.34% in 2018. Therefore, 4.4% (121 of 2,777) of reported Salmonella‐positive fattening turkey flocks were positive for either of the two target serovars. In total, 11 MS (Bulgaria, Croatia, Cyprus, Denmark, Finland, Greece, Ireland, the Netherlands, Romania, Slovakia and Sweden) and four non‐MS reported no flocks with target Salmonella serovars. Austria, Belgium and Czechia did not meet the reduction target of 1% (Figures 4 and 13). While for Austria, this was the first time for fattening turkeys, both Czechia and Belgium had also exceeded the target of 1% in previous years (Czechia in 2018, 2017 and 2016 and Belgium in 2019, 2018 and 2015). The EU flock prevalence was higher for S. Typhimurium (0.31%, 97 flocks) than for S. Enteritidis (0.08%, 24 flocks), with 62.5% and 61.8% of the positive flocks for S. Enteritidis and S. Typhimurium being reported by France, similar to the previous years.
Figure 13.

- No data: Country with fattening turkey flocks but no data were reported; Not applicable: Country without fattening turkey flocks; Unknown: No information about the presence of fattening turkey flocks was available.
Salmonella NCP monitoring data for fattening turkey flocks must be reported separately for sampling performed by the CA and FBOp, in addition to the overall merged results, as defined in Regulation (EU) No 1190/2012. Eighteen MS complied with the requirement, while three MS (Croatia, Hungary and the Netherlands) did not. Considering all data sent by the 18 MS, the EU prevalence of target Salmonella serovar‐positive flocks based on CA sampling was 1.2% (N = 986), which was significantly higher than that based on FBOp sampling (0.33%, N = 27,947) (Table 23). The same finding was also evident for data transmitted by France, Italy and Spain.
Table 23.
Comparisons of the prevalence of target Salmonella serovar‐positive flocks of fattening turkeys, by sampler and by reporting MS, EU, 2020
| Country | Competent authority (CA) | Food business operator (FBOp) | p‐value b | Interpretation | ||||
|---|---|---|---|---|---|---|---|---|
| N flocks tested | N (%) flocks positive for target serovars | CI95 | N flocks tested | N (%) flocks positive for target serovars | CI95 | |||
| Austria | 27 | 1 (3.7) | [0.09; 19.0] | 449 | 5 (1.1) | [0.36; 2.6] | NS | |
| Belgium | 4 | 0 | [–] | 192 | 5 (2.6) | [0.85; 6.0] | – | – |
| Bulgaria | 3 | 0 | [–] | 3 | 0 | [–] | – | – |
| Cyprus | 4 | 0 | [–] | 6 | 0 | [–] | – | – |
| Czechia | 20 | 1 (5.0) | [0.13; 24.9] | 260 | 4 (1.5) | [0.42; 3.9] | NS | |
| Denmark | 198 | 0 | [0; 1.9] a | 213 | 0 | [0; 1.7] a | NS | |
| Finland | 56 | 0 | [0; 6.4] a | 242 | 0 | [0; 1.5] a | NS | |
| France | 178 | 4 (2.3) | [0.62; 5.7] | 9,402 | 71 (0.76) | [0.59; 0.95] | 0.0506 | CA > FBOp |
| Germany | 152 | 1 (0.66) | [0.02; 3.6] | 4,778 | 3 (0.06) | [0.01; 0.18] | NS | |
| Greece | 1 | 0 | [–] | 73 | 0 | [0; 4.9] | – | – |
| Ireland | 56 | 0 | [0; 6.4] a | 450 | 0 | [0; 0.82] a | NS | |
| Italy | 120 | 2 (1.7) | [0.2; 5.9] | 5,583 | 1 (0.02) | [0; 0.1] | 0.0013 | CA > FBOp |
| Portugal | 13 | 0 | [0; 24.7] a | 1,453 | 1 (0.07) | [0; 0.38] | – | – |
| Romania | 29 | 0 | [0; 11.9] a | 403 | 0 | [0; 0.91] a | NS | |
| Slovakia | 6 | 0 | [–] | 76 | 0 | [0; 4.7] a | – | – |
| Slovenia | 9 | 0 | [–] | 102 | 1 (0.98) | [0.02; 5.3] | – | – |
| Spain | 78 | 3 (3.9) | [0.8; 10.8] | 4,135 | 0 | [0; 0.09] a | < 0.001 | CA > FBOp |
| Sweden | 32 | 0 | [0; 10.9] a | 127 | 0 | [0; 2.9] a | NS | |
| Total EU providing CA and FBOp data | 986 | 12 (1.2) | [0.63; 2.1] | 27,947 | 91 (0.33) | [0.26; 0.4] | < 0.001 | CA > FBOp |
–: Data not reported.
[–]: The confidence interval is not provided because of the small sample size.
One‐sided, 97.5% confidence interval.
p‐value: NS, not significant.
Salmonella prevalence trends in poultry flocks
Trends in the estimated EU prevalence of poultry flocks positive for Salmonella spp. and target Salmonella serovars, for different poultry populations, since the implementation of the EU‐wide 2007–2020 NCP, are displayed in (Figure 14). In 2020, data transmitted by the United Kingdom were not considered since it has become a third country.
Figure 14.

Trend in the estimated prevalence of poultry flocks positive for Salmonella spp. and target Salmonella serovars, at EU level for different poultry populations, 2007–2020
In the supporting information for this report (‘Salmonella poultry outcome trend analyses’), the EU percentages of positive flocks for Salmonella, target and non‐target Salmonella serovars and S. Enteritidis over time are shown and compared for each poultry population covered by the NCP. Moreover, figures show the modelling of prevalence trends for Salmonella and target Salmonella serovars in poultry flocks. Detailed outputs of trend analyses (at subject level and population level) are reported.
The apparent discrepancy between the proportion of positive flocks (both for target Salmonella serovars and for Salmonella, as described in the previous paragraphs) and the estimated prevalence shown below is due to the fact that the first value is the ratio between all positive over all tested flocks, whereas the estimated prevalence is obtained by modelling the ratio of positive over all tested flocks in each reporting country, taking into account inter‐country variability and the correlation between years.
Breeding flocks of Gallus gallus
The data considered to model the trend in EU Salmonella flock prevalence for target serovars in breeding Gallus gallus for the period 2007–2020 came from 26 MS. Two MS (Estonia and Latvia) reported no single flocks positive for target serovars during the entire period of NCP implementation.
Since the beginning of the NCP, there has been an overall decreasing trend for the prevalence of breeding Gallus gallus flocks positive for target serovars (Figure 14). The prevalence estimated by modelling decreased from 1% CI95[0.57; 1.9] in 2007 to 0.38% CI95[0.28; 0.52] in 2016, the year in which the estimated prevalence reached the lowest value. Over the next 4 years, the estimated prevalence slightly increased, reaching 0.46% CI95[0.24; 0.86] in 2020, but this increase was not statistically significant.
After an initial fluctuation in the EU prevalence of Salmonella‐positive breeding flocks, the estimated prevalence reached the minimum value of 0.97% CI95[0.63; 1.5] in 2016 and then increased slightly to 1.2% CI95[0.69; 2.2] in 2020. This estimated prevalence was not significantly different from that in the previous 2 years or from the lowest prevalence estimated in 2016.
Flocks of laying hens
The data considered to model the trend in EU Salmonella flock prevalence for target serovars in laying hen flocks over the period 2008–2020 came from all MS. No MS reported 0% prevalence for target serovars during this period. Since the beginning of the NCP, there has been a decreasing overall trend for the prevalence of flocks positive for target serovars (Figure 14). The prevalence estimated by modelling was 3.7% CI95[2.5; 5.6] in 2008 and decreased to reach the lowest value of 0.90% CI95[0.65; 1.2] in 2014, with a steep downturn. From 2015 onwards, it increased slightly and stabilised at 1.2% CI95[0.70; 2] in 2020. This prevalence was not significantly different compared with that of the previous 2 years or compared with the lowest prevalence estimated in 2014.
The estimated EU Salmonella spp. prevalence in laying hen flocks was 7.2% CI95[4.4; 11.6] in 2008 and decreased to 2.1% CI95[1.3; 3.2] in 2014, with a steep downturn. During the following years, it increased and reached 3.3% CI95[2.1; 5.0] in 2020. In 2020, the estimated Salmonella prevalence in laying hen flocks was not significantly different compared with the previous 2 years, but it was different compared with 2014, when the estimated prevalence reached the lowest value seen to date (p‐value = 0.08081).
Broiler flocks
Data from 27 MS were used to model the trend in Salmonella flock prevalence for target serovars in broiler flocks over the period 2009–2020. Finland reported no broiler flocks positive for target Salmonella serovars during the entire period. From the beginning of the NCP, the flock prevalence for target serovars estimated by the model steeply decreased in the first time interval (until 2011) and then further decreased (Figure 14). The estimated prevalence was 0.47% CI95[0.24; 0.93] in 2009 and decreased to 0.17% CI95[0.09; 0.30] in 2020. This prevalence was not significantly different from that during the previous 2 years.
The EU prevalence of Salmonella spp.‐positive broiler flocks estimated by modelling decreased from 2.9% CI95[1.4; 5.8] in 2009 to 1.3% CI95[0.72; 2.3] in 2015 and then increased again to 2% in 2019. In the last year, the estimated prevalence slightly decreased to 1.5% CI95[0.82; 2.9]. Nevertheless, the estimated EU prevalence of Salmonella‐positive broiler flocks in 2020 was not significantly different to that of the previous 2 years or that of 2015, when the estimated prevalence reached the lowest value.
Breeding turkey flocks
The data used to model the trend in EU Salmonella flock prevalence for target serovars in breeding turkey flocks over the period 2010–2020 came from 15 MS. Six MS reported no breeding turkey flocks positive for target Salmonella serovars over this entire period. The remaining MS had, from time to time, some positive flocks. The prevalence of target Salmonella serovar‐positive breeding turkey flocks fluctuated for the entire period between 0.21% CI95[0.05; 0.95] and 0.51% CI95[0.21; 1.2] (Figure 14).
With regard to EU Salmonella spp.‐positive breeding turkey flocks, after an initial fluctuation in the EU prevalence from 7.9% CI95[3.5; 16.7] in 2010 to 1.4% CI95[0.72; 2.8] in 2015, when the estimated prevalence reached the lowest value seen in the entire study period, the estimated prevalence increased over time to 3.8% CI95[2; 7.3] in 2020. This estimated prevalence in 2020 was not significantly different from that of the previous 2 years, but it was significantly higher than the estimated prevalence in 2015 (p‐value = 0.03588).
Fattening turkey flocks
The data used to model the trend in EU Salmonella flock prevalence for target serovars in fattening turkeys for the period 2010–2020 came from 25 MS. Sweden reported no fattening turkey flocks positive for target Salmonella serovars during this entire period, whereas Slovenia notified its first positive flock for target serovars in 2020. The estimated target serovar flock prevalence was 0.4% CI95[0.25; 0.62] in 2010; it decreased to 0.25% CI95[0.18; 0.35] in 2014 and increased to 0.30% CI95[0.15; 0.58] in 2020, after some small temporal fluctuations (Figure 14). Nevertheless, there were no significant differences in the estimated prevalence of the target Salmonella serovars in EU fattening turkey flocks in the last 2 years.
For this poultry category, after an initial fluctuation in the EU prevalence of Salmonella spp.‐positive flocks from 5.7% CI95[3.4; 9.2] in 2010 to 1.9% CI95[0.93; 3.9] in 2015, the year in which the estimated prevalence reached the lowest value, it increased to 3.4% CI95[1.6; 6.9] in 2020. Nevertheless, the prevalence in 2020 was not significantly different from that in the previous 2 years or from the lowest estimated prevalence in 2015.
All modelling was also carried out including the 2020 United Kingdom data to evaluate the possible impact of the withdrawal of the United Kingdom from the EU. Focusing on 2020, there was no significant difference between the estimated prevalence with and without the United Kingdom data, for all poultry species (‘Salmonella poultry outcome trend analyses’).
Salmonella data in other animals
Considering all data collected on the presence of Salmonella in animal categories from different species in the EU with the exception of data collected in the framework of NCP for poultry, 105,227 samples were reported by 14 MS. The vast majority of data were from ‘animals’, compared with other sampling unit levels (‘herd/flock’ and ‘holding’). The overall prevalence of Salmonella‐positive samples was 17.6% (N = 18,537) (Table 24). The highest proportion of positive samples was from cats (45%, N = 1,215) and the positive samples were obtained mainly in the context of ‘clinical investigations’ related to ‘suspect sampling’ reported by a single MS (Sweden). Pig samples were the most represented among the different species (N = 56,008 notified by 10 MS) and 27.9% of samples were reported as being Salmonella positive. For cattle, based on data reported by 11 MS, the prevalence of positive samples was 3.4% (955 positive samples, N = 28,360). Solipeds had 8.1% positive samples for Salmonella (N = 471) notified by six MS and also for this species, half of the positive samples were related to ‘suspect sampling’ in the context of ‘clinical investigations’. Wild boar was confirmed as a potential source of Salmonella and 67 out of the 1,133 samples collected by three MS (Germany, Italy and Sweden) were Salmonella positive (5.9%).
Table 24.
Summary of Salmonella statistics related to major animal species, reporting EU MS and non‐MS countries, 2020
| Animals | EU MS | Non‐EU countries | ||||||
|---|---|---|---|---|---|---|---|---|
| N° of reporting countries | N tested animals | Positive animals | N° of reporting countries | N tested animals | Positive animals | |||
| N | % | N | % | |||||
| Birds | 11 | 9,756 | 217 | 2.2 | 4 | 1,856 | 99 | 5.3 |
| Cats | 4 | 2,695 | 1,215 | 45.1 | 2 | 1,067 | 403 | 37.8 |
| Cattle/Bovine | 11 | 28,360 | 955 | 3.4 | 4 | 4,898 | 274 | 5.6 |
| Dogs | 6 | 1,511 | 34 | 2.3 | 2 | 1,191 | 40 | 3.4 |
| Goats | 7 | 727 | 30 | 4.1 | 2 | 29 | 0 | 0 |
| Pigs | 10 | 56,008 | 15,656 | 28.0 | 3 | 4,550 | 131 | 2.9 |
| Sheep | 6 | 2,062 | 132 | 6.4 | 3 | 78 | 15 | 19.2 |
| Solipeds | 6 | 471 | 38 | 8.1 | 2 | 246 | 4 | 1.6 |
| Wild boars | 3 | 1,133 | 67 | 5.9 | 1 | 204 | 8 | 3.9 |
| Wild ungulates | 3 | 687 | 2 | 0.29 | 1 | 4 | 1 | 25.0 |
| Others/Not specified | 11 | 1,817 | 191 | 10.5 | 2 | 433 | 65 | 15.0 |
| Total | 14 | 105,227 | 18,537 | 17.6 | 5 | 14,556 | 1,040 | 7.1 |
MS: Member States.
2.4.5. Salmonella in feed
In 2020, the overall EU occurrence of Salmonella‐positive samples in any ‘animal and vegetable‐derived feed’ was 0.67% (N = 63,506). In compound feed (finished feed for animals), the prevalence of Salmonella‐positive units was 0.29% of 10,182 tested samples for poultry, 0.34% of 2,682 tested samples for cattle and 0.18% of 3,039 tested samples for pigs. As for the prevalence of Salmonella‐positive units in feedingstuff for animals other than pigs, cattle and poultry, from the EU, there were no noticeable figures in 2020, except for sheep, where in over 102 tested units, this prevalence was 2%. In the case of non‐specified compound feedingstuff, Salmonella was reported in 0.18% of over 8,118 tested units. Sweden mainly contributed to this figure, since the country managed to sample over 7,636 units. Lastly, the prevalence of Salmonella‐positive sampling units for pet food was 1.1% (N = 2,553).
2.4.6. Salmonella serovars in humans, food and animals
Humans
Serovars among all confirmed salmonellosis cases
For humans, information on Salmonella serovars was available for 80.3% of the total number of confirmed cases (42,303 cases out of 52,702) from 25 MS (Bulgaria and Poland did not report serovar data). Data included all cases reported with serovar information regardless of the travel status. As in previous years, the three most commonly reported Salmonella serovars in 2020 were S. Enteritidis (48.7%), S. Typhimurium (12.4%) and monophasic S. Typhimurium (1,4,[5],12:i:‐) (11.1%), representing 72.2% of the 42,303 confirmed human cases with a known serovar. Monophasic S. Typhimurium (1,4,[5],12:i:‐) apparently decreased by 26% compared with 2019, considering the absolute number of cases of this serovar in these years, but it increased by 2.9% compared with 2019 with respect to the total number of isolates in the relative years. S. Enteritidis decreased by 47%, considering the absolute number of cases of this serovar in these years, but it decreased only by 1.7% compared with 2019 with respect to the total number of isolates in the relative years. The proportions of these three serovars were at the same level as in 2019 and 2018; this was also true for S. Infantis, which was the fourth most commonly reported serovar (Table 25). The fifth most common serovar, S. Derby, increased by 0.3% compared with 2019, with respect to the total number of isolates in the relative years, replacing the S. Newport serovar. Serovar S. Bovismorbificans increased by 0.22% compared with 2019 and 2018, with respect to the total number of isolates in the relative years, even though in absolute value it decreased by 25%, considering the absolute number of cases of this serovar in these years. Serovar S. Dublin decreased by 5.3% with respect to the total number of isolates in the relative years, but it increased by 0.20% compared with 2019 and 2018, entering the top 20 list in 2020. This serovar was notified by nine MS (Belgium, Germany, Denmark, France, Spain, Ireland, Italy, the Netherlands and Sweden). In these nine MS, the number of cases of S. Dublin remained constant or slightly increased in 2020 vs. 2019, compared to a decreasing total number of cases with serovar information. Furthermore, serovars S. Brandenburg, S. Muenchen, S. Panama, S. London and S. Kottbus entered the top 20 list of the most frequent serovars in 2020.
Table 25.
Distribution of reported confirmed cases of human salmonellosis in the EU, 2018–2020, for the 20 most frequent Salmonella serovars in 2020
| Serovar | 2020 | 2019 | 2018 | ||||||
|---|---|---|---|---|---|---|---|---|---|
| Cases | MSs | % | Cases | MSs | % | Cases | MSs | % | |
| Enteritidis | 20,610 | 25 | 48.7 | 39,451 | 27 | 50.4 | 39,516 | 27 | 50.0 |
| Typhimurium | 5,258 | 25 | 12.4 | 9,288 | 27 | 11.9 | 10,297 | 27 | 13.0 |
| Monophasic typhimurium 1,4,[5],12:i:‐ | 4,697 | 16 | 11.1 | 6,432 | 18 | 8.2 | 6,374 | 17 | 8.1 |
| Infantis | 1,040 | 23 | 2.5 | 1,912 | 26 | 2.4 | 1,852 | 26 | 2.3 |
| Derby | 518 | 20 | 1.2 | 719 | 23 | 0.92 | 707 | 23 | 0.90 |
| Napoli | 412 | 12 | 0.97 | 493 | 18 | 0.63 | 450 | 15 | 0.57 |
| Bovismorbificans | 337 | 15 | 0.80 | 452 | 19 | 0.58 | 461 | 18 | 0.58 |
| Newport | 333 | 20 | 0.79 | 846 | 24 | 1.1 | 1,054 | 21 | 1.3 |
| Coeln | 321 | 18 | 0.76 | 441 | 18 | 0.56 | 441 | 20 | 0.56 |
| Brandenburg | 308 | 15 | 0.73 | 288 | 17 | 0.37 | 295 | 17 | 0.37 |
| Muenchen | 223 | 15 | 0.53 | 261 | 20 | 0.33 | 219 | 15 | 0.28 |
| Stanley | 206 | 20 | 0.49 | 509 | 19 | 0.65 | 469 | 22 | 0.59 |
| Dublin | 196 | 9 | 0.46 | 207 | 13 | 0.26 | 204 | 14 | 0.26 |
| Panama | 158 | 11 | 0.37 | 270 | 14 | 0.34 | 221 | 14 | 0.28 |
| Agona | 152 | 17 | 0.36 | 490 | 20 | 0.63 | 591 | 18 | 0.75 |
| Kentucky | 152 | 15 | 0.36 | 538 | 24 | 0.69 | 655 | 22 | 0.83 |
| Saintpaul | 152 | 14 | 0.36 | 292 | 20 | 0.37 | 314 | 20 | 0.40 |
| London | 142 | 13 | 0.34 | 185 | 15 | 0.24 | 193 | 16 | 0.24 |
| Kottbus | 127 | 17 | 0.30 | 152 | 17 | 0.19 | 208 | 20 | 0.26 |
| Chester | 126 | 12 | 0.30 | 340 | 17 | 0.43 | 366 | 19 | 0.46 |
| Other | 6,835 | – | 16.2 | 14,716 | – | 18.8 | 14,077 | – | 17.8 |
| Total a | 42,303 | 25 | 100 | 78,282 | 27 | 100 | 78,964 | 27 | 100 |
MS: Member State.
Source(s): 2020 ‐ 25 MS: Austria, Belgium, Croatia, Cyprus, Czechia, Denmark, Estonia, Finland, France, Germany, Greece, Hungary, Ireland, Italy, Latvia, Lithuania, Luxembourg, Malta, the Netherlands, Portugal, Romania, Slovakia, Slovenia, Spain, Sweden. 2018–2019 – 27 MS: the 25 MS listed above plus the United Kingdom and Poland.
Serovars acquired in the EU
To estimate the impact of the Salmonella infections acquired at the EU level, serovar data were analysed for domestic and travel‐associated cases in which the probable country of infection was an EU MS. Information on Salmonella serovars with travel data was available from 23 MS, representing 72.2% of cases with known serovar data in 2020. Most cases (97.3%) with a known serovar and with travel data were infected within the EU. For the travel‐associated cases, the most frequently reported travel destinations were Spain (19.6%), Poland (15.1%), Austria, Croatia and Italy (8.2% each).
For the reported cases of human salmonellosis acquired in the EU, S. Enteritidis dominated and 60.2% of these reported cases were infected with this serovar. Together with S. Typhimurium and monophasic S. Typhimurium (1,4,[5],12:i:‐), these three serovars represented 77.6% of the confirmed human cases acquired in the EU in 2020 (Table 26). S. Enteritidis cases were predominantly (98.4%) infected within the EU. The proportions of S. Enteritidis, S. Typhimurium and its monophasic variant strains (1,4,[5],12:i:‐) were at about the same level as in 2018–2019, considering the number of specific reported serovars vs. the total number of reported serovars. Also, S. Infantis and S. Derby remained at the same level as in 2019.
Table 26.
Distribution of reported cases of human salmonellosis acquired in the EU, 2018–2020, for the six most frequently reported serovars in 2020
| Serovar | 2020 | 2019 | 2018 | ||||||
|---|---|---|---|---|---|---|---|---|---|
| Cases | MSs | % | Cases | MSs | % | Cases | MSs | % | |
| Enteritidis | 17,887 | 23 | 60.2 | 32,010 | 24 | 61.6 | 32,727 | 24 | 60.9 |
| Typhimurium | 3,623 | 22 | 12.2 | 6,044 | 24 | 11.6 | 7,410 | 25 | 13.8 |
| Monophasic typhimurium 1,4,[5],12:i:‐ | 1,530 | 16 | 5.2 | 2,688 | 17 | 5.2 | 2,553 | 17 | 4.7 |
| Infantis | 692 | 21 | 2.3 | 1,215 | 24 | 2.3 | 1,211 | 23 | 2.3 |
| Derby | 253 | 17 | 0.85 | 396 | 20 | 0.76 | 414 | 19 | 0.77 |
| Napoli | 73 | 11 | 0.25 | 121 | 15 | 0.23 | 127 | 13 | 0.24 |
| Other | 5,643 | − | 19.0 | 9,527 | − | 18.3 | 9,341 | − | 17.4 |
| Total a | 29,701 | 23 | 100 | 52,001 | 24 | 100 | 53,783 | 25 | 100 |
MS: Member States.
When UK data were collected for the year 2018–2019, the UK was an EU MS, but on 1 February 2020, it became a third country. Data from the UK are taken into account for the years 2018 and 2019, but are not considered in the EU overview for 2020.
A seasonal trend was observed for confirmed S. Enteritidis infections acquired in the EU in 2011–2020, with more cases reported during summer months. A decrease in cases in 2020 was observed, probably due to the COVID‐19 pandemic. Notwithstanding, the overall trend for salmonellosis in 2016–2020 did not show any statistically significant increase or decrease (Figure 15). Greece and Finland showed a significantly decreasing (p < 0.01) trend in S. Enteritidis infections acquired within the EU over the last 5 years (2016–2020). A significant increasing trend was not observed in any MS for the last 5 years.
Figure 15.

- Source: Austria, Czechia, Germany, Denmark, Estonia, Greece, Finland, Hungary, Ireland, Italy, Latvia, Malta, the Netherlands, Poland, Sweden and Slovakia.
Food and animals
Descriptive analyses were undertaken using serotyped isolates from food and animal samples belonging to the five most frequently reported Salmonella serovars involved in cases of human salmonellosis acquired in the EU in 2020. These top five serovars were S. Enteritidis, S. Typhimurium, monophasic S. Typhimurium (1,4,[5],12:i:‐), S. Infantis and S. Derby. Only isolates related to the most common food‐producing animal species and food matrices thereof were considered and aggregated into the following categories for further analyses: ‘broiler flocks – broiler meat’, ‘laying hen flocks – eggs’, ‘fattening turkey flocks – turkey meat’, ‘pigs – pig meat’ and ‘cattle – bovine meat’. Overall, a selection of 17,877 serotyped Salmonella isolates meeting the mentioned inclusion criteria was obtained (Table 27).
Table 27.
Distribution of Salmonella isolates (number and percentage) with and without serotype identification among the different selected sources (food and animals), EU, 2020
| Serovar | Broiler | Broiler meat | Bovine | Cattle meat | Pig | Pig meat | Turkey | Turkey meat | Layers | Eggs | Total | |
|---|---|---|---|---|---|---|---|---|---|---|---|---|
| Salmonella units without serotyped isolate | N | 1,491 | 913 | 1 | 150 | 15,545 | 924 | 819 | 218 | 211 | 2 | 20,274 |
| % | 7.4 | 4.5 | < 0.01 | 0.74 | 76.7 | 4.6 | 4 | 1.1 | 1 | 0.01 | 100 | |
| Salmonella units with serotyped isolate | N | 8,972 | 3,379 | 115 | 165 | 53 | 1,691 | 1,961 | 312 | 1,184 | 45 | 17,877 |
| % | 50.2 | 18.9 | 0.64 | 0.92 | 0.3 | 9.5 | 11 | 1.7 | 6.6 | 0.25 | 100 | |
The great majority of the serotyped isolates (69.1%) were from ‘broilers’ (both animals and food). ‘Turkey’ sources accounted for 12.7% of the serotyped isolates. ‘Pig’ and ‘laying hen’ sources (animals and food) represented 9.8% and 6.9% of the serotyped isolates, respectively. Serotyped isolates from ‘cattle’ sources (animals and food) made up about 1.6% of the serotyped isolates.
The top five serovars responsible for human infections were distributed as follows among the serotyped isolates (17,877) from these food‐animal sources: S. Infantis accounted for 31.5%, S. Enteritidis 5.1%, S. Typhimurium 3.7%, monophasic S. Typhimurium (1,4,[5],12:i:‐) 2.2% and S. Derby 1.7%.
The Sankey diagram (Figure 16) illustrates how the top five EU Salmonella serovars involved in human salmonellosis cases acquired in the EU were linked with the major animal species.
Figure 16.

Sankey diagram of the distribution of the top five EU Salmonella serovars involved in human salmonellosis cases acquired in the EU, reported from specified food–animal categories, by food–animal source, EU, 2020
- The left side of the diagram shows the five most commonly reported Salmonella serovars involved in human salmonellosis cases acquired in the EU: S. Enteritidis (blue), S. Infantis (green), S. Typhimurium (orange), monophasic S. Typhimurium (1,4,[5],12:i:‐) (violet) and S. Derby (magenta). Animal and food data from the same source were merged: ‘broiler’ includes isolates from broiler flocks and broiler meat, ‘bovine’ includes isolates from bovines for meat production and bovine meat, ‘pig’ includes isolates from fattening pigs and pig meat, ‘turkey’ includes isolates from fattening turkey flocks and turkey meat, and ‘layers’ includes isolates from laying hen flocks and eggs. The right side shows the five sources considered (broiler, bovine, pig, turkey and layers). The width of the coloured bands linking sources and serovars is proportional to the percentage of isolates of each serovar from each source.
S. Enteritidis was primarily related to ‘broiler’ sources (59.3% of the S. Enteritidis isolates were from broiler flocks and meat) and also to ‘layers and eggs’ (34.8%). S. Typhimurium was mainly related to ‘broiler’ and ‘pig’ sources (37% and 33.5% of the isolates were from these sources, respectively) followed by ‘laying hen’ sources (19.8%). Monophasic S. Typhimurium (1,4,[5],12:i:‐) was related mainly to ‘pig’ (45.1%) and secondly to ‘broiler’ (30.4%) sources. S. Infantis was strictly related to ‘broiler’ sources (94%). S. Derby was primarily related to ‘pig’ (68.8%) and secondly to ‘turkey’ (18.3%) sources. To interpret these data, it is important to be aware that the distribution of the serotyped isolates among the different sources is very heterogeneous in terms of the number of isolates per source, as previously detailed, and the great majority of the serotyped isolates considered in this section are from poultry populations covered by control programmes, especially broilers. Moreover, there is no consistency among countries in terms of the serovar data reported, as displayed in Figure 17.
Figure 17.

Sankey diagram of the distribution of the top five EU Salmonella serovars involved in human salmonellosis cases acquired in the EU and reported from specified food–animal categories, by reporting MS, EU, 2020
- The left side of the diagram shows the five most commonly reported Salmonella serovars from human salmonellosis cases acquired in the EU: S. Enteritidis (blue), S. Infantis (green), S. Typhimurium (orange), monophasic S. Typhimurium (1,4,[5],12:i:‐) (violet) and S. Derby (magenta). The right side shows the reporting MS. The width of the coloured bands linking MS and serovars is proportional to the percentage of isolates of each serovar reported by each MS.
The Sankey diagram (Figure 17) illustrates how the top five EU Salmonella serovars involved in human salmonellosis cases acquired in the EU were notified by the reporting MS considering the specified food–animal sources. The number of serotyped isolates reported by each MS was very heterogeneous, which must be considered when interpreting the data. The top five Salmonella serovars from the aforementioned sources were reported by 25 MS. S. Enteritidis was widely reported by most MS, even though France accounted for the greatest percentage (28%) of the isolates, followed by Slovakia, which reported 12.8% of the S. Enteritidis isolates. Similarly, S. Typhimurium and monophasic S. Typhimurium (1,4,[5],12:i:‐) isolates were extensively reported, but the highest percentage of both serovars was notified by France, accounting for 39.0% and 37.2%, respectively. S. Infantis and S. Derby isolates were mostly reported by Italy, which accounted for 43% and 38.3% of the isolates belonging to these serovars, respectively.
2.5. Discussion
Salmonellosis remains the second most common zoonosis in humans in the EU after campylobacteriosis. The previous decreasing trend for confirmed cases has stabilised since 2014 and in 2020, the number of reported confirmed human cases and the EU notification rate were at the lowest levels since the beginning of Salmonella surveillance (2007). The decrease was probably due to the COVID‐19 pandemic and to the exclusion of the United Kingdom from the ECDC reporting data due to its withdrawal from the EU. Despite the substantial decrease in the number of confirmed cases in 2020, the EU trend for salmonellosis in humans did not show any statistically significant increase or decrease over the last 5 years (2016–2020). Conversely, over the period 2016–2020, Estonia, Finland and Sweden reported a decreasing trend. Such an extensive decrease in human cases of salmonellosis in 2020 can be associated with the COVID‐19 pandemic restriction periods, when patients with symptoms related to food‐ and waterborne diseases were unlikely to visit doctors or confirm the diagnosis in a laboratory; it can also be linked to changed social eating habits (e.g. no event catering, no buffets over the summer). Some restrictive measures implemented against COVID‐19, such as frequent hand washing and disinfection and the lockdown, may have had a direct effect on limiting the spread of Salmonella. Moreover, the number and proportion of travel‐related cases (both outside and within the EU) dramatically dropped as a direct consequence of reduced travelling abroad during the lockdown.
In addition, notification rates for salmonellosis in humans varied between MS, reflecting potential variations in, e.g. the quality, coverage and disease‐severity focus of the surveillance systems, practices in sampling and testing, disease prevalence in the food‐producing animal population and food and animal trade between MS. Data collection could have been improved, e.g. since 28.8% of specimen information was missing. The hospitalisation rate varied from 22.8% to 83.1%. Countries reporting the lowest notification rates for salmonellosis had the highest proportions of hospitalisation, suggesting that the surveillance systems in these countries are focused on the most severe cases and underlining the variability of national surveillance systems. It is important to underline that a higher hospitalisation rate was reported for patients with specimens from blood (89.4%).
In 2020, a decrease in the reported data for Salmonella serovars was also observed. The reduction in the total number of confirmed cases of Salmonella serovars made it necessary to analyse data comparing not only the absolute number of specific Salmonella serovars reported in 2018–2020 but also the number of specific Salmonella serovars with respect to the total number in each year. In 2020, a percentage increase in monophasic S. Typhimurium (1,4,[5],12:i‐) and a percentage decrease in S. Enteritidis were observed, confirming the trend of the previous years. In relation to the decrease in S. Enteritidis isolates, it is noteworthy that Poland, which was involved during previous years in a long‐lasting multi‐country outbreak associated with contaminated eggs from Polish farms, did not transmit serovar data in 2020. Similarly, the large decrease in terms of S. Enteritidis isolates for 2020 in comparison with 2019 in relation to NCP for breeding Gallus gallus may have been related also to the absence of Polish data for 2020.
Regarding the cases acquired in the EU, the ranking of the five most common serovars was stable, but the proportion of S. Enteritidis was much higher than in relation to total cases. Overall, the three most commonly reported human serovars, S. Enteritidis and S. Typhimurium (including the monophasic variant), continued to account for over 70% of human cases acquired in the EU, as has been observed since 2014. S. Infantis has consistently been the fourth most frequently reported serovar involved in domestically acquired and travel‐associated human infections. After S. Infantis, S. Derby was the fifth most frequently reported serovar in 2020, while in sixth place, S. Napoli replaced S. Newport. Serovars S. Derby, S. Bovismorbificans and S. Dublin showed increased percentages of the specific serovar (0.3%, 0.22% and 0.2%, respectively) with respect to the total number of confirmed cases serotyped in the year, entering the top 20 list of the most frequent serovars in 2020. Furthermore, for the same observation, five other serovars entered the top 20 list: S. Brandenburg, S. Muenchen, S. Panama, S. London and S. Kottbus. Moreover, looking at the Salmonella foodborne outbreak analysis, S. Dublin caused three outbreaks while S. Bovismorbificans, S. Branderup, S. Kottbus and S. Muenchen were reported in one outbreak each. In particular, in 2020, S. Muenchen was responsible for a single strong‐evidence outbreak, in Germany, due to contamination of ‘coconut pieces or coconut flakes’ (further details are provided in the foodborne outbreak chapter). S. Dublin cases in humans are frequently associated with invasive disease and systemic illness related to the presence of several virulence factors which could be responsible for a greater likelihood of investigation and detection (Mohammed et al., 2017).
With regard to the main sources of the most common serovars associated with human infections, S. Enteritidis was primarily related to laying hens and broiler sources. S. Typhimurium had a heterogeneous distribution and was detected from poultry, pig and also bovine sources. Monophasic S. Typhimurium (1,4,[5],12:i:‐) was related mainly to pig sources and S. Infantis was very strongly related to broiler sources. S. Derby was mainly linked to pig sources, but it was also isolated from turkeys. However, to properly interpret these serovar data, it is important to be aware that the distribution of the serotyped isolates among the different sources and MS was very heterogeneous in terms of the number of notified isolates, and the reporting of serovar data is sometimes incomplete and inconsistent across years and among reporting countries, even for the consolidated sources of Salmonella.
Monitoring results for Salmonella contamination in food are in large part based on data collected in the context of Regulation (EC) No 2073/2005. With regard to food safety criteria, poultry meats (including fresh meat, minced meat, meat preparations and meat products) continue to be identified as the food categories with the highest proportions of Salmonella‐positive samples, even though Salmonella national control programmes in poultry at the primary production level have been implemented for several years (EFSA BIOHAZ Panel, 2019b). The relevance of ‘meat’ sources, and in particular products from poultry species, in terms of the isolation of Salmonella, was also confirmed by looking at the monitoring results for Salmonella contamination in RTE and non‐RTE food samples collected with an ‘objective sampling’ strategy. In particular, considering RTE food samples, Salmonella was detected in ‘meat and meat products from different species’ (e.g. broilers, pigs, cattle and turkeys) and in ‘spices and herbs’. The observed presence of Salmonella in these RTE food categories is of concern as contaminated RTE products pose a direct risk to consumers.
Moreover, the role of poultry products as a recurrent risk for Salmonella infections was recently confirmed in the context of a multi‐country outbreak due to S. Enteritidis ST11, affecting 193 people in eight EU countries and the United Kingdom, over the years 2018–2020 (ECDC and EFSA, 2021). Moreover, a recent systematic review of risk factors for Salmonella (Guillier et al., 2021) confirmed that the foods most significantly associated with salmonellosis were ‘eggs and eggs products’, ‘mixed foods’ and ‘meat’ (pork, red meat other than beef and poultry meat) and that the relevance of different sources was affected by different food consumption behaviours and habits in the countries where investigations were conducted.
Regulation (EU) 2019/627 has extended to all animal species covered by Regulation (EC) No 2073/2005 the obligation, for Competent Authorities, to verify the correct implementation by food business operators of PHC for Salmonella on carcases at the slaughterhouse. Data collected in this context confirmed that, especially for poultry (broiler and turkey carcases), but also for pigs and cattle, the proportions of positive samples collected by the CA were significantly higher than those notified for samples taken by the FBOp. However, only a limited number of MS reported data on carcases collected according to both sampling approaches (own‐check control by the FBOp and official controls by the CA), while most MS reported data collected by either the CA or the FBOp. Although these samples were reported by the MS as being taken using an ‘objective sampling’ strategy, it may be that the discrepancy in terms of the proportion of positive samples between the two samplers could in part be explained by the fact that the CA and FBOp sample according to different scopes. Official controls can include risk‐based sampling (Regulation (EU) No 2017/625), so the most problematic situations are those which are more intensively sampled by the CA. On the other hand, the scope of the sampling performed by the FBOp aims to maintain adequate control over the entire slaughter process.
This discrepancy was also obtained for national control programmes for poultry, where the separate reporting of controls carried out by the CA and FBOp is mandatory. The prevalence of target Salmonella serovars in samples from controls conducted by Competent Authorities is consistently higher than that from FBOp controls for both broilers and fattening turkeys. Investigations to define the reasons for discrepancies between the results of sampling conducted by the CA and FBOp should be encouraged as an essential prerequisite for trusting data collected in both contexts. Moreover, it would be advisable to extend the separate reporting of data collected by CA and FBOp also to Gallus gallus laying hens and breeders, which are the other poultry populations covered by national control programmes.
Comparing the overall proportion of Salmonella‐positive poultry carcases at the slaughterhouse (about 11% of positive samples for both broilers and turkeys as official controls) with the prevalence at farm level in the context of NCP, both for broilers (3.9%) and for fattening turkeys (8.8%), suggests that harvest/slaughter, such as the transport of animals and slaughtering, may have a direct effect on the spread of Salmonella and contamination of fresh meat. A detailed analysis of the entire process, and proper categorisation of slaughterhouses in terms of their ability to reduce the spread of Salmonella and avoid contamination of meat, is essential tools to maximise the efforts made at primary production level (EFSA BIOHAZ Panel, EFSA CONTAM Panel and EFSA AHAW Panel, 2012).
Control programmes in poultry at primary production level focus on serovars of particular relevance for public health (i.e. S. Enteritidis and S. Typhimurium), which are defined as target serovars. Trends for target Salmonella serovar‐positive flocks have been confirmed as fairly constant over the most recent years for almost all poultry populations. These results show how consolidated measures, like vaccination programmes and rigorous biosecurity as well as efficient controls, can work quite well (Mughini‐Gras et al., 2021). However, the number of MS that met the annual targets for all poultry populations decreased from 18 in 2019 to 14 in 2020. In particular, for laying hens, in 2019, four MS did not reach the annual target; this figure increased to seven MS in 2020. Moreover, looking at trends for Salmonella flock prevalence in poultry populations covered by control programmes over the last few years, a significant increase was noted for the prevalence estimated in 2020 for laying hens and breeding turkeys in comparison with the years when the lowest prevalence was reached for these populations (2014 and 2015, respectively). For the other poultry populations (breeding Gallus gallus, broilers and fattening turkeys), the trends were stable. All these data confirm how control measures must be maintained constantly and cannot be reduced, in order to avoid the spread of the pathogen. Indeed, in‐depth evaluations of epidemiological situations at local level could provide suggestions for the appropriate allocation of resources, in order to achieve a lower number of positive flocks and ultimately a reduced number of human salmonellosis cases, with an undoubted benefit at EU level (Leati et al., 2021).
2.6. Related projects and Internet sources
| Subject | For more information see | |
|---|---|---|
| Humans | ECDC Surveillance Atlas of Infectious Diseases | http://atlas.ecdc.europa.eu/public/index.aspx |
| EU case definition of salmonellosis | https://www.ecdc.europa.eu/en/surveillance‐and‐disease‐data/eu‐case‐definitions | |
| Disease Programme on Emerging, Food‐ and Vector‐Borne Diseases | https://www.ecdc.europa.eu/en/about‐us/who‐we‐are/units/disease‐programmes‐unit | |
| European Food‐ and Waterborne Diseases and Zoonoses Network (FWD‐Net) | https://www.ecdc.europa.eu/en/about‐us/partnerships‐and‐networks/disease‐and‐laboratory‐networks/fwd‐net | |
| World Health Organization – Salmonella (non‐typhoidal) fact sheet | http://www.who.int/mediacentre/factsheets/fs139/en/ | |
| Food | European Union Reference Laboratory (EURL) for Salmonella | www.eurlsalmonella.eu |
| Microbiological criteria | https://ec.europa.eu/food/safety/biosafety/food_hygiene/microbiological_criteria_en | |
| Scientific Opinion on Public health risks of table eggs due to deterioration and development of pathogens | https://www.efsa.europa.eu/en/efsajournal/pub/3782 | |
| Scientific Opinion on the link between Salmonella criteria at different stages of the poultry production chain | https://www.efsa.europa.eu/en/efsajournal/pub/1545 | |
| Annual national zoonoses country reports (reports of reporting countries on national trends and sources of zoonoses) | https://www.efsa.europa.eu/en/data‐report/biological‐hazards‐reports | |
| Animals | Control of Salmonella in animals | https://ec.europa.eu/food/safety/biosafety/food_borne_diseases/salmonella_en |
| General information on National Veterinary Programmes, in EU | https://ec.europa.eu/food/funding/animal‐health/national‐veterinary‐programmes_en | |
|
Scientific Opinion on Salmonella control in poultry flocks and its public health impact Scientific Opinion on a quantitative estimation of the public health impact of setting a new target for the reduction of Salmonella in laying hens |
https://www.efsa.europa.eu/en/efsajournal/pub/5596 http://onlinelibrary.wiley.com/doi/10.2903/j.efsa.2010.1546/abstract |
|
| Scientific Opinion on public health impact of new target for the reduction of Salmonella in turkey flocks | https://www.efsa.europa.eu/en/efsajournal/pub/2616 | |
| Scientific Opinion on public health impact new target for the reduction of Salmonella in broiler flocks | https://www.efsa.europa.eu/en/efsajournal/pub/2106 | |
| Scientific Opinion on Salmonella in slaughter and breeder pigs | https://www.efsa.europa.eu/en/efsajournal/pub/1547 |
3. Listeria monocytogenes
Tables and figures that are not presented in this chapter are published as supporting information to this report and are available as downloadable files from the EFSA Knowledge Junction on Zenodo at https://doi.org/10.5281/zenodo.5682809. Summary statistics of human surveillance data with downloadable files are retrievable using ECDC’s Surveillance Atlas of Infectious Diseases at http://atlas.ecdc.europa.eu/public/index.aspx

3.1. Key facts
-
•
In 2020, 27 MS reported 1,876 confirmed invasive human cases of L. monocytogenes that caused 780 hospitalisations and 167 deaths in the EU. Listeriosis was the fifth most commonly reported zoonosis in humans in the EU.
-
•
The EU notification rate of L. monocytogenes was 0.42 per 100,000 population. This is a decrease of 7.1% and 14.2% compared with the rate in 2019 (0.46 and 0.49 per 100,000 population) with and without the 2019 data from the United Kingdom, respectively.
-
•
Although a decrease in cases was observed at the EU level in 2020, probably due to the effect of the COVID‐19 pandemic, the overall trend for listeriosis in 2016–2020 did not show any statistically significant increase or decrease.
-
•
The overall EU case fatality was high (13.0%), but decreased compared with 2019 and 2018 (17.6% and 13.6%, respectively). This still makes listeriosis one of the most serious foodborne diseases under EU surveillance.
-
•
L. monocytogenes infections were most commonly reported in the age group ‘over 64 years’ and particularly in the age group ‘over 84 years’.
-
•
In 2020, L. monocytogenes was the causative agent of 16 foodborne outbreaks at the EU level, involving seven MS and 120 cases of illness, 83 hospitalisations and 17 deaths. Nine outbreaks were reported with strong evidence and 8 with weak evidence. The most common implicated food vehicles for the strong‐evidence listeriosis foodborne outbreaks were ‘fish and fish products’, ‘other or mixed meat and products thereof’ and ‘cheese’.
-
•
Twenty‐four MS reported 136,346 samples in different ‘ready‐to‐eat food’ categories at the retail or processing stages; this corresponds to a 37.6% decrease of the reported sampling effort compared with 2019.
-
•
The occurrence of L. monocytogenes gives an indication of the reasonably foreseeable contamination rate in different food categories. These results varied according to the ‘ready‐to‐eat’ food category and the sampling stage.
-
•
At retail, the proportion of single samples positive for L. monocytogenes taken by the competent authority remained very low to low in all ‘ready‐to‐eat’ food categories covered by Regulation (EC) No 2073/2005, from 0.0% for 5 out of 11 ‘ready‐to‐eat’ categories to 1.3% and 1.4% for ‘ready‐to‐eat’ fishery products and ready‐to‐eat fish, respectively.
-
•
At processing, the proportion of single samples positive for L. monocytogenes taken by the competent authority was systematically higher compared to the retail level, for all categories of ‘ready‐to‐eat’ food. As at retail, the highest proportion at processing was found for ‘ready‐to‐eat’ fishery products (3.8%) and ‘ready‐to‐eat’ fish (3.5%), followed by products of meat origin other than fermented sausages (2.2%).
-
•
In primary production, the percentage of positive units was very low (1.0%) in cattle, which is the most sampled animal species in the EU. The low number of data reported by MS reflects the absence of harmonised EU regulations at primary production.
3.2. Surveillance and monitoring of Listeria monocytogenes in the EU
3.2.1. Humans
Surveillance of listeriosis in humans in the EU is based on invasive forms of L. monocytogenes infection, mostly manifested as septicaemia, influenza‐like symptoms, meningitis or spontaneous abortion. Diagnosis of Listeria infections in humans is generally carried out by culture, from blood, cerebrospinal fluid and vaginal swabs, or by nucleic acid detection. Since 2018, MS have had the possibility to submit WGS data for L. monocytogenes to TESSy to be used for EU‐wide surveillance and cross‐sectoral comparison.
Notification of listeriosis in humans is mandatory in most EU MS, Iceland, Norway and Switzerland, except for one MS, where notification is based on a voluntary system (Luxembourg) and another, non‐specified system (Belgium). The surveillance systems for listeriosis cover the whole population in all MS, except in Belgium and Spain. Since 2015, the coverage of the surveillance system is estimated to be 80% in Belgium and this proportion of population was used in the calculation of notification rates. No estimate for population coverage was provided for Spain, so the notification rate was not calculated. For 2020, Spain did not receive data from all regions due to COVID‐19, so the case numbers might therefore not be complete. All countries reported case‐based data except Bulgaria, which reported aggregated data. Both reporting formats were included to calculate numbers of cases and notification rates.
Since 1 February 2020, the United Kingdom has become a third country, whereas before it was an EU MS. Human data from the United Kingdom were not collected by ECDC for 2020.
3.2.2. Food, animals and feed
Monitoring of L. monocytogenes is conducted along the food chain during preharvest (e.g. animals at the farm and their feed), processing (e.g. cutting plant, slaughterhouse) and post‐processing (e.g. retail and catering).
Cases of listeriosis appear to be predominately associated with ready‐to‐eat products. The risk associated with these products depends mainly on the effectiveness of control measures implemented by food business operators (FBOp), including:
-
–
Good Agricultural Practices (GAP) at primary production.
-
–
Good Manufacturing Practices (GMP) and HACCP programmes at processing and retail.
-
–
Microbiological criteria for RTE foods as defined by Regulation (EC) No 2073/2005.
Official sampling is scheduled by National CA to verify whether the FBOp correctly implement the legal framework of their own‐check programmes.
Data provided to EFSA within this context are mostly non‐harmonised official data, enabling only a descriptive summary of the contamination level in RTE foods at the EU level.
The rationale for surveillance and monitoring of L. monocytogenes in animals, feed and food at the different stages along the food chain and the number of samples provided to EFSA for 2020 are shown in Figure 18.
Figure 18.

Overview of Listeria monocytogenes testing along the food chain according to the sampling stage, the sampler and the objective of the sampling
- CA: Competent Authority; FBOp: Food business operator; Lm: Listeria monocytogenes; MS: Member State; RTE: ready‐to‐eat.
In 2020, 24 MS reported 136,346 samples tested for L. monocytogenes involving different RTE food categories at the retail or processing stages. Compared with 2019, the number of samples tested at these stages decreased by 37.6%, although the number of reporting MS was stable (25 in 2019).
The number of samples tested at primary production was comparable in 2020 and 2019, with 13 MS reporting 23,567 samples in 2020, compared to 22,135 samples in 2019 (also 13 MS). Most of the reported monitoring data on L. monocytogenes in animals and feed are generated by non‐harmonised monitoring schemes across MS and for which mandatory reporting requirements do not exist. Among several transmission routes, listeriosis in animals can be acquired via the consumption of contaminated feed such as poor‐quality silage. Data on L. monocytogenes occurrence in feed are only collected as part of clinical investigations in farm animals. Hence, monitoring data on L. monocytogenes in animal feed are rarely available.
3.2.3. foodborne outbreaks of listeriosis
Reporting of foodborne outbreaks is mandatory according to Zoonoses Directive 2003/99/EC and the reported data represent the most comprehensive set of data available at the EU level for assessing their public health burden – including those caused by L. monocytogenes. More details can be found in the chapter on foodborne outbreaks.
Since 1 February 2020, the United Kingdom has become a third country. Food, animal and foodborne outbreak data from the United Kingdom were still collected by EFSA for 2020 in the framework of Zoonoses Directive 2003/99/EC, but are excluded for the EU statistics.
3.3. Data analyses
The following two data streams were selected for summarising the information on L. monocytogenes in RTE food: data on RTE food in the context of Regulation (EC) No 2073/2005 on microbiological criteria and other monitoring data for L. monocytogenes in RTE food.
3.3.1. Data on RTE food in the context of Regulation (EC) No 2073/2005 on microbiological criteria
The first data stream is official food chain control data; these data comprise samples collected by the CA as part of verification of L. monocytogenes FSC listed in Regulation (EC) No 2073/2005, which are to be complied by FBOp. These data were filtered from the database using the criteria ‘official sampling’ for the sampler, ‘single units’ for the sampling unit and ‘objective sampling’ for the sampling strategy.
Listeria monocytogenes FSC of Regulation (EC) No 2073/2005 are specified by RTE food category and by sampling stage, and are underpinned by the results of either the detection (ISO, 2017b) or enumeration (ISO, 2017a) analytical methods (Table 28).
Table 28.
Listeria monocytogenes FSC as described in Regulation (EC) No 2073/2005 for the different RTE categories across the food chain
| Sampling stage | RTE foods intended for infants and RTE foods for special medical purposes | Other RTE foods | |
|---|---|---|---|
| Able to support the growth of Lm | Unable to support the growth of Lm | ||
| Processing a | NA | Based on detection method: Lm not detected in 25 g of sample (n = 5, c = 0) c | NA |
| Retail b | Based on detection method: Lm not detected in 25 g of sample (n = 10, c = 0) | Based on enumeration method: limit of 100 CFU/g (n = 5, c = 0) d | Based on enumeration method: limit of 100 CFU/g (n = 5, c = 0) |
Lm: Listeria monocytogenes; NA: not applicable; RTE: ready‐to‐eat.
Before the food has left the immediate control of the food business operator who has produced it.
Products placed on the market during their shelf‐life.
n = number of units comprising the sample (number of sample units per food batch that are required for testing); c = the maximum allowable number of sample units yielding unsatisfactory test results. In a two‐class attributes sampling plan defined by n = 10, c = 0 and a microbiological limit of ‘not detected in 25 g’, in order for the food batch to be considered acceptable, L. monocytogenes must not be detected in qualitative (detection) analyses of 25‐g food test portions obtained from each one of 10 sample units taken from the batch. If even one of the sample units from the batch is found to contain L. monocytogenes (detected in 25 g), then the entire batch is deemed unacceptable. This criterion applies to products before they have left the immediate control of the producing food business operator, when the operator is not able to demonstrate, to the satisfaction of the competent authority, that the product will not exceed the limit of 100 CFU/g throughout the shelf‐life.
This criterion applies if the manufacturer is able to demonstrate, to the satisfaction of the competent authority, that the product will not exceed the limit 100 CFU/g throughout the shelf‐life. The operator may fix intermediate limits during the process that should be low enough to guarantee that the limit of 100 CFU/g is not exceeded at the end of the shelf‐life.
Data reported by MS were separated into the different categories of RTE food/sampling stages based on the assumptions described in the EU summary zoonoses and foodborne outbreaks report of 2016 (EFSA and ECDC, 2017). Briefly, these assumptions are: all sampling units that were collected from ‘cutting plants’ and ‘processing plants’ were considered units collected at the processing stage, while sampling units that were obtained from ‘catering’, ‘hospital or medical care facility’, ‘retail’, ‘wholesale’, ‘restaurant or cafe or pub or bar or hotel or catering service’, ‘border inspection activities’, ‘packing centre’ and ‘automatic distribution system for raw milk’ were considered units collected at retail. When the stage was ‘not available’ or ‘unspecified’, data were also considered part of the retail stage. As no data on the physico‐chemical parameters of the sampled foods, such as pH, water activity (aw) and levels and types of preservatives, are provided to EFSA, it was considered that all RTE foods were able to support the growth of L. monocytogenes; thus, the criterion applied to samples collected at the processing stage within the context of Regulation (EC) No 2073/2005 was ‘not detected in 25 g’. Two exceptions were applied for ‘hard cheeses’ and ‘fermented sausages’, for which the criterion of ‘≤ 100 CFU/g’ was applied. EFSA assumes that ‘hard cheeses’ and ‘fermented sausages’ belong to the category of foods that are unable to support the growth of L. monocytogenes, because foods classified under these two categories of RTE products undergo ripening/fermentation and are expected to have low pH and moderate aw values. More information on the impact of RTE food processing, like fermentation and drying, on pathogen loads in the RTE food can be found elsewhere (EFSA BIOHAZ Panel, 2018). The RTE foods that are considered able to support the growth of L. monocytogenes are expected to have near‐neutral or moderately low pH and relatively high aw values or can be very heterogeneous in terms of their manufacturing technology and physico‐chemical characteristics. In assessing the RTE food category ‘other dairy products’, EFSA presents the results in a conservative way, by considering all ‘other dairy products’ capable of supporting the growth of L. monocytogenes.
3.3.2. Other monitoring data for Listeria monocytogenes in RTE food
The second data stream includes all monitoring and surveillance activity results reported by MS and non‐MS to assess the occurrence of L. monocytogenes in different RTE food categories. In this case, only the data retrieved using detection methods were used, as these have higher sensitivity compared to quantitative investigations (using L. monocytogenes enumeration methods). All levels of sampling unit (single and batches), all sampling stages and all sampler and sampling contexts (surveillance, monitoring and surveillance – based on Regulation (EC) No 2073/2005) were considered. Only data obtained from the sampling strategies ‘objective sampling’ and ‘census sampling’ were used, excluding data reported from ‘convenient sampling’, ‘suspect sampling’, ‘selective sampling’ and ‘other’ contexts.
Specific figures were prepared to illustrate the occurrence in different RTE food categories during the 2017–2020 period. Each point in these graphs represents the overall observed occurrence and the 2.5th and 97.5th percentiles of the uncertainty distributions of these occurrences. Data used to calculate uncertainty levels were the total number of samples (n) and the number of positive samples (s) observed. The uncertainty distributions were calculated with the distribution beta (s + 1, n – s + 1) (Vose, 2019).
Since data were mostly reported by a limited number of MS and are of a heterogeneous nature, as various subcategories are included, the findings presented in these figures may not be representative of the EU level or directly comparable across years.
3.3.3. Monitoring data for Listeria monocytogenes in animals and feed
For animals and feed, all sampling strategies were included, even data reported for ‘suspect sampling’ and ‘selective sampling’.
3.4. Results
3.4.1. Overview of key statistics, EU, 2016–2020
Table 29 summarises EU‐level statistics on human listeriosis and on samples from RTE food tested for L. monocytogenes during 2016–2020. Food data of interest reported were classified into the major categories and aggregated by year to obtain an annual overview of the volume of data submitted. The sampling effort of the MS in 2020 for L. monocytogenes in some major RTE food categories can be found in Appendix A.
Table 29.
Summary statistics on human invasive L. monocytogenes infections and on sampled major RTE food categories in the EU, 2016–2020
| 2020 | 2019 a | 2018 a | 2017 a | 2016 a | Data source | |
|---|---|---|---|---|---|---|
| Humans | ||||||
| Total number of confirmed cases | 1,876 | 2,621 | 2,544 | 2,475 | 2,500 | ECDC |
| Total number of confirmed cases/100,000 population (notification rates) | 0.42 | 0.46 | 0.47 | 0.47 | 0.46 | ECDC |
| Number of reporting MS | 27 | 28 | 28 | 28 | 28 | ECDC |
| Infection acquired in the EU | 1,285 | 1,816 | 1,640 | 1,639 | 1,539 | ECDC |
| Infection acquired outside the EU | 5 | 14 | 8 | 4 | 6 | ECDC |
| Unknown travel status or unknown country of infection | 586 | 791 | 897 | 832 | 955 | ECDC |
| Number of outbreak‐related cases | 120 | 349 | 159 | 39 | 27 | EFSA |
| Total number of outbreaks | 16 | 21 | 14 | 10 | 6 | EFSA |
| RTE food categories b | ||||||
| RTE milk and milk products | N = 49,132; 23 MS | N = 62,019; 23 MS | N = 59,313; 23 MS | N = 56,428; 25 MS | N = 34,850; 26 MS | EFSA |
| RTE meat and meat products | N = 39,861; 22 MS | N = 64,666; 22 MS | N = 57,861; 22 MS | N = 45,219; 24 MS | N = 25,195; 21 MS | EFSA |
| RTE fish and fishery products | N = 11,139; 23 MS | N = 13,376; 22 MS | N = 14,081; 22 MS | N = 12,604; 24 MS | N = 6,601; 23 MS | EFSA |
| Other RTE food products | N = 34,454; 24 MS | N = 76,657; 24 MS | N = 25,179; 22 MS | N = 23,915; 23 MS | N = 21,085; 22 MS | EFSA |
| RTE foods intended for infants and for special medical purposes | N = 1,760; 19 MS | N = 1,721; 18 MS | N = 1,663; 18 MS | N = 1,462; 20 MS | N = 1,274; 16 MS | EFSA |
MS: Member State; RTE: ready‐to‐eat.
Data reported by the United Kingdom for the years 2016–2019 were considered (EU‐28). Since 1 February 2020, the United Kingdom has become a third country and its 2020 data are not represented for 2020 in this EU overview.
Number of sampling units tested by detection or enumeration method; number of reporting MS. More details on the number of samples per MS and for non‐MS can be found in Appendix A.
In 2020, the most sampled RTE food categories for L. monocytogenes detection and/or enumeration were ‘RTE milk and milk products’ (36% of total RTE food samples) and ‘RTE meat and meat products’ (29%). ‘RTE fish and fishery products’ samples represented 8% of the total reported by MS.
The total number of sample units tested decreased by 37.6% in 2020 (136,346 samples) compared with 2019 (218,439 samples). All RTE food categories were represented, except ‘foods intended for infants and for special medical purposes’. This decrease was observed for 14 MS. The withdrawal of the United Kingdom from the EU may not have had a major impact on the overall decrease since the annual number of samples tested by the United Kingdom has represented less than 0.5% of the total number of samples in the EU during the previous 3 years. The 2020 decrease may be partly explained by the impact of the COVID‐19 pandemic, as described in the discussion, and partly by the non‐reporting of data by Poland (in 2019, 17% of the total units tested for RTE foods were reported by Poland). The number of units sampled in the EU decreased by 17% for ‘fish and fishery products’, 21% for ‘milk and milk products’, 38% for ‘meat and meat products’ and 55% for ‘other RTE’. By contrast, in 2020, Spain increased the number of units tested in all RTE food categories (+ 126% in total, compared with 2019).
Appendix A contains information on the samples taken by country at the processing and retail levels. 91% of ‘RTE milk and milk products’ data were provided in decreasing order by Italy (23.0% of tested samples of this RTE category), Romania, Germany, Bulgaria, the Netherlands, Spain, Belgium, Slovakia and Hungary. 90% of ‘RTE meat and meat products’ were provided by Romania, Germany, Spain, Belgium, Slovakia, Bulgaria, France and Ireland, and 87% of ‘fish and fishery products’ were provided by the Netherlands, Spain, Romania, Germany, France, Belgium, Italy and Bulgaria (also in decreasing order). As for previous years, ‘other RTE products’ were mainly reported by Romania (32% of the total reported in this category) and relatively few samples (1%) were reported for ‘RTE foods intended for infants and for medical purposes’ (57% of samples in this category were provided by Slovakia, Belgium and Germany).
3.4.2. Human listeriosis
In 2020, 27 MS reported 1,876 confirmed cases of invasive listeriosis in humans (Tables 29 and 30). The EU notification rate was 0.42 cases per 100,000 population, which was a decrease of 7.1% and 14.2% compared with the rate in 2019 (0.46 and 0.49 per 100,000 population) with and without the data from the United Kingdom, respectively. The highest notification rates were observed for Finland, Slovenia, Malta and Sweden, with 1.7, 1.2, 0.97 and 0.85 cases per 100,000 population, respectively. The lowest notification rates were reported by Romania, Bulgaria, Croatia, Ireland, Slovakia, Czechia, Poland and Greece (≤ 0.19 per 100,000).
Table 30.
Reported cases of human invasive listeriosis and notification rates per 100,000 population in EU MS and non‐MS countries by country and year, 2016–2020
| Country | 2020 | 2019 | 2018 | 2017 | 2016 | |||||||
|---|---|---|---|---|---|---|---|---|---|---|---|---|
| National coverage a | Data format a | Confirmed cases and rates | Confirmed cases and rates | Confirmed cases and rates | Confirmed cases and rates | Confirmed cases and rates | ||||||
| Cases | Rate | Cases | Rate | Cases | Rate | Cases | Rate | Cases | Rate | |||
| Austria | Y | C | 41 | 0.46 | 38 | 0.43 | 27 | 0.31 | 32 | 0.36 | 46 | 0.53 |
| Belgium b | N | C | 54 | 0.59 | 66 | 0.72 | 74 | 0.81 | 73 | 0.80 | 103 | 1.1 |
| Bulgaria | Y | A | 4 | 0.06 | 13 | 0.19 | 9 | 0.13 | 13 | 0.18 | 5 | 0.07 |
| Croatia | Y | C | 5 | 0.12 | 6 | 0.15 | 4 | 0.10 | 8 | 0.19 | 4 | 0.10 |
| Cyprus | Y | C | 2 | 0.23 | 1 | 0.11 | 1 | 0.12 | 0 | 0 | 0 | 0 |
| Czechia | Y | C | 16 | 0.15 | 27 | 0.25 | 31 | 0.29 | 30 | 0.28 | 47 | 0.45 |
| Denmark | Y | C | 44 | 0.76 | 61 | 1.1 | 49 | 0.85 | 58 | 1.0 | 40 | 0.70 |
| Estonia | Y | C | 3 | 0.23 | 21 | 1.6 | 27 | 2.0 | 4 | 0.30 | 9 | 0.68 |
| Finland | Y | C | 94 | 1.7 | 50 | 0.91 | 80 | 1.5 | 89 | 1.6 | 67 | 1.2 |
| France | Y | C | 334 | 0.50 | 373 | 0.56 | 338 | 0.50 | 370 | 0.55 | 375 | 0.56 |
| Germany | Y | C | 544 | 0.65 | 570 | 0.69 | 678 | 0.82 | 721 | 0.87 | 662 | 0.81 |
| Greece | Y | C | 20 | 0.19 | 10 | 0.09 | 19 | 0.18 | 20 | 0.19 | 20 | 0.19 |
| Hungary | Y | C | 32 | 0.33 | 39 | 0.40 | 24 | 0.25 | 36 | 0.37 | 25 | 0.25 |
| Ireland | Y | C | 6 | 0.12 | 17 | 0.35 | 21 | 0.43 | 14 | 0.29 | 13 | 0.28 |
| Italy | Y | C | 147 | 0.25 | 202 | 0.34 | 178 | 0.29 | 164 | 0.27 | 179 | 0.30 |
| Latvia | Y | C | 8 | 0.42 | 6 | 0.31 | 15 | 0.78 | 3 | 0.15 | 6 | 0.30 |
| Lithuania | Y | C | 0 | 0 | 6 | 0.21 | 20 | 0.71 | 9 | 0.32 | 10 | 0.35 |
| Luxembourg | Y | C | 4 | 0.64 | 3 | 0.49 | 5 | 0.83 | 5 | 0.85 | 2 | 0.35 |
| Malta | Y | C | 5 | 0.97 | 5 | 1.0 | 1 | 0.21 | 0 | 0 | 1 | 0.22 |
| Netherlands | Y | C | 90 | 0.52 | 103 | 0.60 | 69 | 0.40 | 108 | 0.63 | 89 | 0.52 |
| Poland | Y | C | 62 | 0.16 | 121 | 0.32 | 128 | 0.34 | 116 | 0.31 | 101 | 0.27 |
| Portugal | Y | C | 47 | 0.46 | 56 | 0.54 | 64 | 0.62 | 42 | 0.41 | 31 | 0.30 |
| Romania | Y | C | 2 | 0.01 | 17 | 0.09 | 28 | 0.14 | 10 | 0.05 | 9 | 0.05 |
| Slovakia | Y | C | 7 | 0.13 | 18 | 0.33 | 17 | 0.31 | 12 | 0.22 | 10 | 0.18 |
| Slovenia | Y | C | 26 | 1.2 | 20 | 0.96 | 10 | 0.48 | 13 | 0.63 | 15 | 0.73 |
| Spain(c)(d) | N | C | 191 | – | 505 | – | 370 | – | 284 | – | 362 | – |
| Sweden | Y | C | 88 | 0.85 | 113 | 1.1 | 89 | 0.88 | 81 | 0.81 | 68 | 0.69 |
| EU Total 27 | – | – | 1,876 | 0.42 | 2,467 | 0.49 | 2,376 | 0.50 | 2,315 | 0.51 | 2,299 | 0.49 |
| United Kingdom | – | – | – | – | 154 | 0.23 | 168 | 0.25 | 160 | 0.24 | 201 | 0.31 |
| EU Total e | – | – | 1,876 | 0.42 | 2,621 | 0.46 | 2,544 | 0.47 | 2,475 | 0.47 | 2,500 | 0.46 |
| Iceland | Y | C | 4 | 1.1 | 4 | 1.1 | 2 | 0.57 | 6 | 1.8 | 0 | 0 |
| Norway | Y | C | 37 | 0.69 | 27 | 0.51 | 24 | 0.45 | 16 | 0.30 | 19 | 0.36 |
| Switzerlandf | Y | C | 58 | 0.67 | 36 | 0.42 | 52 | 0.61 | 45 | 0.53 | 50 | 0.60 |
–: Data not reported.
Y: yes; N: no; A: aggregated data; C: case‐based data.
Sentinel system; notification rates calculated with an estimated population coverage of 80% for Belgium.
Sentinel surveillance; no information on estimated coverage. Notification rate not estimated for Spain.
Data not complete in 2020, rate not estimated.
Cases reported by the United Kingdom in years 2016–2019 were also considered for this estimate (EU‐28). When 2016–2019 UK data were collected, the UK was an EU MS but since 1 February 2020, it has become a third country.
Switzerland provided data directly to EFSA. The human data for Switzerland include data from Liechtenstein.
The majority of listeriosis cases (1,285) with known origin of infection were reported to have been acquired in the EU in 2020 (Table 29). Only five travel‐associated listeriosis cases were reported outside the EU (Belarus, the United Kingdom, Syria, Serbia and Turkey) in 2020 vs. 14 outside the EU in 2019, and 586 cases were reported without data on travel status, or with unknown country of infection.
The distribution by month seems to be quite stable. Over the last 5 years (2016–2020), there was slightly greater reporting of cases in the second half of the year (Figure 19). Although a decrease in cases was observed in 2020, the overall EU trend for listeriosis in the period 2016–2020 did not show any statistically significant increase or decrease.
Figure 19.

- Source: Austria, Belgium, Czechia, Cyprus, Denmark, Estonia, Germany, Greece, Finland, France, Hungary, Ireland, Italy, Latvia, Lithuania, Malta, the Netherlands, Poland, Romania, Sweden, Slovakia, Slovenia.
A significantly increasing trend was reported by Malta over the period 2016–2020 (p < 0.01) although the numbers are few. Conversely, Czechia and Belgium reported a significantly decreasing trend (p < 0.01) in the last 5 years (2016–2020).
Information on hospitalisation was provided by 18 MS for 42.8% of all confirmed cases in 2020, a decrease compared with 2019. Among the cases with information on hospitalisation status, 97.1% were hospitalised. Listeriosis had the highest proportion of hospitalised cases of all zoonoses under EU surveillance. The outcome was reported for 1,283 confirmed cases (68.4%). Twenty‐one MS reported 167 deaths from listeriosis in 2020. This represented a 55.7% decrease compared with 2019 (300 deaths). There was a steady increase in the annual number of deaths between 2010 and 2019 (annual average: 217) which dropped in 2020. The overall EU case fatality rate among cases with known outcome was 13.0%, a slight decrease compared to previous years (13.6% in 2018 and 17.6% in 2019).
France reported the highest number of fatal cases (43) followed by Spain (33) and Germany (26). L. monocytogenes infections were most commonly reported in the age group over 64. At the EU level, the proportion of listeriosis cases in this age group has steadily increased from 56.1% in 2008 to 64.5% in 2019 and 72.5% in 2020. In the age group over 84, there was an increase from 7.3% to 17.1% in 2019 and 2020, respectively. Within fatal cases of listeriosis, 58.1% of cases were in the 64–84 age group, while 22.8% were in the age group over 84.
Human listeriosis cases and cases associated with foodborne outbreaks
In total, 1,876 confirmed human listeriosis cases were reported to TESSy in 2020 (Table 30). Overall, there were 1,283 domestic (acquired within the home country) confirmed listeriosis cases reported, which was 99.8% (1,285) of the listeriosis cases acquired in the EU (domestically or through travel within the EU) during 2020 (Table 29).
L. monocytogenes was identified as the causative agent in nine strong‐evidence and seven weak‐evidence foodborne outbreaks in 2020 that together affected 120 people in the EU, with 83 hospitalised cases (of which 34 were in Germany) and 17 deaths, as reported to EFSA. Six of the strong‐evidence foodborne outbreaks were caused by ‘fish and fishery products’ (two in the Netherlands, two in Denmark, one in Austria and one in Germany), two by ‘meat and meat products’ (two in Finland) and one by ‘dairy products’ (cheeses). Of the seven weak‐evidence foodborne outbreaks, one was related to ‘dairy products’ (other than cheeses) and for six, the food vehicle was unknown.
Comparing the foodborne outbreak cases (120) and confirmed cases of human invasive listeriosis acquired in the EU (1,869), and also considering the proportion of unknown travel data (0.996 × 1,876) (Table 29), it could be suggested that overall in the EU, in 2020, only 6.4% of human listeriosis cases would be reported through foodborne outbreak investigation. It is important to mention that case classification for reporting is different between these two databases. In TESSy, the reported cases are classified based on the EU case definition. All these cases visited a doctor and are either confirmed by a laboratory test (confirmed case) or not (probable case and classification is based on the clinical symptoms and epidemiological link). Also, surveillance of listeriosis in humans in the EU is based on invasive forms of L. monocytogenes infection, mostly manifesting as septicaemia, meningitis or spontaneous abortion. Cases that never visited a doctor are not reported to TESSy. Moreover, there may be missing probable cases in TESSy, as these data are not analysed or published and there is no incentive for reporting such cases. Information on which cases are linked to an outbreak and which are not is also not systematically collected. In practice, the cases reported to TESSy are considered to be mostly sporadic. In foodborne outbreaks, the human cases are the people involved in the outbreak as defined by the investigators (case definition), and cases must be linked, or probably linked, to the same food source (Directive 2003/99/EC). This can include both ill people (whether confirmed microbiologically or not) and people with confirmed asymptomatic infections (EFSA, 2014).
For further information, see the chapter on foodborne outbreaks.
3.4.3. Listeria monocytogenes in food
Data on L. monocytogenes in RTE foods in the context of the Food Safety Criteria laid down in Regulation (EC) No 2073/2005
In total, 17 MS (Austria, Belgium, Bulgaria, Croatia, Cyprus, Czechia, Denmark, Estonia, France, Greece, Hungary, Latvia, Luxembourg, Romania, Slovakia, Slovenia and Spain) reported data according to the specifications mentioned above (Section 3.2.2) for 11 RTE food categories (Table 31).
Table 31.
Proportions (%) positive single samples from official sampling by CA in the context of verification of the implementation by FBOp of the Listeria monocytogenes FSC according to Regulation (EC) No 2073/2005, EU, 2020
| RTE food category a | Processing stage b | Retail c | ||
|---|---|---|---|---|
| Analytical method d | ||||
| Detection | Enumeration | Detection | Enumeration | |
| Foods intended for infants and for medical purposes: data reported from BE, EE, ES, HU, RO, SK, SI | 0 (N = 688; 7 MS) e | |||
| Fish: data reported from BE, BG, CY, DK, EE, ES, FR, HR, LV, SK | 3.5 (N = 511; 7 MS) | 1.4 (N = 1,331; 9 MS) | ||
| Fishery products: data reported from AT, BE, BG, DK, EE, FR, HR, LV, RO, SK, SI, ES | 3.8 (N = 479; 7 MS) | 1.3 (N = 1,017; 10 MS) | ||
| Cheeses, soft and semi‐soft: data reported from AT, BE, BG, EE, ES, HR, HU, LV, RO, SK | 0.50 (N = 2,532; 9 MS) | 0 (N = 1,866; 7 MS) | ||
| Cheeses, hard: data reported from BG, ES, RO, SK | 0 (N = 273; 4 MS) | |||
| Cheeses, unspecified: data reported from AT, BE, ES, HU, LU, SI | 0 (N = 130; 4 MS) | 0.90 (N = 228; 4 MS) | ||
| Other dairy products (excluding cheeses) – entire category: data reported from AT, BE, BG, EE, ES, CZ, HR, HU, LV, LU, RO, SK, SI | 0.11 (N = 912; 9 MS) | 0 (N = 981; 10 MS) | ||
| Milk: data reported from AT, BG, ES, HR, RO, SK | 0 (N = 132; 5 MS) | 0 (N = 183; 3 MS) | ||
| Products of meat origin, fermented sausages: data reported from BE, BG, CY, ES, HR, HU, SK | 0.42 (N = 481; 7 MS) | |||
| Products of meat origin, other than fermented sausages: Data reported from AT, BE, BG, CY, CZ, EE, ES, HR, HU, LV, LU, RO, SK, SI | 2.2 (N = 6,108; 10 MS) | 0.52 (N = 3,243; 12 MS) | ||
| Other products: data reported from AT, BE, BG, HR, CY, CZ, DK, EE, FR, ES HU, LV, LU, RO, SK, SI | 1.3 (N = 1,616; 19 MS) | 0.26 (N = 3,918; 14 MS) | ||
MS: Member State; N: number of single samples tested.
Grey boxes are not applicable in relation to the analytical method for the specific food category and sampling stage in the context of Regulation (EC) No. 2073/2005.
In the absence of relevant physico‐chemical data (pH, aw), EFSA assumes that foods listed under ‘fish and fishery products’, ‘soft and semi‐soft cheeses’, ‘unspecified cheeses’, ‘milk’, ‘products of meat origin other than fermented sausages’, ‘other dairy products’ and ‘other products’ belong to the category of foods that are able to support the growth of L. monocytogenes. EFSA assumes that ‘fermented sausages’ and ‘hard cheeses’ belong to the category of foods that are unable to support the growth of L. monocytogenes.
: Includes sampling units that were collected from ‘cutting plants’ and ‘processing plants’.
Includes sampling units that were obtained from ‘catering’, ‘hospital or medical care facility’, ‘retail’, ‘wholesale’, ‘not available’, ‘unspecified’, ‘restaurant or cafe or pub or bar or hotel or catering service’, ‘automatic distribution system for raw milk’, ‘border inspection’ and ‘packing centre’.
The results from qualitative examinations using a detection method were used to assess the criterion of ‘not detected in 25 g’ and the results from quantitative analyses using an enumeration method were used to assess the criterion of ‘≤ 100 CFU/g’.
Each cell contains the percentage (%) of positive samples (the detection of L. monocytogenes in 25 g of sample for qualitative analyses or number of L. monocytogenes > or < 100 CFU/g for enumeration analyses) and in parenthesis, the number of tested samples (single samples or batches) and the number of reporting MS.
At retail, depending on the RTE food category, 0.0–1.4% of single samples from official sampling were positive for L. monocytogenes, whereas at the processing level, results ranged from 0.0% to 3.8%. A lower overall proportion of positives was reported at the retail level compared with the processing stage for all RTE food categories, except for ‘cheeses, unspecified’, for which this proportion remained lower than 1%. ‘Fish’ and ‘fishery products’ presented the highest proportion of positive samples at retail.
Other monitoring data for Listeria monocytogenes in RTE food
Details on the occurrence of L. monocytogenes (detection results) in the main RTE food matrices in 2020, together with 2019 and 2018 results, are presented in Appendix B. The text below summarises the results for the major food categories for the 2017–2020 period.
Fish and fishery products, RTE
Over the 2017–2020 period, 22 MS and four non‐MS (Iceland, North Macedonia, Montenegro and Serbia) reported such data on RTE fish and fishery products.
A summary of the occurrence of L. monocytogenes‐positive units in RTE fish and fishery products in the EU over the period 2017–2020 is presented in (Figure 20). In 2020, the overall occurrence of L. monocytogenes for RTE fish was 4.3% (number of units tested = 2,645, in 14 MS) with Germany, the Netherlands and Spain reporting more than 80% of the positive samples. The overall occurrence of L. monocytogenes for RTE fishery products was 4.1% (number of units tested = 1,719, in 16 MS), with Austria, Estonia, Germany, Spain and the Netherlands reporting more than 80% of positive samples. The occurrence by merging all RTE fish and RTE fishery products was 5.3%, 3.1%, 4.1% and 4.2% for the period 2017–2020.
Figure 20.

Proportion of Listeria monocytogenes positive sampling units (all sampling stages) by detection method in RTE fish and fishery products, EU, 2020–2017
Meat and meat products, RTE
Over the 2017–2020 period, 22 MS and four non‐MS (Albania, North Macedonia, Montenegro and Serbia) reported data from RTE meat products.
In 2020, 40.4% of the 16,295 units tested for RTE meat were assigned to the four major animal species, with a large majority to pigs (28.0% of tested units). RTE meat from bovines, broilers and turkeys represented 5.3%, 1.9% and 1% of all tested samples, respectively. The remaining 51% of tested samples were from other animal species, unspecified or mixed meat.
Combining all RTE meat product categories, the overall occurrence of L. monocytogenes in RTE meat products was 4.8% (779 positives out of 16,295 units tested). A summary of the proportion of L. monocytogenes‐positive units in the EU in RTE meat and meat products according to the main animal species is presented in Figure 21.
Figure 21.

Proportion of Listeria monocytogenes positive sampling units (all sampling stages) by the detection method in RTE meat and meat products (pork meat, turkey meat, broiler meat, bovine meat), EU, 2020–2017
Pork meat products
In 2020, 14 MS reported data on RTE pork meat products and, overall, in the EU, L. monocytogenes was detected in 3.0% of the 6,585 units tested. Bulgaria, Romania and Spain provided 63.3% of data on RTE pork meat. The detail of occurrence for pork meat is given in Figure 21.
Poultry meat products (broilers and turkeys)
In 2020, 10 MS reported data on RTE broiler and turkey meat products. Overall, L. monocytogenes was detected in 0.65% of the 464 tested units in the EU. The detail of occurrence for the broiler and turkey categories is given in Figure 21.
Bovine meat products
In 2020, 14 MS reported data on RTE bovine meat products. Overall, L. monocytogenes was detected in 7.4% of the 856 units tested in the EU. 44 positive results out of 63 positives in total came from one investigation reported by the Netherlands. The detail of occurrence for bovine meat is given in Figure 21.
Milk and milk products, RTE
Combining all RTE milk and milk product categories, the overall occurrence of L. monocytogenes was 0.44% (82 positives out of 18,465 units tested).
Cheese
Over the 2017–2020 period, 19 MS and 2 non‐MS (Montenegro and North Macedonia) reported data on RTE cheese products. In 2020, 15 MS and three non‐MS (Montenegro, North Macedonia and Serbia) reported data on L. monocytogenes detection in cheeses. Bulgaria, Belgium, Germany, the Netherlands, Romania and Spain were the major contributors for all cheese samples tested (81.5% of total units tested).
Cheeses made from pasteurised cow milk represent more than 64.7% of cheese samples collected and reported. Overall, considering all milk origins (species) and all types of cheeses, L. monocytogenes was detected in 0.54% of the 11,934 cheese samples tested.
A summary of the proportion of L. monocytogenes‐positive units for the various types of cheeses is presented in Figure 22. In 2020, the L. monocytogenes occurrence rates in soft and semi‐soft cheeses (SSC) and hard cheeses (HC) made from raw‐low heat treated (LHT) milk were 0.67% and 1.4%, respectively. The occurrence rates for SSC and HC made from pasteurised milk were 0.68% and 0.29%, respectively. Considering the 2017–2020 time period, for HC and SSC, the occurrence rates for raw‐LHT cheeses and pasteurised cheese are comparable.
Figure 22.

Proportion of Listeria monocytogenes positive sampling units (all sampling stages) by the detection method in cheeses (soft and semi‐soft cheeses raw milk, hard cheese raw milk, hard cheese pasteurised milk, soft and semisoft cheese pasteurised milk), EU, 2020–2017
Fruits and vegetables, RTE
In 2020, 14 MS provided data from investigations of L. monocytogenes on 1,874 units of ‘RTE fruit and vegetables’ tested using a detection method. The overall occurrence was 2.9% (compared with 1.6% in 1,783 units tested in 2019). Austria, Germany, Hungary and Spain mainly contributed to the sampling effort, with nearly 85% of the samples in 2020. The ‘RTE fruit and vegetables’ occurrence rates over the 2017–2020 period are presented in Figure 23.
Figure 23.

Proportion of Listeria monocytogenes positive sampling units (all sampling stages) by the detection method in fruits and vegetables, EU, 2020–2017
3.4.4. Listeria spp. in animals
In 2020, 13 MS and three non‐MS (North Macedonia, Switzerland and the United Kingdom) reported data on several animal categories (food‐producing, wild‐, zoo‐ and pet animals, including birds) from different species (Table 32). Reported data were mainly results from tested animals (99%) compared with other sampling unit levels (‘herd/flock’ and ‘holding’). In the EU, the major animal data for Listeria testing concerned cattle (75.3% of total units tested), pigs (10.1%) and sheep (8.6%). The sample size, as well as the sampling strategy and the proportion of positive samples, varied considerably among the reporting countries and animal species. Most EU data at the animal level were reported by two MS, the Netherlands (52.5%) and Ireland (32.2%).
Table 32.
Summary of Listeria statistics related to major animal species, reporting MS and non‐MS, 2020
| Animal species | N of reporting MS | N of tested units | % of positive units | N of positive units for | |||
|---|---|---|---|---|---|---|---|
| L. monocytogenes | L. ivanovii | L. innocua | Other Listeria species | ||||
| Cattle | 12 | 17,741 | 1.0 | 105 | 1 | 2 | 62 |
| Sheep | 12 | 2,015 | 4.5 | 37 | 7 | 2 | 45 |
| Pigs | 5 | 2,373 | 0.08 | 2 | 0 | 0 | 0 |
| Others | 10 | 1,438 | 3.1 | 16 | 0 | 0 | 28 |
| Total EU | 13 | 23,567 | 1.3 | 160 | 8 | 4 | 135 |
MS: Member States.
In total, considering the three sampling units (animal, herd/flock and holding) together, MS reported 23,567 tested units for Listeria spp. and 307 (1.3%) were found to be positive. Cattle were the most sampled animal species (75.3% of tested units). In this species, the percentage of positive units was very low (1.0%). Among the positive units, 160 (52.1%) were reported as being positive for L. monocytogenes and only limited positive findings were reported as Listeria ivanovii (eight units, 2.6%) and Listeria innocua (four units, 1.3%). As in previous years, many positive findings for Listeria (135 units, 44.0%) were reported as other or unspecified species.
3.4.5. Listeria monocytogenes in feed
In 2020, Romania reported negative results in silage (N = 44 units tested) and Greece reported negative results in feed (N = 72 units tested).
3.5. Discussion
In 2020, the number of confirmed cases of human listeriosis was 1,876, corresponding to an EU notification rate of 0.42 per 100,000 population. The withdrawal of the United Kingdom from the EU resulted in a decrease of 14.2% in notification compared with the rate in 2019. Without data from the United Kingdom, the decrease in notification is 7.1%, which could be explained by the impact of the COVID‐19 pandemic, but listeriosis still remains one of the most serious foodborne diseases under EU surveillance. Listeriosis causes many hospitalisations, and high morbidity and mortality, particularly among the elderly. Data from 2020 in the majority of MS had medium to low comparability to the previous years.
Listeriosis had the highest proportion of hospitalised cases of all zoonoses under EU surveillance: although there was a reduction in cases and a decrease in notification rates for listeriosis, this change is less marked than for other foodborne zoonoses. Notwithstanding, the overall trend for listeriosis in 2016–2020 did not show any statistically significant increase or decrease. Few cases were linked to travel, only five: all of them involved travel outside the EU (Belarus, the United Kingdom, Syria, Serbia, Turkey). Since the beginning of EU‐level surveillance, most listeriosis cases have been reported in elderly people, in particular those over 64 years of age. At the EU level, the proportion of listeriosis cases in this age group has steadily increased from 56.1% in 2008 to 72.5% in 2020. In the age group over 84, there was an increase from 7.3% to 17.1% in the same time period. Despite the COVID‐19 pandemic, listeriosis continues to be one of the foodborne infections with the highest number of fatal cases in the EU. The high incidence of Listeria infections in the elderly may be partially explained by the ageing population in the EU, and the increase in chronic age‐related diseases (EFSA BIOHAZ Panel, 2020c). As ageing of the population will continue in most MS (EUROSTAT, 2021) in the coming years, it is important to raise awareness of listeriosis and its risks, especially among older people and pregnant women, associated with certain consumption habits and types of food (e.g. RTE fish products and frozen vegetables) (EFSA and ECDC, 2018b, 2019; EFSA BIOHAZ Panel, 2018, 2020c; Herrador et al., 2019; Špačková et al., 2021; Wilking et al., 2021).
L. monocytogenes was identified as the causative agent in nine strong‐evidence and seven weak‐evidence foodborne outbreaks in 2020 that together affected 120 people in the EU. foodborne outbreaks caused 83 hospitalisations (Germany, 34; the Netherlands, 24; Finland, 14; Italy, 7; France, 2; and Austria, 2). foodborne L. monocytogenes outbreaks caused 17 deaths in the EU, the highest number of deaths related to foodborne outbreaks. Six strong‐evidence foodborne outbreaks were caused by ‘fish and fishery products’ (two in the Netherlands, two in Denmark, one in Austria and one in Germany); two were caused by ‘meat and meat products’ (in Finland); and one by ‘cheeses’ (in the Netherlands).
Compared with 2019, the number of MS that reported data remained stable, while there was a reduction of monitoring activity in the food chain in 2020, as reported in the MS metadata, and leading to a 37.6% reduction in tested samples. As for previous years, the sampling effort at processing and retail remained focused on RTE products of animal origin. The occurrence of L. monocytogenes varied according to the RTE food category and sample stage. Official sampling carried out by the CA in the context of surveillance of the application of the FSC laid down in Regulation (EC) No 2073/2005 showed that the proportion of official positive single control samples remained very low to low at retail, from 0.0% for five out of 11 RTE categories to around 1.3% for ‘RTE fish’ and ‘RTE fishery products’. As for previous years, this proportion was systematically higher at the processing stage compared with the retail stage, for all categories of RTE food, with the highest proportion of positives for RTE fishery products (3.8%) and RTE fish (3.5%). Beyond considering the impact of the COVID‐19 pandemic, interpreting travel trends for occurrence must be carried out with caution, since each year reporting data can vary according to the number of reporting MS, the food categories included in different contexts of surveillance, the sampling efforts (sample size) and reporting attitudes.
In primary production, the low level of reporting by MS reflects the absence of harmonised EU regulations in this sector. Cattle are the most sampled animal species in the EU and presented a very low proportion of positive units (1.0%). L. monocytogenes surveillance in the EU currently uses tools based on genotyping to characterise isolates. With these new developments in diagnostics and changes in the epidemiology of listeriosis outbreaks, the Joint FAO/WHO Expert Meeting on Risk Assessment (JEMRA) launched new programs in 2020 on L. monocytogenes in RTE foods. EFSA/ECDC surveillance of L. monocytogenes changed from Pulsed‐field Gel Electrophoresis (PFGE) to typing with Core genome Multilocus sequence typing (cgMLST) systems, based on WGS data, which has a greater capacity for strain discrimination. ECDC and EFSA are working jointly to create interoperable databases in order to quickly identify outbreaks.
Combining human, animal and food epidemiological data with molecular and genotyping data provides an efficient methodology to better understand the ecology of this pathogen at different stages of the food chain, and will improve the investigation of listeriosis outbreaks affecting one or more MS (ECDC, EFSA and ANSES, 2021).
3.6. Related projects and internet sources
| Subject | For more information see | |
|---|---|---|
| Human | ECDC Surveillance Atlas of Infectious Diseases | http://atlas.ecdc.europa.eu/public/index.aspx |
| EU case definition of listeriosis | https://www.ecdc.europa.eu/en/surveillance‐and‐disease‐data/eu‐case‐definitions | |
| Disease Programme on Emerging, Food‐ and Vector‐Borne Diseases | https://www.ecdc.europa.eu/en/about‐us/who‐we‐are/units/disease‐programmes‐unit | |
| European Food‐ and Waterborne Diseases and Zoonoses Network (FWD‐Net) | https://www.ecdc.europa.eu/en/about‐us/partnerships‐and‐networks/disease‐and‐laboratory‐networks/fwd‐net | |
| World Health Organisation ‐ listeriosis fact sheet | https://www.who.int/news‐room/fact‐sheets/detail/listeriosis | |
| Humans and food | Commission Regulation (EC) No 2073/2005 – Food Safety Criteria for L. monocytogenes in the EU | http://eur‐lex.europa.eu/legal‐content/EN/TXT/PDF/?uri=CELEX:02005R2073–20170101&rid=1 |
| EU Baseline Survey 2010–2011– part A; L. monocytogenes prevalence estimates (scientific report of EFSA) | https://www.efsa.europa.eu/en/efsajournal/pub/3241 | |
| EU Baseline Survey 2010–2011 – part B; analysis of factors related to prevalence and exploring compliance (scientific report of EFSA) | https://www.efsa.europa.eu/en/efsajournal/pub/3810 | |
| L. monocytogenes contamination of RTE foods and the risk for human health in the EU (Scientific Opinion) |
https://www.efsa.europa.eu/en/efsajournal/pub/5134 https://efsa.onlinelibrary.wiley.com/doi/10.2903/j.efsa.2018.5134 |
|
| The public health risk posed by L. monocytogenes in frozen fruit and vegetables including herbs, blanched during processing (Scientific Opinion) | https://efsa.onlinelibrary.wiley.com/doi/full/10.2903/j.efsa.2020.6092 | |
| Whole genome sequencing and metagenomics for outbreak investigation, source attribution and risk assessment of foodborne microorganisms (Scientific Opinion) | https://efsa.onlinelibrary.wiley.com/doi/10.2903/j.efsa.2019.5898 | |
| Urgent scientific and technical assistance to provide recommendations for sampling and testing in the processing plants of frozen vegetables aiming at detecting L. monocytogenes (technical report) |
https://www.efsa.europa.eu/en/supporting/pub/en‐1445 https://efsa.onlinelibrary.wiley.com/doi/10.2903/sp.efsa.2018.EN‐1445 |
|
| Closing gaps for performing a risk assessment on L. monocytogenes in RTE foods: activity 1, an extensive literature search and study selection with data extraction on L. monocytogenes in a wide range of RTE food (external scientific report) | https://www.efsa.europa.eu/en/supporting/pub/1141e | |
| Closing gaps for performing a risk assessment on L. monocytogenes in RTE foods: activity 2, a quantitative risk characterisation on L. monocytogenes in RTE foods; starting from the retail stage (external scientific report) | https://www.efsa.europa.eu/en/supporting/pub/1252e | |
| Closing gaps for performing a risk assessment on L. monocytogenes in RTE foods: activity 3, the comparison of isolates from different compartments along the food chain and from humans using whole genome sequencing (WGS) analysis (external scientific report) | https://www.efsa.europa.eu/en/supporting/pub/1151e | |
| Evaluation of listeriosis risk related with the consumption of non‐prepackaged RTE cooked meat products handled at retail stores in Greece (external scientific report) |
https://www.efsa.europa.eu/en/supporting/pub/en‐1677 https://efsa.onlinelibrary.wiley.com/doi/10.2903/sp.efsa.2019.EN‐1677 |
|
| Quantitative assessment of relative risk to public health from foodborne L. monocytogenes among selected categories of RTE foods | https://www.fda.gov/food/cfsan‐risk‐safety‐assessments/quantitative‐assessment‐relative‐risk‐public‐health‐foodborne‐listeria‐monocytogenes‐among‐selected | |
| Risk assessment of L. monocytogenes in RTE foods: Technical report | http://www.fao.org/3/a‐y5394e.pdf | |
| Risk assessment of L. monocytogenes in RTE foods – Interpretive summary | http://www.fao.org/fileadmin/templates/agns/pdf/jemra/mra4_en.pdf | |
| FSIS comparative risk assessment for L. monocytogenes in RTE meat and poultry deli meats | https://www.fsis.usda.gov/sites/default/files/media_file/2020‐07/Comparative_RA_Lm_Report_May2010.pdf | |
| Interagency risk assessment: L. monocytogenes in retail delicatessens interpretative summary | https://www.fda.gov/media/87052/download | |
| Joint FAO/WHO Expert meeting on Microbiological Risk Assessment of L. monocytogenes in Ready‐to‐Eat (RTE) Food: Attribution, Characterisation and Monitoring | http://www.fao.org/3/cb3061en/cb3061en.pdf | |
| Guidance document on L. monocytogenes shelf‐life studies for RTE foods, under Regulation (EC) No 2073/2005 of 15 November 2005 on microbiological criteria for foodstuffs | https://ec.europa.eu/food/system/files/2016‐10/biosafety_fh_mc_guidance_document_lysteria.pdf | |
| EURL Lm TECHNICAL GUIDANCE DOCUMENT on challenge tests and durability studies for assessing shelf‐life of ready‐to‐eat foods related to Listeria monocytogenes | https://ec.europa.eu/food/system/files/2021‐07/biosafety_fh_mc_tech‐guide‐doc_listeria‐in‐rte‐foods_en_0.pdf | |
| Guidelines on the application of general principles of food hygiene to the control of L. monocytogenes in foods CXG 61‐2007 | http://www.fao.org/fao‐who‐codexalimentarius/codex‐texts/guidelines/en/ | |
| A public database of genome sequences, including L. monocytogenes sequences – GenomeTrakr | https://www.fda.gov/food/foodscienceresearch/wholegenomesequencingprogramwgs/ucm363134.htm | |
| The ECDC‐EFSA molecular typing database for European Union public health protection | https://euroreference.anses.fr/sites/default/files/17%2003%20ED%20ER%2002%201_RIZZI.pdf | |
| Comparison of the ISO method and three modifications of it for the enumeration of low concentrations of L. monocytogenes in naturally contaminated foods | https://euroreference.anses.fr/sites/default/files/3‐Comparison.pdf | |
| Annual national zoonoses country reports (reports of reporting countries on national trends and sources of zoonoses) | https://www.efsa.europa.eu/en/data‐report/biological‐hazards‐reports | |
| Joint ECDC, EFSA and EURL Lm report: European Listeria typing exercise (ELiTE), mars 2021 | https://www.ecdc.europa.eu/en/publications‐data/joint‐ecdc‐efsa‐and‐eurl‐lm‐report‐european‐listeria‐typing‐exercise‐elite | |
| Animals | Listeria monocytogenes | https://www.oie.int/app/uploads/2021/05/listeria‐monocytogenes‐infection‐with.pdf |
4. Shiga toxin‐producing Escherichia coli (STEC)
Tables and figures that are not presented in this chapter are published as supporting information to this report and are available as downloadable files from the EFSA Knowledge Junction on Zenodo at https://doi.org/10.5281/zenodo.5682809. Summary statistics of human surveillance data with downloadable files are retrievable using ECDC’s Surveillance Atlas of Infectious Diseases at http://atlas.ecdc.europa.eu/public/index.aspx

4.1. Key facts
-
•
In 2020, the number of confirmed cases of human STEC infection was 4,446. This made STEC the fourth most commonly reported foodborne gastrointestinal infection in humans in the EU.
-
•
A decrease of cases in 2020 was observed, probably due to the COVID‐19 pandemic. The overall trend for STEC infections however did not show any statistically significant increase or decrease in 2016–2020.
-
•
The EU notification rate was 1.5 per 100,000 population. This is a decrease of 22.4% and 18.2% compared with the rate in 2019 (1.9 and 1.8 per 100,000 population) with and without the 2019 data from the United Kingdom, respectively.
-
•
STEC was the fourth most frequent bacterial agent detected in foodborne outbreaks in the EU, with 34 outbreaks, 208 cases, 30 hospitalisations and 1 death reported in 2020.
-
•
The sources in the five strong‐evidence STEC foodborne outbreaks during 2020 were ‘tap water, including well water’ (two outbreaks), ‘meat and meat products’, ‘dairy products other than cheese’ and ‘cheeses made from cows’ milk’ (one outbreak each).
-
•
In 2020, 22 MS reported the presence of STEC in 2.4% of 19,036 food sample units taken according an ‘objective sampling’ strategy, compared with 2.8% in 2019.
-
•
‘Sprouted seeds’ were tested by six MS in the context of Regulation (EC) No 2073/2005 with no positive STEC units in 323 official samples.
-
•
Overall, STEC was most commonly found in ‘meat of different types’ derived from different animal species (3.4% STEC‐positive), followed by ‘milk and dairy products’ (2.1%), while ‘fruits and vegetables’ was the least contaminated category (0.1%).
-
•
Seventeen MS tested 7,924 ready‐to‐eat (RTE) food samples for STEC of which 105 (1.3%) were found to be STEC‐positive, including 28 (1.7%) ‘meat and meat product samples’, 33 (1.5%) ‘milk and milk product samples’, two (0.5%) samples from ‘spices and herbs’ and four STEC‐positive samples from ‘fruits, vegetables and juices’ (0.2%).
-
•
Of the STEC strains from food detected with the reference method ISO TS 13136:2012 and provided with information on the serogroup in 2020, 17.7% belonged to the so‐called ‘top five’ serogroups (O157, O26, O103, O111 and O145) and many of the remaining STEC belonged to the top 20 STEC serogroups reported in human infections to ECDC in 2016–2019.
-
•
Most of the virulotypes of STEC isolates from food and animals were also identified in severe STEC infections in humans. Only 39.3% (N = 220) of the STEC isolated from food in 2020 were reported together with information on the stx gene typing (stx1 or stx2) and only 48.2% of these were also tested for the presence of the intimin‐coding gene eae. When considering the stx gene subtypes, about 8% of the food and animal isolates were provided with this level of characterisation.
-
•
Testing of animal samples was still not widely carried out in the EU, with 2,112 animal samples reported taken with any sampling strategy for STEC by six MS in 2020.
4.2. Surveillance and monitoring of STEC infections in the EU
4.2.1. Humans
The notification of STEC 19 infections is mandatory in most EU MS, Iceland, Norway and Switzerland, except for three MS, where notification is based on a voluntary system (Belgium, France and Luxembourg) or another system (Italy). The surveillance systems for STEC infections cover the whole population in all EU MS except for three MS (France, Italy and Spain). The notification rates were not calculated in these three countries for the following reasons: (a) in France, STEC surveillance in humans is based on paediatric haemolytic uraemic syndrome (HUS) cases; (b) in Italy, STEC surveillance is sentinel and primarily based on the HUS cases reported through the national registry of HUS; (c) no estimation for population coverage of STEC cases was provided by Spain. For 2020, Spain did not receive data from all regions due to COVID‐19, therefore the number of reported cases might not be complete. All countries reported case‐based data except Bulgaria, which reported aggregated data. Both reporting formats were included to calculate numbers of cases and notification rates.
Since 1 February 2020, the United Kingdom has become a third country, whereas before it was an EU MS. Human data from the United Kingdom was not collected by ECDC for 2020.
Diagnosis of human STEC infections is generally carried out by culturing stool samples and/or by indirect diagnosis through the detection of antibodies against the O‐lipopolysaccharides of E. coli in serum from HUS cases. In addition, there has been an increase in diagnosis carried out by direct detection of free faecal Shiga toxins/verocytotoxins or the identification of the presence of stx1/vtx1 or stx2/vtx2 genes in stool using PCR without strain isolation.
4.2.2. Food and animals
STEC data in the context of Regulation (EC) No 2073/2005, STEC food safety criterion for sprouts at the retail level
Regulation (EC) No 2073/2005 sets a microbiological criterion for sprouts and seeds intended for sprouting. Accordingly, the analytical results for sprouts placed on the market during their shelf life shall be compliant with the criterion that STEC O157, O26, O111, O103, O145 and O104:H4 be ‘not detected in 25 g’ in assays conducted using the reference method ISO TS 13136:2012 with the adaptation of the EURL for E. coli for O104:H4 or alternative methods validated according to the requirements of the ISO standard 16140.
Although testing is mandatory, the sampling objectives and the sampling frequency applied vary or are interpreted differently among MS, resulting in non‐harmonised data. Data are also generated by the national competent authorities (CA) conducting inspections to verify whether the food business operators correctly implement the legal requirements (official monitoring data). The latter data are from compliance checks and are not suitable for trend analyses, because a reference study population is generally absent and because the sampling is risk‐based and thus non‐representative (Boelaert et al., 2016).
Other STEC monitoring data from food and animals
All the food and animal testing data, with the exclusion of those on sprouts produced in the context of Regulation (EC) No 2073/2005, originate from the reporting obligations of MS under Directive 2003/99/EC (i.e. the Zoonoses Directive). Due to the absence of explicitly indicated sampling strategies in this Regulation, the data generated by MS are based on investigations with non‐harmonised sampling programmes. Moreover, particularly for animal samples, they are obtained using different analytical methods. Therefore, STEC monitoring data according to Directive 2003/99/EC are not comparable between MS and preclude subsequent data analysis such as assessing temporal and spatial trends at the EU level.
In certain food categories, different sampling designs and inaccuracies due to limited numbers of samples also preclude an accurate estimation of prevalence. Moreover, some MS use laboratory analytical methods that test only for E. coli O157, which leads to inaccurate STEC prevalence estimations or inaccurate estimations of the STEC serogroup frequency distributions. This problem affected less than 5% of the food samples in 2020, as observed in 2019, but involved more than one third of the animal samples tested in 2020.
Nevertheless, descriptive summaries of sample statistics at the EU level can be made and used to indicate the circulation of certain STEC types in food and animals, provided the above‐mentioned relevant limitations of the data set are taken into consideration.
To improve the quality of EU data on STEC monitoring of food and animals, EFSA issued technical specifications for harmonised monitoring and reporting of STEC in animals and foodstuffs in 2009 (EFSA, 2009b). With an additional Scientific Opinion, EFSA encouraged MS to extend the monitoring and reporting of data on STEC serogroups (EFSA BIOHAZ Panel, 2013b). More recently, it has been recommended that the presence of the main virulence genes be reported, considering the most recent developments in STEC testing and risk assessment (EFSA BIOHAZ Panel, 2020b) (JEMRA FAO/WHO and National Advisory Committee on Microbiological Criteria for Foods (NACMCF) reports). Finally, the latest published EFSA Scientific Opinion on the pathogenicity assessment of STEC presents important considerations related to the virulence of the different STEC types and underlines the significance of determining the virulence gene combinations (virulotypes) of the isolated STEC strains, with an emphasis on stx gene subtyping, which would facilitate a more precise assessment of the risk connected with different STEC isolates (EFSA BIOHAZ Panel, 2020b).
Since 1 February 2020, the United Kingdom has become a third country. Food and animal data from the United Kingdom was collected by EFSA for 2020 in the framework of the Zoonoses Directive (Directive 2003/99/EC).
4.2.3. foodborne outbreaks of STEC infections
The reporting of foodborne disease outbreaks of humans STEC infections is mandatory according to the Zoonoses Directive (Directive 2003/99/EC).
4.3. Data analyses
4.3.1. Occurrence in food and animals
The monitoring data on sprouts as part of Regulation (EC) No 2073/2005 was aggregated and summarised for trend watching according to the following specified data elements (‘filters’): Sampling context: ‘surveillance, based on Regulation No 2073/2005’; Sampling unit type: ‘single’; Sampling stage: as appropriate; Sampling strategy: ‘objective sampling’ and Sampler: ‘official sampling’.
For the description of the occurrence of STEC‐positive samples in the different food categories, a subset of all validated monitoring data was used (N = 22,119), with ‘objective sampling’ being specified as sampler strategy, which means that the reporting MS collected the samples according to a planned strategy based on the selection of random samples, which are statistically representative of the population to be analysed. Additionally, the data reported with a sampler ‘HACCP and own checks’ were excluded. For animal data (N = 2,112), the same filters were applied.
4.3.2. Serogroups and virulence features in food and animals
The full data set (N = 24,702) was used instead for any other descriptive analysis of STEC findings in food and animals, primarily those on the serogroups and virulence genes’ frequency distribution, with the aim to describe the full range of STEC isolated from food and animals.
To descriptively analyse the reported STEC serogroups, the data were grouped according to used test methods (Table 33).
Table 33.
Analytical methods from the EFSA Catalogue browser (EFSA and Ioannidou, 2019) and the aggregation used to summarise the STEC monitoring results for food and animals, EU, 2015–2020
| Analytical methods for STEC in the catalogue | Method recoded for the analysis | |
|---|---|---|
| Food | Microbiological test ‐ ISO/PRF TS 13136 E. coli | ISO TS 13136:2012 |
| Real Time PCR (BAX): Detection of STEC and identification of serogroups O26, O111, O121, O145, O103 and O145 | ||
| ISO 16654:2001 or NMKL 164:2005 or DIN 10167 | ISO 16654:2001 | |
| BIO 12/25‐05/09, ELFA method for E. coli O157 | ||
| BAX‐based PCR and confirmation following AFNOR serological method. AFNOR validation certificate: QUA 18/04‐03/08 | ||
| Animals | In‐house real time PCR methods based on ISO/TS 13136:2012 | ISO TS 13136:2012 |
| Other methods based on PCR detection of vtx genes | ||
| OIE method for E. coli O157 in animal faecal samples | ISO 16654:2001 |
Methods designed to detect any STEC. For 2020 data, this category includes the ISO TS 13136:2012 method (ISO, 2012) and other stx gene PCR‐based methods as well as the DIN10118 standard based on the immunochemical detection of Stx by colony blot and characterisation of isolated colonies.
Methods designed to detect only E. coli O157, such as the ISO 16654:2001 method (ISO, 2001) and the following equivalent methods: NMKL 164:2005 (NMKL, 2005), DIN 10118:2004 and DIN 1067:2004–03 (DIN, 2004). The method indicated as the OIE method for E. coli O157 is an adaptation of the ISO 16654:2001 method for animal samples and has been included in this category.
This distinction between methods was necessary to minimise the impact on the analyses of the distribution of serogroups due to results based on E. coli O157‐specific methods, which do not identify other STEC possibly present in the samples. The use of O157‐specific methods was, however, very limited in 2020.
4.4. Results
4.4.1. Overview of key statistics, EU, 2016–2020
Table 34 summarises EU‐level statistics on human STEC infections and on samples from food and animals tested for STEC during 2016–2020. Food and animal data were classified into the major categories and aggregated by year to obtain an annual overview of the volume of data submitted, considering the information reported for laboratory analytical methods.
Table 34.
Summary of STEC statistics related to humans, to major food categories and to major animal species, EU, 2016–2020
| 2020 | 2019 a | 2018 a | 2017 a | 2016 a | Data source | |
|---|---|---|---|---|---|---|
| Humans | ||||||
| Total number of confirmed cases | 4,446 | 7,801 | 8,167 | 6,071 | 6,474 | ECDC |
| Total number of confirmed cases/100,000 population (notification rates) | 1.5 | 1.9 | 2.0 | 1.7 | 1.8 | ECDC |
| Number of reporting MS | 27 | 28 | 28 | 28 | 28 | ECDC |
| Infection acquired in the EU | 3,327 | 4,836 | 5,783 | 4,747 | 4,037 | ECDC |
| Infection acquired outside the EU | 148 | 751 | 693 | 525 | 339 | ECDC |
| Unknown travel status or unknown country of infection | 971 | 2,214 | 1,691 | 799 | 2,098 | ECDC |
| Number of foodborne outbreak‐related cases | 208 | 273 | 390 | 260 | 737 | EFSA |
| Total number of foodborne outbreaks | 34 | 42 | 50 | 48 | 43 | EFSA |
| Food | ||||||
| All | ||||||
| Number of sampling units | 22,119 | 25,030 | 20,498 | 19,351 | 17,977 | EFSA |
| Number of reporting MS | 22 | 22 | 20 | 22 | 17 | EFSA |
| Meat and meat products | ||||||
| Number of sampling units | 10,866 | 14,110 | 9,250 | 10,706 | 8,771 | EFSA |
| Number of reporting MS | 17 | 20 | 17 | 18 | 17 | EFSA |
| Milk and milk products | ||||||
| Number of sampling units | 4,665 | 5,479 | 5,339 | 3,485 | 3,773 | EFSA |
| Number of reporting MS | 10 | 13 | 14 | 10 | 11 | EFSA |
| Fruits and vegetables (and juices) | ||||||
| Number of sampling units | 3,353 | 2,657 | 3,339 | 2,295 | 1,475 | EFSA |
| Number of reporting MS | 14 | 13 | 13 | 15 | 11 | EFSA |
| Animals | ||||||
| All | ||||||
| Number of sampling units | 2,112 | 2,588 | 1,631 | 2,217 | 1,892 | EFSA |
| Number of reporting MS | 6 | 9 | 5 | 7 | 6 | EFSA |
| Bovine animals | ||||||
| Number of sampling units | 868 | 1,615 | 1,112 | 1,681 | 1,230 | EFSA |
| Number of reporting MS | 3 | 7 | 5 | 6 | 5 | EFSA |
| Other ruminants as sheep and goats, deer | ||||||
| Number of sampling units | 221 | 268 | 178 | 204 | 138 | EFSA |
| Number of reporting MS | 2 | 4 | 2 | 1 | 2 | EFSA |
ECDC: European Centre for Disease Prevention and Control; EFSA: European Food Safety Authority; MS: Member State; STEC: Shiga toxin‐producing Escherichia coli.
When UK data were collected for the 2016–2019 period, the UK was an EU MS, but since 1 February 2020, it has become a third country. Data from the UK are taken into account for years 2016–2019, but are not considered in the EU overview for 2020.
4.4.2. STEC infections in humans
In 2020, 4,446 confirmed cases of STEC infections were reported in the EU Table 35. Twenty‐two MS reported at least one confirmed STEC case and five MS reported zero cases. In 2020, the EU notification rate was 1.5 per 100,000 population. This is a decrease of 22.4% and 18.2% compared with the rate in 2019 (1.9 and 1.8 per 100,000 population) with and without the data from the United Kingdom, respectively.
Table 35.
Reported human cases of STEC and notification rates per 100,000 population in EU MS and non‐MS countries, by country and year, 2016–2020
| Country | 2020 | 2019 | 2018 | 2017 | 2016 | |||||||
|---|---|---|---|---|---|---|---|---|---|---|---|---|
| National coverage a | Data format a | Confirmed cases and rates | Confirmed cases and rates | Confirmed cases and rates | Confirmed cases and rates | Confirmed cases and rates | ||||||
| Cases | Rate | Cases | Rate | Cases | Rate | Cases | Rate | Cases | Rate | |||
| Austria | Y | C | 288 | 3.2 | 284 | 3.2 | 305 | 3.5 | 250 | 2.8 | 177 | 2.0 |
| Belgium | Y | C | 84 | 0.73 | 131 | 1.1 | 112 | 0.98 | 123 | 1.1 | 119 | 1.1 |
| Bulgaria | Y | A | 0 | 0 | 0 | 0 | 0 | 0 | 0 | 0 | 0 | 0 |
| Croatia | Y | C | 8 | 0.20 | 22 | 0.54 | 10 | 0.24 | 7 | 0.17 | 9 | 0.21 |
| Cyprus | Y | C | 0 | 0 | 0 | 0 | 0 | 0 | 0 | 0 | 0 | 0 |
| Czechia | Y | C | 32 | 0.30 | 33 | 0.31 | 26 | 0.25 | 37 | 0.35 | 28 | 0.27 |
| Denmark | Y | C | 445 | 7.6 | 623 | 10.7 | 493 | 8.5 | 263 | 4.6 | 210 | 3.7 |
| Estonia | Y | C | 10 | 0.75 | 6 | 0.45 | 7 | 0.53 | 3 | 0.23 | 5 | 0.38 |
| Finland | Y | C | 175 | 3.2 | 311 | 5.6 | 210 | 3.8 | 123 | 2.2 | 139 | 2.5 |
| France b | N | C | 262 | – | 335 | – | 259 | – | 260 | – | 302 | – |
| Germany | Y | C | 1,409 | 1.7 | 1,907 | 2.3 | 2,226 | 2.7 | 2,065 | 2.5 | 1,843 | 2.2 |
| Greece | Y | C | 3 | 0.03 | 5 | 0.05 | 1 | 0.01 | 3 | 0.03 | 2 | 0.02 |
| Hungary | Y | C | 8 | 0.08 | 23 | 0.24 | 14 | 0.14 | 12 | 0.12 | 12 | 0.12 |
| Ireland | Y | C | 734 | 14.8 | 798 | 16.3 | 966 | 20.0 | 795 | 16.6 | 737 | 15.6 |
| Italy b | N | C | 45 | – | 62 | – | 73 | – | 92 | – | 78 | – |
| Latvia | Y | C | 2 | 0.10 | 48 | 2.5 | 3 | 0.16 | 1 | 0.05 | 1 | 0.05 |
| Lithuania | Y | C | 0 | 0 | 0 | 0 | 0 | 0 | 0 | 0 | 4 | 0.14 |
| Luxembourg | Y | C | 0 | 0 | 4 | 0.65 | 3 | 0.50 | 1 | 0.17 | 4 | 0.69 |
| Malta | Y | C | 0 | 0 | 53 | 10.7 | 41 | 8.6 | 9 | 2.0 | 4 | 0.89 |
| Netherlands | Y | C | 323 | 1.9 | 459 | 2.7 | 488 | 2.8 | 392 | 2.3 | 665 | 3.9 |
| Poland | Y | C | 3 | 0.01 | 14 | 0.04 | 6 | 0.02 | 4 | 0.01 | 4 | 0.01 |
| Portugal | Y | C | 5 | 0.05 | 1 | 0.01 | 2 | 0.02 | 1 | 0.01 | 0 | 0 |
| Romania | Y | C | 14 | 0.07 | 36 | 0.19 | 20 | 0.10 | 11 | 0.06 | 29 | 0.15 |
| Slovakia | Y | C | 1 | 0.02 | 3 | 0.06 | 12 | 0.22 | 3 | 0.06 | 2 | 0.04 |
| Slovenia | Y | C | 30 | 1.4 | 31 | 1.5 | 32 | 1.5 | 33 | 1.6 | 26 | 1.3 |
| Spain(c)(d) | N | C | 74 | – | 269 | 0.57 | 126 | 0.27 | 86 | – | 69 | – |
| Sweden | Y | C | 491 | 4.8 | 756 | 7.4 | 892 | 8.8 | 504 | 5.0 | 638 | 6.5 |
| EU Total 27 | – | – | 4,446 | 1.5 | 6,214 | 1.8 | 6,327 | 1.9 | 5,078 | 1.7 | 5,107 | 1.7 |
| United Kingdom | – | – | – | – | 1,587 | 2.4 | 1,840 | 2.8 | 993 | 1.5 | 1,367 | 2.1 |
| EU Total e | – | – | 4,446 | 1.5 | 7,801 | 1.9 | 8,167 | 2.0 | 6,071 | 1.7 | 6,474 | 1.8 |
| Iceland | Y | C | 4 | 1.1 | 27 | 7.6 | 3 | 0.86 | 3 | 0.89 | 3 | 0.90 |
| Norway | Y | C | 331 | 6.2 | 511 | 9.6 | 494 | 9.3 | 381 | 7.2 | 239 | 4.6 |
| Switzerland f | – | – | 728 | 8.4 | 999 | 11.5 | 822 | 9.7 | 696 | 8.2 | 463 | 5.5 |
–: Data not reported.
Y: yes; N: no; A: aggregated data; C: case‐based data.
Sentinel surveillance; mainly cases with HUS are notified.
Sentinel surveillance; no information on estimated coverage. Therefore, notification rate cannot be estimated.
Data not complete in 2020, rate not estimated.
Cases reported from the United Kingdom in years 2016–2019 were also considered for this estimation (EU‐28).
Switzerland provided the data directly to EFSA. The human data for Switzerland includes data from Liechtenstein.
The highest country‐specific notification rates were observed in Ireland and Denmark, (14.8 and 7.6 cases per 100,000 population, respectively). Seven countries (Latvia, Hungary, Romania, Portugal, Greece, Slovakia and Poland) reported ≤ 0.1 cases per 100,000 population.
Most STEC cases reported were infected in the EU (75.8% domestic cases or travel in the EU, 3.3% travel outside EU and 28.2% of unknown travel history or unknown country of infection) (Table 34). Overall, for the year 2020, 98.8% of the 3,327 reported STEC cases in humans who acquired the infection in the EU (Table 34) were domestic (acquired within the home country) and 1.2% were acquired through travel in the EU. The proportion of human STEC cases infected domestically and through travel within the EU was stable during 2016–2020.
In 2020, the number of cases infected through travel outside the EU was much lower than that reported in 2019. In fact, the proportion decreased from 9.7% in 2019 to 3.1% in 2020, probably due to the disruption in travel during the first year of the pandemic.
Sweden, Finland, Germany and the Netherlands reported the highest number of travel‐associated cases (62, 30, 25 and 16, respectively), altogether representing the 89.9% of all the non‐EU imported cases.
Egypt was most frequently reported as the probable country of infection, followed by Thailand and Turkey among the non‐EU countries (16.5%, 5.2% and 5.2% of the cases with a known probable country of infection, respectively, increasing to 18.5%, 5,8% and 5.8% when excluding the 23 cases with unknown country of infection).
The seasonal trend in confirmed STEC cases observed in the EU between 2010 and 2019 was maintained in 2020, with more cases reported during the summer months (Figure 24). The observed STEC infection seasonality is in line with that reported in the literature (Sapountzis et al., 2020). Although a slight increase in the number of confirmed cases of STEC was observed between 2015 and 2019, the overall trend for STEC in 2016–2020 did not show any statistically significant increase or decrease. At the MS level, a statistically significant increasing trend (p < 0.01) was observed in years 2016–2020 in Denmark and Finland.
Figure 24.

- Source: Austria, Czechia, Denmark, Estonia, Finland, France, Germany, Greece, Hungary, Ireland, Italy, Lithuania, Luxembourg, the Netherlands, Poland, Romania, Slovakia, Slovenia, Sweden.
Sixteen MS provided information on hospitalisation for 35.8% of all confirmed STEC cases in the EU in 2020. Out of the 1,593 cases with known hospitalisation status, 40.9% were hospitalised. The highest proportions of hospitalised cases were reported by Poland and Slovakia (100% each). However, these MS only reported a few cases of infections (three and one, respectively). Other MS also reporting high proportions of hospitalised cases were Italy (97.4%), Estonia and Portugal (80%), Belgium (60.3%), Romania (42.9%) and Ireland (41%). The number of HUS cases (320) was slightly lower than those reported in 2019 (394). HUS cases were reported in all age groups, with the highest proportion of patients in the youngest age groups from 0–4 years (234 cases; 21.8%) to 5–14 years (57 cases; 11.5%). The most common serogroups among HUS cases were O26 (41.8% of all cases with serogroup reported), O80 (13.2%), O157 (11.9%) and O145 (9.8%) and 24.1% were untyped.
In 2020, 13 fatalities in patients with a STEC infection were reported in the EU, compared with 10 deaths in 2019. Seven MS reported one to four fatal cases each and 12 MS reported no fatal cases. This resulted in an EU case fatality of 0.42% among the 3,094 confirmed cases with known outcome (69.6% of all reported confirmed cases).
Deaths were mostly reported in age groups of over 50 years (84.6%), with three associated with HUS (27.3% of deaths with information on the HUS status). The serogroups and the stx gene subtypes associated with fatal cases were O157 (two strains, one stx2 a and one stx2 a+stx2 c), O146 (stx2 b), O177 (stx2 a), O91 (stx2 b) and O26 (stx subtype not available). For seven fatal cases, the serogroup and the stx subtype were not specified.
Human STEC infections and cases associated with foodborne outbreaks
Overall, for the year 2020, of the 3,327 reported STEC infections in humans who acquired the infection in the EU (Table 34), STEC was identified by nine MS in 34 foodborne outbreaks that involved 208 people in EU, with 30 hospitalised and one death, as reported to EFSA. Comparing the foodborne outbreak cases (208) reported to EFSA with cases of STEC infections in humans acquired in the EU (4,257, including the proportion of cases with unknown travel data (0.957 * 4,446) (Table 34)) reported to ECDC suggests that, overall within the EU in 2020, only 4.9% of human STEC cases were reported through FBO investigations. It is important to clarify that information on which cases are linked to an outbreak and which are not is not systematically collected. In practice, the cases reported to TESSy are mostly sporadic cases. In foodborne outbreaks, the human cases are the people involved in the outbreak as defined by the investigators (case definition), and cases must be linked, or probably linked, to the same food source (Directive 2003/99/EC). This can include both ill people (whether confirmed microbiologically or not) and people with confirmed asymptomatic infections (EFSA, 2014).
The sources in the five strong‐evidence STEC foodborne outbreaks during 2020 were ‘tap water, including well water’ (two outbreaks), ‘meat and meat products’, ‘dairy products other than cheese’ and ‘cheeses made from cows’ milk’ (one outbreak each). During 2010–2019, strong‐evidence STEC outbreaks were mostly caused by ‘bovine meat and products thereof’ (21), ‘tap water, including well water’ (19), ‘vegetables and juices and other products thereof’ (15), ‘milk’ (9) and ‘cheese’ (9). Further details and statistics on the STEC foodborne outbreaks for 2020 are in the FBO chapter.
4.4.3. STEC in food
For the year 2020, 22 MS provided results from analyses of 22,119 food units (batches or single samples).
The most recent source attribution analysis available for STEC underlined that ‘bovine meat and products thereof’, ‘milk and dairy products’ and ‘vegetables, fruit and products thereof’ were the vehicles most frequently implicated in STEC infections in the EU in the period 2012–2017 period (inclusive) (EFSA BIOHAZ Panel, 2020b), confirming the results of previous reports (WHO and FAO, 2018). These categories are indeed the most commonly tested in the EU and in 2020 represented the 71.2% of the total food sample units tested.
STEC data in the context of Regulation (EC) No 2073/2005, STEC food safety criterion for sprouts at the retail level
As regards 2020 data for STEC on sprouted seeds in the context of Regulation (EC) No 2073/2005, 60 single samples taken at processing plant and 263 units sampled at retail including wholesale by the CA (official sampling) of six MS were reported with no positive results. Out of the total 323 samples tested, 47.4% were reported by one MS only (Spain), collected at the retail sampling stage, including wholesale. In general, as noted in previous years, testing sprouted seeds is not widely applied at the EU level, although a microbiological criterion for this food commodity is laid down in Regulation (EC) No 2073/2005.
Other STEC monitoring data from food
Overall, 2.4% of the 19,036 food sample units tested by 22 MS, and collected using an objective sampling strategy, were positive for STEC. For the years 2019, 2018, 2017 and 2016, the figures for STEC‐positive food samples were, respectively, 2.8%, 2.8%, 1.5% and 2.0%. In Table 36, these monitoring results are summarised and a distinction is made between RTE food, non‐RTE food and ‘fresh meat’.
Table 36.
Occurrence of STEC in the major food categories, EU, 2020
| Food | 2020 | 2016–2019 a | ||||
|---|---|---|---|---|---|---|
| N reporting MS | N sampling units | Positive N (%) | N reporting MS | N sampling units | Positive N (%) | |
| RTE food | ||||||
| All | 17 | 7,924 | 105 (1.3) | 20 | 21,546 | 165 (0.77) |
| Meat and meat products | 7 | 1,668 | 28 (1.7) | 11 | 4,843 | 65 (1.3) |
| Meat and meat products from bovine animals | 6 | 650 | 14 (2.2) | 10 | 2,823 | 44 (1.6) |
| Meat and meat products from pigs | 4 | 136 | 1 (0.74) | 6 | 449 | 4 (0.89) |
| Other meat and meat products | 5 | 882 | 13 (1.5) | 7 | 1,571 | 17 (1.1) |
| Milk and milk products | 7 | 2,238 | 33 (1.5) | 12 | 6,621 | 81 (1.2) |
| Milk | 3 | 222 | 10 (4.5) | 6 | 574 | 25 (4.4) |
| Raw milk b | 3 | 212 | 10 (4.7) | 4 | 568 | 25 (4.4) |
| Cheese | 7 | 1,910 | 23 (1.2) | 12 | 5,628 | 53 (0.94) |
| Dairy products excluding cheeses (butter, cream, ice cream, whey, yoghurt and fermented dairy products) | 3 | 106 | 0 | 6 | 419 | 3 (0.72) |
| Fruits, vegetables and juices | 11 | 2,052 | 4 (0.19) | 10 | 4,997 | 5 (0.10) |
| Spices and herbs | 7 | 378 | 2 (0.53) | 6 | 2,292 | 12 (0.52) |
| Salads | 3 | 268 | 0 | 4 | 325 | 1 (0.31) |
| Seeds, sprouted | 11 | 509 | 0 | 11 | 1,364 | 0 |
| Non‐RTE food | ||||||
| All | 17 | 11,112 | 352 (3.2) | 22 | 39,649 | 1,256 (3.2) |
| Meat and meat products | 15 | 8,361 | 318 (3.8) | 20 | 31,480 | 1,144 (3.6) |
| Milk and milk products | 7 | 828 | 31 (3.7) | 9 | 2,934 | 82 (2.8) |
| Fruits, vegetables and juices | 10 | 1,048 | 0 | 11 | 2,047 | 1 (0.05) |
| Fresh meat | ||||||
| All | 15 | 7,072 | 229 (3.2) | 19 | 20,541 | 741 (3.7) |
| Fresh meat from bovine animals | 14 | 4,988 | 76 (1.5) | 16 | 13,272 | 329 (2.5) |
| Fresh meat from pigs | 3 | 91 | 7 (7.7) | 7 | 799 | 33 (4.1) |
| Fresh meat from goats | 1 | 13 | 1 (7.7) | 4 | 63 | 8 (12.7) |
| Fresh meat from sheep | 5 | 990 | 113 (11.4) | 6 | 2,354 | 252 (10.7) |
| Other fresh meat | 5 | 191 | 31 (16.2) | 5 | 1,519 | 97 (6.4) |
STEC: Shiga toxin‐producing Escherichia coli; MS: Member states; RTE: ready‐to‐eat.
Since 1 February 2020, the United Kingdom has become a third country. Data from the UK are taken into account for years 2016–2019, but are not considered in the EU overview for 2020.
The raw RTE milk sampling units are a subset of RTE milk.
RTE food
As regards RTE food, most of the results of the 7,924 RTE food sampling units reported by 17 MS originated from ‘milk and milk products’ notably cheeses (28.2%), followed by ‘fruits, vegetables and juices’ (25.9%), ‘meat and meat products’ (21%) and ‘seeds, sprouted’ (6.4%). In total, 105 RTE food samples were found to be positive for STEC: 1.7% in ‘meat and meat products’ (notably of bovine origin), 1.5% in ‘milk and milk products’ particularly milk and 0.5% in ‘spices and herbs’. Finally, four positives were found among 2,052 samples in the ‘fruits, vegetables and juices’ category (0.2%).
For the descriptive analysis of serogroups and virulence genes, based on the full data set, 9,419 sample units tested for STEC were available with 120 (1.3%) positive samples reported. The food categories included in this analysis included ‘cheeses’, ‘sprouted seeds’, ‘spices and herbs’, ‘fruits and vegetables’, ‘meat products’, ‘fish and fishery products’, ‘raw milk’ and ‘others’. Of all the STEC isolated from RTE food samples, only 31 were submitted with information on the serogroup. These included 24 different serogroups, including three O157, all isolated using the ISO TS 13136:2021 method. Nine additional isolates were reported with the sole information that they belonged to non‐O157 serogroups. Forty‐seven isolates were provided with information on the stx gene type and 18 were also provided with data on the presence of the eae gene. Thirty‐one were of the stx2 genotype (three strains were eae‐positive), 13 possessed the stx1 gene (one isolate was eae‐positive) and three isolates possessed both the stx1 and stx2 genes. One of the stx2 strains was subtyped as stx2 a and three stx1 proved to be of the stx1 a subtype.
RTE and non‐RTE food
In the following analyses, food categories include RTE food and non‐RTE food.
Meat and meat products
Bovine meat
In 2020, 5,109 units of fresh bovine meat were tested for STEC by 15 MS with 1.6% of these being positive. Most of the units were sampled at the processing plant/slaughterhouse (81.5%), followed by the retail sampling stage (18.2%). A few other samples were taken at the farm or were reported with an unspecified sampling stage. The samples taken at the retail level were the most contaminated with 2.6% of the samples being found positive for STEC, whereas at the slaughterhouse level, there were 1.2% positive tests out of 4,069 samples.
For the descriptive analysis of serogroups and virulence genes, based on the full data set (Section 4.3.2, Data Analyses), 204 isolates were available from 7,103 samples of bovine meat (fresh and other) tested by 19 MS. Information on the serogroup was reported by eight MS for 61 isolates (29.9%), which belonged to 28 different serogroups, among which the most frequently identified in 2020 were O157 (10 isolates with four obtained using the ISO 16654 method) followed by O26 (seven isolates), O91 (four isolates) and others (Table 33). All the most represented STEC serogroups identified in fresh bovine meat samples were among the 20 most frequent serogroups reported in STEC from human disease in the EU in 2019 (EFSA and ECDC, 2021). The analysis of the virulence genes of the isolated STEC showed that 45.6% were provided with information on the genes encoding the Shiga toxins (stx), of which 58.1% were also screened for the presence of eae gene. Thirty‐six isolates were of the stx1 genotype, and four of them also possessed the eae gene, 41 were of the stx2 genotype and seven of them were also eae‐positive, while 16 possessed both the stx1 and stx2 genes and six also carried the eae gene. Finally, only nine isolates were provided with stx gene subtyping information.
Ovine and goat meat
Small ruminants are an important reservoir of STEC as reported in the literature (Persad and Lejeune, 2015). In 2020, five MS reported the results of an investigation of 990 sample units of fresh ovine meat with 11.4% of these being STEC‐positive, whereas one MS reported on fresh goat meat with one STEC‐positive sampling unit out of the 13 tested (Table 36).
For the descriptive analysis of serogroups and virulence genes, based on the full data set (Section 4.3.2, Data Analyses), 122 isolates were reported from the testing of 1,044 samples of ovine and goat meat (fresh and other). Forty‐eight strains were reported with information on the serogroup, with the most represented being O146 (13 isolates), followed by O38 and O6 (seven and four strains, respectively). The O146 serogroup ranked sixth in the top 20 STEC serogroups in human cases of disease reported in the EU in 2020. The other isolates belonged to 16 other serogroups, including some matching those isolated from human disease such as O113, O26, O91 and O157 (EFSA and ECDC, 2021) (Table 46). Sixty strains were screened for the presence for stx gene types and 16 of these also for the presence of eae. stx1 genes were present in 25 strains, of which four also harboured the eae gene. stx2 genes were found in 10 strains, and five also possessed the eae gene. Finally, the stx1 and stx2 gene combination was identified in 25 strains, of which seven also harboured the eae gene.
Table 46.
Distribution of the 20 most frequent serogroups reported in confirmed cases of human STEC infections and of STEC in food and in animals, EU, 2020
| Serogroup | Human | Food | Animal | ||||||
|---|---|---|---|---|---|---|---|---|---|
| Isolates | MS | % | Isolates | MS | % | Isolates | MS | % | |
| O26 | 469 | 16 | 20.1 | 11 | 5 | 2.2 | 5 | 2 | 4.9 |
| O157 | 435 | 17 | 18.6 | 24 | 5 | 4.8 | 21 | 3 | 20.6 |
| NT a | 428 | 8 | 18.3 | 299 | 12 | 60.2 | 28 | 4 | 27.5 |
| O103 | 159 | 15 | 6.8 | 2 | 1 | 0.40 | ND | – | 0 |
| O145 | 108 | 13 | 4.6 | 2 | 2 | 0.40 | 2 | 1 | 2.0 |
| O146 | 88 | 11 | 3.8 | 20 | 2 | 4.0 | ND | – | 0 |
| O91 | 61 | 9 | 2.6 | 5 | 2 | 1.0 | 1 | 1 | 0.98 |
| O80 | 57 | 8 | 2.4 | ND | – | 0 | ND | – | 0 |
| O128 b | 51 | 8 | 2.2 | 2 | 1 | 0.40 | ND | – | 0 |
| O111 | 38 | 11 | 1.6 | 1 | 1 | 0.20 | 1 | 1 | 0.98 |
| O55 | 32 | 8 | 1.4 | ND | 0 | ND | – | 0 | |
| O27 | 23 | 7 | 0.98 | 2 | 1 | 0.40 | ND | – | 0 |
| O113 | 22 | 9 | 0.94 | 6 | 2 | 1.2 | ND | – | 0 |
| O8 | 21 | 5 | 0.90 | 7 | 2 | 1.4 | 16 | 1 | 15.7 |
| O121 | 18 | 5 | 0.77 | ND | – | 0 | ND | – | 0 |
| O78 | 16 | 5 | 0.68 | ND | – | 0 | ND | – | 0 |
| O177 | 14 | 7 | 0.60 | ND | – | 0 | ND | – | 0 |
| O182 | 14 | 6 | 0.60 | 1 | 1 | 0.20 | 1 | 1 | 0.98 |
| O183 | 14 | 7 | 0.60 | 1 | 1 | 0.20 | ND | – | 0 |
| O2 | 14 | 4 | 0.60 | 2 | 2 | 0.40 | 1 | 1 | 0.98 |
| Other | 256 | – | 10.9 | 112 | – | 22.5 | 26 | – | 25.5 |
| Total | 2,338 | 20 | 100 | 497 | 22 | 100 | 102 | 5 | 100 |
MS: Member States; STEC: Shiga toxin‐producing Escherichia coli.
ND: Not detected.
Non‐typeable STEC includes those strains in which the laboratory tried, but was not able to define the O‐serogroup. This depends on how many sera/molecular tools are included in the typing panel.
: Including O128ab.
Meat from other ruminants
Only three MS provided information on the presence of STEC in fresh meat samples from deer. In total, 90 samples were taken and 24 were found to be contaminated with STEC (26.7%). From the monitoring data of the full data set (Section 4.3.2, Data Analyses), from fresh and other meat samples, two additional positive samples were identified. Eight isolates were reported with information on the serogroup and belonged to four serogroups, which included O146 and O27, both identified in STEC isolated from human disease (EFSA and ECDC, 2021), O22 and O130. Eight strains were reported with the information on the presence of the Stx‐coding genes and seven were positive for stx2 and one strain possessed stx1 and stx2. All these isolates were negative for the presence of the eae gene (six strains) or this information was not reported.
Meat from other animal species
Three MS tested fresh pig meat in 2020 and reported data on 91 samples, with seven of these being positive for the presence of STEC (7.7%) (Table 36). For the descriptive analysis of serogroups and virulence genes, based on the full data set (Section 4.3.2, Data Analyses), 17 STEC strains were identified, with four positive samples being contaminated with STEC O157, all isolated from one MS that used the ISO 16654:2001 method. Two other isolates were reported as STEC O113 and O8, respectively, both possessing the stx2 genes. No information on the presence of the eae gene was reported for this meat category.
Fresh meat from animal species other than bovine, ovine, goat, pig and deer species was tested in 2020 by five MS that reported on the analyses carried out on 166 sample units. These included samples taken from broilers, ducks, wild and farmed game, geese, horses, poultry, rabbits, turkeys, wild boars and unspecified meat. Seven samples were reported as STEC‐positive (4.2%).
For the descriptive analysis of serogroups and virulence genes, based on the full data set (Section 4.3.2, Data Analyses), 1,981 sample results were available in the data set, with 54 of them being positive for STEC (2.7%). Information on the serogroup of the isolated STEC was provided for 11 isolates. Four isolates were of the O157 serogroup, with three of them from samples tested using the ISO 16654:2001 or equivalent methods. The remaining seven belonged to the O146 (two isolates), O145, O111, O104, O6 and O8 (one isolate each) serogroups. Thirteen STEC isolates were reported with their stx gene profiles. Nine were stx2+ and four were stx1+. All isolates were negative for the presence of the eae gene, or this information was not provided.
Meat products and meat preparations
Meat products and meat preparations other than fresh were sampled in 2020 by 12 MS that tested 4,082 samples, resulting in 119 STEC strains isolated (2.9%).
For the descriptive analysis of serogroups and virulence genes, based on the full data set (Section 4.3.2, Data Analyses), 187 STEC isolates were available from 4,656 sample units (4.0%) of any meat products and meat preparations including those involving minced and mixed meats. The information on the serogroup was provided for 38 STEC strains belonging to 21 different O‐groups. The most represented serogroups included O157, O26 (five strains each) and O100 and O8 (four and three strains, respectively). The analysis of the presence of the stx was carried out on 52 isolates of which 21 also had the information on the presence of the eae gene. The stx1 genotype was present in six strains, with two of them positive also for the eae gene. Thirty‐nine isolates were of the stx2 genotype and for six of them the presence of the eae gene was also reported. Seven strains harboured both the stx1 and stx2 genes and two of them also the eae gene. Unfortunately, no STEC strains were provided with the information on the stx gene subtypes.
Milk and milk products
Overall, STEC was found in 64 (2.1%) out of 3,066 samples of RTE and non‐RTE milk and milk products including cheese reported by nine MS (Table 36).
In 2020, six MS reported on the testing of 740 sample units of raw cows’ milk with 34 positive units (4.7%). Information on the serogroup was provided for five isolates only (STEC O26, O113, O84, O182, O41). Five MS reported monitoring results on 28 sample units of raw goats’ milk, and two MS reported only seven samples of raw sheep milk. Both the categories recorded one positive sample each.
The presence of STEC in RTE dairy products other than milk and cheeses was reported by three MS, which tested 106 sample units of butter, cream, ice cream, whey, yoghurt and fermented dairy products. No positive samples were detected (Table 36).
For dairy products, in 2020, 2,597 cheese samples were tested for the presence of STEC, with 38 (1.5%) positive units from seven MS. Nineteen of the positive samples were from cheese made with cows’ milk, 15 from samples of cheese made with unspecified milk and the remaining four from goat cheese.
For the descriptive analysis of serogroups and virulence genes, based on the full data set (Section 4.3.2, Data Analyses), 3,212 sample results were available, of which cheese accounted for 88.9%, with 38 positives (1.2%). Only eight STEC were typed for the serogroup and belonged to seven different O‐groups, including O15 (two strains), O3, O8, O26, O103, O157 and O183 (one strain each). Characterisation of the stx genes regarded 11 isolates with the majority of these possessing the stx2 genes, together with the eae gene in one case. Two isolates were of the stx1 genotype in one case with the presence of the eae gene and the remaining one possessed both the stx1 and stx2 genes with no information on the presence of the eae gene.
Vegetables and fruits
STEC were found in four (0.1%) out of 3,353 samples of fruits and vegetables (Table 37). The positive records included two units of vegetables sampled at retail (leafy vegetables and pre‐cut vegetable products), reported by two MS and both were contaminated with STEC of non‐O157 serogroups.
Table 37.
Presence of STEC in the different food categories, EU, 2020
| Food category a | Samples tested for STEC by any method | |||||
|---|---|---|---|---|---|---|
| N total | Positive (any STEC) | Positive for STEC O157 | ||||
| N | % | N | % | |||
| Bovine meat | 6,705 | 142 | 2.1 | 10 | 0.15 | |
| Ovine and goat meat | 1,044 | 121 | 11.6 | 3 | 0.29 | |
| Meat from deer (venison) | 106 | 26 | 24.5 | 0 | 0 | |
| Pig meat | 849 | 17 | 2.0 | 4 | 0.47 | |
| Meat from animals other than ruminants | 1,957 | 50 | 2.6 | 4 | 0.20 | |
| Mixed meat | 205 | 6 | 2.9 | 0 | 0 | |
| Milk and dairy products b | 3,231 | 38 | 1.2 | 1 | 0.03 | |
| Raw milk c | 1,434 | 49 | 3.4 | 1 | 0.07 | |
| Fruits and vegetables | 3,353 | 4 | 0.12 | 0 | 0 | |
| Sprouted seeds | 1,025 | 3 | 0.29 | 1 | 0.10 | |
| Other food | 2,210 | 41 | 1.9 | 0 | 0 | |
| Total | 22,119 | 497 | 2.2 | 24 | 0.11 | |
STEC: Shiga toxin‐producing Escherichia coli.
: The different meat categories presented in this table include all types of meat (not only fresh).
: Includes any type of dairy product, cheese and milk other than raw milk.
: Includes raw milk from different species, but most tested and all the positive samples were from cows.
Other foodstuffs
This category contains miscellaneous food commodities not included in the previously mentioned categories, and included cereals and meals, bakery products, juices, live bivalve molluscs, fish and fishery products, fresh and dried spices and herbs, infant formula, coconuts, water and others. For the whole category, 1,766 samples were analysed by 12 MS with 37 (2.1%) positive samples reported from cereals (32 samples), bakery products (two units), spice and herbs (two units) and other processed food (one unit).
For the descriptive analysis of serogroups and virulence genes, based on the full data set (Section 4.3.2, Data Analyses), 2,149 samples assayed and 37 positive units were considered. Only three isolates were serotyped and belonged to the O36, O6 and O8 O‐groups. Five isolates were provided with information on the stx gene types and all were of the stx2 genotype.
STEC serogroups in food
This section includes the analysis of the data present in the full data set (Section 4.3.2, Data Analyses), which contained 22,520 sample units tested of which 560 (2.5%) were STEC‐positive. One country (Luxembourg) did not specify the method used to test 159 sample units, which were excluded from the descriptive analyses of the STEC serogroups.
For analysis of the distribution of the STEC serogroups, 12 of these 560 isolates, reported by one MS (Spain) based on 494 samples, could not however be used because they were obtained using the analytical method ISO 16654:2001 or equivalent method, which only detects serogroup O157 (Table 38), thereby introducing a bias in the descriptive analysis. In total, 21,139 food sample units were reported with analytical method ISO TS 13136:2012 or equivalent method, which detect all STEC, and 485 (2.3%) were STEC‐positive (Table 40). Of these 485 isolates, 158 (32.6%) were provided with information on the serogroup, which were the data used for the description of STEC serogroups in food. Of these 158 isolates, 28 (17.7%) belonged to the top five serogroups (O157, O26, O103, O111 and O145) and the remaining 130 isolates belonged to 36 different O‐groups (Table 41).
Table 38.
Overview of countries reporting data for STEC in food, EU, 2020
| Samples tested | Proportion (%) of total samples tested by method | |||
|---|---|---|---|---|
| Country | Number | ISO/TS 13136:2012 | ISO 16654:2001 or NMKL 164:2005 or DIN 10167 | Not reported/Unspecified |
| Austria | 1,203 | 100 | 0 | 0 |
| Belgium | 3,225 | 100 | 0 | 0 |
| Bulgaria | 110 | 100 | 0 | 0 |
| Croatia | 133 | 100 | 0 | 0 |
| Cyprus | 25 | 100 | 0 | 0 |
| Czechia | 160 | 100 | 0 | 0 |
| Estonia | 2 | 100 | 0 | 0 |
| Finland | 102 | 100 | 0 | 0 |
| France | 216 | 100 | 0 | 0 |
| Germany | 4,572 | 100 | 0 | 0 |
| Hungary | 353 | 100 | 0 | 0 |
| Ireland | 3,306 | 90.9 | 9.1 | 0 |
| Italy | 2,896 | 96.9 | 3.1 | 0 |
| Latvia | 100 | 100 | 0 | 0 |
| Luxembourg | 245 | 0.41 | 35.9 | 63.7 |
| Netherlands | 4,036 | 100 | 0 | 0 |
| Portugal | 152 | 95.4 | 4.6 | 0 |
| Romania | 49 | 100 | 0 | 0 |
| Slovakia | 30 | 100 | 0 | 0 |
| Slovenia | 283 | 100 | 0 | 0 |
| Spain | 1,040 | 52.5 | 47.5 | 0 |
| Sweden | 37 | 100 | 0 | 0 |
| EU Total | 22,275 | 94.9 | 4.4 | 0.70 |
| Serbia | 245 | 100 | 0 | 0 |
|
Total EU + non‐EU countries |
22,520 | 95.0 | 4.4 | 0.69 |
STEC: Shiga toxin‐producing Escherichia coli; ISO/TS: International Organization for Standardization Technical Specifications; NMKL: Nordic Committee on Food Analysis.
Table 40.
Number of samples tested for any STEC with the ISO TS 13136 method and number of positive samples in different food categories, by STEC serogroup, EU, 2020
| Food category a | Samples tested by ISO 13136 | Samples positive for | |||||
|---|---|---|---|---|---|---|---|
| Any STEC | O157 | O26 | O145 | O103 | O111 | ||
| N | N | N | N | N | N | ||
| Bovine meat | 6,393 | 138 | 6 | 7 | 0 | 1 | 0 |
| Ovine and goat meat | 1,002 | 120 | 2 | 1 | 1 | 0 | 0 |
| Meat from deer (venison) | 106 | 26 | 0 | 0 | 0 | 0 | 0 |
| Pig meat | 665 | 13 | 0 | 0 | 0 | 0 | 0 |
| Meat from animals other than ruminants | 1,837 | 47 | 1 | 0 | 1 | 0 | 1 |
| Mixed meat | 199 | 6 | 0 | 0 | 0 | 0 | 0 |
| Milk and dairy products b | 3,217 | 38 | 1 | 1 | 0 | 1 | 0 |
| Raw milk c | 1,349 | 49 | 1 | 2 | 0 | 0 | 0 |
| Fruits and vegetables | 3,284 | 4 | 0 | 0 | 0 | 0 | 0 |
| Sprouted seeds | 1,012 | 3 | 1 | 0 | 0 | 0 | 0 |
| Other food | 2,075 | 41 | 0 | 0 | 0 | 0 | 0 |
| Total | 21,139 | 485 | 12 | 11 | 2 | 2 | 1 |
Note: Only results from samples tested by the ISO TS 13136:2012 method were included.
The different meat categories presented in this table include all types of meat (not only fresh).
Includes any type of dairy product, cheese and milk other than raw milk.
Includes raw milk from different species, but most tested and all the positive samples were from cows.
Table 41.
Frequency distribution of STEC serogroups in food categories in reporting MS, 2020
| Food category a | STEC isolates with serogroup reported | STEC serogroups | |||||||||||||||
|---|---|---|---|---|---|---|---|---|---|---|---|---|---|---|---|---|---|
| % of total STEC isolates with serogroups reported in the specific food category | |||||||||||||||||
| O157 | O26 | O103 | O145 | O111 | O146 | O91 | O76 | O113 | O5 | O174 | O8 | O116 | O6 | Other serogroups (list) | |||
| Bovine meat | 61 | 16.4 | 11.5 | 1.6 | 0 | 0 | 3.3 | 6.6 | 3.3 | 4.9 | 1.6 | 3.3 | 4.9 | 1.6 | 3.3 | 37.7 | (O100, O117, O126, O130, O136, O149, O15, O150, O153, O168, O171, O2, O22, O38, O84, O88) |
| Ovine and goat meat | 48 | 6.3 | 2.1 | 0 | 2.1 | 0 | 27.1 | 2.1 | 6.3 | 2.1 | 2.1 | 2.1 | 0 | 0 | 8.3 | 39.6 | (O100, O123, O128, O15, O150, O153, O166, O178, O38) |
| Meat from deer (venison) | 8 | 0 | 0 | 0 | 0 | 0 | 37.5 | 0 | 0 | 0 | 0 | 0 | 0 | 0 | 0 | 62.5 | (O130, O22, O27) |
| Pig meat | 6 | 66.7 | 0 | 0 | 0 | 0 | 0 | 0 | 0 | 16.7 | 0 | 0 | 16.7 | 0 | 0 | 0 | |
| Meat from animals other than ruminants | 10 | 40.0 | 0 | 0 | 10.0 | 10.0 | 20.0 | 0 | 0 | 0 | 0 | 0 | 0 | 0 | 10.0 | 10.0 | (O104) |
| Mixed meat | 1 | 0 | 0 | 0 | 0 | 0 | 0 | 0 | 0 | 0 | 0 | 0 | 0 | 0 | 0 | 100 | (O100) |
| Milk and dairy products b | 8 | 12.5 | 12.5 | 12.5 | 0 | 0 | 0 | 0 | 0 | 0 | 0 | 0 | 12.5 | 0 | 0 | 50.0 | (O15, O183, O3) |
| Raw milk c | 9 | 11.1 | 22.2 | 0 | 0 | 0 | 0 | 0 | 0 | 11.1 | 0 | 0 | 0 | 0 | 0 | 55.6 | (O104, O182, O41, O84) |
| Fruit and vegetable | 2 | 0 | 0 | 0 | 0 | 0 | 0 | 0 | 0 | 0 | 0 | 0 | 0 | 0 | 0 | 100 | (O130, O38) |
| Seeds d | 1 | 100 | 0 | 0 | 0 | 0 | 0 | 0 | 0 | 0 | 0 | 0 | 0 | 0 | 0 | 0 | |
| Other food | 4 | 0 | 0 | 0 | 0 | 0 | 0 | 0 | 0 | 0 | 0 | 0 | 50.0 | 0 | 25.0 | 25.0 | (O36) |
| Total | 158 | 15.2 | 7.0 | 1.3 | 1.3 | 0.63 | 12.7 | 3.2 | 3.2 | 3.8 | 1.3 | 1.9 | 4.4 | 0.63 | 5.1 | 38.6 | (O100, O104, O117, O123, O126, O128, O130, O136, O149, O15, O150, O153, O166, O168, O171, O178, O182, O183, O2, O22, O27, O3, O36, O38, O41, O84, O88) |
Note: Only results from samples tested by the ISO TS 13136:2012 method were included.
The different meat categories presented in this table include all types of meat (not only fresh).
Includes any type of dairy product, cheese and milk other than raw milk.
Includes raw milk from different species, but most of tested samples and all the positive samples were from cows.
Includes sprouted seeds and dried seeds.
Table 39: Proportion of STEC (O157 and any STEC)‐positive samples by food category, EU, 2020
| Ready‐To‐Eat food category | Samples tested | Samples tested for STEC by any method | |||
|---|---|---|---|---|---|
| Positive (any STEC) | Positive for STEC O157 | ||||
| N | % | N | % | ||
| Cheese | 2,854 | 37 | 1.3 | 1 | 0.04 |
| Sprouted seeds | 649 | 0 | 0 | 0 | 0 |
| Spices and herbs | 406 | 2 | 0.49 | 0 | 0 |
| Fruits and vegetables | 2,033 | 4 | 0.20 | 0 | 0 |
| Meat products (any) | 1,772 | 30 | 1.7 | 2 | 0.11 |
| Fish and fishery products | 67 | 0 | 0 | 0 | 0 |
| Raw milk (any) | 229 | 10 | 4.4 | 0 | 0 |
| Other RTE | 1,281 | 34 | 2.7 | 0 | 0 |
| Total | 9,291 | 117 | 1.3 | 3 | 0.03 |
STEC: Shiga toxin‐producing Escherichia coli; RTE: ready‐to‐eat.
4.4.4. STEC in animals
For the year 2020, results from 2,112 sampling units (single heads or herds or flocks) from animals were reported by six MS. This number is in line with the number of animals tested in 2016–2019 (Table 34).
When aggregating the data according to the analytical methods mentioned in Table 33, the highest proportion of animal sampling units tested in 2020 was related to cattle, with 678 tested (43.2% of animal samples) and 5.2% positives. The most contaminated animal category in 2020 was pigs, with 42.3% of the 85 sample units tested by two MS. These observations are consistent with previous years’ observations. The frequency distribution of STEC serogroups in animals in reporting EU MS in 2020 is shown in Table 43.
Table 43.
Frequency distribution of STEC serogroups in animals in reporting EU MS, 2020
| Animal category | STEC isolates with serogroup reported | STEC serogroups | |||||||||||||||
|---|---|---|---|---|---|---|---|---|---|---|---|---|---|---|---|---|---|
| % of total STEC isolates with serogroup reported in the specific animal category | |||||||||||||||||
| O157 | O26 | O103 | O145 | O111 | O146 | O91 | O76 | O113 | O5 | O174 | O8 | O116 | O6 | Other serogroups (list) | |||
| Cattle | 37 | 54.1 | 8.1 | 0 | 5.4 | 2.7 | 0 | 2.7 | 0 | 0 | 2.7 | 0 | 0 | 0 | 0 | 24.3 | (O109, O150, O168, O182, O2, O84) |
| Goat and sheep | 3 | 33.3 | 66.7 | 0 | 0 | 0 | 0 | 0 | 0 | 0 | 0 | 0 | 0 | 0 | 0 | 0 | |
| Other ruminants | 0 | 0 | 0 | 0 | 0 | 0 | 0 | 0 | 0 | 0 | 0 | 0 | 0 | 0 | 0 | 0 | |
| Pigs | 33 | 0 | 0 | 0 | 0 | 0 | 0 | 0 | 0 | 0 | 0 | 0 | 48.5 | 0 | 0 | 51.5 | (O100, O117, O159, O36) |
| Other animals | 0 | 0 | 0 | 0 | 0 | 0 | 0 | 0 | 0 | 0 | 0 | 0 | 0 | 0 | 0 | 0 | |
| Total | 73 | 28.8 | 6.8 | 0 | 2.7 | 1.4 | 0 | 1.4 | 0 | 0 | 1.4 | 0 | 21.9 | 0 | 0 | 35.6 | (O100, O109, O117, O150, O159, O168, O182, O2, O36, O45, O84) |
MS: Member State; N: number of samples; STEC: Shiga toxin‐producing Escherichia coli.
The most relevant data reported on the animal categories are detailed below.
Cattle
Three MS reported the presence of STEC in 35 samples (5.2%) out of 678 cattle sampling units, mostly tested using the OIE method for E. coli O157 (581 samples) (Table 42).
Table 42.
Summary of STEC statistics related to major animal species in reporting EU MS, 2020
| Animals | N of reporting countries | N of tested animals | Positive animals | |
|---|---|---|---|---|
| N | % | |||
| Cattle | 3 | 678 | 35 | 5.2 |
| Goat and sheep | 2 | 37 | 3 | 8.1 |
| Other animals | 3 | 572 | 18 | 3.1 |
| Other ruminants a | 1 | 197 | 7 | 3.6 |
| Pigs | 2 | 85 | 36 | 42.4 |
| Total | 5 | 1,569 | 99 | 6.3 |
MS: Member State; STEC: Shiga toxin‐producing Escherichia coli.
Other ruminants includes Cantabrian chamois, deer and water buffalos.
The full data set (Section 4.3.2, Data Analyses), included 43 STEC‐positive sample results out of 885 samples tested from cattle. Seventeen samples were reported without information on the method used and the resulting three positives were excluded from the analysis of the strains’ features. Twenty‐one out of the 38 strains with information on the serogroup were STEC O157 with 17 of these isolated using the OIE method for E. coli O157. The remaining strains belonged to 11 additional serogroups including STEC O26 (three isolates) and O145 (two strains). Thirty‐seven strains were reported with information on the presence of stx and eae genes. The genotypes detected were stx1 and eae (eight strains), stx2 and eae (five strains), stx2 only (four strains) and stx1, stx2 and eae (20 strains). The stx gene subtyping was carried out for 13 strains, which displayed the genotypes stx1 a (three strains), stx2 a (three strains), stx2 d (one strain), stx2 g (two strains), stx2 a and stx2 c (one strain) and stx1 a and stx2 a (three strains).
Sheep and goats
Two MS reported the analysis of 36 samples taken on a sheep farm, with two positive results (5.5%). Additionally, one single sample from a goat taken at farm in the context of suspect sampling was tested by Sweden and was positive for the presence of STEC O157 (Table 42). The sample was assayed using the OIE method detecting only this serogroup.
By analysing the full data set (Section 4.3.2, Data Analyses), 109 samples from sheep and goats were reported from three MS and the United Kingdom. Five positive samples were observed when the sample units assayed with an unspecified method were removed and yielded two STEC O26, one STEC O157 (isolated using the ISO 16654 or equivalent method) and two of unspecified serogroup.
Pigs and other animal species
Testing results were reported for pigs by two MS. Ten animals tested negative and 48% of 75 herds were positive, with an overall positive rate of 42.4% (Table 42). The full data set (Section 4.3.2, Data Analyses), contained 13 additional isolates out of 156 units tested. Thirty‐four strains were provided with information on the serogroup and belonged to six O‐groups, with O8 and O100 being the most represented (16 and 14 strains, respectively).
In 2020, two MS reported the presence of STEC in 769 sample units of Cantabrian chamois, deer, wild boar, water buffalo, birds and foxes, with 25 (3.2%) positives. One MS (Finland) reported on the testing of 301 broilers with no positive results. Analysis of the STEC serogroups, conducted using the full data set (Section 4.3.2, Data Analyses), revealed 34 STEC isolates. Thirty‐one isolates were obtained with information on the method used and only one strain was provided with information on the serogroup (STEC O157). None of the strains were virulotyped.
4.4.5. Focus on STEC strains features: virulence genes asset and serogroups
Humans
Data on STEC serogroups (based on the O antigen) were reported in 2020 by 20 MS. Serogroup data were available for about half of the human confirmed cases. The most commonly reported serogroup was O26, accounting for 20.1% of the human cases reported with information on the serogroup. For the first time, this serogroup outnumbered STEC O157 in the reported confirmed cases of STEC infections. These two serogroups together represented 38.7% of the total number of confirmed human cases with known serogroups in 2020 (Table 46). Serogroups O157 and O26 were followed by serogroups O103, O145, O146, O91, O80 and O128. Two serogroups, O183 and O177, were not present in the top 20 serogroups list in 2019. The proportion of non‐typeable STEC isolates increased to 18.3% (428 cases).
Data on virulotypes (based on Shiga toxin genes stx1, stx2 and the intimin‐coding gene eae) were reported for 30.1% (N = 1,337) of confirmed STEC infections (N = 4,446) in 2020. This represented a lower proportion than that reported in 2019 (49.7%), which may be partially explained by the impact of the COVID‐19 pandemic, as well as by the fact that 2019 data included those from the United Kingdom, which were not collected in 2020. Regarding the virulence characteristics of the strains isolated from severe cases of STEC infections, the most frequently reported virulence gene combination was stx2+/eae+, accounting for 36.4% of the strains from severe cases with known virulotypes (Table 45), with half of these isolated from HUS (61 cases out of 122 with this virulotype). The proportion of the second most common virulotype stx1+/stx2+/eae+ accounted for 20.6% of the cases. The most common stx gene subtypes were stx1 a (36.5% of isolates with reported stx gene subtyping data), stx2 a (31.9%) and stx2 c (12.6%) (Table 45). These subtypes represented 81% of the total number of subtypes identified in STEC strains from severe human cases.
Table 45.
Virulotypes of the food, animal and human isolates causing severe infection (HUS, hospitalisation and bloody diarrhoea) in 2020 and comparison with those associated with severe disease in humans during 2012–2017, in the EU
| Stx genes subtypes combinations | No of animal isolates in 2020 a | No of food isolates in 2020 a | No of human isolates in 2020 (%) | Relative frequency of the stx genes subtypes combinations in b | |||||
|---|---|---|---|---|---|---|---|---|---|
| HUS | Hospitalisation | Bloody Diarrhoea | |||||||
| eae+ | eae‐ | eae+ | eae‐ | eae+ | eae‐ | ||||
| Stx1a | 3 | 6 | 96 (36.5) | 1.2 | 0 | 27.6 | 20.7 | 27.3 | 8.0 |
| Stx2a | 4 | 2 | 84 (31.9) | 27.4 | 10.4 | 56.4 | 32.0 | 58.4 | 26.3 |
| Stx2c | ND | 1 | 33 (12.5) | 4.3 | 5.0 | 19.8 | NR | 23.9 | NR |
| Stx2b | ND | 1 | 23 (8.7) | NR | 0.50 | NR | 21.3 | NR | 10.5 |
| Stx1c | ND | 1 | 11 (4.2) | NR | 0.60 | NR | 18.9 | NR | 19.5 |
| Stx2d | 1 | ND | 6 (2.3) | NR | 10.3 | NR | 33.3 | NR | 16.0 |
| Stx2c; stx2a | 3 | ND | 5 (1.9) | 29.0 | NR | 57.1 | NR | 65.5 | NR |
| Stx2f | ND | ND | 2 (0.76) | 3.8 | NR | 21.0 | NR | 8.7 | NR |
| Stx2g | 2 | 1 | 2 (0.76) | NR | – | – | NR | NR | NR |
| Stx2d; stx2a | ND | ND | 1 (0.38) | – | – | – | – | – | – |
| Stx2a; stx1a | 3 | 1 | ND | 20.8 | 4.5 | 59.3 | NR | 56.6 | NR |
| Stx1d | ND | ND | ND | – | – | – | – | – | – |
| Stx2c; stx2a;stx1a | ND | ND | ND | 20.8 | 4.5 | 59.3 | NR | 56.6 | NR |
| Stx1a; stx1c | ND | ND | ND | – | – | – | – | – | – |
| Stx2e | ND | ND | ND | – | NR | NR | NR | NR | 31.8 |
| Stx2a; stx2e | ND | ND | ND | – | – | – | – | – | – |
| Stx2c; stx2d | ND | ND | ND | – | – | – | – | – | – |
| Stx2d; stx2b | ND | ND | ND | – | – | – | – | – | – |
| Stx2d; stx1a | ND | ND | ND | – | – | – | – | – | – |
| Stx2d; stx2a;stx1a | ND | ND | ND | – | – | – | – | – | – |
| Total | 16 | 13 | 263 | ||||||
STEC: Shiga toxin‐producing Escherichia coli; HUS: haemolytic‐uraemic syndrome. The stx genes are characterised at the subtype level.
NR: data present in the TESSy data set used with less than 20 isolates.
ND: Not detected.
–: not present in the TESSy database in the 2012–2017 period.
Due to the low number of isolates virulotyped for food, only the number of isolates is displayed.
Relative frequencies (%) of the different combinations of stx gene subtypes in STEC isolated from severe disease (TESSy data. 2012–2017) (EFSA BIOHAZ Panel, 2020b).
Food
This section includes the analysis of the data present in the full data set (Section 4.3.2, Data Analyses). Most of the top 20 STEC serogroups isolated from human infections were also found in the STEC isolated from food in 2020 with the exception of serogroups O80, O55, O121, O63, O78 and O177 (Table 46). For 402 (73.5%) STEC isolates, the only information reported was that the isolate did not belong to the O157 serogroup (40 isolates) or that the serogroup was unspecified (362 strains).
For the analysis of the virulence genes of STEC strains from food, all 560 isolates were used. There were fewer results reported on the virulotyping of STEC isolates from food compared to those reported in the previous year (EFSA and ECDC, 2021), as seen for the serogroups. This may possibly be due to the COVID‐19 pandemic, which may have affected typing activities.
Information on stx1 and/or stx2 was provided for 220 (39.3%) STEC strains. The combination of the stx and eae genes was available for 106 (48.2%) of these isolates (18.9% of STEC strains) (Table 45). Only 13 STEC isolates (2.3%) out of the 560 underwent stx gene subtyping (Table 45). Tables 44 and 45 show the combinations of the virulence genes determined in the food, animal and human STEC isolates in 2020 and their match with those found in the STEC isolated from severe human disease in the EU in 2012–2017, analysed in the latest pathogenicity assessment of STEC (EFSA BIOHAZ Panel, 2020b). Given the scarce amount of data on the virulence genes characterised in food and animal isolates in 2020, the figures are displayed in terms of number of isolates instead of the relative frequency for each virulotype.
Table 44.
Virulotypes of the food, animal and human isolates causing severe infection (HUS, hospitalisation and bloody diarrhoea) in 2020 and comparison with those associated with severe disease in humans during 2012–2017, in the EU
| Virulence genes profile | N of animal isolates in 2020 a | N of food isolates in 2020 a | N of human isolates in 2020 (%) | Relative frequency (%) of the virulotype in b | ||
|---|---|---|---|---|---|---|
| HUS | Hospitalisation | Bloody diarrhoea | ||||
| stx2; eae+ | 8 | 15 | 122 (36.4) | 17.7 | 42.0 | 40.2 |
| stx1; stx2; eae+ | 20 | 15 | 69 (20.6) | 5.9 | 35.7 | 64.8 |
| stx1; eae+ | 8 | 13 | 51 (15.2) | 1.2 | 27.4 | 27.3 |
| stx2; eae‐ | 4 | 27 | 47 (14.0) | 2.7 | 24.3 | 14.8 |
| stx1; stx2; eae‐ | 0 | 3 | 25 (7.5) | 1.4 | 15.3 | 19.4 |
| stx1; eae‐ | 0 | 33 | 21 (6.3) | 0.30 | 20.3 | 14.1 |
| Total | 40 | 106 | 335 c | |||
STEC: Shiga toxin‐producing Escherichia coli; HUS: haemolytic–uraemic syndrome. The stx genes are characterised at the type level (stx1 and stx2).
Due to the low number of isolates virulotyped for food and animals only the number of isolates is displayed.
Relative frequencies (%) of the different combinations of stx gene subtypes with or without the eae gene in STEC isolated from severe disease (TESSy data, 2012–2017) (EFSA BIOHAZ Panel, 2020b).
Two isolates were not included in this analysis because they were reported to be stx‐.
Animals
This section includes the analysis of the data present in the full data set (Section 4.3.2, Data Analyses), which contained 2,182 animal sample units tested, of which 6% (132) were positive for the presence of STEC.
For the analysis of the distribution of STEC serogroups, 83 (62.9%) STEC isolates with information on the serogroups were available. However, 25 isolates were obtained using the analytical method ISO 16654:2001 or equivalent methods, which aim at detecting the serogroup O157 only or were reported with an unspecified method and could not be included in the analysis of the serogroups’ distribution. The remaining 58 STEC isolates (69.9%) were obtained by using the ISO TS 13136:2012 or equivalent method, targeting any STEC, which were the data for the description of STEC serogroups (Table 46). Of these, 13 belonged to four of the top five serogroups (O26, O111, O145 and O157) and the remaining 45 isolates (88%) belonged to 14 non‐top five serogroups, including three of the top 20 serogroups isolated from human disease in 2020 (Table 46).
For analysis of the virulence genes of STEC strains, all the 132 STEC animal isolates were available. The genes stx were identified in 76 strains and eae in 40 of these (Table 44). Two MS also carried out stx gene subtyping and reported this information for 16 STEC strains (Table 45).
All data provided by the reporting countries were used to generate atlases of the STEC serogroups identified in the different food and animal categories comparatively for the years 2016–2020 (Appendix C) and for 2020 only (Appendcies D and E). It must be emphasised that the differences in the sampling strategies and, to a lesser extent, the analytical methods applied by reporting countries did not allow confirmation of the existence of specific trends in the geographical distribution of STEC serogroups.
4.5. Discussion
In the 5‐year period from 2015 to 2019, there was an increase in the overall trend of reported STEC cases in the EU. This observation can be attributed to enhanced general awareness of the importance of STEC detection following the reporting of several large STEC outbreaks worldwide and in the EU. Other contributing factors likely include changes in laboratory techniques, such as the increasing use of multiplexed molecular assays (PCR) and direct DNA extraction from specimens followed by isolation and further strain characterisation. In 2020, however, the reported cases of STEC infections decreased notably, probably due to the COVID‐19 pandemic, which affected different aspects of case identification. Additionally, the disruption of travel and the lockdowns imposed in different countries also influenced the number of the travel‐related cases.
In 2020, 56.2% of the confirmed human cases were reported with information on the serogroup. This rate was a slight decrease compared with 2019 when 57.9% of the human isolates had been serotyped. In 2020, the most frequently reported serogroup in human cases was O26, followed by O157. This pattern arises from an increasing trend in the number of STEC O26 cases observed in the last 5 years, while those assigned to STEC O157 decreased during the same period. This inversion in relative frequency can be explained by the increasing number of laboratories that are testing for serogroups other than O157. There has been a shift in diagnostic methods, with PCR amplification of Stx‐coding genes being more commonly used for detection of STEC cases in several MS instead of diagnosis based on the detection of the O157 antigen. On the other hand, STEC O26 was the most reported serogroup among HUS cases, as observed since 2016. Most of the HUS cases caused by this serogroup were reported by three countries (France, Italy and Ireland), two of which base their surveillance of STEC infections mainly on the detection of HUS cases.
The most recent pathogenicity assessment of STEC can be summed up in the following statement: ‘all STEC strains are pathogenic in humans, causing at least diarrhoea’ (EFSA BIOHAZ Panel, 2020b). Nonetheless, it has been suggested that the highest predictive power in terms of pathogenicity potential of STEC strains resides in the characterisation of the Shiga toxin‐coding genes (stx) and, to a lesser extent, the intimin‐coding eae gene rather than in the identification of the serogroups (EFSA BIOHAZ Panel, 2020b) (JEMRA and NACMCF reports at Section 4.6 Internet sources). Therefore, a more thorough analysis of the virulence gene content, particularly the subtyping of the stx genes, can help identify some virulence gene combinations (virulotypes) that have a higher frequency of association with severe disease in humans (EFSA BIOHAZ Panel, 2020b). Regarding subtyping capacity, more than half of MS’ national public health laboratories reported the ability to perform WGS for STEC isolates (EFSA BIOHAZ Panel, 2020b). This is a promising perspective possibly enabling increased reporting of typing and subtyping data for STEC isolates in the coming years.
In 2020, 1,328 cases of STEC infection (30.1% of all cases) were reported together with information on the stx genes (stx1 or stx2) and for the presence of the intimin‐coding gene eae and 263 strains (5.9%) were provided with information on the stx gene subtypes. Based on the analysis of the stx subtypes reported in TESSy from 2012 to 2017 (EFSA BIOHAZ Panel, 2020b), all STEC virulence gene combinations and most of the stx gene subtypes identified in 2020 can be associated with severe illness, albeit at different frequencies.
Of the STEC cases with known hospitalisation status, more than one third were hospitalised. Some countries (Ireland, the Netherlands, Norway and Austria), all with notification rates above the EU average, reported high numbers of hospitalised cases. The age group most affected by STEC was infants and children up to 4 years of age, who accounted for 73.1% of HUS cases. Most cases of deaths (69.2%) were however reported in the age groups of 65+ years, with less than one third with HUS.
In 2020, 22 EU MS plus Serbia reported monitoring results of STEC in 22,520 food samples. Not all reporting MS have tested all food categories equally. After aggregating the food samples into macro‐categories in 2020, the number of MS testing and reporting data on the presence of STEC in food ranged from 19 MS plus Serbia reporting the testing for STEC in meat samples to 19 MS and 10 MS testing vegetables (including seeds) and milk and dairy products, respectively. Sprouted seeds were tested by 16 MS, considering the full data set. As noted in previous years, although a microbiological criterion for the presence of STEC in seeds has been established in Regulation (EC) No 209/2013 amending the Regulation (EC) No 2073/2005, the sampling of this food category in the EU appears to be extremely infrequent.
The analytical procedures for testing food in the EU have been substantially harmonised. In 2020, all the reporting countries used the ISO TS 13136:2012 or equivalent method to test 21,139 samples (94.9%) out of the 22,275 total samples tested in the EU. In 2020, there was still a residual amount of data being reported by some MS (five) for specific surveys using the ISO 16654:2001 or equivalent method. This method detects serogroup O157 only and does not give information on any other STEC serogroups possibly present in the sample. It is important to note that E. coli O157 detection methods are based on the identification of the serogroup and do not include the determination of the stx gene or of the toxin produced. This laboratory analysis must be actively carried out by MS to confirm that the isolated E. coli O157 strains are STEC. This latter piece of information was not always reported. Finally, in 2020, one country (Luxembourg) did not specify the method used to test 159 sample units, which were excluded from the descriptive analyses of the STEC serogroups.
The general extent of observed STEC contamination of food, assessed using the entire data set, was 2.5% and was in line with what has been determined in previous years. STEC‐positive units were detected in the following RTE foods: in meat and meat products, raw milk and milk products. Importantly, only a few MS reported data for certain food categories or with a limited sampling effort for certain foods (e.g. three MS reporting 212 raw milk sample results). Nevertheless, the testing of RTE food commodities for STEC is important, because these foods are consumed without any treatment to reduce or eliminate the possible presence of the pathogen, posing a direct risk to the consumer.
As observed in previous years, the frequencies of STEC contamination varied among the different major food categories, RTE and non‐RTE. The most contaminated food categories included commodities of animal origin, with fresh meat from small ruminants in particular. Deer meat (venison) was the food commodity presenting the highest values (24.5%), followed by ovine and goat meat (11.6%).
Although all STEC strains are considered pathogenic, the determination of their features such as the serogroup is still an important application to trace the circulation of the different STEC types. Although the recent pathogenicity assessment of STEC (EFSA BIOHAZ Panel, 2020b) affirms that this feature is not an indication of pathogenicity, serogroup identification still has some importance as an epidemiological marker, and it remains useful to try and correlate the circulation of the different STEC types in food and human cases of disease. In 2020, 28.2% of the food isolates were provided with information on the serogroup, compared with 34.4% observed in 2019 and 41.8% in 2018. Of these, 17.7% belonged to the ‘top five’ serogroups (O157, O26, O103, O111 and O145), and the remaining isolates belonged to 36 different O‐groups (Table 41).
Most of the top 20 STEC serogroups isolated from human infections were also found in the STEC isolated from food in 2020, with the exception of serogroups O80, O55, O121, O63, O78 and O177.
As regards the animal monitoring results for 2020, overall, 6.3% of the samples were STEC‐positive, compared with 14.1% in 2019. However, the number of animal sampling units tested continued to be very low, possibly biasing the estimates. Also in 2020, as observed in 2019, this high prevalence may be explained by a very high value of STEC‐positive pig herds reported by two MS from testing a total of 85 samples, but most of these are unlikely to involve zoonotic strains (Abubakar et al., 2017; Remfry et al., 2021). In 2020, 5.2% of the cattle samples tested were contaminated with STEC. This figure is much lower than that observed in 2019 (17.1%), but is in line with the figure observed in 2018 (3.1%). In any case, these fluctuations observed in STEC‐contaminated animal samples are influenced by the low number of sample units tested.
The analysis of the presence and subtypes of virulence genes is important for pathogenicity assessment. Unfortunately, this level of characterisation is still far from being comprehensive for food and animal isolates and only 39.3% of the STEC isolated from food in 2020 were reported together with the information on the stx gene types (stx1 or stx2); furthermore only 48.2% of these were also tested for the presence of the intimin‐coding gene eae. These figures drop dramatically to 5.9% (13 out of 220 strains with the information on the stx genes types) and 12.3% (13 out of 106 strains with information on the stx and eae genes) when the information on the stx gene subtypes was considered, alone or together with the information on the presence of the eae gene, respectively. Because this typing and subtyping strategy represents the basis for molecular risk assessment of STEC circulating in the vehicles of infection, MS should be encouraged to expand the adoption of this approach.
The analysis of the STEC isolated from food in 2020 showed that all the virulotypes identified matched those associated with the STEC strains isolated from severe disease (HUS, hospitalisation or bloody diarrhoea) in the EU during the 2012–2017 period (EFSA BIOHAZ Panel, 2020b), considering the gene profiles eae; stx1; stx2 (Table 44). As far as the stx gene subtyping is concerned, six out of the seven combinations identified in food isolates were also represented among those associated with severe disease (Table 45).
Similarly, few animal isolates were reported with data on the characterisation of the virulence genes. Only 16 animal isolates had undergone stx gene subtyping by two MS. Nevertheless, also in this case, many of the virulotypes identified (all the eae; stx1; stx2 profiles and five out of six subtype combinations) in animal isolates shared the same features as STEC isolated from human severe disease during the 2012–2017 period (EFSA BIOHAZ Panel, 2020b) (Tables 44 and 45). The methodologies for typing and subtyping STEC virulence genes are largely available in the food sector, including PCR‐based methods and approaches based on WGS. Such methodologies are supported by external quality assessment (EQA) at the EU National Reference Laboratories level by the EURL for E. coli through its annual inter‐laboratory proficiency testing scheme. A wider adoption of subtyping is thus advisable, but to do so, it is crucial to raise awareness on the need to expand the analysis to the stx gene subtypes, particularly beyond the NRL level. Increased awareness will provide more detailed typing and subtyping data for food and animal STEC isolates, thereby enabling an enhanced risk assessment of STEC in support of actions to be undertaken by CA to mitigate the impact of STEC on public health.
4.6. Related projects and internet sources
| Subject | For more information see | |
|---|---|---|
| Humans | ECDC Surveillance Atlas of Infectious Diseases | http://atlas.ecdc.europa.eu/public/index.aspx |
| EU case definition of STEC/VTEC infection | https://www.ecdc.europa.eu/en/surveillance‐and‐disease‐data/eu‐case‐definitions | |
| Disease Programme on Emerging, Food‐ and Vector‐Borne Diseases | https://www.ecdc.europa.eu/en/about‐us/who‐we‐are/units/disease‐programmes‐unit | |
| European Food‐ and Waterborne Diseases and Zoonoses Network (FWD‐Net) | https://ecdc.europa.eu/en/about‐us/partnerships‐and‐networks/disease‐and‐laboratory‐networks/fwd‐net | |
| World Health Organization – E. coli fact sheet | http://www.who.int/mediacentre/factsheets/fs125/en/ | |
| Food, animals | EFSA Scientific Opinion of the Panel on Biological Hazards (BIOHAZ) – Monitoring of verotoxigenic Escherichia coli (VTEC) and identification of human pathogenic VTEC types | http://www.efsa.europa.eu/en/efsajournal/pub/579 |
| Scientific Opinion of the Panel on Biological Hazards (BIOHAZ) – Monitoring of verotoxigenic Escherichia coli (VTEC) and identification of human pathogenic VTEC types | http://www.efsa.europa.eu/en/efsajournal/pub/579 | |
| VTEC‐seropathotype and scientific criteria for pathogenicity assessment | http://www.efsa.europa.eu/en/efsajournal/pub/3138 | |
| Pathogenicity assessment of Shiga toxin‐producing Escherichia coli (STEC) and the public health risk posed by contamination of food with STEC | https://efsa.onlinelibrary.wiley.com/doi/10.2903/j.efsa.2020.5967 | |
| JEMRA FAO/WHO report: Shiga toxin‐producing Escherichia coli (STEC) and food: attribution, characterisation and monitoring. Microbiological Risk Assessment Series. Rome | http://www.fao.org/documents/card/en/c/CA0032EN | |
| Public health advice on prevention of diarrhoeal illness with special focus on Shiga toxin‐producing Escherichia coli (STEC), also called verotoxin‐producing E. coli (VTEC) or enterohaemorrhagic E. coli (EHEC) | http://www.efsa.europa.eu/en/press/news/110611 | |
| Directive 2003/99/EC of the European Parliament and of the Council of 17 November 2003 on the monitoring of zoonoses and zoonotic agents, amending Council Decision 90/424/EEC and repealing Council Directive 92/117/EEC | https://eur‐lex.europa.eu/legal‐content/EN/TXT/PDF/?uri=CELEX:32003L0099&from=EN | |
| Regulation (EC 209/2013) | http://eur‐lex.europa.eu/legal‐content/EN/TXT/?uri=CELEX:32013R0209 | |
| EURL VTEC webpage: laboratory methods for STEC detection and typing | http://www.iss.it/vtec/index.php?lang=2&anno=2017&tipo=3 | |
| EURL VTEC webpage: Focus on‐STEC and other pathogenic E. coli | http://www.iss.it/vtec/index.php?lang=2&anno=2017&tipo=20# | |
| NACMCF report: Response to Questions Posed by the Food and Drug Administration Regarding Virulence Factors and Attributes that Define foodborne Shiga Toxin‐Producing Escherichia coli (STEC) as Severe Human Pathogens | https://www.fsis.usda.gov/wps/wcm/connect/981c8e0a‐6a5b‐45d1‐a04d‐1934463a666c/nacmcf‐stec‐2019.pdf?MOD=AJPERES | |
| Annual national zoonoses country reports (reports of reporting countries on national trends and sources of zoonoses) | http://www.efsa.europa.eu/en/biological‐hazards‐data/reports |
5. Tuberculosis due to Mycobacterium bovis or Mycobacterium caprae
Tables and figures that are not presented in this chapter are published as supporting information to this report and are available as downloadable files from the EFSA Knowledge Junction on Zenodo at https://doi.org/10.5281/zenodo.5682809

5.1. Key facts
-
•
In 2020, 88 confirmed cases of tuberculosis due to Mycobacterium bovis or M. caprae were reported in the EU.
-
•
Although M. bovis and M. caprae cases were more frequently reported by MS that were not officially bovine tuberculosis free (non‐OTF) compared with MS that were officially bovine tuberculosis free in cattle (OTF), the notification rate in the two groups of MS was similar (0.02 cases per 100,000 in OTF and 0.02 per 100,000 in non‐OTF).
-
•
In 2020, the majority of M. bovis and M. caprae cases in humans (55.7%) were of EU origin (native cases and/or cases originating from other EU MS).
-
•
The EU notification rate of M. bovis and M. caprae has ranged from 0.02 to 0.05 per 100,000 population between 2016 and 2020.
-
•
In 2020, the EU notification rate of tuberculosis due to M. bovis or M. caprae was 0.02 per 100,000 population. This is a decrease of 32.2% and 25.8% compared with the rate in 2019 (0.035 and 0.032 per 100,000 population) with and without the data from the United Kingdom, respectively.
-
•
No foodborne outbreak due to the Mycobacterium tuberculosis complex has ever been reported to EFSA since the start of the data collection on foodborne outbreaks in 2004; 2020 was no exception.
-
•
In 2020, the overall prevalence of bovine tuberculosis and the number of positive bovine herds in the EU decreased to 0.4% and 7,372 herds, respectively, compared to 0.8% and 16,420 herds in 2019. This decrease was mainly due to the withdrawal of the United Kingdom from the EU.
-
•
Thirteen MS detected the presence of bovine tuberculosis in 2020. Similar to previous years, the distribution of positive herds was heterogeneous and spatially clustered, with herd prevalence ranging from < 0.1% (Belgium, Poland) to 4.7% (Ireland) at a national level and a regional‐level prevalence of 8.3% in the Castilla‐La Mancha region, Spain.
-
•
Seventeen MS were officially bovine tuberculosis‐free (OTF) during 2020. Ten MS were non‐OTF, of which only three MS (Italy, Portugal and Spain) had OTF regions.
-
•
Overall, 139 bovine tuberculosis‐infected cattle herds (0.013% of all herds in the OTF regions of these 20 MS), making infection a rare event, as in previous years.
-
•
In the non‐OTF regions of 10 MS, 7,233 bovine herds (1.01% of total herds in these regions) tested positive for bovine tuberculosis in 2020. Ireland and Spain were the only MS that reported prevalence rates > 1%; in particular, bovine tuberculosis prevalence was 4.7% in Ireland and 1.5% in Spain. Greece, Italy and Portugal reported very low (< 1%) prevalence rates. No infected herds were reported by Malta.
-
•
From 2010 to 2020, the annual number of bovine tuberculosis‐positive cattle herds and the prevalence of bovine tuberculosis in non‐OTF regions decreased by 59.4% and 3.2%, respectively. This decrease was attributable to the withdrawal of the United Kingdom from the EU in 2020. In fact, the annual prevalence of bovine tuberculosis‐positive herds in non‐OTF regions of the United Kingdom (i.e. Wales, England and Northern Ireland) was consistently greater than 10% between 2010 and 2019. Moreover, in non‐OTF regions, the total number of cattle herds dropped by 56.5% during the same period (there were half as many herds in 2020 as in 2010). Compared with 2019, in non‐OTF regions, the total number of cattle herds, the prevalence and the number of positive cattle herds decreased in 2020 by 55.6%, 43.8% and 21%, respectively. However, excluding the United Kingdom from the data for 2019 reveals an increase of about 7% and 23% in the annual number of positive cattle herds and the prevalence of cattle herds in the non‐OTF regions, respectively, and a decrease of 12.8% in the total number of cattle herds for 2020.
5.2. Surveillance and monitoring of tuberculosis due to Mycobacterium bovis or Mycobacterium caprae in the EU
5.2.1. Humans
The notification of tuberculosis in humans is mandatory in all EU MS, Iceland, Norway, Liechtenstein and Switzerland and covers the whole population.
Countries may update their data retroactively, and therefore, reported numbers are subject to change in the future or may vary from numbers reported in previous reports. The M. bovis and M. caprae EU notification rate is calculated using the combined population of the EU MS that reported data in 2020. The proportion of tuberculosis cases caused by M. bovis or M. caprae was calculated using the preliminary estimate of the total number of confirmed tuberculosis cases in 2020 among reporting EU MS’ species‐specific data.
No human data on M. bovis or M. caprae cases are available for France or Iceland because these MS did not report species‐specific data within the Mycobacterium tuberculosis complex for human tuberculosis cases in 2020. France has not reported species‐specific data in any previous years and Iceland only reported species‐specific data in 2018. In addition, Latvia did not report any M. tuberculosis complex data for 2018–2020.
As tuberculosis is a chronic disease with a long incubation period, it is not possible to assess travel‐associated cases in the same way as for diseases with acute onset. Instead, a distinction is made between individuals with the disease originating from an EU MS (cases of EU origin) and those originating from outside the EU (case originating outside of EU). In the analysis, origin is mainly based on the reported birthplace, except for cases from Austria, Belgium, Greece, Hungary and Poland, whose origin is based on their reported nationality. The treatment outcome for tuberculosis due to M. bovis or M. caprae is assessed 1 year (12 months) after case notification, because the shortest duration for treatment completion is 6 months according to the international treatment guidelines for tuberculosis.
5.2.2. Animals
Bovine tuberculosis monitoring data from bovine animals originating from the national control and eradication programmes and/or from countries or regions with officially tuberculosis‐free status
According to the Zoonoses Directive 2003/99/EC, MS must report annual monitoring data for tuberculosis. These data originate from national control and surveillance programmes implemented by the MS in accordance with EU legislation. The reports submitted by the MS are based on Council Directive 64/432/EEC and subsequent legislation, and are essential for the assessment of the epidemiological situation in MS and MS regions, whether declared officially bovine tuberculosis‐free in cattle (OTF) or not yet declared OTF. Annual surveillance programmes are carried out in OTF regions to confirm the absence of bovine tuberculosis, and control and eradication programmes for bovine tuberculosis are in place in all non‐OTF regions. These data are comparable across MS because the monitoring schemes are harmonised, and the data collected and reported to EFSA originate from the census‐based sampling strategy. In addition to the analysis of trends at the EU level and at the MS level as well as for trend tracking and descriptive summaries, these data can also be used to assess the impact of the national control and eradication programmes (Table 1).
EU MS also need to notify outbreaks of bovine tuberculosis in terrestrial animals from OTF regions to the EU Animal Disease Notification System 20 (ADNS) and summaries are posted online regularly.
For bovine tuberculosis cases, all tuberculosis cases irrespective of their causative agents (i.e. also including those caused by M. caprae) are included in statistics provided by MS, in contrast to the procedure for the above‐mentioned statistics for humans, for which cases of infections with M. bovis and M. caprae are treated separately. The definition recommended by the bovine tuberculosis subgroup of the EU task force on monitoring animal disease eradication (SANCO/10200/2006) explicitly indicates that all cases of tuberculosis in cattle due to a disease‐causing member of M. tuberculosis complex are to be considered as cases of bovine tuberculosis. Therefore, all information available on the specific bacterial species belonging to the M. tuberculosis complex recovered from cattle was taken into account to summarise the EU situation on bovine tuberculosis. Whenever possible, reporting MS distinguish descriptively between M. tuberculosis complex species, M. bovis and M. caprae.
Mycobacterium monitoring data from food and from animals other than bovine animals
Mycobacterium monitoring data from food and from animals other than bovine animals submitted to EFSA according to the Zoonoses Directive 2003/99/EC and collected outside of the harmonised design allow for descriptive summaries at the EU level. They preclude analysing and tracking trends at the EU level (Table 1).
5.2.3. foodborne outbreaks of tuberculosis due to Mycobacterium bovis or Mycobacterium caprae
The reporting of foodborne outbreaks of tuberculosis due to M. bovis or M. caprae is mandatory according to the Zoonoses Directive 2009/99/EC.
Since 1 February 2020, the United Kingdom has become a third country. Food, animal and foodborne outbreak data from the United Kingdom were still collected by EFSA for 2020 in the framework of the Zoonoses Directive 2003/99/EC, but are excluded from EU statistics.
5.3. Results
5.3.1. Overview of key statistics, EU, 2016–2020
Table 47 summarises the EU‐level statistics on human tuberculosis due to M. bovis or M. caprae and on bovine tuberculosis during 2016–2020. Further descriptions of findings can be found in the following sections.
Table 47.
Summary statistics related to tuberculosis due to Mycobacterium bovis and M. caprae related to humans and bovine animals (stratified by OTF and non‐OTF regions), EU, 2016–2020
| 2020 | 2019 a | 2018 a | 2017 a | 2016 a | Data source | ||
|---|---|---|---|---|---|---|---|
| Humans | |||||||
| Number of confirmed M. bovis cases | 86 | 141 | 168 | 204 | 182 | ECDC | |
| Number of confirmed M. caprae cases | 2 | 11 | 13 | 9 | 11 | ECDC | |
| Total number of confirmed cases | 88 | 152 | 181 | 213 | 193 | ECDC | |
| Total number of confirmed cases/100,000 population (notification rates) | 0.02 | 0.03 | 0.04 | 0.05 | 0.04 | ECDC | |
| Number of EU MS that reported data on M. bovis or M. caprae cases | 25 | 26 | 26 | 27 | 27 | ECDC | |
| M. bovis or M. caprae cases in individuals of EU origin | 49 | 107 | 105 | 143 | 109 | ECDC | |
| M. bovis or M. caprae cases in individuals originating from outside EU | 32 | 40 | 68 | 62 | 72 | ECDC | |
| M. bovis or M. caprae cases in individuals of unknown origin | 7 | 5 | 8 | 8 | 12 | ECDC | |
| Total number of foodborne outbreaks | 0 | 0 | 0 | 0 | 0 | EFSA | |
| Number of outbreak‐related cases | 0 | 0 | 0 | 0 | 0 | EFSA | |
| Bovine animals | |||||||
| Number of infected herds in OTF regions | 139 | 143 | 172 | 134 | 147 | EFSA | |
| Number of reporting OTF MS | 17 | 17 | 17 | 18 | 18 | EFSA | |
| Number of positive herds in non‐OTF regions | 7,233 | 16,277 | 18,801 | 18,857 | 17,421 | EFSA | |
| Number of reporting non‐OTF MS | 9 b | 11 | 11 | 10 | 10 | EFSA | |
OTF: official tuberculosis‐free in cattle.
Data reported by the United Kingdom were included in years 2016–2019, when it was still an EU Member State. Since 1 February 2020, the United Kingdom has become a third country.
No data from Bulgaria.
5.3.2. Tuberculosis due to Mycobacterium bovis and Mycobacterium caprae in humans
In 2020, nine EU MS reported 88 confirmed human cases of tuberculosis due to M. bovis or M. caprae (Table 48). Of these cases, 86 were due to M. bovis and were reported by nine MS (Belgium, Finland, Germany, Greece, Ireland, Italy, the Netherlands, Spain and Sweden). The two cases due to M. caprae were both reported by Germany. Between 2016 and 2020, the number of M. caprae cases notified each year has ranged between 2 (in 2020) and 13 (in 2018). Overall, M. bovis and M. caprae cases accounted for a small proportion (0.3%) of the total tuberculosis cases reported by the 25 EU MS with species‐specific data within the M. tuberculosis complex available in 2020. Sixteen MS did not report any cases.
Table 48.
Reported cases of human tuberculosis due to Mycobacterium bovis and M. caprae and notification rates per 100,000 population in EU MS and non‐MS countries by country and year, 2016–2020
| Country | 2020 | 2019 | 2018 | 2017 | 2016 | ||||||||
|---|---|---|---|---|---|---|---|---|---|---|---|---|---|
|
Status a |
National coverage b | Data format b | Confirmed cases and rates | Confirmed cases and rates | Confirmed cases and rates | Confirmed cases and rates | Confirmed cases and rates | ||||||
| Cases | Rate | Cases | Rate | Cases | Rate | Cases | Rate | Cases | Rate | ||||
| Austria | OTF | Y | C | 0 | 0 | 3 | 0.03 | 2 | 0.02 | 2 | 0.02 | 3 | 0.03 |
| Belgium | OTF | Y | C | 6 | 0.05 | 0 | 0 | 5 | 0.04 | 6 | 0.05 | 14 | 0.12 |
| Bulgaria | Y | C | 0 | 0 | 0 | 0 | 0 | 0 | 0 | 0 | 0 | 0 | |
| Croatia | Y | C | 0 | 0 | 0 | 0 | 0 | 0 | 0 | 0 | 0 | 0 | |
| Cyprus | Y | C | 0 | 0 | 0 | 0 | 0 | 0 | 0 | 0 | 0 | 0 | |
| Czechia | OTF | Y | C | 0 | 0 | 0 | 0 | 1 | 0.01 | 0 | 0 | 1 | 0.01 |
| Denmark | OTF | Y | C | 0 | 0 | 0 | 0 | 0 | 0 | 1 | 0.02 | 2 | 0.04 |
| Estonia | OTF | Y | C | 0 | 0 | 0 | 0 | 0 | 0 | 0 | 0 | 0 | 0 |
| Finland | OTF | Y | C | 1 | 0.02 | 0 | 0 | 0 | 0 | 0 | 0 | 0 | 0 |
| France c | OTF | – | – | – | – | – | – | – | – | – | – | – | – |
| Germany | OTF | Y | C | 35 | 0.04 | 51 | 0.06 | 64 | 0.08 | 48 | 0.06 | 60 | 0.07 |
| Greece | Y | C | 2 | 0.02 | 1 | 0.01 | 0 | 0 | 1 | 0.01 | 0 | 0 | |
| Hungary | OTF | Y | C | 0 | 0 | 0 | 0 | 0 | 0 | 0 | 0 | 0 | 0 |
| Ireland | Y | C | 3 | 0.06 | 7 | 0.14 | 7 | 0.14 | 4 | 0.08 | 3 | 0.06 | |
| Italy d | Y | C | 6 | 0.01 | 11 | 0.02 | 17 | 0.03 | 21 | 0.03 | 13 | 0.02 | |
| Latvia | OTF | Y | C | – | – | – | – | – | – | 0 | 0 | 0 | 0 |
| Lithuania | OTF | Y | C | 0 | 0 | 0 | 0 | 0 | 0 | 0 | 0 | 0 | 0 |
| Luxembourg | OTF | Y | C | 0 | 0 | 0 | 0 | 0 | 0 | 0 | 0 | 0 | 0 |
| Malta | Y | C | 0 | 0 | 0 | 0 | 0 | 0 | 0 | 0 | 0 | 0 | |
| Netherlands | OTF | Y | C | 6 | 0.03 | 5 | 0.03 | 11 | 0.06 | 11 | 0.06 | 14 | 0.08 |
| Poland | OTF | Y | C | 0 | 0 | 0 | 0 | 0 | 0 | 0 | 0 | 0 | 0 |
| Portugal e | Y | C | 0 | 0 | 0 | 0 | 0 | 0 | 0 | 0 | 0 | 0 | |
| Romania | Y | C | 0 | 0 | 1 | 0.01 | 0 | 0 | 2 | 0.01 | 2 | 0.01 | |
| Slovakia | OTF | Y | C | 0 | 0 | 0 | 0 | 0 | 0 | 0 | 0 | 0 | 0 |
| Slovenia | OTF | Y | C | 0 | 0 | 0 | 0 | 0 | 0 | 0 | 0 | 0 | 0 |
| Spain f | Y | C | 23 | 0.05 | 35 | 0.07 | 46 | 0.10 | 73 | 0.16 | 39 | 0.08 | |
| Sweden | OTF | Y | C | 6 | 0.06 | 3 | 0.03 | 4 | 0.04 | 3 | 0.03 | 5 | 0.05 |
| EU Total 27 | – | – | 88 | 0.02 | 117 | 0.03 | 157 | 0.04 | 172 | 0.05 | 156 | 0.04 | |
| United Kingdom g | Y | C | – | – | 35 | 0.05 | 24 | 0.04 | 41 | 0.06 | 37 | 0.06 | |
| EU Total h | – | – | 88 | 0.02 | 152 | 0.03 | 181 | 0.04 | 213 | 0.05 | 193 | 0.04 | |
| Iceland i | Y | C | 0 | 0 | 0 | 0 | 0 | 0 | 0 | 0 | 0 | 0 | |
| Norway | OTF | Y | C | 0 | 0 | 0 | 0 | 0 | 0 | 3 | 0.06 | 5 | 0.10 |
| Switzerland j | OTF | Y | C | 2 | 0.02 | 4 | 0.05 | 3 | 0.04 | 3 | 0.04 | 5 | 0.06 |
EU: European Union.
–: Data not reported.
OTF: Officially bovine tuberculosis free (status regarding freedom from bovine tuberculosis, in cattle).
Y: yes; N: no; A: aggregated data; C: case–based data.
Not reporting species of the M. tuberculosis complex.
In Italy, nine regions, the autonomous provinces of Trento and Bolzano and additional nine provinces are OTF.
In Portugal, all administrative regions within the superior administrative unit of the Algarve and Azores regions except of the island of São Miguel are OTF.
In Spain, the province of Pontevedra and the Canary Islands are OTF.
In the United Kingdom, Scotland and the Isle of Man are OTF (in cattle).
Cases reported from the UK in 2016–2019 were also considered for this estimation (EU–28). When 2016–2019 UK data were collected, the UK was an EU MS, but since 1 February 2020, it has become a third country.
In Iceland, that has no special agreement concerning animal health (status) with the EU, the last outbreak of bovine tuberculosis was in 1959.
Switzerland provided data directly to EFSA. The human data for Switzerland include data from Liechtenstein.
The EU notification rate in 2020 was 0.02 cases per 100,000 population, which is lower than the rates in the previous 4 years. (Table 48). The EU notification rate decreased by 32.2% and 25.8% compared with the rate in 2019 (0.035 and 0.032 per 100,000 population) with and without the data from the United Kingdom, respectively. In 2020, the highest notification rate was reported by Ireland and Sweden (0.06 per 100,000), followed by Belgium and Spain (0.05 per 100,000).
There were 17 EU MS that had OTF status in 2020, and, of these, 15 reported on species of the M. tuberculosis complex. The notification rate of human M. bovis and M. caprae cases among these 15 EU MS was 0.02 cases per 100,000 population. Also in the non‐OTF EU MS the notification rate was 0.02 cases per 100,000 population.
Most cases, 55.7% (49/88), reported in 2020 were of EU origin (native cases and/or cases originating from other EU MS). The remaining cases originated from outside the EU (36.3%, N = 32), or had unknown origin (8.0%, N = 7) (Table 47). Notification rates of M. bovis and M. caprae cases in humans were similar in OTF EU MS (57.1%, N = 28) and non‐OTF EU MS (42.9%, N = 21).
Treatment outcome after 12 months was reported for 89.7% (N = 105/117) of the human M. bovis and M. caprae cases reported in 2019. Among these cases, successful treatment was reported for 46 cases (43.8%), while two cases (1.9%) were still on treatment at 12 months. Deaths were reported in 19 cases (18.1%), and 38 cases (36.2%) were lost to follow up.
Drug resistance to isoniazid and rifampicin among M. bovis or M. caprae in human cases remained low in 2020; among 68 cases with test results reported for both isoniazid and rifampicin, only two were isoniazid‐resistant (3%) and one was rifampicin‐resistant (1.5%). No multidrug‐resistant (resistance to rifampicin and isoniazid) cases were reported.

Figure 25: Map of the number of confirmed tuberculosis cases due to Mycobacterium bovis and Mycobacterium caprae in individuals of EU origin, and national herd prevalence of bovine tuberculosis in cattle (ignoring OTF regions) in EU MS and non‐MS countries, 2020
Human tuberculosis cases associated with foodborne outbreaks
No foodborne outbreaks due to Mycobacterium spp. were reported for 2020 in the EU and no single such foodborne outbreak has been reported to EFSA since the start of the foodborne outbreak reporting in 2004.
5.3.3. Mycobacterium in food
With regard to Mycobacterium monitoring in food, only Italy reported the results of 38 milk samples tested in 2020, which were all negative.
5.3.4. Bovine tuberculosis in animals
Bovine tuberculosis monitoring data from bovine animals originating from national control and eradication programmes and/or from countries or regions with officially tuberculosis‐free status
Bovine tuberculosis status for European countries, reflecting the situation on 31 December 2020, is presented in Figure 26 and Table 49. Seventeen MS were OTF during 2020. In the 10 non‐OTF MS, three MS had OTF regions or provinces:
-
•
Italy: nine regions, the autonomous provinces of Trento and Bolzano and nine other provinces;
-
•
Portugal: the Algarve and Azores regions, except the island of São Miguel;
-
•
Spain: the province of Pontevedra and the Canary Islands.
Figure 26.
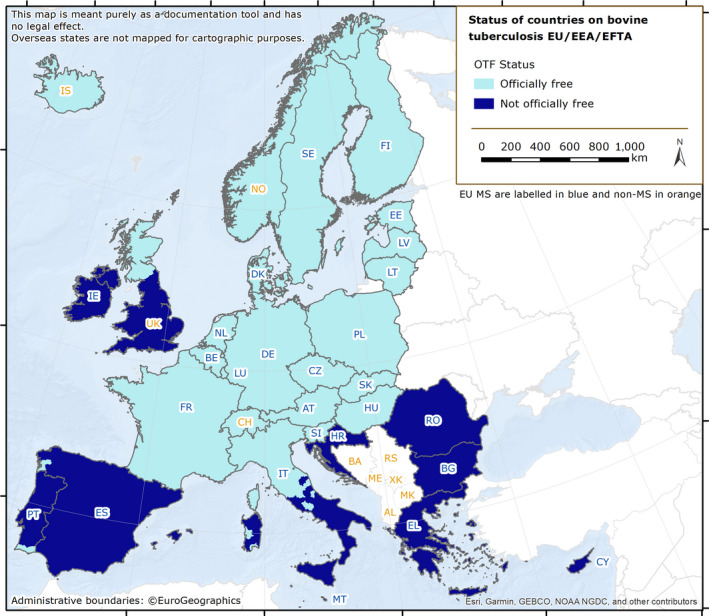
Bovine tuberculosis status by country in MS and non‐MS, EU, 2020
Table 49.
Status of countries on bovine tuberculosis and related prevalence, EU, 2020
| Member state (MS) | OTF status | N of infected herds in OTF regions | Prevalence (%) of infected herds in OTF regions | N of positive herds in non‐OTF regions | Prevalence (%) of positive herds in non‐OTF regions |
|---|---|---|---|---|---|
| Austria | OTF | 5 a | 0.01 | – | – |
| Belgium | OTF | 1 b | < 0.01 | – | – |
| Bulgaria | – | – | – | – | |
| Croatia | – | – | 4 | 0.02 | |
| Cyprus | – | – | 0 | 0 | |
| Czechia | OTF | 0 | 0 | – | – |
| Denmark | OTF | 0 | 0 | – | – |
| Estonia | OTF | 0 | 0 | – | – |
| Finland | OTF | 0 | 0 | – | – |
| France | OTF | 104 b | 0.07 | – | – |
| Germany | OTF | 10 a | 0.01 | – | – |
| Greece | – | – | 70 | 0.39 | |
| Hungary | OTF | 4 b | 0.03 | – | – |
| Ireland | – | – | – | 5,187 | 4.7 |
| Italy | 7 b | 0.01 | 266 d | 0.54 | |
| Latvia | OTF | 0 | 0 | – | – |
| Lithuania | OTF | 0 | 0 | – | – |
| Luxembourg | OTF | 0 | 0 | – | – |
| Malta | – | – | 0 | 0 | |
| Netherlands | OTF | 0 | 0 | – | – |
| Poland | OTF | 8 b | < 0.01 | – | – |
| Portugal | 0 | 0 | 111 | 0.35 | |
| Romania | – | – | 24 | 0.01 | |
| Slovakia | OTF | 0 | 0 | – | – |
| Slovenia | OTF | 0 | 0 | – | – |
| Spain | 0 | 0 | 1,571 | 1.5 | |
| Sweden | OTF | 0 | 0 | – | – |
| EU Total | 139 | 0.013 | 7,233 | 1.01 |
OTF: Officially bovine tuberculosis‐free (officially free of bovine tuberculosis in cattle).
: Only Mycobacterium caprae identified.
: Only Mycobacterium bovis identified.
: No data reported by Bulgaria.
Data include 81 positive buffalo herds.
 All regions of the MS are OTF.
 Not all regions of the MS are OTF.
 No region of the MS is OTF.
Seven non‐OTF MS had no OTF regions: Bulgaria, Croatia, Cyprus, Greece, Ireland, Malta and Romania. Bulgaria did not send valid bovine tuberculosis data to EFSA for 2020.
Norway and Switzerland were OTF, in accordance with EU legislation. Liechtenstein has the same status (OTF) as Switzerland. In Iceland, which has no special agreement with the EU on animal health status, the last outbreak of bovine tuberculosis was reported in 1959. The United Kingdom, which has become a third country since 1 February 2020, submitted data for England, Wales and Northern Ireland, but not for Scotland.
During 2020, in the EU, the overall proportion of cattle herds infected with or positive for bovine tuberculosis was very low (7,372 out of 1,745,260 herds; 0.4%) and lower than in 2019 (0.8%). The 13 MS that reported no cases of bovine tuberculosis in cattle were Cyprus, Czechia, Denmark, Estonia, Finland, Latvia, Lithuania, Luxembourg, the Netherlands, Malta, Slovakia, Slovenia and Sweden (Table 49). The 13 other MS (Austria, Belgium, Croatia, France, Germany, Greece, Hungary, Ireland, Italy, Poland, Portugal, Romania and Spain) reported detection of bovine tuberculosis and the distribution of positive herds was heterogeneous and very spatially clustered, with herd prevalence ranging from < 0.1% (Belgium, Poland) to 4.7% (Ireland) at a national level and a regional‐level prevalence of 8.3% in the Castilla‐La Mancha region, Spain.
Officially bovine tuberculosis‐free (OTF) regions
In the OTF regions of the 20 MS with such regions, there were in total 1,031,829 cattle herds. Seven of these MS reported a total of 139 (0.013% overall) bovine tuberculosis‐infected herds (Table 49), indicating that the detection of bovine tuberculosis in OTF regions is a rare event. Four of these 20 MS reported infections with M. bovis (France, Hungary, Italy and Poland). Belgium reported infections with the M. tuberculosis complex, whereas Austria and Germany reported herds infected with M. caprae. From 2010 to 2020, the overall annual number (prevalence) of cattle herds reported infected in OTF regions decreased from 227 (0.016%) to 139 (0.013%), respectively (Figure 27). This was a relative decrease of 38.8% and 14.5% in the annual number and prevalence of positive cattle herds, respectively, for 2010–2020. Concomitantly, the total number of cattle herds decreased by 28.3% from 1,423,899 in 2010 to 1,031,829 in 2020. When comparing 2020 with 2019 data, the annual number of positive cattle herds decreased proportionally by 2.8%, with a prevalence value almost unchanged (0.013), whereas the total number of herds decreased by 2.6%.
Figure 27.

Proportion of cattle herds infected with bovine tuberculosis in OTF regions, EU, 2010–2020
- OTF: Officially bovine tuberculosis‐free in cattle.(*): Data reported by the United Kingdom in years 2016–2019 were included, when it was an EU Member State. Since 1 February 2020, the UK has become a third country.
Non‐officially bovine tuberculosis‐free (non‐OTF) regions
During 2020, the 10 non‐OTF MS had in total 713,431 cattle herds in their non‐OTF regions. Eight of these MS reported a total of 7,233 (1.01% overall) bovine tuberculosis‐positive herds (Table 49). Five of these non‐OTF MS (Ireland, Italy, Malta, Portugal and Spain) had their eradication programmes co‐financed by the EU. The number of positive herds out of all herds reported by these MS in non‐OTF regions was 5,187 (4.7%) in Ireland (4,380 in 2019), 266 (0.54%) in Italy (227 in 2019), 111 (0.35%) in Portugal (137 in 2019), 1,571 (1.5%) in Spain (1,875 in 2019) and 0 in Malta. Reports involved M. bovis, except for Portugal and Spain reporting M. tuberculosis complex‐positive herds. Three of the five non‐co‐financed non‐OTF MS (Table 49) reported a total of 98 bovine tuberculosis‐positive herds. All three MS (Croatia, Greece and Romania) reported infection with M. tuberculosis complex.
From 2010 to 2020, the overall annual number of reported positive cattle herds in non‐OTF regions decreased from 17,814 to 7,233 (Figure 28), and in parallel the prevalence decreased from 1.05% to 1.01%. This pattern corresponds to a proportional decrease of 59.4% and 3.2% in the annual number and prevalence of positive cattle herds, respectively, in 2010–2020. This decrease was attributable to the withdrawal of the United Kingdom from the EU in 2020. In fact, the annual prevalence of bovine tuberculosis‐positive herds in non‐OTF regions of the United Kingdom (i.e. Wales, England and Northern Ireland) was consistently greater than 10% between 2010 and 2019. Concomitantly, the total number of cattle herds in non‐OTF regions decreased by 56.5% from 1,638,694 in 2010 to 713,431 in 2020. When comparing 2020 with 2019 data, the annual number of positive cattle herds, the prevalence and the total number of cattle herds decreased by 55.6%, 43.8% and 21%, respectively. Exclusion of the United Kingdom 2019 data resulted in an increase in the annual number of positive cattle herds and prevalence of about 7% (from 6,746 to 7,233) and about 23% (from 0.8 to 1%), respectively, and the total number of cattle herds decreased by 12.8%.
Figure 28.

Proportion of cattle herds positive for bovine tuberculosis in non‐OTF regions, EU, 2010–2020
- OTF: Officially bovine tuberculosis‐free in cattle. (*): Data reported by the United Kingdom in years 2016–2019 were included, when it was an EU Member State. Since 1 February 2020, the UK has become a third country.
Figure 29 Display of trends in the reported prevalence of bovine tuberculosis test‐positive cattle herds during 2004–2020 in the non‐OTF regions of five non‐OTF co‐financed MS and of one non‐OTF non‐co‐financed MS (Greece). Greece, Ireland and Spain reported low prevalence rates of between 1.0% and 5% in recent years. Italy and Portugal reported very low (< 1%) prevalence rates
Figure 29.

Prevalence of bovine tuberculosis‐positive cattle herds in non‐OTF regions of four co‐financed non‐OTF MS and of one non‐co‐financed non‐OTF MS (Greece), 2004–2020
Non‐Member States and pre‐accession countries
Bovine tuberculosis was not detected in the non‐MS countries Iceland, Liechtenstein, Norway or Switzerland. The North Macedonia and Montenegro, which are pre‐accession countries, submitted national monitoring data on bovine tuberculosis for the fourth and fifth consecutive year, respectively. The former reported 25 M. tuberculosis complex‐positive herds out of 16,170 (0.15%) (0.15% in 2019), whereas Montenegro reported no positive herds (three M. bovis‐positive herds in 2019).
The United Kingdom reported 2,467 (10.7%) M. bovis‐positive herds out of 23,023 (10.51% in 2019) for Northern Ireland, 1,216 (10.5%) M. bovis‐positive herds out of 11.582 (11% in 2019) for Wales and 5,313 (10.72%) M. bovis‐positive herds out of 49,577 (11.7% in 2019) for England. Data for Scotland were not reported.
Mycobacterium monitoring data from food and from animals other than bovine animals, and complementary reporting from cattle
Complementary to their 2020 reports from cattle, MS also reported M. bovis in alpacas, badgers, cats, cattle, foxes, goats, pigs, sheep, wild boar, wild and farmed deer and some zoo animals. M. caprae was reported in cats by Croatia, in cattle by Croatia (slaughter animals), in red deer by Austria and Hungary and in wild boar by Hungary.
5.4. Discussion
In 2020, the reporting of human tuberculosis cases due to M. bovis and M. caprae decreased substantially compared with 2019. The main reasons for such a dramatic drop are likely related to the withdrawal of the United Kingdom from the EU and the impact of the COVID‐19 pandemic, although the notification of M. bovis and M. caprae cases have been continuously decreasing for several years. Tuberculosis cases due to M. bovis and M. caprae reported by the United Kingdom contributed considerably to the total number of cases reported in the EU in 2019 (35 cases; 23%). Also in previous years, the proportion of M. bovis and M. caprae notified by the United Kingdom had never been lower than 13% of the total number of cases reported in the EU. These numbers explain the less substantial relative decrease between the 2020 and 2019 notification rates of M. bovis and M. caprae (25.8% decrease) cases when not taking 2019 United Kingdom cases into account (i.e. at the EU‐27 level).
The relative decrease in the notification rates of M. bovis and M. caprae cases at the EU‐27 level provides a useful indication of the indirect impact of COVID‐19 pandemic on the reporting of M. bovis and M. caprae cases in the EU. It reveals that almost one in four cases may have gone under‐reported. Disruptions in laboratory activities and health care services limiting patient access to tuberculosis care, as well as reallocation of the health care workforce and other resources during the COVID‐19 pandemic may have contributed to the lower number of reported M. bovis and M. caprae cases in 2020. This also had an impact on the completeness of data on for the evaluation of treatment outcomes, with a substantial rise in the proportion of cases classified as ‘lost to follow‐up’. Among cases notified in 2019 (with outcomes reported in 2020, N = 105), 36.2% were reported as ‘lost to follow up’, compared with 25.7% of cases notified in 2018 (with outcomes reported in 2019, N = 140).
Key statistics from the 2020 data collected by ECDC confirm that tuberculosis due to M. bovis or M. caprae accounts for a small number of human tuberculosis cases in the EU owing to decades of disease control in cattle and routine pasteurisation of cows’ milk. Cases represented only a small proportion (0.3%) of all notified human tuberculosis cases in the 25 EU MS that reported information on the causative species. However, it cannot be excluded that zoonotic tuberculosis cases might be underestimated in humans in the EU, because the causative Mycobacterium species is not always reported. This may explain why the rate of notification of M. bovis and M. caprae in humans was similar for the non‐OTF EU MS and the OTF EU MS, despite the fact that the prevalence in cattle was almost 80‐fold higher in non‐OTF countries than in OTF‐countries. Another reason may be related to the slow evolution of the disease with cases detected and reported many years after a territory being declared OTF. Moreover, cattle may not be the only source of human tuberculosis caused by M. bovis or M. caprae.
In 2020, the overall proportion of cattle herds infected with or positive for bovine tuberculosis decreased to 0.4%. The absence of data from the United Kingdom for 2020 estimates of the prevalence and number of infected herds is the main reason behind the observed reduction. Bovine tuberculosis was reported by 13 MS and was heterogeneous and spatially clustered, with herd prevalence ranging from < 0.1% (Belgium, Poland) to 4.7% (Ireland) at a national level and a regional‐level prevalence of 8.3% in the Castilla‐La Mancha region, Spain. This result demonstrates that the situation of bovine tuberculosis infection, detection and control remains heterogeneous in Europe, as substantiated by EFSA (EFSA AHAW Panel, 2014).
Seventeen MS were OTF and three non‐OTF MS had OTF regions. Thirteen of these 20 MS reported no cases of bovine tuberculosis in cattle. In these OTF regions, the detection of bovine tuberculosis‐infected herds remained a rare event during 2020, as in previous years. From 2010 to 2020, the overall annual number of infected herds, the prevalence and the total number of cattle herds decreased.
All 10 non‐OTF MS, except Cyprus and Malta, detected bovine tuberculosis during 2020 in their non‐OTF regions and overall, about 1 in 100 herds were positive. When comparing 2020 with 2019 data, the overall annual number of positive cattle herds, the prevalence and the total number of cattle herds decreased in non‐OTF regions. However, upon excluding the United Kingdom 2019 data, the annual number of positive cattle herds and the prevalence increased.
When comparing 2010 with 2020 data, the overall annual number of positive cattle herds and prevalence decreased in these non‐OTF regions by, respectively, 59.39% and 3.8%. Concomitantly, the total number of cattle herds in non‐OTF regions was reduced to less than half (decreased by 56.4%). The calculation of the number of positive herds and prevalence is distorted by the non‐inclusion of United Kingdom 2020 data in EU statistics due to the withdrawal of the United Kingdom from the EU. In fact, the annual prevalence of bovine tuberculosis‐positive herds in non‐OTF regions of the United Kingdom (i.e. Wales, England and Northern Ireland) was consistently greater than 10% between 2010 and 2019. However, removing the United Kingdom 2019 data shows that the number of positive herds and prevalence in non‐OTF countries increased in the last year from 6,746 to 7,233 and from about 0.8% to about 1%, respectively. This increase in prevalence can partly be explained by the increase in test‐positive cattle herds being detected in these regions, along with a substantial decrease in the total number of cattle herds due to the gradual progression of OTF status in regions within non‐OTF MS over this period. This overall increase can be further explained by specific trends in a few non‐OTF MS during recent years. For many years, Ireland has faced the challenge of containing the spread of bovine tuberculosis in the Eurasian badger (Meles meles), a wildlife maintenance host of M. bovis. A badger vaccination policy was implemented in Ireland in 2018. Moreover, actions to reduce the badger population have been adopted along with other control measures. A summary presentation on the situation in Ireland can be found online. 21
Stagnating or increasing trends in the prevalence of bovine tuberculosis‐positive cattle herds demonstrate that the control and eradication of this disease remains a challenge, owing to the complex interactions between the pathogen, hosts and local environments (EFSA AHAW Panel, 2014). MS‐specific evaluations of status, trends and of the relevance of bovine tuberculosis as a source of disease for humans can be found in the 2020 Annual National Zoonoses Country Reports referenced in Section 5.5.
In 2020, M. bovis was reported to be isolated — apart from bovine animals — from a wide range of animal species, both domestic and wild, reflecting that this causative agent of tuberculosis in cattle has a broad host range. M. caprae, recognised to cause bovine tuberculosis, was reported in cattle, but also in red deer and wild boar.
5.5. Related project and internet sources
| Subject | For more information see | |
|---|---|---|
| Food/animals | EURL for Bovine Tuberculosis | https://www.visavet.es/bovinetuberculosis/databases.php |
| Summary presentations on the situation as regards bovine tuberculosis control and eradication programmes in MS | https://ec.europa.eu/food/horizontal‐topics/committees/paff‐committees/animal‐health‐and‐welfare/presentations_en#2020 | |
| General information on EU Food Chain Funding | https://ec.europa.eu/food/funding_en | |
| General information on National Veterinary Programmes in the EU and Task Force on monitoring animal disease eradication — Bovine tuberculosis subgroup reports | https://ec.europa.eu/food/funding/animal‐health/national‐veterinary‐programmes_en | |
| 2003/467/EC: Commission Decision of 23 June 2003 establishing the official tuberculosis, brucellosis and enzootic‐bovine‐leukosis‐free status of certain MS and regions of MS as regards bovine herds (text with EEA relevance) | https://www.efsa.europa.eu/en/efsajournal/pub/4959 | |
| Scientific Opinion of the EFSA Panel of Animal Health and Welfare (AHAW): Assessment of listing and categorisation of animal diseases within the framework of the Animal Health Law (Regulation (EU) No 2016/429): bovine tuberculosis | https://www.efsa.europa.eu/en/efsajournal/pub/4959 | |
| World Organisation for Animal Health, General Disease Information Sheet on Bovine Tuberculosis | http:/www.oie.int/fileadmin/Home/eng/Media_Center/docs/pdf/Disease_cards/BOVINE‐TB‐EN.pdf | |
| Annual national zoonoses country reports (reports of reporting countries on national trends and sources of zoonoses) | https://www.efsa.europa.eu/en/data‐report/biological‐hazards‐reports |
6. Brucella
Tables and figures that are not presented in this chapter are published as supporting information to this report and are available as downloadable files from the EFSA Knowledge Junction on Zenodo at https://doi.org/10.5281/zenodo.5682809.
Summary statistics of human surveillance data with downloadable files are retrievable using ECDC’s Surveillance Atlas of Infectious Diseases at http://atlas.ecdc.europa.eu/public/index.aspx

6.1. Key facts
-
•
In 2020, the number of confirmed cases of human brucellosis was 128 in the EU.
-
•
The EU notification rate of 0.03 per 100,000 population was the lowest notification rate reported since the beginning of surveillance in the European Union in 2007.
-
•
There was a decrease of 52.6% and 55.3% compared with the rate in 2019 (0.06 and 0.06 per 100,000 population) with and without the 2019 data from the United Kingdom, respectively.
-
•
From 2016 to 2020 there was a significantly declining trend of confirmed human cases of brucellosis in the EU.
-
•
Three MS (Greece, Italy and Portugal) had significantly decreasing 5‐year trends from 2016 to 2020.
-
•
Forty‐nine (38.3%) out of 128 human cases were reported with information on the Brucella species. This is an increase of 5.8% compared with the data in 2019 (36.2%). Brucella melitensis was reported as the aetiological agent in 43 (87.8%) out of 49 cases. This is a reduction of 7.2% compared with the data in 2019 (94.6%).
-
•
In 2020, one weak‐evidence foodborne brucellosis outbreak was reported in the European Union, due to Brucella melitensis in sheep meat and products thereof, affecting two persons from the same household, who contracted the infection abroad.
-
•
In cattle, the trend is favourable in 20 officially brucellosis‐free Member States and seven non‐officially brucellosis‐free Member States (Bulgaria, Croatia, Greece, Hungary, Italy, Portugal and Spain). Overall, in the officially brucellosis‐free regions of the European Union there were six infected herds in 2020 with an extreme low prevalence (< 0.001). In the non‐officially brucellosis‐free regions of the European Union, bovine brucellosis remained a rare event with 603 positive herds (0.38%) out of 157,000 tested herds, which was the lowest annual count since 2012. Data from Bulgaria were missing for 2020.
-
•
In sheep and goats, a stable situation was reported for 19 officially Brucella melitensis‐free Member States and eight non‐officially Brucella melitensis‐free Member States (Bulgaria, Croatia, France, Greece, Italy, Malta, Portugal and Spain). Overall in the non‐officially Brucella melitensis‐free regions of the European Union, 349 (0.22%) sheep and goat flocks were reported brucellosis‐positive out of 160,000 tested, which was the lowest count since 2012. However, data from Bulgaria were missing for 2020.
-
•
The eradication of brucellosis in cattle and in sheep and goats is close to being achieved in Croatia and Spain, with almost no positive herds reported for these infections in recent years.
-
•
Brucellosis in cattle, and in sheep and goats is still prevalent in Greece and in some regions of Italy and Portugal. In Italy and Portugal, the proportion of brucellosis‐positive cattle herds, and sheep and goat flocks in non‐officially free regions decreased in recent years.
-
•
Brucellosis is still an animal health concern with public health relevance in southern European countries that are not officially free of brucellosis.
6.2. Surveillance and monitoring of Brucella in the European Union
6.2.1. Humans
Notification of brucellosis in humans is mandatory in 25 Member States (MS), as well as in Iceland, Norway and Switzerland. Belgium, has another (unspecified) system. Denmark has no surveillance system in place for brucellosis, and the disease is not notifiable or reported at the EU level. The surveillance systems for brucellosis in all MS cover the whole population in all reported cases. In 2020, Spain did not receive data from all regions due to COVID‐19, so the case numbers may not be complete. All countries reported case‐based data except Belgium and Bulgaria, which reported aggregated data. Both reporting formats were included to calculate numbers of cases and notification rates.
Since 1 February 2020, the United Kingdom has become a third country, whereas before it was an EU MS. In 2020, human data from the United Kingdom were not collected by ECDC.
6.2.2. Food and animals
Monitoring data for Brucella from bovine animals, and sheep and goats, originating from the National Control and Eradication Programmes and/or from countries or regions with officially free status.
According to the Zoonoses Directive 2003/99/EC, MS must report annual monitoring data for bovine brucellosis, and sheep and goat brucellosis. These data originate from national control and surveillance programmes implemented by the MS in accordance with EU legislation. The reports submitted by the MS are based on Council Directive 64/432/EEC and subsequent legislation, and are essential for the assessment of the epidemiological situation in MS and MS regions, whether declared officially brucellosis free in cattle (OBF) and/or officially B. melitensis free in sheep and goats (ObmF). Annual surveillance programmes are carried out in OBF regions to confirm the absence of infection in cattle and sheep and goats, respectively. In all non‐OBF and non‐ObmF regions, control and eradication programmes for brucellosis in cattle and in sheep and goats are in place. These data are comparable across MS because the monitoring schemes are harmonised, and the data collected and reported to the European Food Safety Authority (EFSA) originate from the census‐as‐sampling framework or a randomised design. In addition to carrying out trend analyses both at EU and MS level, trend watching and producing descriptive summaries, these data may also be used to assess the impact of control and eradication programmes (Table 1).
The EU MS also need to notify outbreaks of bovine brucellosis and caprine and ovine brucellosis (excluding Brucella ovis) in terrestrial animals in their OBF and/or ObmF regions to the EU ADNS,21 and regular summaries are posted online.
Monitoring data for Brucella from food and animals other than bovine animals, and sheep and goats.
Monitoring data for Brucella from food and animals other than bovine animals and sheep and goats, submitted to EFSA in accordance with the Zoonoses Directive 2003/99/EC, but collected without a harmonised design allow for descriptive summaries to be compiled at EU level. They preclude trend analyses and trend watching at the EU level (Table 1).
Food, animal and foodborne outbreak data from the United Kingdom were still collected by EFSA for 2020 under the Zoonoses Directive 2003/99/EC but are excluded from EU statistics, due to the withdrawal of the United Kingdom since 1 February 2020.
6.2.3. foodborne outbreaks of brucellosis
The reporting of foodborne brucellosis outbreaks in humans is mandatory according to the Zoonoses Directive 2003/99/EC.
6.3. Results
6.3.1. Overview of key statistics, EU, 2016–2020
Table 50 displays statistics at EU level of human and animal brucellosis, along with the detection of Brucella in food, between 2016 and 2020. The results are described in detail in the chapter’s following sections.
Table 50.
Summary of Brucella statistics related to humans, major food categories and animal species, EU, 2016–2020
| 2020 | 2019 a | 2018 a | 2017 a | 2016 a | Data source | |
|---|---|---|---|---|---|---|
| Humans | ||||||
| Total number of confirmed cases | 128 | 310 | 332 | 378 | 530 | ECDC |
| Total number of confirmed cases/100,000 population (notification rates) | 0.03 | 0.06 | 0.08 | 0.09 | 0.11 | ECDC |
| Number of reporting MS | 26 | 27 | 26 | 26 | 27 | ECDC |
| Infection acquired in the EU | 63 | 126 | 133 | 148 | 180 | ECDC |
| Infection acquired outside the EU | 14 | 50 | 44 | 46 | 39 | ECDC |
| Unknown travel status or unknown country of infection | 51 | 134 | 155 | 184 | 311 | ECDC |
| Number of outbreak‐related cases | 2 | 2 | 0 | 2 | 0 | EFSA |
| Total number of outbreaks | 1 | 1 | 0 | 1 | 0 | EFSA |
| Food | ||||||
| Milk and milk products | ||||||
| Number of sampling units | 275 | 586 | 1,009 | 1,333 | 349 | EFSA |
| Number of reporting MS | 3 | 2 | 3 | 2 | 2 | EFSA |
| Animals | ||||||
| Bovine animals | ||||||
| Number of positive herds in OBF regions | 6 | 4 | 3 | 0 | 2 | EFSA |
| Number of reporting OBF MS | 20 | 20 | 20 | 20 | 19 | EFSA |
| Number of positive herds in non‐OBF regions | 603 | 485 | 563 | 648 | 808 | EFSA |
| Number of reporting non‐OBF MS | 6 b | 8 | 8 | 8 | 9 | EFSA |
| Sheep and goats | ||||||
| Number of positive flocks in ObmF regions | 3 | 1 | 0 | 7 | 2 | EFSA |
| Number of reporting ObmF MS | 19 | 20 | 20 | 20 | 20 | EFSA |
| Number of positive flocks in non‐ObmF regions | 349 | 451 | 620 | 815 | 870 | EFSA |
| Number of reporting non‐ObmF MS | 7 b | 8 | 8 | 8 | 8 | EFSA |
ECDC: European Centre for Disease Prevention and Control; EFSA: European Food Safety Authority; MS: Member States.
OBF/ObmF: Officially brucellosis free in cattle/Officially B. melitensis free in sheep and goats.
Data reported by the United Kingdom, then an MS, for 2016–2019 were included. Since 1 February 2020, the United Kingdom is a third country.
No data were reported by Bulgaria.
6.3.2. Human brucellosis
In 2020, 128 confirmed cases were reported in the EU, which was a sharp decrease compared with 2019. The notification rate was 0.03 cases per 100,000 population, which represented a 52.6% and 55.3% decrease compared to 2019 (0.06 and 0.06 per 100,000 population) with and without the data from the United Kingdom, respectively. These findings show that the exclusion of the United Kingdom (no 2020 data reported due to the withdrawal of the United Kingdom from the EU) did not greatly influence the epidemiological scenario in the EU, but the decrease was mainly due to the COVID‐19 pandemic.
Twenty‐six MS provided data and information on brucellosis in humans (Table 51). Eleven MS (Cyprus, Czechia, Estonia, Finland, Hungary, Ireland, Lithuania, Luxembourg, Malta, Poland and Romania) and Iceland reported no human cases (Table 51). Four MS (France, Germany, Greece and Italy) notified the vast majority of cases with 82 out of 128 cases (64.1%), while the highest notification rate of brucellosis was reported in Greece (0.24 per 100,000 population). Most cases in Austria, France, Germany and Sweden were associated with travel (62.5%, 73.7%, 47.4% and 85.7%, respectively). Conversely, in Greece, only 7.7% of cases were associated with travel, and in Spain, all the cases were reported as domestic. Sixty‐three (49.2%) out of 128 human cases were associated with infections acquired in the EU. Fourteen (10.9%) out of 128 human cases were acquired outside the EU. Fifty‐one (39.8%) out of 128 human cases were of unknown origin (Table 50).
Table 51.
Reported human cases of brucellosis and notification rates per 100,000 population in EU MS and non‐MS countries, by country and year, 2016–2020
| Country | 2020 | 2019 | 2018 | 2017 | 2016 | ||||||||
|---|---|---|---|---|---|---|---|---|---|---|---|---|---|
| Status a | National coverage b | Data format b | Confirmed cases and rates | Confirmed cases and rates | Confirmed cases and rates | Confirmed cases and rates | Confirmed cases and rates | ||||||
| Cases | Rate | Cases | Rate | Cases | Rate | Cases | Rate | Cases | Rate | ||||
| Austria | (OBF/ObmF) | Y | C | 8 | 0.09 | 6 | 0.07 | 7 | 0.08 | 6 | 0.07 | 4 | 0.05 |
| Belgium | (OBF/ObmF) | Y | A | 4 | 0.03 | 3 | 0.03 | 9 | 0.08 | 8 | 0.07 | 4 | 0.04 |
| Bulgaria | Y | A | 1 | 0.01 | 0 | 0 | 1 | 0.01 | 2 | 0.03 | 0 | 0 | |
| Croatia | Y | C | 1 | 0.02 | 3 | 0.07 | 3 | 0.07 | 1 | 0.02 | 2 | 0.05 | |
| Cyprus | (OBF/ObmF) | Y | C | 0 | 0 | 0 | 0 | 0 | 0 | 0 | 0 | 0 | 0 |
| Czechia | (OBF/ObmF) | Y | C | 0 | 0 | 4 | 0.04 | 4 | 0.04 | 1 | 0.01 | 1 | 0.01 |
| Denmark | (OBF/ObmF) | – | – | – | – | – | – | – | – | – | – | – | – |
| Estonia | (OBF/ObmF) | Y | C | 0 | 0 | 1 | 0.08 | 1 | 0.08 | 0 | 0 | 0 | 0 |
| Finland | (OBF/ObmF) | Y | C | 0 | 0 | 0 | 0 | 0 | 0 | 1 | 0.02 | 0 | 0 |
| France | (OBF) | Y | C | 19 | 0.03 | 34 | 0.05 | 0 | 0 | 21 | 0.03 | 19 | 0.03 |
| Germany | (OBF/ObmF) | Y | C | 19 | 0.02 | 37 | 0.04 | 37 | 0.04 | 41 | – | 36 | – |
| Greece | Y | C | 26 | 0.24 | 65 | 0.61 | 97 | 0.90 | 94 | 0.87 | 119 | 1.1 | |
| Hungary | (ObmF) | Y | C | 0 | 0 | 0 | 0 | 0 | 0 | 0 | 0 | 0 | 0 |
| Ireland | (OBF/ObmF) | Y | C | 0 | 0 | 0 | 0 | 0 | 0 | 2 | 0.04 | 2 | 0.04 |
| Italy | Y | C | 18 | 0.03 | 49 | 0.08 | 94 | 0.16 | 99 | 0.16 | 211 | 0.35 | |
| Latvia | (OBF/ObmF) | Y | C | 1 | 0.05 | 0 | 0 | 0 | 0 | 0 | 0 | 0 | 0 |
| Lithuania | (OBF/ObmF) | Y | C | 0 | 0 | 0 | 0 | 0 | 0 | 0 | 0 | 0 | 0 |
| Luxembourg | (OBF/ObmF) | Y | C | 0 | 0 | 0 | 0 | 0 | 0 | 0 | 0 | 1 | 0.17 |
| Malta | (OBF) | Y | C | 0 | 0 | 0 | 0 | 0 | 0 | 0 | 0 | 0 | 0 |
| Netherlands | (OBF/ObmF) | Y | C | 2 | 0.01 | 7 | 0.04 | 5 | 0.03 | 2 | 0.01 | 5 | 0.03 |
| Poland | (OBF/ObmF) | Y | C | 0 | 0 | 2 | 0.01 | 0 | 0 | 2 | 0.01 | 3 | 0.01 |
| Portugal | Y | C | 9 | 0.09 | 33 | 0.32 | 19 | 0.18 | 16 | 0.16 | 50 | 0.48 | |
| Romania | (OBF/ObmF) | Y | C | 0 | 0 | 1 | 0.01 | 1 | 0.01 | 3 | 0.02 | 1 | 0.01 |
| Slovakia | (OBF/ObmF) | Y | C | 2 | 0.04 | 1 | 0.02 | 0 | 0 | 1 | 0.02 | 1 | 0.02 |
| Slovenia | (OBF/ObmF) | Y | C | 1 | 0.05 | 6 | 0.29 | 3 | 0.15 | 1 | 0.05 | 1 | 0.05 |
| Spain c | Y | C | 10 | – | 20 | 0.04 | 40 | 0.09 | 63 | 0.14 | 37 | 0.08 | |
| Sweden | (OBF/ObmF) | Y | C | 7 | 0.07 | 14 | 0.14 | 11 | 0.11 | 14 | 0.14 | 19 | 0.19 |
| EU Total 27 | – | – | 128 | 0.03 | 286 | 0.06 | 332 | 0.08 | 378 | 0.09 | 516 | 0.12 | |
| United Kingdom | (OBF/ObmF) | – | – | – | – | 24 | 0.04 | – | – | – | – | 14 | 0.02 |
| EU Total d | – | – | 128 | 0.03 | 310 | 0.06 | 332 | 0.08 | 378 | 0.09 | 530 | 0.11 | |
| Iceland | (OBF/ObmF) | Y | C | 0 | 0 | 0 | 0 | 0 | 0 | 0 | 0 | 0 | 0 |
| Norway | (OBF/ObmF) | Y | C | 2 | 0.04 | 4 | 0.08 | 3 | 0.06 | 3 | 0.06 | 4 | 0.08 |
| Switzerland e | (OBF/ObmF) | Y | C | 3 | 0.03 | 7 | 0.08 | 5 | 0.06 | 9 | 0.11 | 7 | 0.08 |
–: Data not reported.
: OBF/ObmF: Officially brucellosis free in cattle/Officially B. melitensis free in sheep and goats.
: Y: yes; N: no; A: aggregated data; C: case‐based data.
Data not complete in 2020, rate not estimated.
Cases reported from the United Kingdom in 2016–2019 were also considered for this estimation (EU‐28). When 2016–2019 United Kingdom data were collected, the United Kingdom was an EU MS, but since 1 February 2020, it has become a third country.
: Switzerland provided data directly to EFSA. The human data for Switzerland include data from Liechtenstein.
A clear seasonality was observed in the number of confirmed brucellosis cases in the EU, with more cases reported from April to August. There was a significantly (p < 0.01) declining EU trend from 2016 to 2020 (Figure 30). Three MS (Greece, Italy and Portugal) reported decreasing trends between 2016 and 2020.
Figure 30.

- Source: Austria, Cyprus, Czechia, Germany, Estonia, Greece, Finland, France, Hungary, Ireland, Italy, Latvia, Lithuania, Malta, Netherlands, Poland, Portugal, Romania, Sweden, Slovenia, Slovakia.
Eight MS provided information on hospitalisation. Fifty‐six (43.8%) out of 128 human cases were reported with information on hospitalisation. Among these, 36 (64.3%) were hospitalised while 20 (35.7%) patients were not hospitalised. This is a decrease of 9.4% compared with the data in 2019 (71.0%). Nine MS provided information on the outcome of the disease. Fifty‐five (43.0%) out of the 128 cases of human brucellosis were reported with information on the outcome of the disease. Two fatalities out of 55 cases were notified, which corresponds to a case fatality rate of 3.6%.
Eleven MS reported information on Brucella species for the human cases. Forty‐nine (38.3%) out of 128 human cases were reported with information on the Brucella species. B. melitensis was reported as the aetiological agent in 43 cases (87.8%), while B. abortus was reported as the aetiological agent in three cases (6.1%), B. suis in two cases (4.1%) and other Brucella species were reported in one case (0.8%).
The percentage of B. melitensis infections was 7.2% less compared with the data in 2019 (94.6%). Only fourteen (38.9%) out of 36 hospitalised cases were reported with information on the Brucella species. B. melitensis was reported as the aetiological agent in all 14 hospitalised cases.
Sixteen (12.5%) human cases occurred in patients younger than 25 years old, 78 (60.9%) in patients between 25 and 64 years of age and 34 (26.6%) in patients older than 64 years old.
The number of confirmed domestically acquired brucellosis cases in human (patient not having been outside the country of notification during the incubation period of the disease) brucellosis cases is overlaid with the national prevalence of Brucella‐positive cattle herds and sheep and goat flocks in the EU in 2020 in Figure 31. Greece, Italy and Portugal have the highest number of confirmed domestically acquired brucellosis cases in humans and the highest prevalence of Brucella‐positive ruminant herds. Italy, which has reported a high number of human brucellosis cases over the years, did not report the origin of infection for 2020.
Figure 31.

- Note: A total of 30 brucellosis cases notified in 2020 to ECDC and reported by Italy (18), Belgium (4), Germany (3), Austria (2), Bulgaria (1), Croatia (1) and Sweden (1) are not represented on the map because the origin of infection (i.e. imported or domestically acquired) was unknown.
Human brucellosis cases associated with foodborne outbreaks
In 2020, Austria reported one weak‐evidence foodborne outbreak due to Brucella melitensis in sheep meat and products thereof, affecting two persons from the same household, who contracted the infection abroad. Both were hospitalised. From 2005 to 2019, 17 brucellosis foodborne outbreaks were reported overall, four of which had strong evidence of being linked to cheese, one had strong evidence of being linked to raw milk, and 12 had weak evidence of being linked to ‘unknown’ food. Further details and statistics on the foodborne outbreaks are presented in the foodborne outbreaks chapter.
6.3.3. Brucella in food
Very few monitoring data for Brucella were submitted in 2020, as was the case in previous years. In total, 249 samples of ‘milk’, ‘cheese’ and ‘other dairy products’ were collected from processing plants by two MS (Italy and Portugal). One Italian milk sample tested positive for an unspecified Brucella species. At retail level, none of the nine samples of ‘cheese’ and ‘other dairy products’ collected by Italy and Spain were positive for Brucella.
6.3.4. Brucella in animals
Monitoring data for Brucella from bovine animals, and sheep and goats, originating from the National Control and Eradication Programmes and/or from countries or regions with officially free status
Cattle
The status of countries for brucellosis in cattle, as stated on 31 December 2020, remained stable, with 20 OBF MS in 2020 (Figure 32). Out of the seven non‐OBF MS, three had OBF regions:
-
•
Italy: 11 regions and four provinces,
-
•
Portugal: three regions (part of Azores, Algarve, part of Centro),
-
•
Spain: 13 autonomous communities and eight provinces.
Figure 32.
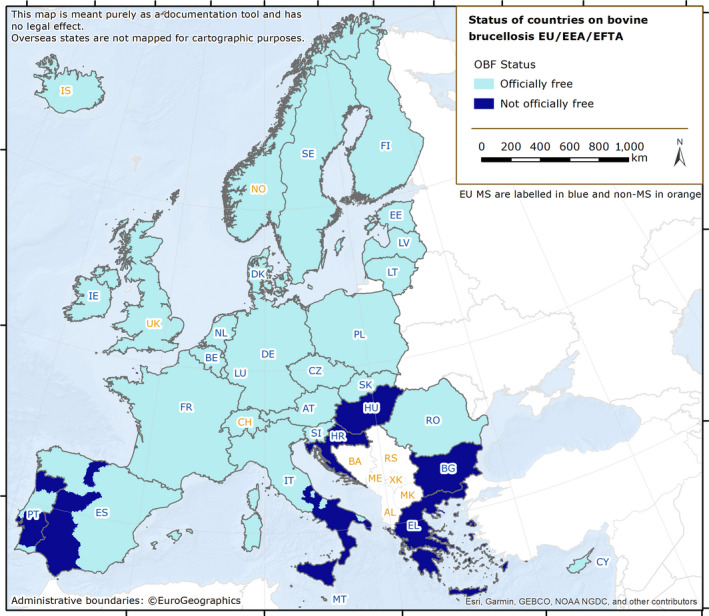
Status of countries for bovine brucellosis, MS and non‐MS, 2020
Four non‐OBF MS had no OBF region, namely Bulgaria, Croatia, Greece and Hungary. Bulgaria did not provide valid data for bovine brucellosis to EFSA for 2020.
Liechtenstein, Norway and Switzerland were OBF in accordance with EU legislation. Iceland, which has no special agreement on animal health (status) with the EU, has never reported any brucellosis cases caused by B. abortus, B. melitensis or B. suis (Figure 32).
In 2020, the overall proportion of cattle herds infected with, or positive for, bovine brucellosis in the EU remained very low (0.04%; 609 out of 1,736,686 herds). Twenty‐two MS reported no cases of brucellosis in cattle. Greece, Italy, Portugal and Spain reported infected or positive herds, whereas Bulgaria did not report any data.
Regions OBF in cattle
In OBF regions (23 MS have such regions), the overall prevalence rate was extremely low (< 0.001) (Table 52). Only six infected cattle herds were reported in these OBF regions of the EU (four in 2019), with Italy reporting five positive herds and Spain one. In 2020, bovine brucellosis was not detected in the non‐MS countries of Iceland, Liechtenstein, Norway and Switzerland, which were OBF. The United Kingdom, where England, Scotland, Wales, Northern Ireland and the Isle of Man are OBF whereas the Channel Islands (Jersey and Guernsey) are non‐OBF, reported no positive herds, but the United Kingdom did not report data for all its regions.
Table 52.
Status of countries for bovine brucellosis and related prevalence, EU, 2020
| Member State (MS) | Officially brucellosis free in cattle | N of infected herds in OBF regions | Prevalence (%) of infected herds in OBF regions | N of positive herds in non‐OBF regions | Prevalence (%) of positive herds in non‐OBF regions |
|---|---|---|---|---|---|
| Austria | OBF | 0 | 0 | – | – |
| Belgium | OBF | 0 | 0 | – | – |
| Bulgaria | / | / | / | / | |
| Croatia | – | – | 0 | 0 | |
| Cyprus | OBF | 0 | 0 | – | – |
| Czechia | OBF | 0 | 0 | – | – |
| Denmark | OBF | 0 | 0 | – | – |
| Estonia | OBF | 0 | 0 | – | – |
| Finland | OBF | 0 | 0 | – | – |
| France | OBF | 0 | 0 | – | – |
| Germany | OBF | 0 | 0 | – | – |
| Greece | – | – | 72 | 0.40 | |
| Hungary | – | – | 0 | 0 | |
| Ireland | OBF | 0 | 0 | – | – |
| Italy | 5 | < 0.01 | 504 a | 1.4 | |
| Latvia | OBF | 0 | 0 | – | – |
| Lithuania | OBF | 0 | 0 | – | – |
| Luxembourg | OBF | 0 | 0 | – | – |
| Malta | OBF | 0 | 0 | – | – |
| Netherlands | OBF | 0 | 0 | – | – |
| Poland | OBF | 0 | 0 | – | – |
| Portugal | 0 | 0 | 27 | 0.10 | |
| Romania | OBF | 0 | 0 | – | – |
| Slovakia | OBF | 0 | 0 | – | – |
| Slovenia | OBF | 0 | 0 | – | – |
| Spain | 1 | < 0.01 | 0 | 0 | |
| Sweden | OBF | 0 | 0 | – | – |
| EU Total | 6 | < 0.001 | 603 | 0.38 |
–: not applicable (no such regions).
/: no data reported.
OBF: Officially brucellosis free in cattle.
Including 110 water buffalo herds.
 All regions of the MS are OBF.
Not all regions of the MS are OBF.
No region of the MS is OBF.
Regions not OBF in cattle
In 2020, bovine brucellosis remained a rare event in the non‐OBF regions of the seven non‐OBF MS, with 603 positive herds (0.38%) out of 157,000 tested herds (Table 52), compared to 485 (0.17%) positive herds in 2019. However, it should be mentioned that Bulgaria did not report any data to EFSA. The eradication programmes of three of these non‐OBF MS (Italy, Portugal and Spain) were co‐financed by the EU. The number of positive herds out of all herds reported by these MS in non‐OBF regions was 504 in Italy (361 in 2019) and 27 in Portugal (38 in 2019). Out of the four non‐co‐financed, non‐OBF MS, only Greece reported 72 positive herds (85 in 2019). No speciation of Brucella was reported.
In conclusion, in 2020, bovine brucellosis was mainly reported by the southern Europe MS of Italy, Portugal and Greece.
Comparing data for 2012 and 2020, the overall annual number of reported positive cattle herds in non‐OBF regions decreased by 48.9%, from 1,181 to 603, whereas the prevalence of infected cattle herds increased by 280%, from 0.10% to 0.38% (Figure 33). The latter is due to the reduction of non‐OBF territories and the consequent drop in the total number of cattle herds from 1,162,978 to 157,000 during the same period, representing a decrease of 86.5%.
Figure 33.

- OBF: Officially brucellosis free in cattle. (*): From 2016 to 2019, the data included data reported by the United Kingdom, then an EU MS. Since 1 February 2020, the United Kingdom is a third country.
When comparing 2020 with 2019 data, the annual number of positive cattle herds and the prevalence of infected cattle herds increased by 24.3% and 131%, respectively.
Spain reported for the last 4 years (2017, 2018, 2019 and 2020), respectively, twenty‐one, three, zero and zero positive herds. An extreme low level of prevalence and absence of infection was also the case for Croatia, which reported for those years, zero, one, one and zero positive herds, respectively.
Figure 34 displays trends between 2004 and 2020 in the reported prevalence of brucellosis‐positive cattle herds in non‐OBF regions in two co‐financed, non‐OBF MS (Italy and Portugal) and one non‐co‐financed, non‐OBF MS (Greece). The prevalence in Greece showed a huge variation across the years from a minimum of 2% in 2008 to a maximum of 12% in 2012. The prevalence in Italy remains under 2% since 2012, with a minimum value of 1.3% in 2019. The prevalence in Portugal consistently decreased from about 2% to 0.11% in 2020.
Figure 34.

Prevalence of Brucella‐positive cattle herds, in non‐OBF regions of two co‐financed, non‐OBF MS and one non‐co‐financed, non‐OBF MS (Greece), 2005–2020
Non‐MS and pre‐accession countries
Bovine brucellosis was not detected in 2020 in the following five non‐MS countries of Iceland, Liechtenstein, Norway, Switzerland and the United Kingdom. Bosnia and Herzegovina, Montenegro, the North Macedonia and Serbia submitted national monitoring data on bovine brucellosis. Bosnia and Herzegovina, North Macedonia and Serbia reported 111 positive animals out of 114,273 (0.10%), 22 positive herds out of 16,170 (0.14%) and 23 positive animals out of 507,837 (0.005%), respectively, while Montenegro did not report any positive herds in the last 5 years, out of the 18,236 cattle herds present in the country.
Sheep and goats
The status of countries for ovine and caprine brucellosis by B. melitensis, reflecting the situation on 31 December 2020, is presented in Figure 35 and in Table 53. Nineteen MS were ObmF in 2020. Out of the eight non‐ObmF MS, four had ObmF regions:
-
•
France: all but one of the metropolitan departments in France (due to Rev.1 vaccination against Brucella ovis),
-
•
Italy: 13 regions and four provinces,
-
•
Portugal: one region (Azores),
-
•
Spain: 16 autonomous communities and three provinces.
Figure 35.

Status of countries for ovine and caprine brucellosis, MS and non‐MS, 2020
Table 53.
Status of countries for ovine and caprine brucellosis and related prevalence, EU, 2020
| Member State | Officially brucellosis free in sheep and goats | N infected flocks in ObmF regions | Prevalence (%) of infected flocks in ObmF regions | N of positive flocks in non‐ObmF regions | Prevalence (%) of positive flocks in non‐ObmF regions |
|---|---|---|---|---|---|
| Austria | ObmF | 0 | 0 | – | – |
| Belgium | ObmF | 0 | 0 | – | – |
| Bulgaria | / | / | / | / | |
| Croatia | – | – | 0 | 0 | |
| Cyprus | ObmF | 0 | 0 | – | – |
| Czechia | ObmF | 0 | 0 | – | – |
| Denmark | ObmF | 0 | 0 | – | – |
| Estonia | ObmF | 0 | 0 | – | – |
| Finland | ObmF | 0 | 0 | – | – |
| France | 0 | 0 | 0 | 0 | |
| Germany | ObmF | 0 | 0 | – | – |
| Greece | – | – | 33 | 0.14 | |
| Hungary | ObmF | 0 | 0 | – | – |
| Ireland | ObmF | 0 | 0 | – | – |
| Italy | 3 | < 0.01 | 120 | 0.34 | |
| Latvia | ObmF | 0 | 0 | – | – |
| Lithuania | ObmF | 0 | 0 | – | – |
| Luxembourg | ObmF | 0 | 0 | – | – |
| Malta | – | – | 0 | 0 | |
| Netherlands | ObmF | 0 | 0 | – | – |
| Poland | ObmF | 0 | 0 | – | – |
| Portugal | 0 | 0 | 196 | 0.38 | |
| Romania | ObmF | 0 | 0 | – | – |
| Slovakia | ObmF | 0 | 0 | – | – |
| Slovenia | ObmF | 0 | 0 | – | – |
| Spain | 0 | 0 | 0 | 0 | |
| Sweden | ObmF | 0 | 0 | – | – |
| EU Total | 3 | < 0.001 | 349 | 0.22 |
/: no data not reported.
–: not applicable (no such regions).
ObmF: Officially B. melitensis free in sheep and goats.
 All regions of the MS are ObmF.
Not all regions of the MS are ObmF.
No region of the MS is ObmF.
In France, no cases of brucellosis have been reported in small ruminants since 2003.
Four non‐ObmF MS had no ObmF regions, namely Bulgaria, Croatia, Greece and Malta. Bulgaria did not submit any valid data for ovine and caprine brucellosis to EFSA for 2020.
Liechtenstein, Norway, Switzerland and the United Kingdom were ObmF in accordance with EU legislation. Iceland, which has no special agreement on animal health (status) with the EU, has never reported brucellosis caused by B. abortus, B. melitensis or B. suis. Montenegro, North Macedonia and Serbia also reported data on brucellosis in their sheep and goat flocks.
Twenty‐three MS reported no cases of B. melitensis brucellosis in sheep and goat flocks. The overall proportion of sheep and goat flocks infected with, or positive for B. melitensis in the EU remained very low (0.04%; 352 flocks out of 994,853). Infected or positive flocks were reported by Greece, Italy and Portugal, whereas Bulgaria did not report any data.
Regions ObmF in sheep and goats
Nineteen MS were ObmF in 2020. In the ObmF regions of the 22 MS with such regions, the overall prevalence rate was extremely low, with 21 MS reporting no cases of B. melitensis and only Italy reporting three positive flocks, resulting in an overall prevalence in the ObmF regions of 0.0004%. In 2019 one infected flock was reported in ObmF regions, also by Italy. B. melitensis was not reported in 2020 by the ObmF non‐MS Iceland, Liechtenstein, Norway, Switzerland and the United Kingdom. The United Kingdom did not report data for all its regions.
Regions not ObmF in sheep and goats
In 2020, the eight non‐ObmF MS had a total of 160,000 sheep and goat flocks in their non‐ObmF regions, and 349 (0.22%) of these were reported to be brucellosis‐positive (0.21% in 2019) (Table 53). The eradication programmes of five of these non‐ObmF MS (Croatia, Greece, 22 Italy, Portugal and Spain) were co‐financed by the EU. The number of infected flocks reported by these MS was zero in Croatia (four in 2019), 33 in Greece (37 in 2019), 120 in Italy (206 in 2019), 196 in Portugal (203 in 2019) and zero in Spain (one in 2019). The overall number of infected flocks has to be interpreted differently between countries, as the proportion of tested flocks is highly variable between MS: 7% in Greece, 22.3% in Spain, 83.3% in Croatia, 94.8% in Italy and 95.7% in Portugal. These proportions remained quite stable in 2020 compared to previous years. With regard to non‐co‐financed, non‐ObmF MS, France and Malta reported zero positive cases, and Bulgaria did not report data to EFSA in 2020.
From 2012 to 2020, the overall annual number of reported positive sheep and goat flocks in the non‐ObmF regions decreased by 79.4%, from 1,693 to 349, whereas the prevalence of positive flocks decreased by 51.3%, from 0.45% to 0.22% (Figure 36). The total number of sheep and goat flocks decreased by 57.7%, from 377,690 to 159,887 during the same period.
Figure 36.

- ObmF: Officially Brucella melitensis free in sheep and goats. (*): From 2016 to 2019, the data included data reported by the United Kingdom, then an EU MS. Since 1 February 2020, the United Kingdom is a third country.
When comparing 2020 with 2019 data, the annual number of brucellosis‐positive sheep and goat flocks decreased by 22.6% whereas the prevalence of positive flocks increased by 5%.
Croatia and Spain, with co‐financed eradication programmes, reported a very low prevalence (0.1–1%) to a rare detection rate (< 0.1%), and decreasing in both countries. For the last 5 years, namely 2016, 2017, 2018, 2019 and 2020, respectively, Croatia reported eight, five, nine, four, zero, and Spain reported 49, 18, three, one, zero B. melitensis‐positive herds, indicating that in the coming years, eradication of sheep and goats brucellosis in Croatia and in Spain is an achievable goal.
Figure 37 displays trends from 2004 to 2020 in the reported prevalence of brucellosis‐positive sheep and goat flocks in non‐ObmF regions in three co‐financed, non‐ObmF MS. It is noteworthy that, in 2016, 2017 and 2019, only vaccination was co‐financed in Greece. Also, for Greece, the monitoring data reported for brucellosis in sheep and goats were exclusively from the eradication programme in place only in the Greek islands. The prevalence in Greece showed a large variation across years from a minimum of 0.4% in 2015 to a maximum of 8.6% in 2012. This may be related to the low proportion of tested flocks (7% in 2018, 2019 and 2020), which leads to a lack of precision in estimated parameters. Italy and Portugal reported a low (> 1–10%) to very low (0.1–1%) prevalence during this period, decreasing for both MS.
Figure 37.

Prevalence of brucellosis‐positive sheep and goat flocks, in non‐ObmF regions in five co‐financed, non‐ObmF MS, 2004–2020
Non‐MS and pre‐accession countries
Brucellosis was not detected in sheep and goat flocks in 2020 in the following non‐MS countries: Iceland, Liechtenstein, Norway, Switzerland and the United Kingdom. The United Kingdom did not report data for all its regions. Montenegro, North Macedonia and Serbia submitted national monitoring data on ovine and caprine brucellosis. North Macedonia and Serbia reported 58 positives out of 6,279 flocks (0.92%) and six positives out of 1,405,999 animals (< 0.001%), respectively, whereas Montenegro has not reported any positive flocks in the last 3 years, out of 6,988 sheep and goat flocks present in the country in 2020.
Monitoring data for Brucella from food and animals other than bovine animals and sheep and goats
Complementary to 2020 reports on Brucella from cattle and from sheep and goats, Brucella species were reported from a wide range of animal species: Brucella canis was reported in dogs in five MS (Finland, France, Italy, the Netherlands and Romania); Brucella microti was isolated from ‘farmed’ frogs in France; Brucella suis biovar 2 or unspecified Brucella species were reported in dogs, pigs, wild boars and wild hares, in six MS (Croatia, France, Italy, Slovakia, Spain and Romania); Brucella melitensis was isolated from Alpine Ibex in France; unspecified Brucella species were found in wild bears, wild deer and wild boars, as well as Brucella ceti in dolphins in Italy.
6.4. Discussion
The notification rate of brucellosis in humans and the number of reported confirmed cases of human brucellosis have been declining for several years, and in 2020, this decline is even more pronounced. The 5‐year EU trend from 2016 to 2020 was significantly declining. This could be the effect of the concurrent COVID‐19 pandemic and the decline of animal brucellosis. More evidence‐based data should be acquired to provide insights into the true efficacy of the eradication plans in animals on the incidence of brucellosis in humans. However, during the COVID‐19 pandemic, international travel was considerably reduced and, therefore, the risk for human beings of becoming infected in endemic areas traditionally suited to tourism is likely to have been much smaller. During the pandemic, the healthcare system also shifted from normal activities to the management of the pandemic, with fewer resources (doctors, laboratory testing) allocated for the detection of diseases other than COVID, fewer visits to healthcare services, and reduced reporting activities due to the reallocation of resources. In 2020, the highest notification rates and most domestic brucellosis cases were reported in Greece, Portugal and Spain, countries that are not OBF in cattle, and not ObmF in sheep and goats. It is noteworthy, however, that the notification rate was not particularly high in Portugal and Spain. Italy, which also reported several human cases and which is not OBF/ObmF, did not provide information on the origin of infection. Nevertheless, it is possible to infer a pattern of domestic human cases in countries not OBF/ObmF, such as Greece, Portugal and Spain, and of non‐domestic human cases in countries OBF/ObmF, such as Austria, Germany, France and Sweden. The actual source of autochthonous cases in non‐endemic countries remains to be elucidated. The most likely hypothesis concerns the presence of Brucella in cheese or raw milk‐derived products originating from endemic countries through illegal importation or e‐commerce platforms selling cheese. Another explanation could be ‘false autochthonous cases’ caused by undetermined foreign sources of infection, when, for instance, foreign relatives previously brought goods from endemic regions and exposure went unnoticed (Jansen et al., 2019).
When such information was available, it was evident that human cases were commonly associated with hospitalisation. In 2020, human cases of brucellosis were mainly caused by infection with B. melitensis. Furthermore, it is noteworthy that B. melitensis was the species involved in all hospitalisation cases, when speciation information was provided. This information is very important for the optimisation of risk management to further reduce the disease in humans, considering that B. melitensis is mainly, if not completely, associated with brucellosis in sheep and goats. Two human cases were attributed to B. suis. This result should be monitored in the next few years to detect a potential trend for a potentially emerging condition.
Both bovine, and ovine and caprine brucellosis have been eradicated by most EU MS. In regions officially free of brucellosis, no infected herds were reported for 2020, except for one B. melitensis–infected cattle herd in Spain, and five infected cattle herds, and three infected sheep and goat flocks in Italy. Bovine brucellosis and/or ovine and caprine brucellosis were still detected in 2020 in the non‐officially free regions of non‐officially free MS, namely Greece, Italy and Portugal. In Greece, the proportion of tested herds/flocks remains limited, which may impact the precision of the surveillance. Italy reported a slight increase in the number of positive herds in non‐ObmF regions. The eradication of brucellosis in cattle and in sheep and goats may be considered an achievable goal in a relatively short space of time in Croatia and Spain, with almost no positive herds reported for these infections in recent years. The lack of animal data impairs the assessment of the brucellosis situation in Bulgaria. From 2012 to 2020, the overall annual number of positive cattle herds reported in non‐OBF regions decreased, whereas the prevalence of infected cattle herds increased. This can partly be explained by the slow decrease in test‐positive herds detected, together with a marked decrease in the total number of herds due to the gradual declaration of OBF status in regions within non‐OBF MS over the period. From 2012 to 2020, the overall annual number of positive small ruminant flocks reported in non‐ObmF regions decreased, as did the prevalence. The decrease in prevalence can partly be impaired by the large decrease in the total number of flocks due to the gradual declaration of ObmF status in regions within non‐ObmF MS over the period.
In non‐officially free regions, even though foodborne transmission of brucellosis to humans may still occur, but also direct contact with infected animals may represent a noteworthy source of infection. People working with farm animals, including farmers, livestock breeders, butchers, abattoir workers and veterinarians, are known to be at increased risk of brucellosis in endemic countries.
A comment should be made about canine brucellosis cases caused by Brucella canis. In the last 2 years, there has been an increase in the number of detected cases in dogs, especially in Italy and in the United Kingdom (APHA, 2021)‐in the United Kingdom, an increasing number of suspect canine cases of B. canis have been reported to APHA since July 2020 by private veterinarians and/or veterinary laboratories, with more than 40 canine cases of brucellosis (confirmed and probable cases based on laboratory, clinical and epidemiological investigations), including one large household cluster in England with evidence of dog‐to‐dog transmission. 2‐In Italy, an unusual outbreak was detected in a large kennel with different breeds and many trading activities, thus leading to more than 800 dog investigations (IZSAM, 2020).
In conclusion, in 2020, the number of reported confirmed cases of brucellosis in humans and the related EU notification rate was at its lowest level since the beginning of EU‐level surveillance in 2007. Brucellosis remains a rare, though serious, disease in the EU, with most human cases requiring hospitalisation. However, fewer than half of human cases are reported with information on hospitalisation, and this could hamper the reliability of the assessment. Brucellosis remains, however, an animal health concern with public health implications, especially in sheep and goat flocks in a few MS, namely Greece, Italy and Portugal.
6.5. Related project and internet sources
| Subject | For more information see | |
|---|---|---|
| Humans | ECDC Surveillance Atlas of Infectious Diseases | http://atlas.ecdc.europa.eu/public/index.aspx |
| EU case definition of brucellosis | https://www.ecdc.europa.eu/en/surveillance‐and‐disease‐data/eu‐case‐definitions | |
| Disease Programme on Emerging, Food‐ and Vector‐Borne Diseases | https://www.ecdc.europa.eu/en/about‐us/who‐we‐are/units/disease‐programmes‐unit | |
| European Food‐ and Waterborne Diseases and Zoonoses Network (FWD‐Net) | https://www.ecdc.europa.eu/en/about‐us/partnerships‐and‐networks/disease‐and‐laboratory‐networks/fwd‐net | |
| World Health Organization – brucellosis fact sheet | https://www.who.int/news‐room/fact‐sheets/detail/brucellosis | |
| Animals | EURL for Brucella | https://eurl‐brucellosis.anses.fr/ |
| Summary Presentations on the situation as regards bovine brucellosis and brucellosis in sheep and goats’ control and eradication programmes in MS | https://ec.europa.eu/food/horizontal‐topics/committees/paff‐committees/animal‐health‐and‐welfare/presentations_en#2020 | |
| General information on EU Food Chain Funding | https://ec.europa.eu/food/funding_en | |
| 2003/467/EC: Commission Decision of 23 June 2003 establishing the official tuberculosis, brucellosis and enzootic‐bovine‐leucosis‐free status of certain MS and regions of MS as regards bovine herds | https://eur‐lex.europa.eu/eli/dec/2003/467/oj/eng | |
| 93/52/EEC: Commission Decision of 21 December 1992 recording the compliance by certain MS or regions with the requirements for brucellosis (B. melitensis) and according them the status of a Member State or region officially free of the disease | https://eur‐lex.europa.eu/eli/dec/1993/52/oj/eng | |
| General information on National Veterinary Programmes, in EU and Task Force on the eradication of animal diseases –Brucellosis subgroup reports | https://ec.europa.eu/food/funding/animal‐health/national‐veterinary‐programmes_en | |
| EU approved and co‐financed veterinary programmes for bovine brucellosis and brucellosis in sheep and goats carried out by the MS | http://ec.europa.eu/dgs/health_food‐safety/funding/cff/animal_health/vet_progs_en.htm | |
| World Organisation for Animal health, Summary of Information on Brucellosis | https://www.oie.int/en/animal‐health‐in‐the‐world/animal‐diseases/Brucellosis/ | |
| Annual national zoonoses country reports (reports of reporting countries on national trends and sources of zoonoses) | https://www.efsa.europa.eu/en/data‐report/biological‐hazards‐reports |
7. Trichinella
Tables and figures that are not presented in this chapter are published as supporting information to this report and are available as downloadable files from the EFSA Knowledge Junction on Zenodo at https://doi.org/10.5281/zenodo.5682809. Summary statistics of human surveillance data with downloadable files are retrievable using ECDC’s Surveillance Atlas of Infectious Diseases at http://atlas.ecdc.europa.eu/public/index.aspx

7.1. Key facts
-
•
In 2020, the number of confirmed cases of human trichinellosis was 117 corresponding to an EU notification rate of 0.03 per 100,000 population. This was an increase of 39.1% and 20.4% compared with the rates in 2019 (0.02 and 0.02 per 100,000 population) with and without the 2019 data from the United Kingdom, respectively. This increase was mainly due to the number of confirmed cases reported by four MS (Austria, Bulgaria, Italy and Poland).
-
•
The trend in the number of confirmed cases of trichinellosis in the EU did not significantly increase or decrease in 2016–2020.
-
•
In terms of reported Trichinella outbreaks in the EU, there were five strong‐evidence outbreaks and one weak‐evidence outbreak, with 119 illnesses, 13 people hospitalised and no deaths. In the strong‐evidence outbreaks, the responsible food vehicles were, in each one, ‘fresh raw sausages from wild boar meat’, ‘pig meat and products thereof’, ‘other or mixed red meat and products thereof’, ‘meat and meat products’ and ‘fresh pig meat’. Two strong‐evidence outbreaks were reported by a single non‐EU country with eight confirmed cases, seven hospitalisations and no deaths.
-
•
In 2020, no infections with Trichinella were reported in tested fattening pigs (55 million) or breeding pigs (0.9 million) kept under controlled housing conditions (CHC), confirming that farming conditions are a key factor to prevent infection with this zoonosis.
-
•
In pigs not kept under CHC, 0.0001% (179 out of 139 million) were positive for Trichinella. Romania accounted for almost half of the positive pigs (91), followed by Bulgaria (60), Greece (11), Croatia (nine), France (three from Corsica Island), Spain (three) and Italy (two).
-
•
No Trichinella infections were detected in domestic solipeds in the EU in 2020, as had been the case in 2016–2019.
-
•
In 2020, the proportion of hunted wild boar that tested positive was 0.05%, which was a decrease vs. the previous 3‐year period.
-
•
The proportion of Trichinella‐positive red foxes (indicator animals) was 0.85% in 2020, which was the lowest prevalence in the 2016–2020 period.
7.2. Surveillance and monitoring of Trichinella in the EU
7.2.1. Humans
The notification of Trichinella infections in humans is mandatory in all MS, Iceland, Norway and Switzerland, except in Belgium and France, where surveillance systems are voluntary. There is no surveillance system for trichinellosis in Denmark. The surveillance systems cover the whole population in all MS except Belgium. All countries reported case‐based data except Belgium, Bulgaria and the Netherlands, which reported aggregated data. Both reporting formats were included to calculate the numbers of cases and notification rates. For 2020, Belgium did not report data.
The International Commission on Trichinellosis recommends the use of indirect enzyme‐linked immunosorbent assay (i‐ELISA) as the screening test and western blot (WB) as the confirmatory test (Bruschi et al., 2019). Histopathological analysis of muscle biopsies is very rarely performed.
Since 1 February 2020, the United Kingdom has been a third country, whereas before it was an EU MS. Human data from the United Kingdom were not collected by ECDC for 2020.
7.2.2. Animals
Trichinella monitoring data from domestic pigs (both fattening and breeding animals), farmed wild boar and solipeds
According to Commission Implementing Regulation (EU) 2015/1375 23 , all Trichinella‐susceptible animals intended for human consumption in the EU, i.e. domestic pigs (both fattening and breeding animals), farmed wild boar and solipeds, should be tested for the presence of Trichinella larvae in the muscles unless carcases have undergone a freezing treatment (freezing inactivates the parasite). The method ISO 18743/2015 (ISO, 2015a) or an equivalent method should be used (Commission Implementing Regulation (EU) 2015/1375). Therefore, data on Trichinella infections in these animals are comparable across MS because the monitoring schemes are harmonised and the data collected and reported to EFSA originate from census sampling (Table 1).
Domestic pigs, farmed and hunted wild boar and other wild animals (e.g. bears) that are not processed to be placed on the EU market (e.g. intended for own consumption) are exempted from Commission Implementing Regulation (EU) 2015/1375 and their control falls under national legislation. Commission Implementing Regulation (EU) 2015/1375 states that the reporting of data for domestic pigs shall, at least, provide specific information related to the number of animals tested that were raised under CHC as well as the number of breeding sows, boar and fattening pigs tested. Furthermore, the regulation states that a negligible risk status for a country or region is no longer recognised.
Trichinella monitoring data from animals other than domestic pigs, farmed wild boar and solipeds
MS should monitor the circulation of these nematodes in the main natural reservoir hosts (carnivorous and omnivorous animals) to acquire information on the risk of transmission to domestic animals (and from these to humans) and on the introduction of new Trichinella species from non‐EU countries. However, monitoring data provided by the MS to EFSA are generated by non‐harmonised monitoring schemes across MS without mandatory reporting requirements. Wild animals are the main reservoir hosts of Trichinella, and their biology and ecology vary from one MS to another and from one region or habitat in the same MS to another due to the human and environmental impact on the ecosystems, resulting in different transmission patterns and prevalence rates of infection. Therefore, data on Trichinella in wild animals are not fully comparable between MS, as neither harmonised monitoring schemes nor mandatory reporting requirements are in place, and the reported findings must be interpreted with caution. These data allow descriptive summaries to be produced at the EU level but preclude any subsequent data analysis such as an assessment of temporal and spatial trends (Table 1).
7.2.3. foodborne outbreaks of trichinellosis
The reporting of foodborne trichinellosis disease outbreaks in humans is mandatory according to Zoonoses Directive 2003/99/EC.
Since 1 February 2020, the United Kingdom has been a third country. Food, animal and foodborne outbreak data from the United Kingdom were still collected by EFSA for 2020 in the framework of Zoonoses Directive 2003/99/EC, but have been excluded from EU statistics.
7.3. Results
7.3.1. Overview of key statistics, EU, 2016–2020
Table 54 summarises EU‐level statistics on human trichinellosis and on Trichinella in animals, for the 2016–2020 period. Reported animal data of interest were classified into categories and aggregated by year to obtain an annual overview of the volume of data submitted.
Table 54.
Summary of Trichinella statistics related to humans and the most important animal species, EU, 2016–2020
| 2020 | 2019 a | 2018 a | 2017 a | 2016 a | Data source | |
|---|---|---|---|---|---|---|
| Humans | ||||||
| Total number of confirmed cases | 117 | 97 | 66 | 168 | 101 | ECDC |
| Total number of confirmed cases/100,000 population (notification rates) | 0.03 | 0.02 | 0.01 | 0.03 | 0.02 | ECDC |
| Number of reporting MS | 25 | 26 | 27 | 27 | 27 | ECDC |
| Infections acquired in the EU | 99 | 26 | 18 | 81 | 53 | ECDC |
| Infections acquired outside the EU | 2 | 2 | 1 | 2 | 1 | ECDC |
| Unknown travel status or unknown country of infection | 16 | 69 | 47 | 85 | 47 | ECDC |
| Number of outbreak‐related cases | 119 | 44 | 114 | 199 | 27 | EFSA |
| Total number of outbreaks | 6 | 5 | 10 | 11 | 7 | EFSA |
| Animals | ||||||
| Domestic pigs RCHC b | ||||||
| Number of units c tested | 55,989,292 | 73,633,900 | 77,794,786 | 72,227,074 | 62,594,969 | EFSA |
| % (N) positive units | 0 | 0 | 0 | 0 | 0.00005 | EFSA |
| Number of reporting MS | 16 | 16 | 15 | 14 | 16 | EFSA |
| Domestic pigs NRCHC d | ||||||
| Number of units tested | 139,637,631 | 145,213,445 | 152,922,322 | 124,689,434 | 124,496,074 | EFSA |
| % (N) positive units | 0.0001 | 0.0002 | 0.0003 | 0.0002 | 0.0002 | EFSA |
| Number of reporting MS | 22 | 25 | 25 | 25 | 24 | EFSA |
| Farmed wild boar | ||||||
| Number of units tested | 3,922 | 7,570 | 6,343 | 17,799 | 31,039 | EFSA |
| % (N) positive units | 0 | 0 | 0 | 0.7 | 0.3 | EFSA |
| Number of reporting MS | 6 | 7 | 7 | 8 | 8 | EFSA |
| Hunted wild boar | ||||||
| Number of units tested | 1,470,830 | 1,757,383 | 1,465,788 | 1,389,905 | 1,400,393 | EFSA |
| % (N) positive units | 0.05 | 0.08 | 0.09 | 0.09 | 0.05 | EFSA |
| Number of reporting MS | 21 | 23 | 23 | 22 | 20 | EFSA |
| Red foxes | ||||||
| Number of animals tested | 5,764 | 6,696 | 6,612 | 6,486 | 7,785 | EFSA |
| % (N) positive units | 0.85 | 1.3 | 1.5 | 1.2 | 0.94 | EFSA |
| Number of reporting MS | 9 | 10 | 10 | 11 | 12 | EFSA |
ECDC: European Centre for Disease Prevention and Control; EFSA: European Food Safety Authority; MS: Member State; N: number.
Data reported by the United Kingdom in 2016–2019, when it was an EU Member State, were considered. Since 1 February 2020, the United Kingdom has been a third country.
RCHC: raised under controlled housing conditions.
Units: animals and/or slaughter animal batches.
NRCHC: not raised under controlled housing conditions.
More detailed descriptions of these statistics are provided in the results section of this chapter and in the chapter on foodborne outbreaks.
7.3.2. Human trichinellosis
In 2020, 117 confirmed cases of trichinellosis were reported by 25 MS, which was an increase of about 20% compared with 2019 (Table 55). Two MS (Belgium and Denmark) did not report any trichinellosis data. The number of confirmed cases was above the 5‐year average (110 cases). The absolute EU notification rate increased from 0.02 per 100,000 population in 2019 to 0.03 per 100,000 population in 2020, whereas the relative EU notification rate per 100,000 population increased in 2020 up to 39.1% and 20.4% compared with the rate in 2019 with and without the data from the United Kingdom, respectively. This increase was mainly due to the number of confirmed cases reported by four MS: Austria (six), Bulgaria (13), Italy (79) and Poland (11). Together, four countries (Austria, Bulgaria, Italy and Poland) accounted for 93% of all confirmed cases reported at the EU level in 2020. Italy reported a large increase in cases in 2020 compared to the previous 4‐year period. All cases were related to the same outbreak. In 2020, Bulgaria continued to have the highest notification rate in the EU (0.19 cases per 100,000), despite having the lowest number (13) of confirmed cases reported since 2016 and a 76.4% reduction in confirmed cases compared with 2019 (Table 55).
Table 55.
Reported human cases of trichinellosis and notification rates per 100,000 population in EU MS and non‐MS countries, by country and year, 2016–2020
| Country | 2020 | 2019 | 2018 | 2017 | 2016 | |||||||
|---|---|---|---|---|---|---|---|---|---|---|---|---|
| National coverage a | Data format a | Confirmed cases and rates | Confirmed cases and rates | Confirmed cases and rates | Confirmed cases and rates | Confirmed cases and rates | ||||||
| Cases | Rate | Cases | Rate | Cases | Rate | Cases | Rate | Cases | Rate | |||
| Austria | Y | C | 6 | 0.07 | 1 | 0.01 | 2 | 0.02 | 3 | 0.03 | 2 | 0.02 |
| Belgium b | Y | A | – | – | – | – | 0 | – | 0 | – | 0 | – |
| Bulgaria | Y | A | 13 | 0.19 | 55 | 0.79 | 45 | 0.64 | 55 | 0.77 | 35 | 0.49 |
| Croatia | Y | C | 0 | 0 | 3 | 0.07 | 0 | 0 | 21 | 0.51 | 5 | 0.12 |
| Cyprus | Y | C | 0 | 0 | 0 | 0 | 0 | 0 | 0 | 0 | 0 | 0 |
| Czechia | Y | C | 0 | 0 | 0 | 0 | 0 | 0 | 0 | 0 | 0 | 0 |
| Denmark c | – | – | – | – | – | – | – | – | – | – | – | – |
| Estonia | Y | C | 0 | 0 | 0 | 0 | 0 | 0 | 0 | 0 | 0 | 0 |
| Finland | Y | C | 0 | 0 | 0 | 0 | 0 | 0 | 0 | 0 | 0 | 0 |
| France | Y | C | 1 | < 0.01 | 2 | < 0.01 | 0 | 0 | 8 | 0.01 | 3 | < 0.01 |
| Germany | Y | C | 1 | < 0.01 | 3 | < 0.01 | 0 | 0 | 2 | < 0.01 | 4 | < 0.01 |
| Greece | Y | C | 0 | 0 | 0 | 0 | 0 | 0 | 1 | 0.01 | 0 | 0 |
| Hungary | Y | C | 0 | 0 | 0 | 0 | 2 | 0.02 | 0 | 0 | 0 | 0 |
| Ireland | Y | C | 0 | 0 | 0 | 0 | 0 | 0 | 0 | 0 | 0 | 0 |
| Italy | Y | C | 79 | 0.13 | 10 | 0.02 | 2 | < 0.01 | 4 | 0.01 | 5 | 0.01 |
| Latvia | Y | C | 1 | 0.05 | 1 | 0.05 | 1 | 0.05 | 1 | 0.05 | 1 | 0.05 |
| Lithuania | Y | C | 0 | 0 | 0 | 0 | 0 | 0 | 9 | 0.32 | 1 | 0.03 |
| Luxembourg | Y | C | 0 | 0 | 0 | 0 | 0 | 0 | 0 | 0 | 0 | 0 |
| Malta | Y | C | 0 | 0 | 0 | 0 | 0 | 0 | 0 | 0 | 0 | 0 |
| Netherlands | Y | A | 0 | 0 | 1 | 0.01 | 0 | 0 | 0 | 0 | 0 | 0 |
| Poland | Y | C | 11 | 0.03 | 2 | 0.01 | 2 | 0.01 | 9 | 0.02 | 4 | 0.01 |
| Portugal | Y | C | 0 | 0 | 1 | 0.01 | 0 | 0 | 1 | 0.01 | 0 | 0 |
| Romania | Y | C | 4 | 0.02 | 6 | 0.03 | 10 | 0.05 | 48 | 0.24 | 26 | 0.13 |
| Slovakia | Y | C | 0 | 0 | 0 | 0 | 0 | 0 | 1 | 0.02 | 1 | 0.02 |
| Slovenia | Y | C | 0 | 0 | 0 | 0 | 0 | 0 | 0 | 0 | 0 | 0 |
| Spain | Y | C | 1 | < 0.01 | 12 | 0.03 | 2 | < 0.01 | 5 | 0.01 | 12 | 0.03 |
| Sweden | Y | C | 0 | 0 | 0 | 0 | 0 | 0 | 0 | 0 | 2 | 0.02 |
| EU Total 27 | – | – | 117 | 0.03 | 97 | 0.02 | 66 | 0.02 | 168 | 0.04 | 101 | 0.02 |
| United Kingdom | – | – | – | – | 0 | 0 | 0 | 0 | 0 | 0 | 0 | 0 |
| EU Total d | – | – | 117 | 0.03 | 97 | 0.02 | 66 | 0.01 | 168 | 0.03 | 101 | 0.02 |
| Iceland | Y | C | 0 | 0 | 0 | 0 | 0 | 0 | 0 | 0 | 0 | 0 |
| Norway | Y | C | 0 | 0 | 0 | 0 | 0 | 0 | 0 | 0 | 0 | 0 |
| Switzerland e | Y | C | 4 | 0.05 | 3 | 0.03 | 0 | 0 | 1 | 0.01 | 0 | 0 |
–: Data not reported.
: Y: yes; A: aggregated data; C: case‐based data.
: Sentinel surveillance, disease not under formal surveillance. Notification rate not calculated.
: No surveillance system.
Cases reported by the United Kingdom in 2016–2019 were also considered for this estimation (EU‐28). When 2016–2019 United Kingdom data were collected, the United Kingdom was an EU MS but since 1 February 2020, it has become a third country.
: Switzerland provided data directly to EFSA. The human data for Switzerland include data from Liechtenstein.
In 2020, 99 cases (84.7%) of trichinellosis with known travel status and with known country of infection were reported as having been acquired in the EU. One MS (Austria) reported two travel‐associated trichinellosis cases infected outside the EU and one case infected within the EU. For 16 cases (13.7%), travel information was not reported (Table 54).
The EU trend in confirmed cases of trichinellosis is shown in Figure 38. This trend did not significantly decrease or increase over the period 2016–2020. During the same period, only Romania reported a significant decreasing trend and none of the MS observed a significant increasing trend. Bulgaria, which had reported most of the cases until 2019 and had the highest notification rate in the EU in 2016–2019, was not included in the EU trend calculations since monthly data were not available.
Figure 38.

- Source: Austria, Cyprus, Czechia, Estonia, Greece, Finland, France, Germany, Hungary, Ireland, Italy, Latvia, Lithuania, Luxembourg, Malta, Poland, Portugal, Romania, Slovakia, Slovenia and Sweden.
Of the nine MS reporting confirmed cases for 2020, five provided information on hospitalisation (22 cases, 18.8% of all confirmed cases reported in the EU). Among these cases, 16 (72.7%) were hospitalised, which was an increase compared with 2019 (37.5%). Six MS provided information on the outcome of the cases (24 cases, 20.5% of all confirmed cases) and no fatalities were reported.
Eighty‐two (70.1%) confirmed human cases were older than 35 years.
Species information was available for 86 (73.5%) of the reported confirmed cases from five MS. Trichinella spiralis was reported as the causative agent of seven confirmed human cases in four MS: Germany (one), Latvia (one), Romania (four) and Spain (one). T. britovi was identified as the causative agent of 79 human cases in Italy.
Human trichinellosis cases and cases associated with foodborne outbreaks
In 2020, Trichinella was identified in six FBO reported by five MS: France (one, N cases = 2), Italy (one, N cases = 79), Poland (two, N cases = 18), Romania (one, N cases = 9) and Spain (one, N cases = 11). Five out of six FBO were reported as strong‐evidence outbreaks and affected a total of 111 people, five of whom needed to be hospitalised. A single weak‐evidence outbreak was reported by Poland; it involved eight people, all of whom were hospitalised. The outbreaks reported by France and Italy were caused by T. britovi, which was identified in ‘pig meat and products thereof’ and in ‘other or mixed red meat and products thereof’, respectively. The two outbreaks reported by Poland were caused by T. spiralis through the consumption of ‘fresh raw sausages from wild boar meat’. Unspecified Trichinella species were reported as the causative agents of the outbreaks reported by Spain and Romania, in which only two individuals from Romania needed to be hospitalised. The responsible food was ‘meat and meat products’ in Spain and ‘fresh pig meat’ in Romania. Two strong‐evidence FBO caused by T. spiralis through the consumption of ‘meat from wild boar ‐ meat products’ were reported by one non‐MS (Serbia); they involved eight people of whom seven were hospitalised. In 2020, trichinellosis FBO were mostly caused by ‘pig and wild boar meat and products thereof’, as in previous years.
The number of FBO‐associated human cases (119) reported to EFSA and the number of cases of confirmed human trichinellosis acquired in the EU (117) that were reported to TESSy and managed by ECDC were different. In this context, it is important to clarify that the case classifications for reporting are different between these two databases. In TESSy, the cases reported are classified based on the EU case definition and all these cases visited a doctor. Cases who never visited a doctor are not reported to TESSy. Information on which cases are linked to an outbreak and which are not is also not systematically collected. In FBO, human cases are persons involved in the outbreak as defined by the investigators (case definition), and cases must be linked, or probably linked, to the same food source (Directive 2003/99/EC). This can include both ill people (whether confirmed microbiologically or not) and people with confirmed asymptomatic infections (EFSA, 2014).
7.3.3. Trichinella infection in food and animals
No monitoring data from food were reported by any MS.
In 2020, 30 countries (26 MS and four non‐MS) provided information on Trichinella in domestic animals (pigs and/or farmed wild boar). Poland did not provide such information. 24 Sixteen MS and two non‐MS reported data on breeding and fattening pigs raised under CHC; no positive findings were reported. No positive findings were found in farmed wild boar (Table 56).
Table 56.
Trichinella monitoring results in domestic pigs and in farmed wild boar in reporting MS and non‐MS countries, by housing conditions, EU, 2020
| Country | N Positive/tested (% positive) | ||||
|---|---|---|---|---|---|
| No controlled housing conditions (NCHC) or not specified | Controlled housing conditions | ||||
| Farmed wild boar | Fattening pigs | Breeding pigs | Fattening pigs | Breeding pigs | |
| Austria | 0/279 (0) | 0/4,969,074 (0) | 0/87,441 (0) | – | – |
| Belgium | – | 0/28,755 (0) | 0/3,539,785 (0) | 0/4,462,864 (0) | – |
| Bulgaria | – | 60/49,754 a (0.121) | – | 0/124,288 l (0) | 0/26,122 n (0) |
| Croatia | – | 7/185,059 b (0.004) | 2/4,312 i (0.046) | 0/1,048,358 (0) | 0/7,415 o (0) |
| Cyprus | – | 0/551,988 (0) | 0/11,816 (0) | – | – |
| Czechia | – | – | – | 0/2,312,065 (0) | – |
| Denmark | 0/428 (0) | 0/733,384 (0) | 0/244,029 (0) | 0/16,075,700 (0) | 0/245,909 (0) |
| Estonia | – | 0/394,032 (0) | – | 0/57,753 (0) | – |
| Finland | 0/236 (0) | 0/1,884,655 (0) | 0/32,549 (0) | 0/581 (0) | 0/93 (0) |
| France | 0/335 (0) | 3/506,612 c (< 0.001) | 0/138,756 (0) | 0/18,371 (0) | 0/301,244 p (0) |
| Germany | – | 0/53,383,281 (0) | – | – | – |
| Greece | 0/1,214 (0) | 1/860,792 d (< 0.001) | 10/20,226 j (0.049) | – | – |
| Hungary | – | 0/3,640,066 (0) | 0/1,061,660 (0) | – | – |
| Ireland | – | – | – | 0/3,455,432 (0) | 0/90,509 p (0) |
| Italy | 0/1,430 (0) | 2/11,106,266 e (< 0.001) | – | 0/99,373 (0) | 0/170,881 p (0) |
| Latvia | – | 0/507,155 (0) | – | – | – |
| Lithuania | – | – | – | 0/943,353 (0) | – |
| Luxembourg | – | 0/122,548 (0) | – | – | – |
| Malta | – | 0/53,052 (0) | 0/987 (0) | – | – |
| Netherlands | – | – | – | 0/15,970,021 (0) | – |
| Portugal | – | 0/121,799 (0) | 0/3,343 (0) | 0/4,060,574 (0) | 0/33,438 p (0) |
| Romania | – | 91/195,311 (0.047) | 0/296 (0) | 0/3,921,960 (0) | 0/9,518 (0) |
| Slovakia | – | 0/673,381 f (0) | 0/16,985 (0) | – | – |
| Slovenia | – | 0/245,921 g (0) | – | – | – |
| Spain | – | 3/52,910,207 h (< 0.001) | 0/872,148 k (0) | 0/1,054,150 (0) | – |
| Sweden | – | 0/458,660 (0) | 0/21,546 (0) | 0/1,469,068 (0) | 0/30,252 p (0) |
| EU Total | 0/3,922 (0) | 167/133,581,752 (< 0.001) | 12/6,055,879 (< 0.001) | 0/55,073,911 (0) | 0/915,381 (0) |
| Iceland | – | – | – | 0/80,535 (0) | – |
| Norway | – | 0/154,300 (0) | – | – | – |
| Switzerland | – | 0/2,073,424 (0) | 0/27,310 (0) | – | – |
| United Kingdom | 0/264 (0) | – | 0/519,948 (0) | 0/5,434,204 m (0) | – |
| Total non‐EU Countries | 0/7,607 (0) | 0/2,227,724 (0) | 0/547,258 (0) | 0/5,514,739 (0) | 0 |
| Total EU + non‐EU countries | 0/11,529 (0) | 167/135,809,476 (< 0.001) | 12/6,603,137 (< 0.001) | 0/60,588,650 (0) | 0/915,381 (0) |
Comprising 15,631 piglets, 7,172 wild pigs including 60 positives, and 18 pigs for own consumption.
Comprising 2,435 piglets.
Comprising 20,454 pigs in mixed herds including three positives.
Comprising 1,506 pigs for own consumption including one positive.
Comprising 145,028 pigs for own consumption.
Comprising 920 pigs for own consumption.
Pigs in mixed herds.
Comprising 18,696 pigs for own consumption including one positive and 25,621 piglets.
Comprising 3,052 sows including two positives and 240 boar.
Comprising 19,804 sows including 10 positives and 422 boar.
Comprising 73,518 piglets.
Comprising 7,586 slaughter animal batches.
Comprising 1,256 from mixed herds.
Comprising 2,202 sows.
Comprising 292 sows.
Comprising sows and boar.
Seven MS (Bulgaria, Croatia, France, Greece, Italy, Romania and Spain) reported positive findings in domestic pigs not raised under CHC, for 2020. In fattening pigs not raised under CHC, 167 (< 0.01%) (including 60 wild pigs, three pigs from mixed herds and two pigs for own consumption) were positive, whereas in breeding pigs (sows), this figure was 12 (< 0.01%). Romania accounted for almost half of the positive pigs (91), followed by Bulgaria (60), Greece (11), Croatia (nine), France (three from Corsica Island), Spain (three) and Italy (two). Species identification was reported for 79 (44%) out of 179 pigs. T. spiralis was detected in 54 pigs (30%), T. britovi in 24 pigs (12.6%) and T. pseudospiralis in one pig (0.57%).
As during previous years, these Trichinella infections were from free‐range and backyard pigs reared in rural EU regions.
The withdrawal of the United Kingdom from the EU did not impact the prevalence of Trichinella infections in pigs as the last positive diagnosis in pigs in the United Kingdom was in 1979.
As shown in Figure 39 from 2012 to 2017 (6‐year period), Trichinella spp. was not reported in domestic pigs or farmed wild boar in 16 MS (Austria, Belgium, Cyprus, Czechia, Denmark, Estonia, Finland, Hungary, Ireland, Luxembourg, Malta, the Netherlands, Portugal, Slovenia, Sweden and the United Kingdom), unlike in the other 12 MS (Bulgaria, Croatia, France, Germany, Greece, Italy, Latvia, Lithuania, Poland, Romania, Slovakia and Spain). In 2018 and 2019, Trichinella spp. were only reported by six MS: Croatia, France, Italy, Poland, Romania and Spain in 2018; and Bulgaria, Croatia, France, Poland, Romania and Spain in 2019. In 2020, seven countries (Bulgaria, Croatia, France, Greece, Italy, Romania and Spain) reported the presence of Trichinella in pigs.
Figure 39.

Trichinella spp. in domestic pigs and farmed wild boar, in EU MS and non‐MS countries, 2012–2020
- These distribution maps have been built based on data from reports (EFSA and ECDC, 2015a, b, 2016, 2017, 2018a, 2019, 2021).
In 2020, as in the previous 5‐year period (2015–2019), positive findings were reported neither in 125,804 domestic solipeds tested in 21 MS (Austria, Belgium, Bulgaria, Croatia, Czechia, Denmark, Estonia, Finland, France, Germany, Hungary, Ireland, Italy, Latvia, Luxembourg, the Netherlands, Portugal, Romania, Slovenia, Spain and Sweden) nor in 11,907 domestic solipeds tested by three non‐MS (Iceland, Switzerland and the United Kingdom) (Table 57).
Table 57.
Trichinella monitoring results in hunted wild boar and wild boar with unspecified habitat, brown bears, red foxes and domestic solipeds, in reporting MS and non‐MS countries, EU, 2020
| Country | N Positive/tested (% positive) | |||
|---|---|---|---|---|
| Hunted or not specified wild boars | Brown bears | Red foxes | Domestic solipeds | |
| Austria | 0/25,655 (0) | – | 0/3 (0) | 0/426 (0) |
| Belgium | 0/17,018 (0) | – | – | 0/18,508 (0) |
| Bulgaria | 27/4,449 (0.61) | – | – | 0/8 (0) |
| Croatia | 55/31,056 (0.18) | 0/26 (0) | – | 0/1,215 (0) |
| Cyprus | – | – | 0/65 (0) | – |
| Czechia | 0/182,091 (0) | – | 2/2,692 (0.074) | 0/98 (0) |
| Denmark | – | – | – | 0/918 (0) |
| Estonia | 2/633 (0.32) | 9/63 (14.3) | – | 0/9 (0) |
| Finland | 1/1,153 (0.09) | 8/294 (2.7) | 35/210 (16.7) | 0/817 (0) |
| France | 0/48,351 (0) | – | – | 0/6,090 (0) |
| Germany | 32/612,791 (0.005) | – | 0/644 (0) | 0/4,414 (0) |
| Greece | 0/2 (0) | – | – | – |
| Hungary | 3/46,295 (0.006) | – | 0/274 (0) | 0/221 (0) |
| Ireland | – | – | – | 0/2,307 (0) |
| Italy | 13/149,418 (0.009) | – | 12/1,727 (0.69) | 0/31,311 (0) |
| Latvia | 18/6,428 (0.28) | – | – | 0/71 (0) |
| Lithuania | – | – | – | – |
| Luxembourg | 0/3,311 (0) | – | 0/70 (0) | 0/15 (0) |
| Malta | – | – | – | – |
| Netherlands | 0/4,921 (0) | – | – | 0/1,790 (0) |
| Portugal | 1/559 (0.18) | – | – | 0/574 (0) |
| Romania | 84/9,189 (0.91) | 6/23 (26.1) | – | 0/32,153 (0) |
| Slovakia | 7/11,215 (0.06) | – | 0/79 (0) | – |
| Slovenia | 0/1,129 (0) | 0/58 (0) | – | 0/1,078 (0) |
| Spain | 460/154,094 (0.30) | – | – | 0/22,356 (0) |
| Sweden | 9/161,072 (0.006) | 0/222 (0) | – | 0/1,425 (0) |
| EU Total | 712/1,470,830 (0.05) | 23/686 (3.4) | 49/5,764 (0.85) | 0/125,804 (0) |
| Iceland | – | – | – | 0/9,309 (0) |
| Norway | 0/197 (0) | – | – | – |
| North Macedonia | 8/902 (0.89) | – | – | – |
| Switzerland | 0/7,343 (0) | 0/1 (0) | – | 0/1,286 (0) |
| United Kingdom | 0/697 (0) | – | 0/378 (0) | 0/1,312 (0) |
| Total non‐EU countries | 8/1796 (0.45) | 0/1 (0) | 0/378 (0) | 0/11,907 (0) |
| Total EU + non‐EU countries | 720/1,472,626 (0.049) | 23/687 (3.3) | 49/6,142 (0.80) | 0/137,711 (0) |
MS: Member State.
Thirteen MS (Bulgaria, Croatia, Estonia, Finland, Germany, Hungary, Italy, Latvia, Portugal, Romania, Slovakia, Spain and Sweden) reported positive findings in hunted wild boar (712 positive findings out of 1,471,830 animals tested (0.05%)). Species identification was provided for 320 wild boar (44%), for which 231 (72.2%) were T. spiralis, 83 (26%) T. britovi, five (1.5%) T. pseudospiralis and one (0.3%) T. nativa. Three MS (Czechia, Finland and Italy) reported positive findings for Trichinella in red foxes (Vulpes vulpes) with, in total, 49 (0.85%) positive out of 5,764 tested animals in nine MS. T. britovi was the only species identified in six foxes. Three MS (Estonia, Finland and Romania) reported data on Trichinella in brown bears (Ursus arctos) with 23 (3.4%) positive out of 686 tested in six MS (Table 58). T. nativa and T. britovi were identified in 12 and nine animals, respectively. Seven MS and one non‐MS reported data on Trichinella in wild animals other than foxes, brown bears and wild boar. Positive findings were detected in raccoon dogs (31.6%), lynxes (21.9%), wolves (17.3%), martens (2.9%), badgers (1.2%) and birds (1.5%), as shown in Table 58.
Table 58.
Trichinella monitoring results in other wild animals in reporting MS and non‐MS, EU, 2020
| Country | Badgers | Wolves | Raccoon dogs | Birds | Lynxes | Raccoons | Martens | Other animals b | ||||||||
|---|---|---|---|---|---|---|---|---|---|---|---|---|---|---|---|---|
| Units tested | Units positive (%) | Units tested | Units positive (%) | Units tested | Units positive (%) | Units tested | Units positive (%) | Units Tested | Units Positive (%) | Units Tested | Units Positive (%) | Units Tested | Units Positive (%) | Units Tested | Units Positive (%) | |
| Austria | 35 | 0 | − | − | − | − | − | − | − | − | − | − | − | − | − | − |
| Croatia | 3 | 1 (33.3) | − | − | − | − | − | − | − | − | − | − | − | − | 2 | 0 |
| Finland | 9 | 3 (33.3) | 29 | 11 (37.9) | 195 | 62 (31.8) | 27 a | 2 (7.4) | 55 | 26 (47.3) | − | − | 7 | 3 (42.9) | 87 | 0 |
| Germany | 34 | 1 (2.9) | − | − | − | − | − | − | − | − | 162 | 0 | 5 | 0 | 237 | 0 |
| Hungary | − | − | − | − | − | − | − | − | − | − | − | − | − | − | 6 | 0 |
| Italy | 324 | 0 | 195 | 28 (14.4) | 1 | 0 | 174 | 1 (0.57) | − | − | − | − | 125 | 1 (0.80) | 47 | 0 |
| Sweden | 13 | 0 | 1 | 0 | − | − | − | − | 91 | 6 (6.6) | − | − | − | − | 84 | 0 |
| EU Total | 418 | 5 (1.2) | 225 | 39 (17.3) | 196 | 62 (31.6) | 174 | 3 (1.5) | 146 | 32 (21.9) | 162 | 0 | 137 | 4 (2.9) | 463 | 0 |
| Switzerland | 1 | 0 | 8 | 2 (25.0) | − | − | − | − | 28 | 4 (14.3) | − | − | − | − | 1 | 0 |
| Total EU + non‐EU countries | 419 | 5 (1.2) | 233 | 41 (17.6) | 196 | 62 (31.6) | 174 | 3 (1.5) | 174 | 36 (20.7) | 162 | 0 | 137 | 4 (2.9) | 464 | 0 |
MS: Member State.
Comprising 12 Goshawk (one positive) and 15 white‐tailed eagles (one positive).
Comprising beavers (65), coypu (59), deer (four), dogs (10), goats (one), hares (12), hedgehogs (15), jackals (nine), mice (one), minks (two), otter (41), owls (18), polecats (three), raccoons (162), rats (three), seals (21), weasels (three), wild cats (Felis silvestris) (nine), wolverines (29) and other non‐specified animals (172).
7.4. Discussion
Trichinellosis is a rare but serious human disease that is still present in some EU MS. Sixteen out of 25 MS reported zero cases including four MS (Cyprus, Finland, Luxembourg and Malta) that have never reported any trichinellosis cases since the beginning of EU‐level surveillance in 2007.
During the COVID‐19 pandemic emergency, data reporting to ECDC and EFSA has been challenging for some MS. In particular, Bulgaria registered a drastic decline in confirmed cases of trichinellosis in 2020; however, whether or not this was due to the impact of the COVID‐19 pandemic on surveillance and reporting is unknown. The withdrawal of the United Kingdom from the EU did not impact the epidemiology of trichinellosis, as there have been no human cases acquired from meat produced in the United Kingdom for over 40 years. Eight cases associated with one FBO caused by the consumption of imported infected meat and three cases associated with travelling were diagnosed between 2000 and 2014.
In general, Trichinella infections in humans are often linked to FBO; therefore, the EU trend for trichinellosis has been affected by the number and size of FBO, often with peaks in January–February. The main reason for the increase in the number of cases is the higher consumption of various home‐made pork products during winter as well as during the wild boar hunting season. The EU notification rate was under 0.03 per 100,000 population in the last 5 years, from 2016 to 2020, with the highest rate (0.03) reported in 2017 and 2020, and the lowest rate (0.01) reported in 2018; this was the lowest rate ever reported since the beginning of EU‐level trichinellosis surveillance in 2007. In 2020, Italy reported 79 cases which were all related to the same outbreak already reported in 2019, which had involved nine people, who had consumed salami made with meat from T. britovi‐infected wild boar. Romania, which had experienced the most Trichinella outbreaks in the previous years, reported the lowest number of human cases over the 2016–2020 period in 2020, showing a significant decrease in the 5‐year trend from 2016 to 2020. All outbreaks but one in Poland were reported with strong evidence and were associated with pig and wild boar meat.
More than 200 million pigs were tested for Trichinella in MS and non‐MS in 2020, out of more than 246 million reared pigs in the EU (Marquer et al., 2014), with only 179 positive animals, i.e. about 0.73 per million reared pigs. Poland did not report any information on 63 pigs and 508 wild boar that tested positive for Trichinella; therefore, the reported number of Trichinella‐positive domestic pigs is likely to be an underestimation of the true number. Only seven out of 22 MS reported Trichinella in pigs in 2020, with an overall prevalence of 0.00009%. All positive findings were from pigs not raised under CHC. Most pigs at risk for this infection are backyard or free‐ranging pigs, i.e. pigs not raised under CHC that are usually slaughtered at home, where veterinary control or recording can be easily evaded. In the EU, infected pigs are usually clustered in five MS (Bulgaria, Croatia, Poland, Romania and Spain) and sporadic infections are documented in other MS (Pozio, 2014). In 2020, Greece reported 11 positive pigs; this MS had not reported any positive findings in domestic pigs since 2012, when 16 fattening pigs not reared in CHC tested positive for Trichinella. EFSA has identified that non‐CHC are a major risk factor for Trichinella infections in domestic pigs and that the risk of Trichinella infection in pigs kept in well‐managed officially recognised CHC is considered negligible (EFSA and ECDC, 2011; EFSA BIOHAZ, CONTAM and AHAW Panels, 2011).
Hunted wild boar are an important source of trichinellosis infections in humans. Human behaviour can strongly influence the sylvatic cycles both favouring and reducing the transmission of Trichinella spp. Carcases of Trichinella infected animals left by hunters in the field after skinning, removing and discarding the entrails, or road accidents, represent a great biomass of these parasites readily available to the wild cycle.
No positive findings were reported for solipeds in 2020. Over the last 12 years, only four horses tested positive out of more than one million tested animals, in 2008, 2010 and 2012 (EFSA and ECDC, 2009, 2010, 2011, 2012, 2013, 2014). This extremely low (< 0.001%) prevalence may have been related to effective control which, according to the EFSA BIOHAZ Panel (2013a), should be maintained if there is no full and reliable traceability system in place, especially since soliped meat can be eaten raw in some EU countries.
Trichinella spp. circulate among wild animals in large parts of Europe. The reporting of negative findings in MS could be explained by an insufficient number of surveys, inadequate sample sizes or investigations in regions whose environmental conditions do not favour the transmission of these zoonotic nematodes among wildlife.
Red foxes, having a large and widespread population, can be considered as the main natural reservoir of Trichinella in Europe. In 2020, the prevalence of Trichinella infection in this animal species reached the lowest value in the 2016–2010 period. The proportion of positive samples from wildlife was higher in raccoon dogs, wolves and lynxes than in other animals sampled, but their population sizes and distributions in Europe are generally limited to a few countries.
Identification of Trichinella larvae at species level in 2020 confirmed that T. spiralis was more prevalent than T. britovi in pigs (Pozio et al., 2009). However, T. spiralis is patchily distributed. T. nativa has been documented in wild carnivores in Finland, Estonia and Sweden. T. pseudospiralis was documented in five hunted wild boar, one wolf and one bird, confirming its low prevalence in target animals (Pozio, 2016).
It is important to underline the reporting of Trichinella‐positive domestic pigs by Bulgaria, France, Italy, Poland, Romania and Spain, which also reported human cases linked to foodborne outbreaks (to the EFSA foodborne outbreak database) and/or confirmed domestic human cases (to ECDC’s TESSy). By contrast, in other MS during the last few years, there was an increasing number of pigs raised under CHC and increased control at slaughter of pigs not raised under CHC. These measures, in combination with activities raising awareness about trichinellosis and farmers’ education, may have contributed to a reduction in the parasite biomass in domestic habitats and in the probability of acquiring an infection for humans.
Farming practices at risk of transmission of Trichinella spp. (rearing backyard or free‐ranging pigs, i.e. pigs not raised under CHC) occur, in general, in disadvantaged and poor areas where veterinary services do not exist or are unable to control many small pig units, or where veterinary supervision can be circumvented (Pozio, 2014). There are examples from the past, where countries had suitable controls in place for parasite management in domestic pigs, but where changes in pork production affected by socioeconomic conflicts resulted in the re‐emergence of trichinellosis as a serious public health problem (Djordjevic et al., 2003; Cuperlovic et al., 2005). The increasing number of wild boar and red foxes and the spread of the raccoon dog population from eastern to western Europe and of the jackal population from southern‐eastern to northern‐western Europe may increase the prevalence of Trichinella circulating among wild animals (Alban et al., 2011; Széll et al., 2013).
7.5. Related project and internet sources
| Subject | For more information see | |
|---|---|---|
| Humans | Fact sheet of trichinellosis | https://www.cdc.gov/parasites/trichinellosis/index.html |
| ECDC Surveillance Atlas of Infectious Diseases | http://ecdc.europa.eu/en/data‐tools/atlas/Pages/atlas.aspx | |
| EU case definition of trichinellosis | https://www.ecdc.europa.eu/en/surveillance‐and‐disease‐data/eu‐case‐definitions | |
| Disease Programme on Emerging, Food‐ and Vector‐Borne Diseases | https://www.ecdc.europa.eu/en/about‐us/who‐we‐are/units/disease‐programmes‐unit | |
| European Food‐ and Waterborne Diseases and Zoonoses Network (FWD‐Net) | https://ecdc.europa.eu/en/about‐us/partnerships‐and‐networks/disease‐and‐laboratory‐networks/fwd‐net | |
| International Commission on Trichinellosis. Recommendations for the Diagnosis and Control of Trichinella | https://www.sciencedirect.com/journal/food‐and‐waterborne‐parasitology/special‐issue/108PXGFN663 | |
| European Union Reference Laboratory for Parasites (humans and animals) | https://www.iss.it/en/web/iss‐en/eurlp‐about‐us | |
| Animals | World Organisation for Animal health, Summary of Information on Trichinellosis | http://www.oie.int/fileadmin/Home/eng/Media_Center/docs/pdf/Disease_cards/TRICHI‐EN.pdf |
| FAO/WHO/OIE Guidelines for the surveillance, management, prevention and control of trichinellosis | http://www.trichinellosis.org/uploads/FAO‐WHO‐OIE_Guidelines.pdf | |
| International Commission on Trichinellosis. Recommendations for the Diagnosis and Control of Trichinella | https://www.sciencedirect.com/journal/food‐and‐waterborne‐parasitology/special‐issue/108PXGFN663 | |
| Development of harmonised schemes for the monitoring and reporting of Trichinella in animals and foodstuffs in the European Union | http://www.efsa.europa.eu/sites/default/files/scientific_output/files/main_documents/35e.pdf | |
| OIE Manual Chapter 2.1.16. Trichinellosis | https://www.oie.int/fileadmin/Home/eng/Health_standards/tahm/3.01.21_TRICHINELLOSIS.pdf | |
| Commission Implementing Regulation (EU) 2015/1375 of 10 August 2015 laying down specific rules on official controls for Trichinella in meat | http://eur‐lex.europa.eu/legal‐content/EN/TXT/?uri=CELEX%3A32015R1375 | |
| Pig farming in the European Union: considerable variations from one Member State to another | http://ec.europa.eu/eurostat/statistics‐explained/index.php/Pig_farming_sector_‐_statistical_portrait_2014 | |
| Annual national zoonoses country reports (reports of reporting countries on national trends and sources of zoonoses) |
https://www.efsa.europa.eu/en/data‐report/biological‐hazards‐reports |
8. Echinococcus
Tables and figures that are not presented in this chapter are published as supporting information to this report and are available as downloadable files from the EFSA Knowledge Junction on Zenodo at
https://doi.org/10.5281/zenodo.5682809. Summary statistics of human surveillance data with downloadable files are retrievable using ECDC’s Surveillance Atlas of Infectious Diseases at http://atlas.ecdc.europa.eu/public/index.aspx

8.1. Key facts
-
•
In 2020, the number of confirmed cases of human echinococcosis from 25 EU Member States was 488, corresponding to an EU notification rate of 0.14 per 100,000 population. This is a decrease of 16.2% and 28.4% compared with the rate in 2019 (0.17 and 0.20 per 100,000 population), with and without the 2019 data from the United Kingdom, respectively. The notification rate in 2020 is the lowest since EU surveillance of Echinococcus spp. began in 2007.
-
•
Echinococcus granulosus sensu lato (s.l.) accounted for 67.8% (242) of cases reported with species information for 2020, and Echinococcus multilocularis accounted for 32.2% (115) of such cases.
-
•
The number of human cases and animal infections caused by E. multilocularis or E. granulosus s.l. showed a sudden decrease in 2020 compared to previous years (2016–2019) in the EU.
-
•
In total, 20 Member States and three non‐Member States provided 2020 monitoring data for Echinococcus spp. in animals.
-
•
Ten Member States and three non‐Member States reported data on, respectively, 5,506 and 1,999 foxes that were examined for E. multilocularis. Seven Member States and one non‐Member State reported positive findings with an overall proportion of test‐positives of 12.5%.
-
•
Data for 2019 from Finland, Ireland, Malta, the United Kingdom and mainland Norway confirmed the free status of these countries for E. multilocularis in the context of Commission Delegated Regulation (EU) No 2018/772 (EFSA and Zancanaro, 2021).
-
•
For E. granulosus s.l., 17 Member States and two non‐Member States reported data from around 76.5 million animals, which were mainly domestic livestock (> 99%), compared to 113.8 million animal results reported in 2019 by 19 Member States. The overall proportion of test‐positives was 0.16%, and positives were reported by nine Member States. Positive samples were mainly from small ruminants (sheep and goats; 85.3%), whereas cattle accounted for 11.8% of total positives, and pigs for 3%, with most (92.9%) positive pigs reported by Spain.
8.2. Surveillance and monitoring of cystic and alveolar echinococcosis in humans and animals in the EU
8.2.1. Humans
Alveolar echinococcosis (AE) caused by tapeworm Echinococcus multilocularis and cystic echinococcosis (CE) caused by E. granulosus sensu lato (s.l.) are listed under the common name ‘echinococcosis’ in the European Union’s (EU) definition of cases, thus not distinguishing between these two diseases. AE and CE can be reported by species, and since 2019 (2018 data), by clinical presentation of the disease in the ECDC TESSy database. The notification of echinococcosis in humans is mandatory in most Member States (MS), Iceland and Norway, but not in Belgium, France and the Netherlands, where reporting is based on a voluntary surveillance system. Denmark and Italy have no surveillance system for echinococcosis. The surveillance systems for echinococcosis cover the whole population in those MS where surveillance systems are in place. For 2020, Spain did not receive data from all regions due to COVID‐19, so the case numbers might not be complete. All countries reported case‐based data, except Bulgaria, which reported aggregated data. Both reporting formats were included to calculate annual numbers of cases and notification rates.
Since 1 February 2020, the United Kingdom has become a third country, whereas before it was an EU MS, which means that human data from the United Kingdom were not collected by ECDC.
Estimates of the real burden of these diseases are extremely difficult to calculate because of the long incubation period (months or years) between infection and the occurrence of symptoms, which, when present, are non‐specific. A recent cross‐sectional ultrasound‐based population survey conducted in Romania and Bulgaria, estimated that around 45,000 human CE infections occurred in rural areas in the two European countries with the highest endemicity (Tamarozzi et al., 2018).
An effort to collect harmonised clinical data in the EU on a voluntary basis is currently been made by the prospective, observational, multicentre and online ‘European Register of Cystic Echinococcosis’ (ERCE) (Rossi et al., 2016, 2020) and in the past by the European (Alveolar) Echinococcosis Registry (EurEchinoReg) (Kern et al., 2003).
8.2.2. Animals
Cestode parasite E. multilocularis in Europe is mainly transmitted to humans by a sylvatic cycle that is wildlife based (Casulli et al., 2019a). Main intermediate hosts (IHs) in the life cycle of E. multilocularis are small rodents (microtine or arvicolid), while definitive hosts (DHs) are mainly red foxes (Vulpes vulpes) and, to a lesser extent, other canids such as raccoon dogs (Nyctereutes procyonoides), jackals (Canis aureus), wolves (Canis lupus) and dogs (Canis lupus familiaris). To which extent dogs in Europe may play a relevant role in the direct (strict contact with humans of positive animals) or indirect (as egg carriers due to scent‐rolling behaviour on infected fox faeces or ingestion of contaminated fox faeces) transmission of E. multilocularis to humans is under debate (Conraths et al., 2017). E. granulosus s.l. is a complex of species causing CE, in animals and humans. E. granulosus s.l. in Europe is mainly transmitted to humans by a pastoral cycle (mainly E. granulosus sensu stricto species) and, to a lesser extent, depending on the epidemiological context and species (mainly E. canadensis), can be transmitted by wildlife (Casulli et al., 2019b). Intermediate hosts for E. granulosus s.l. are mainly livestock species (mainly sheep, secondarily pigs but also cattle and goats), while DHs are shepherd dogs or dogs having access to offal of livestock (rarely wild canids which can, however, play a role in the dispersion of eggs in new areas). People become infected with AE and CE through the ingestion of viable eggs from the tapeworms prevalent in these DHs.
Surveillance for E. multilocularis in Europe is usually carried out on a voluntary basis, with the exception of the reporting countries claiming to be free from this parasite according to the Commission Delegated Regulation (EU) 2018/772 supplementing Regulation (EU) No 576/2013. 25 Surveillance is mainly carried out in the main European DHs, red foxes and occasionally in raccoon dogs. In 2020, Finland, Ireland, mainland Norway (Svalbard archipelago excluded) and the United Kingdom have demonstrated the absence of E. multilocularis through the implementation of an annual surveillance programme required in accordance with Regulation (EU) 2018/772 (EFSA and Zancanaro, 2021). Malta, in accordance with said Regulation, is not required to implement a surveillance programme due to the absence of red fox DHs across its entire territory. In all other MS, data on E. multilocularis rely on whether findings are notifiable and if monitoring is in place or if studies on E. multilocularis are performed. As data on E. multilocularis in animals vary geographically (and also within countries) as well as over time depending on the sampling effort, reported cases of E. multilocularis are difficult to compare within and between countries. According to a meta‐analysis, based on studies published between 1900 and 2015, E. multilocularis has been documented in red foxes from 21 countries (Oksanen et al., 2016) (Figure 40). Since 2015 and 2020, this parasite has also been found in foxes and golden jackals from Croatia and Hungary, respectively (Dušek et al., 2020; Balog et al., 2021).
Figure 40.

Pooled prevalence of Echinococcus multilocularis in red and Arctic foxes within the EU and adjacent countries, depicting the current epidemiological situation in Europe (Oksanen et al., 2016)
Surveillance of E. granulosus s.l. is carried out in livestock IHs during slaughterhouse inspections. In particular, necropsy on sheep liver and lungs is used to detect the presence of parasitic cysts, while molecular PCR‐based methods are used to confirm and identify genotype/species belonging to the Echinococcus genus (Siles‐Lucas et al., 2017). Although Regulation (EU) 2018/772 is in force for E. multilocularis, no specific EU Regulation is in place for detecting E. granulosus s.l. in animals or humans, therefore surveillance for the latter parasite depends on national regulations.
The United Kingdom became a third country on 1 February 2020. Food, animal and foodborne outbreak data from the United Kingdom were still collected by EFSA for 2020 in under Zoonoses Directive 2003/99/EC, but were excluded from EU statistics.
8.3. Results
8.3.1. Overview of key statistics, EU, 2016–2020
Table 59 summarises EU‐level statistics aggregated by year for CE and AE in humans for E. granulosus s.l. and E. multilocularis in their most relevant definitive and intermediate animal hosts in 2016–2020. When the data were collected in 2020, the United Kingdom was a non‐MS.
Table 59.
Summary of echinococcosis in humans, caused by Echinococcus multilocularis or Echinococcus granulosus sensu lato (s.l.) in the most relevant definitive and intermediate animal hosts in the EU, 2016–2020
| 2020 | 2019 a | 2018 a | 2017 a | 2016 a | Data source | |
|---|---|---|---|---|---|---|
| Humans | ||||||
| Total number of confirmed cases | 488 | 766 | 814 | 850 | 844 | ECDC |
| Total number of confirmed cases/100,000 population (notification rates) | 0.14 | 0.17 | 0.21 | 0.19 | 0.22 | ECDC |
| Number of reporting MS | 25 | 26 | 25 | 26 | 25 | ECDC |
| Infection acquired in the EU | 64 | 176 | 149 | 169 | 122 | ECDC |
| Infection acquired outside the EU | 70 | 96 | 83 | 77 | 112 | ECDC |
| Unknown travel status or unknown country of infection | 354 | 494 | 582 | 604 | 610 | ECDC |
| Animals | ||||||
| Echinococcus multilocularis in red foxes | ||||||
| Number of animals tested | 5,506 | 6,326 | 6,566 | 7,148 | 4,561 | EFSA |
| % positive animals | 16.1 | 13.7 | 17.6 | 16.9 | 19.4 | EFSA |
| Number of reporting MS | 10 | 13 | 13 | 11 | 12 | EFSA |
| Echinococcus spp. in dogs | ||||||
| Number of animals tested | 2,515 | 2,113 | 2,605 | 2,538 | 2,183 | EFSA |
| % positive animals | 0.08 | 0.24 | 0.08 | 0 | 0.41 | EFSA |
| Number of reporting MS | 5 | 6 | 6 | 7 | 5 | EFSA |
| Echinococcus granulosus s.l. in cattle | ||||||
| Number of animals tested | 7,035,067 | 10,956,692 | 9,920,338 | 9,834,374 | 7,746,533 | EFSA |
| % positive animals | 0.21 | 0.09 | 0.18 | 0.17 | 0.09 | EFSA |
| Number of reporting MS | 15 | 16 | 17 | 15 | 19 | EFSA |
| Echinococcus granulosus s.l. in sheep and goats | ||||||
| Number of animals tested | 11,089,045 | 36,891,061 | 38,870,644 | 38,278,897 | 12,159,745 | EFSA |
| % positive animals | 0.96 | 0.03 | 0.21 | 0.36 | 0.91 | EFSA |
| Number of reporting MS | 12 | 15 | 15 | 14 | 13 | EFSA |
ECDC: European Centre for Disease Prevention and Control; EFSA: European Food Safety Authority; MS: Member State.
Data reported in 2016–2019 by the United Kingdom, then an EU MS, were considered. Since 1 February 2020, the United Kingdom has become a third country.
8.3.2. Human echinococcosis
In 2020, 488 confirmed echinococcosis cases were reported in the EU by 25 MS (Table 60). In contrast, a mean of 818.5 cases per year was reported in 2016–2019. In 2020, 21 MS reported at least one confirmed case and four MS reported zero cases (Ireland, Lithuania, Malta and Romania). The EU notification rate was 0.14 cases per 100,000 population, which corresponds to a decrease of 16.2% and 28.4% compared with the rate in 2019 (0.17 and 0.20 per 100,000 population) with and without the data from the United Kingdom, respectively. The notification rate in 2020 is the lowest since EU surveillance for Echinococcus spp. started in 2007. In 2020, the highest notification rate was observed in Bulgaria, with 1.4 cases per 100,000 population, followed by Luxembourg and Austria with 0.48 and 0.38 cases per 100,000 population, respectively. Germany and Bulgaria reported the highest numbers of cases, with 152 (31.1%) and 95 (19.5%) cases out of 488, respectively.
Table 60.
Reported human cases of cystic and alveolar echinococcosis and notification rates per 100,000 population in EU MS and non‐MS countries, by country and year, 2016–2020
| Country | 2020 | 2019 | 2018 | 2017 | 2016 | |||||||
|---|---|---|---|---|---|---|---|---|---|---|---|---|
| National coverage a | Data format a | Confirmed cases and rates | Confirmed cases and rates | Confirmed cases and rates | Confirmed cases and rates | Confirmed cases and rates | ||||||
| Cases | Rate | Cases | Rate | Cases | Rate | Cases | Rate | Cases | Rate | |||
| Austria | Y | C | 34 | 0.38 | 36 | 0.41 | 46 | 0.52 | 50 | 0.57 | 26 | 0.30 |
| Belgium | Y | C | 21 | 0.18 | 20 | 0.17 | 14 | 0.12 | 12 | 0.11 | 17 | 0.15 |
| Bulgaria | Y | A | 95 | 1.4 | 193 | 2.8 | 206 | 2.9 | 218 | 3.1 | 269 | 3.8 |
| Croatia | Y | C | 3 | 0.07 | 3 | 0.07 | 4 | 0.10 | 15 | 0.36 | 9 | 0.21 |
| Cyprus | Y | C | 1 | 0.11 | 0 | 0 | 0 | 0 | 0 | 0 | 0 | 0 |
| Czechia | Y | C | 4 | 0.04 | 1 | 0.01 | 4 | 0.04 | 1 | 0.01 | 4 | 0.04 |
| Denmark b | – | – | – | – | – | – | – | – | – | – | – | – |
| Estonia | Y | C | 1 | 0.08 | 2 | 0.15 | 0 | 0 | 1 | 0.08 | 0 | 0 |
| Finland c | Y | C | 4 | 0.07 | 8 | 0.14 | 1 | 0.02 | 5 | 0.09 | 4 | 0.07 |
| France | Y | C | 53 | 0.08 | 45 | 0.07 | 62 | 0.09 | 53 | 0.08 | 38 | 0.06 |
| Germany | Y | C | 152 | 0.18 | 149 | 0.18 | 176 | 0.21 | 141 | 0.17 | 181 | 0.22 |
| Greece | Y | C | 7 | 0.07 | 7 | 0.07 | 11 | 0.10 | 15 | 0.14 | 18 | 0.17 |
| Hungary | Y | C | 4 | 0.04 | 10 | 0.10 | 9 | 0.09 | 14 | 0.14 | 5 | 0.05 |
| Ireland c | Y | C | 0 | 0 | 0 | 0 | 2 | 0.04 | 0 | 0 | 2 | 0.04 |
| Italy b | – | – | – | – | – | – | – | – | – | – | – | – |
| Latvia | Y | C | 2 | 0.10 | 6 | 0.31 | 10 | 0.52 | 6 | 0.31 | 11 | 0.56 |
| Lithuania | Y | C | 0 | 0 | 81 | 2.9 | 50 | 1.8 | 53 | 1.9 | 26 | 0.90 |
| Luxembourg | Y | C | 3 | 0.48 | 1 | 0.16 | 0 | 0 | 2 | 0.34 | 0 | 0 |
| Malta c | Y | C | 0 | 0 | 0 | 0 | 0 | 0 | 0 | 0 | 1 | 0.22 |
| Netherlands | Y | A | 48 | 0.28 | 48 | 0.28 | 42 | 0.24 | 38 | 0.22 | 33 | 0.19 |
| Poland | Y | C | 18 | 0.05 | 70 | 0.18 | 51 | 0.13 | 75 | 0.20 | 64 | 0.17 |
| Portugal | Y | C | 1 | 0.01 | 5 | 0.05 | 9 | 0.09 | 2 | 0.02 | 2 | 0.02 |
| Romania | Y | C | 0 | 0 | 1 | 0.01 | 4 | 0.02 | 14 | 0.07 | 13 | 0.07 |
| Slovakia | Y | C | 3 | 0.05 | 11 | 0.20 | 10 | 0.18 | 7 | 0.13 | 4 | 0.07 |
| Slovenia | Y | C | 3 | 0.14 | 6 | 0.29 | 6 | 0.29 | 7 | 0.34 | 3 | 0.15 |
| Spain d | Y | C | 8 | – | 34 | 0.07 | 68 | 0.15 | 83 | 0.18 | 87 | 0.19 |
| Sweden | Y | C | 23 | 0.22 | 26 | 0.25 | 29 | 0.29 | 34 | 0.34 | 27 | 0.27 |
| EU Total 27 | – | – | 488 | 0.14 | 763 | 0.20 | 814 | 0.21 | 846 | 0.22 | 844 | 0.22 |
| United Kingdom c | – | – | – | – | 3 | < 0.01 | – | – | 4 | 0.01 | – | – |
| EU Total e | – | – | 488 | 0.14 | 766 | 0.17 | 814 | 0.21 | 850 | 0.19 | 844 | 0.22 |
| Iceland | Y | C | 0 | 0 | 0 | 0 | 0 | 0 | 0 | 0 | 0 | 0 |
| Norway | Y | C | 6 | 0.11 | 7 | 0.13 | 7 | 0.13 | 6 | 0.11 | 3 | 0.06 |
| Switzerland | – | – | – | – | – | – | – | – | – | – | – | – |
–: Data not reported.
: Y: yes; N: no; A: aggregated data; C: case‐based data.
No surveillance system.
Finland, Ireland, Malta, the United Kingdom and mainland Norway have been declared free of Echinococcus multilocularis.
Data not complete for 2020, rate not estimated.
Cases reported by the United Kingdom in 2016–2019 were also considered for this estimation (EU‐28). When 2016–2019 United Kingdom data were collected, the United Kingdom was an EU MS but since 1 February 2020, it has become a third country.
Most echinococcosis cases (72.5%; 354/488) were reported without data on importation and probable country of infection; 10.2% of cases reported with such information were domestic or related to travel within the EU; and 17.4% were associated with travel outside the EU. In 2020, five MS (Czechia, Estonia, Hungary, Latvia and Portugal) out of the 21 reporting MS notified that all their Echinococcus spp. infections were domestically acquired. The highest proportions of travel‐associated cases (N = 85) were reported by Germany (100%; 52 vs 0 not travel related cases), Sweden (100%; 17 vs 0 cases) and Austria (46.2%; 12 vs 14 cases). At the species level, human E. granulosus s.l. infections were more often reported as travel‐associated than human E. multilocularis infections, accounting for 93.7% (N = 59) and 6.3% (N = 4) of cases reported with such information, respectively. Among 84 travel‐associated cases of Echinococcus spp. for which the origin of infection is known, most (83.5%) were reported as originating from outside the EU, mainly from Syria (28.6%), followed by Iraq (11.9%), Afghanistan (8.3%) and Turkey (7.1%). In the EU, Romania (10.7%), Bulgaria (2.4%), Greece (2.4%) and Austria (1.2%) were reported as probable countries of infection in 14 cases.
In 2020, species information was provided for 357 confirmed echinococcosis cases (73.2%) out of 488 confirmed cases reported by 18 MS (Table 61). Human infections caused by E. multilocularis accounted for 115 cases (32.2% of cases with known species information), less than in 2017–2019 and slightly less than in 2016. For eight MS with available data in 2020 on E. multilocularis in humans, Poland was the only country with a sharp decrease of cases caused by E. multilocularis compared to 2016–2019, but this country also reported a drop in all echinococcosis cases. In 2016–2019, Germany and France reported the highest numbers of human cases caused by E. multilocularis, accounting for 40% and 36.5% of all reported E. multilocularis cases, respectively. Human infections caused by E. granulosus s.l. accounted for 67.8% (242 cases) of the cases with species information available. Most cases (39.2%; 95 cases) were from Bulgaria, followed by Germany (28.9%; 70 cases). For 18 MS with available data in 2020 on E. granulosus s.l. in humans, Bulgaria, Poland and secondarily Germany, were the main countries reporting a sharp decrease compared to 2016–2019.
Table 61.
Reported human cases of cystic and alveolar echinococcosis in EU MS and non‐MS countries, by country, year and Echinococcus species, 2016–2020
| Country | 2020 | 2019 | 2018 | 2017 | 2016 | ||||||||||
|---|---|---|---|---|---|---|---|---|---|---|---|---|---|---|---|
| Total Cases | Eg | Em | Total Cases | Eg | Em | Total Cases | Eg | Em | Total Cases | Eg | Em | Total Cases | Eg | Em | |
| Austria | 34 | 18 | 4 | 36 | 16 | 13 | 46 | 29 | 12 | 50 | 37 | 8 | 26 | 22 | 4 |
| Belgium | 21 | 10 | 10 | 20 | 12 | 8 | 14 | – | – | 12 | – | – | 17 | – | – |
| Bulgaria | 95 | 95 | 0 | 193 | 193 | 0 | 206 | 206 | 0 | 218 | 218 | 0 | 269 | 269 | 0 |
| Croatia | 3 | – | – | 3 | – | – | 4 | – | – | 15 | – | – | 9 | – | – |
| Cyprus | 1 | – | – | 0 | 0 | 0 | 0 | 0 | 0 | 0 | 0 | 0 | 0 | 0 | 0 |
| Czechia | 4 | 1 | 2 | 1 | – | – | 4 | 1 | 2 | 1 | – | – | 4 | – | – |
| Denmark a | – | – | – | – | – | – | – | – | – | – | – | – | – | – | – |
| Estonia | 1 | 1 | 0 | 2 | – | – | 0 | 0 | 0 | 1 | 0 | 1 | 0 | 0 | 0 |
| Finland b | 4 | 3 | – | 8 | 8 | 0 | 1 | 1 | 0 | 5 | 5 | 0 | 4 | 4 | 0 |
| France | 53 | 11 | 42 | 45 | 10 | 35 | 62 | 21 | 41 | 53 | 5 | 48 | 38 | 0 | 38 |
| Germany | 152 | 70 | 46 | 149 | 87 | 40 | 176 | 93 | 59 | 141 | 86 | 35 | 181 | 122 | 40 |
| Greece | 7 | 7 | 0 | 7 | – | – | 11 | – | – | 15 | – | – | 18 | – | – |
| Hungary | 4 | 1 | – | 10 | – | – | 9 | – | – | 14 | 1 | 1 | 5 | – | – |
| Ireland b | 0 | 0 | 0 | 0 | 0 | 0 | 2 | – | – | 0 | 0 | 0 | 2 | 1 | – |
| Italy a | – | – | – | – | – | – | – | – | – | – | – | – | – | – | – |
| Latvia | 2 | 2 | 0 | 6 | 4 | – | 10 | 5 | 1 | 6 | 4 | – | 11 | 1 | 1 |
| Lithuania | 0 | 0 | 0 | 81 | 30 | 21 | 50 | 11 | 17 | 53 | 19 | 20 | 26 | 5 | 10 |
| Luxembourg | 3 | 3 | 0 | 1 | 1 | 0 | 0 | 0 | 0 | 2 | 2 | 0 | 0 | 0 | 0 |
| Malta b | 0 | 0 | 0 | 0 | 0 | 0 | 0 | 0 | 0 | 0 | 0 | 0 | 1 | 1 | 0 |
| Netherlands | 48 | – | – | 48 | – | – | 42 | – | – | 38 | – | – | 33 | – | – |
| Poland | 18 | 8 | 6 | 70 | 21 | 25 | 51 | 17 | 19 | 75 | 27 | 31 | 64 | 18 | 22 |
| Portugal | 1 | 1 | 0 | 5 | 5 | 0 | 9 | 9 | 0 | 2 | – | – | 2 | 2 | 0 |
| Romania | 0 | 0 | 0 | 1 | – | – | 4 | – | – | 14 | – | – | 13 | – | – |
| Slovakia | 3 | 1 | 2 | 11 | 3 | 8 | 10 | 3 | 3 | 7 | 2 | 3 | 4 | 1 | 2 |
| Slovenia | 3 | 1 | – | 6 | 1 | – | 6 | 3 | – | 7 | – | – | 3 | – | – |
| Spain c | 8 | 1 | – | 34 | 6 | – | 68 | 12 | – | 83 | 4 | – | 87 | 1 | – |
| Sweden | 23 | 8 | 3 | 26 | 17 | 2 | 29 | 5 | 2 | 34 | 11 | 4 | 27 | 20 | 1 |
| EU Total 27 | 488 | 242 | 115 | 763 | 414 | 152 | 814 | 416 | 156 | 846 | 421 | 151 | 844 | 467 | 118 |
| United Kingdom b | – | – | – | 3 | 3 | 0 | – | – | – | 4 | 4 | 0 | – | – | – |
| EU Total d | 488 | 242 | 115 | 766 | 417 | 152 | 814 | 416 | 156 | 850 | 425 | 151 | 844 | 467 | 118 |
| Iceland | 0 | 0 | 0 | 0 | 0 | 0 | 0 | 0 | 0 | 0 | 0 | 0 | 0 | 0 | 0 |
| Norway b | 6 | 1 | 1 | 7 | 2 | – | 7 | 5 | – | 6 | 3 | 1 | 3 | 1 | – |
| Switzerland | – | – | – | – | – | – | – | – | – | – | – | – | – | – | – |
Eg: Echinococcus granulosus sensu lato; Em: Echinococcus multilocularis.
–: Data not reported.
No surveillance system.
Finland, Ireland, Malta, the United Kingdom and mainland Norway have been declared free of E. multilocularis.
Data not complete for 2020.
Cases reported from the United Kingdom in 2016–2019 were also considered for this estimation (EU‐28). When 2016–2019 United Kingdom data were collected, the United Kingdom was an EU MS, but since 1 February 2020, it has become a third country.
In 2020, 12 MS provided information on hospitalisation, covering 14.9% (73/488) of all confirmed cases of echinococcosis in the EU. The overall hospitalisation rate was 60.3%. Information on the outcome of the cases was provided by 14 MS with no deaths reported. Information on age was reported by 19 MS in 97.1% of confirmed cases, with the highest proportion (26.3%) of cases occurring in over 65‐year‐olds.
8.3.3. Echinococcus spp. in animals and food
Monitoring data for Echinococcus multilocularis
Table 62 summarises the most relevant DH and IH species tested for E. multilocularis, including foxes, raccoon dogs, dogs, jackals, wolves, cats, beavers, voles and pigs and the results reported by 14 MS and three non‐MS (Norway, Switzerland and the United Kingdom) for 2020. In accordance with Regulation (EU) 2018/772, surveillance of E. multilocularis mainly focused on red foxes as DHs.
Table 62.
Monitoring results for wild and domestic animals tested for Echinococcus multilocularis in EU MS and non‐MS countries, 2020
| Country | Presence of Em/Eg a | N Positive/N tested (% positive) | |||||||||
|---|---|---|---|---|---|---|---|---|---|---|---|
| Foxes | Racoon dogs | Wolves | Dogs | Cats | Jackals | Voles | Beavers | Pigs | Wild boars | ||
| Czechia | Em/Eg | 674/2,690 (25.1) | − | − | − | − | − | − | c | − | − |
| Denmark | Em | − | − | − | − | − | − | − | − | 0/17,509,438 (0) | − |
| Estonia | Em/Eg | − | − | − | − | − | − | − | − | 0/559,461 d (0) | − |
| Finland b | Eg | 0/216 (0) | 0/310 (0) | 0/19 (0) | − | − | − | 0/1,390 (0) | − | − | − |
| France | Em/Eg | 32/530 (6.0) | − | − | 0/434 (0) | 1/11 (9.1) | − | − | − | − | − |
| Germany | Em | 137/666 (20.6) | 0/11 (0) | − | 1/13 (7.7) | 0/1 (0) | − | − | − | 1/9 (11.1) | 7/7 (100) |
| Hungary | Em/Eg | 0/2 (0) | − | − | − | − | − | − | − | 0/31 (0) | − |
| Ireland b | Eg | 0/404 (0) | − | − | − | − | − | − | − | − | − |
| Italy | Em/Eg | 8/612 (1.3) | − | 0/68 d (0) | 0/65 d (0) | − | 0/7 (0) | − | − | 215/8,844,871 d (< 0.01) | − |
| Luxembourg | Em | 12/68 (17.6) | − | − | − | − | − | − | − | 0/121,966 (0) | − |
| Romania | Em/Eg | − | − | − | − | − | − | − | 0/76 d (0) | − | |
| Slovakia | Em/Eg | 4/79 (5.1) | − | − | 0/1,999 (0) | 0/670 d (0) | − | − | − | 18/689,446 d (< 0.01) | − |
| Slovenia | Em/Eg | − | − | − | − | − | − | − | − | 0/245,921 d (0) | − |
| Sweden | Em/Eg | 19/239 (7.9) | − | 0/29 d (0) | 0/3 d (0) | 0/1 (0) | − | − | − | 0/2,622,800 d (0) | − |
| EU Total | 886/5,506 (16.1) | 0/321 (0) | 0/116 (0) | 1/2,514 (0.04) | 1/683 (0.15) | 0/7 (0) | 0/1,390 (0) | 0 | 234/30,594,019 (< 0.01) | 7/7 (100) | |
| Norway(b)(c) | Eg | 0/532 (0) | − | − | − | − | − | − | − | − | − |
| Switzerland | Em | 54/109 (49.5) | − | 1/2 (50.0) | 10/24 (41.7) | 0/1 (0) | − | − | 2/2 (100) | 2/4 (50.0) | − |
| United Kingdom b | Eg | 0/1,358 (0) | − | − | − | − | − | − | − | − | − |
| Total non‐EU countries | 54/1,999 (2.7) | 0 | 1/2 (50.0) | 10/24 (41.7) | 0/1 (0) | 0 | 0 | 2/2 (100) | 2/4 (50.0) | 0 | |
| Total EU + non‐EU countries | 940/7,505 (12.5) | 0/321 (0) | 1/118 (0.80) | 11/2,538 (0.43) | 1/684 (0.15) | 0/7 (0) | 0/1,390 (0) | 2/2 (100) | 236/30,594,023 (< 0.01) | 7/7 (100) | |
–: Data not reported.
Presence in the country of Echinococcus multilocularis (Em) and/or Echinococcus granulosus sensu lato (Eg).
Member States listed in the Annex to Commission Implementing Regulation (EU) 2018/878 on the application of preventive health measures for the control of E. multilocularis infection in dogs.
Mainland Norway (Svalbard archipelago excluded where E. multilocularis was documented).
Positive samples from dogs, cats, wolves and pigs without Echinococcus species information reported, were mentioned in the table only for countries with known circulation of both E. multilocularis and E. granulosus sensu lato.
In total, 10 MS and three non‐MS (Norway, Switzerland and the United Kingdom) reported 2020 monitoring data from 5,506 and 1,999 foxes examined for E. multilocularis, respectively. Seven MS and one non‐MS (Switzerland) reported a total of 12.5% positive samples: Czechia (25.1%), France (6.4%), Germany (20.6%), Italy (1.3%), Luxembourg (17.6%), Slovakia (5.1%), Sweden (7.9%) and Switzerland (49.5%). Czechia (N = 674) reported the greatest number of infected foxes in Europe, accounting for 68.6% of positive findings.
In addition to foxes as DHs, Echinococcus spp. has been reported in 14 wolves (11 from Finland as E. canadensis, G10 genotype; two from Italy as E. granulosus s.l.; one from Switzerland as Echinococcus unspecified), 12 dogs (one from Germany as E. multilocularis; one from Italy as E. granulosus s.l.; 10 from Switzerland as E. multilocularis), one cat from France (E. multilocularis) and two beavers from Switzerland (E. multilocularis).
Moreover, 233 positive pigs were reported by two MS co‐endemic for both Echinococcus species: Italy, with 204 Echinococcus unspecified and 11 E. granulosus s.l., and Slovakia, with 18 Echinococcus unspecified. Pigs positive for E. multilocularis were reported by Germany (one) and Switzerland (two). It should also be emphasised that pigs are good hosts for E. granulosus s.l., while E. multilocularis metacestodes in pigs are abortive, and their presence is often used as sentinel for the circulation of this parasite in animal hosts, as demonstrated in Switzerland (Meyer et al., 2020). For this reason, the presence of both E. multilocularis and E. granulosus s.l. may be overestimated in co‐endemic countries with unknown species identification. In this context, it should also be noted that positive samples from pigs, as well as dogs and wolves without species identification were only mentioned in Table 62 and/or Table 63 for countries with known circulation of both E. granulosus s.l. and E. multilocularis.
Table 63.
Monitoring results from wild and domestic animals tested for Echinococcus granulosus sensu lato in EU MS and non‐MS, 2020
| Country | Presence of Em/Egsl a | N Positive/N tested (% positive) | |||||||||||||
|---|---|---|---|---|---|---|---|---|---|---|---|---|---|---|---|
| Sheep | Goats | Water buffalos | Cattle (bovine animals) | Pigs | Wolves | Cats | Dogs | Wild boars | Deer | Reindeer | Domestic solipeds | Moose | Mouflons | ||
| Belgium b | Em | − | − | − | 0/785,559 (0) | − | − | − | − | − | − | − | − | − | − |
| Cyprus | Egsl | − | − | − | − | − | − | − | − | − | − | − | − | − | 0/23 (0) |
| Denmark b | Em | − | − | − | 0/448,100 (0) | − | − | − | − | − | − | − | − | − | − |
| Estonia | Em/Egsl | 0/8,957 (0) | 0/211 (0) | − | 0/35,278 (0) | 0/559,461 c (0) | − | − | − | − | − | − | 0/9 (0) | − | − |
| Finland | Egsl | 0/62,724 (0) | 0/612 (0) | − | 0/260,874 (0) | 0/1,918,442 (0) | 11/30 (36.7) | − | − | 0/165 (0) | 0/1,845 (0) | 3/41,978 (0.01) | 0/817 (0) | 1/234 (0.43) | − |
| Germany | Em | 1/2 (50.0) | − | − | 0/10 (0) | 0/8 (0) | − | 0/1 (0) | − | − | − | − | − | − | − |
| Greece | Egsl | 10,849/841,461 (1.3) | 2,875/257,318 (1.1) | − | 449/86,757 (0.52) | 31/503,585 (0.01) | − | − | − | − | − | − | − | − | − |
| Hungary | Em/Egsl | − | − | − | 1/1 (100) | 1/32 (3.1) | − | − | − | − | − | − | − | − | − |
| Italy | Em/Egsl | 60,608/933,297 (6.5) | 840/71,367 (1.2) | 21/36,471 (0.06) | 2,972/2,455,722 (0.12) | 215/8,844,871 c (< 0.01) | 2/70 (2.9) | − | 1/66 (1.5) | 8/31,013 (0.03) | 0/4 (0) | − | 0/754 (0) | − | − |
| Latvia | Em/Egsl | 0/33,179 (0) | 0/606 (0) | − | 0/71,419 (0) | 0/507,155 (0) | − | − | − | − | − | − | 0/71 (0) | − | − |
| Luxembourg b | Em | − | − | − |
0/26,575 (0) |
− | − | − | − | − | − | − | − | − | − |
| Malta | Egsl | 0/6,530 (0) | − | − | − | − | − | − | − | − | − | − | − | − | − |
| Romania | Em/Egsl | 2/9 (22.2) | 0/2 (0) | − | 15/18 (83.3) | 0/76 c (0) | − | − | − | − | − | − | − | − | − |
| Slovakia | Em/Egsl | 136/51,719 (0.26) | 0/108 (0) | − | 0/36,656 (0) | 18/689,446 c (< 0.01) | − | 0/670 c (0) | − | − | − | − | − | − | − |
| Slovenia | Em/Egsl | 0/9,519 (0) | 0/1,130 (0) | − | 1/118,245 (< 0.01) | 0/245,921 c (0) | − | − | − | − | − | − | 0/1,078 (0) | − | − |
| Spain | Egsl | 28,345/7,636,095 (0.37) | 3,056/932,659 (0.33) | − | 11,148/2,275,403 (0.49) | 3,476/40,312,152 (0.01) | − | − | − | 6/126,921 (< 0.01) | 0/168,554 (0) | − | 1/7,926 (0.01) | − | 0/5,233 (0) |
| Sweden | Em/Egsl | 0/240,540 (0) | 0/1,000 (0) | − | 0/434,450 (0) | 0/2,622,800 c (0) |
0/29 c (0) |
− |
0/3 c (0) |
0/16,639 (0) | 0/6,410 (0) | 0/49,631 (0) | 0/1,530 (0) | − | − |
| EU Total | 99,941/9,824,032 (1.0) | 6,771/1,265,013 (0.54) | 21/36,471 (0.06) | 14,586/7,035,067 (0.21) | 3,741/56,203,949 (0.01) | 13/129 (10.1) | 0/671 (0) | 1/69 (1.5) | 14/174,738 (0.01) | 0/176,813 (0) | 3/91,609 (< 0.01) | 1/12,185 (0.01) | 1/234 (0.43) | 0/5,256 (0) | |
| Norway | Egsl | 0/1,192,600 (0) | 0/25,320 (0) | − | 0/294,900 (0) | 0/154,300 (0) | − | − | − | − | − | − | − | − | − |
| Switzerland b | Em | − | − | − | 0/2 (0) | − | 1/2 (50.0) | 0/1 (0) | − | − | − | − | − | − | − |
| Total non‐EU countries | 0/ 1,192,600 (0) | 0/25,320 (0) | 0 | 0/294,902 (0) | 0/154,300 (0) | 1/2 (50.0) | 0/1 (0) | 0 | 0 | 0 | 0 | 0 | 0 | 0 | |
| Total EU + non‐EU countries | 99,941/11,016,632 (0.91) | 6,771/1,290,333 (0.52) | 21/36,471 (0.06) | 14,586/7,329,969 (0.20) | 3,741/56,358,249 (0.01) | 14/131 (10.7) | 0/672 (0) | 1/69 (1.5) | 14/174,738 (0.01) | 0/176,813 (0) | 3/91,609 (< 0.01) | 1/12,185 (0.01) | 1/234 (0.43) | 0/5,256 (0) | |
–: Data not reported; EU: European Union.
Presence in the country of E. multilocularis (Em) and/or E. granulosus sensu lato (Eg).
Reporting countries with known circulation of E. multilocularis only and which tested suitable hosts for E. granulosus sensu lato.
Positive samples from dogs, cats, wolves and pigs without Echinococcus species information reported, were mentioned in the table only for MS with known circulation of both E. multilocularis and E. granulosus sensu lato.
Concerning E. multilocularis in food, France reported the presence of three E. multilocularis‐positive lettuces out of 106 tested (2.8%). It should be emphasised that the identification of DNA of E. multilocularis in vegetables does not imply that parasite eggs are viable for infection.
Monitoring data for Echinococcus granulosus sensu lato
In total, 17 MS and two non‐MS (Norway, Switzerland) reported monitoring data for E. granulosus s.l. The data reported were from 76,493,367 domestic and wild animals tested for E. granulosus s.l. in 2020, of which more than 99% were domestic animals (sheep, cattle, goats, pigs, horses, water buffalos, dogs and cats) (Table 63). A large proportion of these data were obtained from domestic livestock during meat inspections at the slaughterhouse. Wild animals tested included deer, reindeer, moose, mouflons, wild boars and wolves. Nine MS reported a total of 125,101 (0.16%) positive samples, mainly from domestic animals. These positive samples were mainly reported by Greece, Italy and Spain from small ruminants (sheep and goats; N = 106,573; 85.3%), accounting for between 0.33% and 6.5% of positives. There were 14,586 positive cattle (11.8% of animals positive for E. granulosus s.l.) reported by Greece, Hungary, Italy, Romania, Slovenia and Spain, and 3,742 positive pigs (3% of animals positive for E. granulosus s.l.), of which 92.9% were reported by Spain.
In 2020, fewer animals were tested for Echinococcus spp. (76.49 million) compared to 2019 (113.8 million) and previous years (2016–2018).
Belgium, Cyprus, Denmark, Estonia, Ireland, Latvia and Malta among MS and Norway and the United Kingdom among non‐MS, did not report any positive findings for E. multilocularis or for E. granulosus s.l. Austria, Bulgaria, Croatia, Lithuania, the Netherlands, Poland and Portugal did not report any animal monitoring data for E. multilocularis or E. granulosus s.l. Therefore, these countries were not listed in Table 62.
Figures 41 and 42 show for the period between 2016 and 2020, respectively, the cumulative proportion of positive samples from different IHs of E. granulosus s.l. and their geographical distribution in EU MS and other European countries. Small ruminants (sheep and goats) accounted for 80.2% (2016–2020) of all positive samples, respectively. Positive sheep and goat (2016–2020) samples were reported from a few countries with large animal populations (Greece, Italy and Spain). Positive cattle (10.1%; 2016–2020) were also mainly reported by Greece, Italy and Spain. Positive pigs (9.7%; 2016–2020) were mainly reported by Spain, secondarily by Italy.
Figure 41.

Cumulative proportion (%) of test‐positive animals for Echinococcus granulosus sensu lato, by intermediate host species, in EU MS and other European countries, 2016–2020
Figure 42.

- Intermediate hosts included on the map are cattle, deer, goats, horses, moose, mouflons, pigs, reindeer, sheep, water buffalos and wild boars. Because of the co‐endemicity with Echinococcus multilocularis, pigs were excluded from Poland, Romania, Slovakia and Slovenia data when Echinococcus species information was not reported.
As shown in Figure 42, Bulgaria, Greece, Italy, Poland, Romania, Spain and the United Kingdom were the countries with the highest endemicity for Echinococcus granulosus s.l. in the EU in 2016–2020.
The total number of animals that were reported positive for E. granulosus s.l. was 888,087, split between positive sheep (N = 629,815), goats (N = 72,657), pigs (N = 85,864), cattle (N = 89,921), sheep and goats (N = 9,067), wild boars (N = 233), water buffalos (N = 399), domestic solipeds (N = 25), deer (N = 72), reindeer (N = 24), moose (N = 8) and mouflons (N = 2). Positive pigs include both E. granulosus s.l. and Echinococcus unspecified. For this reason, positive pigs may be overestimated in co‐endemic countries with E. multilocularis.
8.4. Discussion
In 2020, 488 confirmed human cases of cystic (CE) and alveolar echinococcosis (AE) were reported by EU MS. Human CE and AE, caused, respectively, by E. granulosus s.l. and E. multilocularis, can be reported separately to the ECDC TESSy database even though in the EU’s case definition, ‘echinococcosis’ includes both these diseases. In fact, differentiation between infections with E. granulosus s.l. and E. multilocularis is needed because the two diseases require different clinical management, as well as distinct strategies for their surveillance and control.
From 2008 to 2020, most MS reported species information. Moreover, since 2018, a few countries have also reported clinical presentations, which helps distinguish between the two diseases. Since the surveillance of human echinococcosis began in the EU in 2007, CE has been more frequently reported than AE, as expected according to data reported in the scientific literature for Europe.
The EU notification rate of confirmed human echinococcosis cases was stable until 2019, while in 2020 EU notification rates for infections caused by Echinococcus species decreased notably, compared to the previous 4 years. In a few countries, the increase in the number of cases in the last few years could be explained by increased surveillance and improved notification systems for these diseases. Increased awareness of the diseases among clinicians and immigration of people from endemic countries may also have influenced the number of diagnosed cases in some countries (Richter et al., 2019). It should be emphasised that the true prevalence of these diseases is extremely difficult to estimate due to the long incubation period (AE and CE), high proportion of asymptomatic or paucisymptomatic carriers, who never seek medical attention (CE), non‐specific symptoms (AE and CE) and under‐reporting/misdiagnosed cases (AE and CE). The above‐mentioned factors contribute to their neglected status (Casulli, 2020). For these reasons, the patchy data reported by MS on the number of people with echinococcosis, currently represent the ‘tip of the iceberg’ of infections, with asymptomatic carriers and misdiagnosed cases of CE/AE making up the invisible portion. In fact, it has been estimated that official data reported from hospital records should be much higher, with true values 10 and 700 times greater for Bulgaria and Romania, respectively (Tamarozzi et al., 2018).
In 2020, 20 MS reported monitoring data on E. granulosus s.l. and E. multilocularis in animals. The highest numbers of animals infected with E. granulosus s.l. were reported in Spain, Greece and Italy, and mainly observed in sheep IHs. Most of the animals (mainly red foxes) infected with E. multilocularis were reported from Czechia, as well as from France, Germany and Switzerland. The surveillance of E. multilocularis in foxes is important to assess the prevalence of AE in Europe, as its geographical distribution seems to have widened in the last decades. Whether the increased geographical distribution of E. multilocularis is due to an increased fox population in Europe (Oksanen et al., 2016), or to the expansion of their habitat to urban areas (Deplazes et al., 2004), or whether it reflects an increased surveillance effort, is difficult to disentangle, as there is a general lack of baseline data and standardised detection methods. Also, in animals, notification is a requirement for obtaining reliable data, and information on parasite speciation is very important for risk management efforts, as E. granulosus s.l. and E. multilocularis have a different epidemiology and pose different health risks for humans (Possenti et al., 2016; Conraths et al., 2017; Casulli, 2020). For E. granulosus s.l., a notification requirement would ensure that comparable data between MS are obtained from meat inspections of food‐producing animals. For E. multilocularis, while the need for a general notification for all MS can be questioned, it is required in countries free from this parasite, in accordance with Regulation (EU) No 2018/772.
In general terms, it should be emphasised that findings from most endemic countries fluctuated from year to year in 2016–2019, but positive findings in animals and humans were reported in most years. The fluctuations in 2016–2019 are probably associated with investigational efforts performed in a particular year, rather than reflecting a change in true prevalence. Unlike previous reports, animal and human findings for 2020 have drastically decreased when compared to recent years (2016–2019). This finding may be partially explained by the United Kingdom exiting the EU. In fact, in 2019 the United Kingdom accounted for 68.8%, 37.2% and 12.5% of all EU tested sheep/goats, cattle and foxes, respectively. Concerning human echinococcosis, the United Kingdom contributed marginally only three (0.4%) out of 766 diagnosed cases in the EU in 2019.
In general terms, the decrease in notification rates for 2020, both in the number of all examined animals (33.6% decrease compared to animals tested in 2019; 75.5 vs. 113.8 million animals tested in 2019) and in the number of positive human cases reported (40.4% decrease compared to the mean for 2016–2019; 488 vs. x = 818.5 human cases), as well as the unexpected lack of data from some endemic countries (in particular highly endemic Bulgaria and Poland) suggest that the COVID‐19 pandemic probably affected the reporting of echinococcosis to the European surveillance systems.
8.5. Related projects and Internet sources
| Subject | For more information see | |
|---|---|---|
| Humans | Fact sheet on echinococcosis | https://www.cdc.gov/parasites/echinococcosis/index.html |
| ECDC Surveillance Atlas of Infectious Diseases | http://ecdc.europa.eu/en/data‐tools/atlas/Pages/atlas.aspx | |
| EU case definition of echinococcosis | https://www.ecdc.europa.eu/en/surveillance‐and‐disease‐data/eu‐case‐definitions | |
| Disease Programme on Emerging, Food‐ and Vector‐Borne Diseases | https://www.ecdc.europa.eu/en/about‐us/who‐we‐are/units/disease‐programmes‐unit | |
| European Food‐ and Waterborne Diseases and Zoonoses Network (FWD‐Net) | https://ecdc.europa.eu/en/about‐us/partnerships‐and‐networks/disease‐and‐laboratory‐networks/fwd‐net | |
| EFSA BIOHAZ Panel (EFSA Panel on Biological Hazards) | https://doi.org/10.2903/j.efsa.2018.5495 | |
| World Health Organisation – Echinococcosis fact sheet | http://www.who.int/echinococcosis/en/ | |
| New approach needed to tackle parasitic liver disease in Europe and Turkey | http://www.who.int/neglected_diseases/news/new‐approach‐needeed‐to‐tackle‐echinococcosis‐europe/en/ | |
| Prevalence of abdominal cystic echinococcosis in rural Bulgaria, Romania and Turkey: a cross‐sectional, ultrasound‐based, population study | https://www.sciencedirect.com/science/article/pii/S1473309918302214?via%3Dihub | |
| Human cystic Echinococcosis ReseArch in CentraL and Eastern Societies (HERACLES project) | http://www.heracles‐fp7.eu/index.html | |
| European Register of Cystic Echinococcosis (ERCE) | http://www.heracles‐fp7.eu/erce.html | |
| Humans and animals | WHO/OIE Manual on Echinococcosis in Humans and Animals: a Public Health Problem of Global Concern | http://apps.who.int/iris/bitstream/10665/42427/1/929044522X.pdf |
| OIE Manual, Chapter 3.1.6. Echinococcosis (infection with Echinococcus granulosus and with E. multilocularis) | https://www.oie.int/fileadmin/Home/eng/Health_standards/tahm/3.01.06_ECHINOCOCCOSIS.pdf | |
| COMMISSION DELEGATED REGULATION (EU) No 1152/2011 (preventive health measures for the control of Echinococcus multilocularis infection in dogs) | http://eur‐lex.europa.eu/legal‐content/EN/ALL/?uri=CELEX%3A32011R1152 | |
|
European Union Reference Laboratory for Parasites (humans and animals) WHO Collaborating Centre for the Epidemiology, Detection and Control of Cystic and Alveolar Echinococcosis |
https://www.iss.it/en/web/iss‐en/who‐cc‐for‐cystic‐and‐alveolar‐echinococcosis |
|
| Animals | EFSA Scientific Opinion: Echinococcus multilocularis infection in animals (Panel on Animal Health and Welfare) | http://onlinelibrary.wiley.com/doi/10.2903/j.efsa.2015.4373/pdf |
| EFSA External Scientific Report: Echinococcus multilocularis infection in animals GP/EFSA/AHAW/2012/01 | http://onlinelibrary.wiley.com/doi/10.2903/sp.efsa.2015.EN‐882/pdf | |
| Annual national zoonoses country reports (reports of reporting countries on national trends and sources of zoonoses) |
https://www.efsa.europa.eu/en/data‐report/biological‐hazards‐reports |
|
| MEME: Multi‐centre study on Echinococcus multilocularis and Echinococcus granulosus s.l. in Europe: development and harmonisation of diagnostic methods in the food chain (One Health EJP) | https://onehealthejp.eu/jrp‐meme/ | |
| EFSA Scientific Opinion: Public health risks associated with foodborne parasites | https://efsa.onlinelibrary.wiley.com/doi/epdf/10.2903/j.efsa.2018.5495 |
foodborne outbreaks (according to Directive 2003/99/EC)
Tables and figures that are not presented in this chapter are published as supporting information to this report and are available as downloadable files from the EFSA Knowledge Junction on Zenodo at https://doi.org/10.5281/zenodo.5682809.
1. Key facts
-
•
In 2020, 3,086 foodborne outbreaks, 20,017 cases of illness, 1,675 hospitalisations and 34 deaths were reported by 27 EU MS. In addition, 57 outbreaks, 1,496 cases of illness, 155 hospitalisations and 14 deaths were communicated by seven non‐MS.
-
•
In 2020, the number of reported outbreaks dropped compared to 2019 by 47% (5,823 in 2019), with human cases falling by 61.3% (51,694 in 2019), hospitalisations by 60.0% (4,298 in 2019) and deaths by 43.3% (60 in 2019). These findings are mainly attributable to the indirect consequences of the COVID‐19 pandemic among EU populations leading to a reduced exposure of people to contaminated food and a higher under‐reporting of outbreaks. The withdrawal of the United Kingdom from the EU contributed only marginally to the decrease.
-
•
In 2020, the foodborne outbreak reporting rate in the EU was 0.69 per 100,000 population. This is equivalent to a decrease of 39.3% and 46.6% compared with the rate in 2019 (1.1 and 1.3 per 100,000 population, respectively), with and without the 2019 data from the United Kingdom, respectively.
-
•
The fall in foodborne outbreaks did not affect all causative agents equally. The number of outbreaks caused by agents associated with severe clinical conditions in humans such as botulisms, listeriosis, trichinellosis and Shiga toxin‐producing E. coli infections decreased less than those caused by other agents or did not even decrease at all. foodborne outbreaks caused by norovirus and Hepatitis A decreased sharply by 72% and 65%, respectively, in 2020 (130 and 7, respectively) compared to 2019 (458 and 20, respectively).
-
•
Although the number of fatal cases in 2020 was lower than in 2019, the death toll caused by foodborne outbreaks in Europe was high, with 34 deaths in MS and 14 deaths in non‐MS. L. monocytogenes was associated with 30 fatal cases (62.5%) and Salmonella with 8 (16.7%).
-
•
Salmonella was the agent most frequently identified in foodborne outbreaks in the EU (N = 694), accounting for 22.5% of total outbreaks. Salmonella caused the highest number of cases (N = 3,686; 18.4% of the total) and hospitalisations (N = 812; 48.5% of all outbreak‐associated hospitalisations). S. Enteritidis was the predominant serovar (N = 402; 82.4% of outbreaks).
-
•
One major finding emerging from the analysis of 2020 outbreak data is the progressive increase in the case fatality and hospitalisation rate connected with L. monocytogenes. This is a reason for concern given the multi‐faceted epidemiology of this agent. In 2020, a wide variety of food vehicles were implicated in listeriosis outbreaks, including smoked fish and other fish products, meat and meat products and soft cheese.
-
•
The number of strong‐evidence outbreaks in 2020 totalled 248 (8.0% of all reported foodborne outbreaks). Food vehicles of animal origin (i.e. fish, meat and products thereof, milk, cheese and dairy products, etc.) were implicated in most of these outbreaks (65.7%). The most frequently reported agent/food pairs in outbreaks caused by food of animal origin were: Salmonella in ‘eggs and egg products’ and norovirus in ‘crustaceans, shellfish, molluscs and products thereof’.
-
•
Composite foods or multi‐ingredient foods including ‘mixed food’ were responsible for the highest number of illnesses in strong‐evidence outbreaks (21% of all cases, one in five) and were associated with a wide range of causative agents.
-
•
Among the higher risk foods, ‘water’ ranked first in 2020 as the main vehicle implicated in strong‐evidence outbreaks caused by Shiga toxin‐producing E. coli.
-
•
In 2020 overall, most outbreaks concerned public catering and restaurants, pubs, street vendors, takeaway and canteens. However, a similar number of outbreaks were reported in domestic settings. These findings underline the importance of correctly implementing HACCP in public catering, and also of educating consumers on preparing and storing food in domestic kitchens.
-
•
With the present report, EFSA has also published two new interactive communication tools on foodborne outbreaks: the EFSA story map (available here) and the dashboard (available here).
2. Surveillance and monitoring of foodborne outbreaks in the EU
Every year, EU Member States (MS) and non‐MS countries collect information on foodborne and waterborne outbreaks (FBO), for reporting to EFSA. The aim is to characterise the epidemiology and the health impact of FBO in Europe. EFSA is assigned the tasks of analysing the data in order to describe the causative agents and the foodstuffs implicated in the FBO along with their time trends. Context data including information on the places of exposure and risk factors underlying the potential contamination of foodstuffs implicated in FBO are also described. Data are reported according to the standard defined in the guidance documents, published annually by EFSA (EFSA, 2021a,b).
Data reporting is mandatory for EU MS, in compliance with Directive 2003/99/EC. The current system is known as European Union foodborne Reporting System (EU‐FORS). It has been implemented since 2010 and was updated in 2014 (EFSA, 2014). The EU‐FORS applies to outbreaks caused by bacteria, viruses, parasites, algae, fungi and their products, such as toxins and biological amines (e.g. histamine), either typical foodborne agents or agents for which the foodborne transmission is usually accidental. Outbreaks caused by the ingestion of drinking water are also considered in FBO reporting, since drinking water is defined as a food in Regulation (EC) No 178/2002.
Outbreaks are categorised as having ‘strong evidence’ or ‘weak evidence’ based on the strength of evidence implicating a suspected food vehicle as the cause of the outbreak (EFSA, 2014). The strength of evidence is a qualitative measure of the uncertainty that a given food item is the true vehicle of the outbreak. Its assessment is based on multiple types of evidence linking the suspect food to illnesses and exposure (i.e. microbiological, epidemiological, descriptive, environmental, based on traceability (tracing back/forward) of the investigated foodstuffs). The EU‐FORS and the last published manual for reporting on FBO provide guidance for assessing and reporting the strength of evidence (EFSA, 2014, 2021a). For strong‐evidence outbreaks, MS shall report a detailed data set describing the implicated food vehicle, contributory factors and source. This is not compulsory for weak‐evidence outbreaks.
A description of the national system in place for outbreak surveillance and reporting in the countries can be found in the national zoonoses reports submitted in accordance with Directive 2003/99/EC, which is published on the EFSA website together with the EU One Health Zoonoses Report, both available online at http://www.efsa.europa.eu/en/biological‐hazards‐data/reports.
Link to EFSA story map on FBO (see story map sections on ‘who investigates foodborne outbreaks’, ‘EU regulatory framework and the role of EFSA’ and ‘what foodborne outbreaks are and how they are classified’).
EFSA story map on foodborne outbreaks
The EFSA story map on foodborne outbreaks is a new interactive communication tool developed by EFSA in 2021, available on‐line (link here) and dedicated to the general public. This story map provides general information on foodborne outbreaks, their causative agents and the implicated vehicle. It also looks at several aspects of foodborne outbreaks including investigation of FBO in Member States and at international level. Users can easily display and explore the content of the stories dedicated to FBO, browsing the dynamic maps, images, text and multimedia features. Links to the Story Map are available in the relevant sections of the present chapter.
3. Data analyses
The key summary statistics for all reported FBO are summarised in figures and tables. The impact of FBO on public health is described in terms of the total number of outbreaks and reporting rate (per 100,000 population), the number of cases (of illness), the number of hospitalisations (% of hospitalisation), the number of deaths (% deaths), mean outbreak size (cases per outbreak) and range of cases per outbreak (minimum and maximum).
The description of food vehicles implicated in FBO, the places of exposure to contaminated food and the risk factors refer to strong‐evidence FBO only, in order to limit the level of uncertainty. Information on suspected food vehicles and places of exposure is also summarised separately for weak‐evidence FBO. In all the sections, outbreaks associated with the consumption of contaminated water are considered FBO as drinking water is defined as a food according to the EU legislation. Moreover, a dedicated section on waterborne outbreaks has been included at the end of the chapter to summarise the details of these outbreaks.
To optimise the description of the findings and avoid sparsity of data, the causative agents, food vehicles and outbreak settings are grouped where necessary, in particular for a graphic presentation of the findings. In this case, details concerning single entities included in the group are described in the footnotes to the graphical objects or tables.
The causative agents implicated in FBO are grouped on the basis of the description provided by MS and in compliance with the following criteria:
-
–
‘E. coli other than STEC’ includes E. coli other than ‘Shiga Toxin‐producing E. coli (STEC)’
-
–
‘Bacillus cereus toxins’ includes ‘B. cereus’ and ‘B. cereus’ enterotoxins’
-
–
‘Staphylococcus aureus toxins’’ includes ‘S. aureus’, ‘Staphylococcus unspecified’ and ‘Staphylococcal enterotoxins’
-
–
‘C. perfringens toxins’ includes ‘Clostridium unspecified’ and ‘C. perfringens’
-
–
‘Norovirus and other caliciviruses’ includes ‘calicivirus, unspecified’, ‘norovirus’ and ‘sapovirus’
Food vehicles have been grouped according to the general criteria adopted by EFSA for presenting the data in this report. It is important to underline that the data catalogue for food vehicle descriptions was significantly expanded in 2020 in order to allow MS to report specific details on the implicated food.
Places of exposure have been grouped according to the general characteristics and level of risk associated with the setting, as well as the process behind food preparation.
In the tables and figures, the basic statistics used to describe outbreaks are counts (numbers), sums and proportions (%). The mean annual rate of reported outbreaks per 100,000 population (‘outbreak reporting rate’) is calculated to compare MS independently of demographic size and its variations over time. For this purpose, Eurostat data on the resident population were used (updated on 1 January 2021). Populations of MS not providing data on FBO were excluded from this calculation.
Variations over time are described through a comparison with different time frames. FBO reporting rates are described for both 2020 and 2010–2019 in the main tables displaying key statistics at EU level (Table 64). These indicators are displayed with and without data from the United Kingdom, to measure the impact of the withdrawal of the United Kingdom from the EU. Key statistics on FBO for 2019 may differ from those published in the European Union One Health 2019 Zoonoses Report, following a delay in reporting from one MS (Slovakia). Short‐term variations are shown at EU and single country level as absolute and relative (%) with the 2020/2019 difference. Long‐term variations are also described, taking the years 2010–2020 as the period of comparison. Frequency distributions and trends are shown at EU level. Trend analysis is carried out only at MS level, according to the rationale described in Boelaert et al. (2016) for data quality. Time trends were tested for statistical significance over the period 2010–2020 using the Cox‐Stuart sign test, a nonparametric test appropriate for limited numbers of observations. A p‐value < 0.05 was considered to identify a statistically significant trend, beyond chance. However, the detection of significant trends at country level should be interpreted with caution, following changes in the reporting specifications for FBO which were introduced in 2014 (EFSA, 2014).
EFSA dashboard on foodborne outbreaks.
The EFSA dashboard on foodborne outbreaks (available online here) is a graphical user interface that allows searching and querying the large amount of data on foodborne outbreaks collected each year by EFSA from EU MS and other reporting countries based on the Zoonoses Directive 2003/99/EC. The FBO dashboard shows the number of outbreaks, human cases, hospitalisations and deaths, grouped by one or more attributes into separate friendly visualisations. Information on the following attributes are available in the dashboard: reporting year, strength of evidence, type of outbreak, reporting country, causative agent, food vehicle and place of exposure. The foodborne outbreak data (since 2015) and related statistics can be displayed interactively using charts, graphs and maps in the online EFSA dashboard. In the dashboard, the main statistics can also be visualised (and downloaded) in a tabular format. Detailed information on the use and functionalities of the FBO dashboard can be found in the user guide available in zenodo (https://doi.org/10.5281/zenodo.5761142) and downloadable from the online tool. Links to the dashboard are available in the relevant sections of this chapter.
Table 64.
Number of foodborne outbreaks, human cases, hospitalisations and deaths, in reporting EU MS and non‐MS countries, 2020
| Country | Strong‐evidence outbreaks | Weak‐evidence outbreaks | Total outbreaks | Total cases | Mean outbreak size (N cases) and range (min–max) | Outbreak Reporting Rate per 100,000 | |||||||||
|---|---|---|---|---|---|---|---|---|---|---|---|---|---|---|---|
| N | Cases | Hospitalised | Deaths | N | Cases | Hospitalised | Deaths | N | % of total | N | % of total | 2020 | 2010–2019 | ||
| Austria | 3 | 17 | 6 | 0 | 18 | 50 | 11 | 0 | 21 | 0.7 | 67 | 0.3 | 3.2 (2–12) | 0.24 | 1.30 |
| Belgium | 5 | 187 | 4 | 0 | 326 | 1,072 | 20 | 1 | 331 | 10.7 | 1,259 | 6.3 | 3.8 (2–151) | 2.87 | 3.02 |
| Bulgaria | 0 | 0 | 0 | 0 | 6 | 144 | 1 | 0 | 6 | 0.2 | 144 | 0.7 | 24 (6–101) | 0.09 | 0.16 |
| Croatia | 1 | 3 | 1 | 0 | 12 | 92 | 17 | 0 | 13 | 0.4 | 95 | 0.5 | 7.3 (2–43) | 0.32 | 1.14 |
| Cyprus | 0 | 0 | 0 | 0 | 1 | 12 | 0 | 0 | 1 | < 0.1 | 12 | 0.1 | 12 (–) | 0.11 | 0.26 |
| Czechia | 0 | 0 | 0 | 0 | 21 | 849 | 191 | 0 | 21 | 0.7 | 849 | 4.2 | 40.4 (16–131) | 0.20 | 0.23 |
| Denmark | 18 | 1,277 | 46 | 0 | 17 | 184 | 42 | 0 | 35 | 1.1 | 1,461 | 7.3 | 41.7 (2–286) | 0.60 | 1.09 |
| Estonia | 0 | 0 | 0 | 0 | 14 | 29 | 14 | 0 | 14 | 0.5 | 29 | 0.1 | 2.1 (2–3) | 1.05 | 0.97 |
| Finland | 13 | 388 | 18 | 6 | 23 | 206 | 1 | 0 | 36 | 1.2 | 594 | 3.0 | 16.5 (2–124) | 0.65 | 0.91 |
| France | 74 | 780 | 44 | 0 | 935 | 6,033 | 352 | 9 | 1,009 | 32.7 | 6,813 | 34.0 | 6.8 (2–220) | 1.50 | 2.08 |
| Germany a | 15 | 453 | 84 | 3 | 178 | 690 | 90 | 1 | 193 | 6.3 | 1,143 | 5.7 | 5.9 (0–161) | 0.23 | 0.50 |
| Greece | 1 | 87 | 1 | 0 | 3 | 96 | 7 | 0 | 4 | 0.1 | 183 | 0.9 | 45.8 (24–87) | 0.04 | 0.09 |
| Hungary | 4 | 114 | 20 | 0 | 7 | 163 | 1 | 0 | 11 | 0.4 | 277 | 1.4 | 25.2 (6–72) | 0.11 | 0.99 |
| Ireland a | 0 | 0 | 0 | 0 | 23 | 48 | 2 | 0 | 23 | 0.7 | 48 | 0.2 | 2.1 (0–11) | 0.46 | 0.51 |
| Italy | 18 | 382 | 55 | 1 | 52 | 168 | 46 | 6 | 70 | 2.3 | 550 | 2.7 | 7.9 (2–128) | 0.12 | 0.31 |
| Latvia | 0 | 0 | 0 | 0 | 17 | 114 | 26 | 0 | 17 | 0.6 | 114 | 0.6 | 6.7 (2–49) | 0.89 | 11.57 |
| Lithuania | 4 | 26 | 15 | 0 | 1 | 4 | 3 | 0 | 5 | 0.2 | 30 | 0.1 | 6 (3–15) | 0.18 | 3.27 |
| Luxembourg | 1 | 2 | 0 | 0 | 0 | 0 | 0 | 0 | 1 | < 0.1 | 2 | < 0.1 | 2 (–) | 0.16 | 0.29 |
| Malta | 0 | 0 | 0 | 0 | 25 | 174 | 17 | 0 | 25 | 0.8 | 174 | 0.9 | 7 (2–64) | 4.86 | 7.72 |
| Netherlands | 6 | 89 | 24 | 5 | 553 | 1,819 | 4 | 0 | 559 | 18.1 | 1,908 | 9.5 | 3.4 (3–56) | 3.21 | 2.58 |
| Poland | 31 | 283 | 52 | 0 | 122 | 913 | 184 | 0 | 153 | 5.0 | 1,196 | 6.0 | 7.8 (2–119) | 0.40 | 1.21 |
| Portugal | 1 | 20 | 0 | 0 | 3 | 37 | 4 | 0 | 4 | 0.1 | 57 | 0.3 | 14.3 (7–21) | 0.04 | 0.14 |
| Romania | 2 | 31 | 13 | 0 | 1 | 10 | 8 | 0 | 3 | 0.1 | 41 | 0.2 | 13.7 (9–22) | 0.02 | 0.09 |
| Slovakia | 5 | 14 | 9 | 0 | 315 | 693 | 159 | 0 | 320 | 10.4 | 707 | 3.5 | 2.2 (2–8) | 5.86 | 10.08 |
| Slovenia | 0 | 0 | 0 | 0 | 0 | 0 | 0 | 0 | 0 | 0 | 0 | 0 | – | 0 | 0.24 |
| Spain | 19 | 167 | 14 | 0 | 142 | 1,164 | 63 | 2 | 161 | 5.2 | 1,331 | 6.6 | 8.3 (2–60.5) | 0.34 | 1.09 |
| Sweden | 27 | 594 | 1 | 0 | 23 | 339 | 5 | 0 | 50 | 1.6 | 933 | 4.7 | 18.7 (2–200) | 0.48 | 2.62 |
| EU Total | 248 | 4,914 | 407 | 15 | 2,838 | 15,103 | 1,268 | 19 | 3,086 | 100 | 20,017 | 100 | 4.9 (2–286) | 0.69 | 1.08 b ),( c |
| Bosnia and Herzegovina | 0 | 0 | 0 | 0 | 1 | 63 | 0 | 0 | 1 | – | 63 | – | 63 (–) | 0.03 | 0.12 |
| Iceland | 1 | 45 | 0 | 0 | 0 | 0 | 0 | 0 | 1 | – | 45 | – | 45 (–) | 0.27 | 1.08 |
| Montenegro | 0 | 0 | 0 | 0 | 2 | 16 | 0 | 0 | 2 | – | 16 | – | 8 (4–12) | 0.32 | 1.29 |
| North Macedonia | 1 | 10 | 0 | 0 | 0 | 0 | 0 | 0 | 1 | – | 10 | – | 10 (–) | 0.05 | 0.14 |
| Serbia | 3 | 20 | 9 | 0 | 6 | 33 | 9 | 0 | 9 | – | 53 | – | 5.9 (2–12) | 0.13 | 0.71 |
| Switzerland | 4 | 94 | 35 | 10 | 9 | 67 | 1 | 0 | 13 | – | 161 | – | 16.5 (2–48) | 0.15 | 0.14 |
| United Kingdom | 14 | 952 | 76 | 3 | 16 | 196 | 25 | 1 | 30 | – | 1148 | – | 38.3 (2–368) | 0.04 | 0.10 |
Information on the number of cases was not available for nine outbreaks from Ireland and one outbreak from Germany.
Outbreaks reported by the United Kingdom in 2010–2019 were considered for this estimation (EU‐28).
The mean outbreak reporting rate for the period 2010–2019 excluding the United Kingdom (EU‐27) was 1.24 outbreak per 100,000.
4. Results and discussion
4.1. Overview of countries reporting foodborne outbreak data, 2020
In 2020, 27 MS reported 3,086 foodborne outbreaks with 20,017 human cases, 1,675 hospitalisations and 34 deaths. Among the reporting MS, Slovenia informed that not foodborne outbreaks were detected in 2020. In addition, 57 outbreaks, 1,496 human cases, 155 hospitalisations and 14 deaths were reported by seven non‐MS (Bosnia and Herzegovina, Iceland, Montenegro, North Macedonia, Serbia, Switzerland, United Kingdom).
The total number of outbreaks reported by each MS in 2020 varied considerably, with a small number of MS reporting most of the outbreaks. Overall, the number of FBO reported by five countries (Belgium, France, Germany, the Netherlands, Slovakia) accounted for more than three‐quarters of the total outbreaks (2,418 outbreaks; 78.4% of all outbreaks) and more than half of the total number of human cases reported in the EU in 2020 (11,830 cases; 59.1% of the total number). The breakdown of FBO by countries and by strength of evidence is reported in Table 64. In this table, the ‘outbreak reporting rate’ (per 100,000 population) shows the frequency of FBO reporting in 2020, in EU MS and non‐MS countries, regardless of the different sizes of national populations. Among MS reporting at least one FBO in 2020, the range of the outbreak reporting rate was huge, from 0.02 (Romania) to 5.9 (Slovakia) outbreaks per 100,000 population, corresponding to a 65‐fold difference. It is important to highlight that these variations are primarily due to a different approach to FBO surveillance in place in the MS. The ‘mean outbreak size’ (i.e. the mean number of cases per outbreak) and the range of cases per outbreak is shown to characterise the pattern of the FBO reported to EFSA by MS and non‐MS. Taken together, these indicators highlight the considerable variability among MS in the sensitivity of surveillance and the type of FBO monitored in each MS. For example, household outbreaks (i.e. outbreaks where all the human cases live in a single household) are usually small‐size outbreaks. Since not all MS report household outbreaks to EFSA, this may influence the mean outbreak size as well as the number of outbreaks. Details on the type of FBO reported to EFSA by country are shown in Figure 43.
Figure 43.

Frequency distribution (%) of foodborne outbreaks, by type of outbreak and country, in reporting EU MS and non‐MS countries, 2020
Link to the dashboard (for an interactive look into the data different filters can be applied; outbreaks by reporting country are visualised in a dedicated page of the dashboard).
In 2020, at EU level, general outbreaks (N = 647) were more frequently reported than household outbreaks (N = 286). However, compared with 2019, general outbreaks decreased to a greater extent (1,642 outbreaks in 2019; 60.6% decrease) than household outbreaks (855 outbreaks; 54.9% decrease).
The overall distribution of numbers of FBO and of outbreak cases reported by MS over the period 2010–2020 is shown in Figures 44 and 45, respectively. In 2020, the number of outbreaks reported in the EU was roughly half that of 2019. A total of 2,737 fewer outbreaks were reported, corresponding to a relative decrease of 47.0% on the previous year. Outbreak cases and hospitalisations decreased even more compared to 2019, by 61.3% and 60.0%, respectively (51,694 human cases and 4,298 hospitalisations in 2019). This fall can probably be attributed to the indirect impact of the COVID‐19 pandemic on both the true occurrence of FBO in the population and the reduced capacity to detect, investigate and report FBO. The impact of the withdrawal of the UK from the EU can also be considered as a factor contributing to this decrease, even though appears to be limited. Between 2015 and 2019, the United Kingdom reported a total of 249 outbreaks to EFSA, making up between 0.8% and 1.1% of the overall number of FBO reported annually by EU MS.
Figure 44.

- Note: the number of MS reporting outbreaks is shown at the bottom (N). Outbreaks reported by the United Kingdom are included for the years 2010–2019.
Figure 45.

- Note: the number of MS reporting outbreaks is shown at the bottom (N). Cases involved in outbreaks reported by the United Kingdom are included for the years 2010–2019. Cases involved in both strong‐evidence outbreaks and weak‐evidence outbreaks are included in the figure.
The fall in FBO was observed for all the countries reporting data to EFSA for 2020, albeit with considerable variations, except in the case of Estonia. Annual variations (%) in the number of outbreaks reported at EU and MS level are plotted in Figure 46. By expressing variations as a % increase or decrease in the number of FBO in each MS, the figure allows a direct comparison between MS regardless of the different characteristics and sensitivity of the FBO surveillance in place.
Figure 46.

Yearly relative variation (%) of foodborne outbreaks reported in 2020 compared with 2019 in reporting EU‐MS and non‐MS
In 2020, deaths resulting from outbreaks decreased in the EU by 43.3%, falling from a total of 60 fatalities reported in 2019 (EU‐28 reporting, with 15 deaths reported by the United Kingdom) to 34 deaths reported in 2020 by seven MS (Belgium, Finland, France, Germany, Italy, the Netherlands, Spain). The severity of outbreaks and the health impact of FBO, in terms of hospitalisations and deaths did not substantially change, with proportions of hospitalisation and death among outbreak cases of 8.4% and 0.17%, respectively. Fourteen deaths were also notified by two non‐EU countries (Switzerland and the United Kingdom). In Switzerland, ten deaths were associated with a single community outbreak caused by Listeria monocytogenes involving a total of 34 cases (Nüesch‐Inderbinen et al., 2021). Almost all the other severe general outbreaks with multiple deaths among the involved cases were also caused by Listeria monocytogenes. These outbreaks were reported by Finland, Germany, the Netherlands and the United Kingdom.
In 2020, 19 MS reported strong‐evidence outbreaks (N = 248) (all MS reporting FBO except Bulgaria, Cyprus, Czechia, Estonia, Ireland, Latvia and Malta), accounting for 8.0% of all outbreaks overall, the lowest proportion reported since 2010. At single‐country level, the percentage of strong‐evidence outbreaks varies widely (Table 64). This diversity could be explained by differences in the reporting systems of each MS, as well as possible delays in the reporting of outbreaks and in the type of outbreaks investigated. In some countries, a high number of small outbreaks are reported, with only a minority of these events being investigated. For 20 MS, the proportion of strong‐evidence outbreaks was lower than in the five previous years, altogether. This finding could reflect a reduced capacity to complete the investigation of FBO in 2020, following the diversion of human and technical resources for the COVID‐19 pandemic. Confirming a suspect food as the vehicle implicated in a foodborne outbreak requires multiple actions, including patient interviews, food sampling, laboratory testing of specimens, inspections of the food production premises and points of sale, collection of information for trace‐back and trace forward analysis of the food batches. All these activities can be particularly demanding in terms of skills, human and technical resources, materials and time, and could well have been slowed down in 2020.
Over a longer period (2010–2020) five MS (Austria, Hungary, Latvia, Lithuania and the Netherlands) and one third country (the United Kingdom) reported statistically significant variations in the number of outbreaks reported Figure 47. Although these trends should be interpreted with caution for the reasons explained above in Section 3, it is important to look at the country specific pattern of causative agents monitored in outbreaks and their relative dynamics over time (Section 4.6.1) in order to unravel the components underlying these trends.
Figure 47.

- Note: * indicates countries with a statistically significant trend (p < 0.05) over the period. Dark red and light red representing strong‐ and weak‐evidence outbreaks, respectively. Blue has been used to show both the trend line and the secondary Y‐axis representing the outbreak reporting rate. This was adopted for Latvia, Lithuania, Malta and Slovakia, in order to highlight a scale that is different to that of the other countries.
In some of these countries, outbreak trends were mainly influenced by variations in specific agents over time, in particular Salmonella in Austria and Germany, Campylobacter in Austria and Norovirus in Germany (see Section 4.6).
4.2. Overview of causative agents in foodborne outbreaks, 2020
In 2020, a causative agent was identified in 1,857 FBO (60.2% of the total number) resulting in 13,878 cases (69.3% of the total cases), 1,509 hospitalisations (90.1% of the total) and 33 deaths (97.1% of the total). Figure 48 shows the agents most frequently implicated in FBO in the EU.
Figure 48.

-
Note: Only FBO reported by EU Member States are shown in the figure. Marine biotoxins includes ciguatoxin and other unspecified marine toxins.Other viruses includes Tick‐borne encephalitis virus (TBE), Hepatitis E and other unspecified viruses. Other bacterial agents includes Vibrio parahaemolyticus, Enteropathogenic Escherichia coli (EPEC) and other unspecified bacteria. Other parasites includes Anisakis, Giardia and Enterocytozoon bieneusi. Other causative agents includes lectin.
Table 65 provides a detailed overview of the causative agents involved in FBO and their overall impact on health in the EU in 2020. Among the known causative agents, bacteria were reported to have caused the most outbreaks followed by bacterial toxins, viruses, other causative agents and parasites.
Table 65.
Number of foodborne outbreaks, human cases, hospitalisations and deaths, by causative agents, in reporting EU MS, 2020
| Type of Agent | Outbreaks | Cases of illness | ||||||||||
|---|---|---|---|---|---|---|---|---|---|---|---|---|
| Strong‐evidence outbreaks | Weak‐evidence outbreaks | Total outbreaks | % of total | Reporting rate per 100,000 | Human cases | Mean outbreak size (cases) and range (min–max) | Hospitalisations | Deaths | ||||
| N | N | N | N | N | % of cases | N | % of cases | |||||
| Bacteria | Brucella | 0 | 1 | 1 | < 0.01 | < 0.01 | 2 | 2 (–) | 2 | 100 | 0 | 0 |
| Campylobacter | 11 | 306 | 317 | 10.3 | 0.07 | 1,319 | 4.2 (2–161) | 112 | 8.5 | 0 | 0 | |
| Escherichia coli other than STEC | 0 | 2 | 2 | 0.1 | < 0.01 | 12 | 6 (2–10) | 10 | 83.3 | 0 | 0 | |
| Listeria monocytogenes | 9 | 7 | 16 | 0.5 | < 0.01 | 120 | 7.5 (2–35) | 83 | 69.2 | 17 | 14.2 | |
| Salmonella | 84 | 610 | 694 | 22.5 | 0.16 | 3,686 | 5.3 (2–161) | 812 | 22.0 | 7 | 0.2 | |
| Shigella | 1 | 4 | 5 | 0.2 | < 0.01 | 58 | 11.6 (2–44) | 14 | 24.1 | 0 | 0 | |
| Shigatoxin‐producing E. coli (STEC) a | 5 | 29 | 34 | 1.1 | 0.01 | 208 | 7.7 (2–87) | 30 | 14.4 | 1 | 0.5 | |
| Vibrio parahaemolyticus | 1 | 3 | 4 | 0.1 | < 0.01 | 56 | 14 (2–50) | 0 | 0.0 | 0 | 0 | |
| Yersinia | 1 | 15 | 16 | 0.5 | < 0.01 | 236 | 14.8 (2–200) | 11 | 4.7 | 0 | 0 | |
| Bacteria, unspecified | 1 | 2 | 3 | 0.1 | < 0.01 | 58 | 19.3 (14–29) | 5 | 8.6 | 0 | 0 | |
| Subtotal | 113 | 979 | 1,092 | 35.4 | 0.24 | 5,755 | 5.3 (0–200) | 1,079 | 18.7 | 25 | 0.4 | |
| Bacterial toxins | Bacillus cereus toxins | 18 | 53 | 71 | 2.3 | 0.02 | 835 | 11.8 (2–90) | 10 | 1.2 | 1 | 0.1 |
| Clostridium botulinum toxins | 6 | 3 | 9 | 0.3 | < 0.01 | 34 | 3.8 (2–13) | 34 | 100.0 | 0 | 0.0 | |
| Clostridium perfringens toxins | 15 | 17 | 32 | 1.0 | 0.01 | 682 | 21.3 (2–128) | 10 | 1.5 | 2 | 0 | |
| Staphylococcus aureus toxins | 4 | 39 | 43 | 1.4 | 0.01 | 402 | 9.3 (2–51) | 32 | 8.0 | 0 | 0.0 | |
| Bacterial toxins, unspecified | 4 | 368 | 372 | 12.1 | 0.08 | 2,564 | 6.9 (2–52) | 96 | 3.7 | 3 | 0.1 | |
| Subtotal | 47 | 480 | 527 | 17.1 | 0.12 | 4,517 | 8.6 (2–128) | 182 | 4.0 | 6 | 0.1 | |
| Viruses | Flavivirus (including Tick‐borne Encephalitis virus) | 5 | 0 | 5 | 0.2 | < 0.01 | 12 | 2.4 (2–3) | 12 | 100 | 0 | 0 |
| Hepatitis A b | 2 | 5 | 7 | 0.2 | < 0.01 | 206 | 29.4 (3–131) | 105 | 51.0 | 0 | 0 | |
| Hepatitis E | 0 | 3 | 3 | 0.1 | < 0.01 | 6 | 2 (2–2) | 2 | 33.3 | 0 | 0 | |
| Norovirus and other Calicivirus c | 39 | 91 | 130 | 4.2 | 0.03 | 2,633 | 20.4 (2–286) | 90 | 3.4 | 1 | 0 | |
| Other viruses, unspecified | 0 | 10 | 10 | 0.3 | < 0.01 | 151 | 18.9 (2–65) | 2 | 1.3 | 0 | 0 | |
| Subtotal | 46 | 109 | 155 | 5.0 | 0.03 | 3,008 | 19.4 (0–286) | 211 | 7.0 | 1 | < 0.01 | |
| Parasites | Anisakis | 1 | 1 | 2 | 0.0 | < 0.01 | 6 | 3 (−) | 0 | 0.0 | 0 | 0 |
| Cryptosporidium | 1 | 2 | 3 | 0.1 | < 0.01 | 34 | 11.3 (2–25) | 1 | 2.9 | 0 | 0 | |
| Enterocytozoon bieneusi | 1 | 0 | 1 | < 0.01 | < 0.01 | 77 | 77 (−) | 0 | 0.0 | 0 | 0 | |
| Giardia | 0 | 2 | 2 | 0.1 | < 0.01 | 4 | 2 (−) | 0 | 0.0 | 0 | 0 | |
| Trichinella | 5 | 1 | 6 | 0.2 | < 0.01 | 119 | 19.8 (2–79) | 13 | 11 | 0 | 0 | |
| Subtotal | 8 | 6 | 14 | 0.5 | < 0.01 | 240 | 17.1 (2–79) | 14 | 5.8 | 0 | 0 | |
| Other causative agents | Histamine and Scombrotoxin | 14 | 29 | 43 | 1.4 | 0.01 | 183 | 4.3 (2–15) | 17 | 9.3 | 1 | 1 |
| Marine biotoxins | 1 | 22 | 23 | 0.7 | 0.01 | 120 | 5.2 (2–14) | 6 | 5.0 | 0 | 0 | |
| Other causative agents | 2 | 1 | 3 | 0.1 | < 0.01 | 55 | 18.3 (3–47) | 0 | 0.0 | 0 | 0 | |
| Subtotal | 17 | 52 | 69 | 2.2 | 0.02 | 358 | 5.2 (2–47) | 23 | 6.4 | 1 | 0.3 | |
| Unknown | Unknown / Unspecified d | 17 | 1,212 | 1,229 | 39.8 | 0.27 | 6,139 | 5 (2–220) | 166 | 2.7 | 1 | < 0.1 |
| Total (EU) e | 248 | 2,838 | 3,086 | 100.0 | 0.69 | 20,017 | 6.5 (2–286) | 1,675 | 8.4 | 34 | 100.0 | |
‘Escherichia coli' other than STEC includes Enteropathogenic Escherichia coli (EPEC).
‘Other viruses' includes Hepatitis E (3) and other unspecified viruses (10).
‘Marine biotoxins' includes ciguatoxin (9) and other unspecified toxins (14).
‘Other causative agents' includes Lectin (3).
Information on the number of involved cases was not available for seven outbreaks caused by STEC.
Information on the number of involved cases was not available for one outbreak of Hepatitis A.
Information on the number of involved cases was not available for one outbreak caused by norovirus.
Information on the number of involved cases was not available for one outbreak caused by unknown agent.
Information on the number of involved cases was not available for ten outbreaks.
For each pathogen group and single type of causative agent, the proportion of hospitalisations and deaths among cases, and the mean outbreak size and range (cases per outbreak) facilitate a description of the general characteristics of the FBO and their impact on health. The highest proportion of hospitalisations and deaths were observed for outbreaks caused by bacteria. Salmonella was by far responsible for the highest number of hospitalisations (N = 812), while L. monocytogenes alone caused half of the fatal illnesses (N = 17).
The breakdown of causative agents by country is shown in Figure 49.
Figure 49.

- Note: The table may be read by column (country) or by row (causative agent). The number at the end of each row is the number of countries that reported for 2020 a given causative agent for outbreaks in 2020 while the number at the top of each column indicates refers to the number of causative agents identified in outbreaks by a given country in 2020. Slovenia is not shown because no outbreaks were detected in 2020. ‘Escherichia coli' other than STEC includes Enteropathogenic Escherichia coli (EPEC). ‘Bacillus cereus toxins’ include Bacillus cereus, Bacillus cereus enterotoxins. ‘Staphylococcus aureus toxins’ include staphylococcal enterotoxins. ‘Norovirus and other calicivirus’ include norovirus (Norwalk‐like virus), sapovirus (Sapporo‐like virus), and calicivirus unspecified. ‘Other viruses' include Hepatitis E and other unspecified viruses. ‘Histamine and scombrotoxin’ include histamine and scombrotoxin. ‘Marine biotoxins' include ciguatoxin and other unspecified marine toxins. ‘Other agents' include lectin.
Link to EFSA story map on FBO (see story map section on ‘what organisms and symptoms’).
For a further interactive look into FBO data: Link to the dashboard (different filters can be applied; outbreaks by causative agents are visualised in different pages of the dashboard).
Since the monitoring and reporting of FBO among MS lacks harmonisation, the data pooled at EU level must be interpreted with caution, given that the situation of each MS may differ considerably. The frequency distribution of the causative agents implicated in FBO by MS is shown in Figure 50. The size and colour of each sector are proportional to the number of outbreaks and cases associated with each causative agent. The graphic aims to highlight the major differences between MS in the causative agents reported in FBO, rather than providing details. A graphic showing the contribution (weight) of each MS to the number of FBO reported at EU level, by type of agent, is provided as supporting documentation in Zenodo.
Figure 50.

Frequency distribution of foodborne outbreaks (inner circle) and human cases involved in outbreaks (outer circle), by reporting EU MS and non‐MS (bottom figure), by causative agent, 2020
- Causative agents are shown in different colours. The size of each sector is proportional to the number of outbreaks (internal circle) and human cases (external circle) involved in outbreaks. The number of cases is shown inside the circle. The number of outbreaks is shown outside the circle.Information on the number of involved cases was not available for one outbreak in Germany caused by norovirus and for nine outbreaks from Ireland caused by Hepatitis A, Shiga toxin‐producing E. coli and an unknown agent. Slovenia is not shown because no outbreaks were detected in 2020.‘Other bacterial agents include’: Escherichia coli other than STEC, Shigella, Vibrio parahaemolyticus, bacteria unspecified.‘Bacillus toxins’ include Bacillus cereus, Bacillus cereus enterotoxins, and B. subtilis (only one outbreak of B. subtilis reported by the United Kingdom).‘Staphylococcus aureus toxins’ include staphylococcal enterotoxins.‘Norovirus and other calicivirus’ include norovirus (Norwalk‐like virus), sapovirus (Sapporo‐like virus), calicivirus unspecified.‘Other viruses' include Hepatitis E and other unspecified viruses.‘Marine biotoxins' includes ciguatoxin and other unspecified marine toxins.‘Other agents’ includes lectin.‘Other parasites’ includes Anisakis, Enterocytozoon bieneusi, Giardia.
Information on the distribution of food vehicles implicated in the FBO by causative agent is presented in Section 4.3. Moreover, for the main causative agents, the ranking of food vehicles implicated in strong‐evidence outbreaks is described in the tables provided as supporting information.
For a further interactive look into FBO data: Link to the dashboard (different filters can be applied; information on the causative agents by reporting countries, as well as by food vehicle, is visualised in dedicated pages of the dashboard).
4.2.1. Bacteria
Salmonella
Outbreaks caused by Salmonella were reported by the largest number of countries in Europe (22 MS and five non‐MS) (Figure 49). This agent was the main or even the sole cause of FBO in 13 MS (Croatia, Czechia, Denmark, Estonia, Hungary, Italy, Latvia, Lithuania, Luxembourg, Poland, Romania, Slovakia, Spain) and four non‐MS (Serbia, Montenegro, Bosnia and Herzegovina, the United Kingdom). Salmonella was the agent most commonly identified in FBO in the EU in 2020, accounting for 22.5% (N = 694) of total FBO (N = 3,086). This agent was also responsible for the highest number of hospitalisations (N = 812; 48.5% of all outbreak‐related hospitalisations). Seven deaths (20.6% of all deaths among outbreak cases) were reported in Salmonella foodborne outbreaks.
In 2020, the numbers of outbreaks caused by Salmonella decreased significantly in the EU with 590 fewer outbreaks than in 2019 (1,284 outbreaks reported in 2019; 46.0% decrease). Based on the available data, the withdrawal of the United Kingdom from the EU accounted for no more than 2.2% of this decline, since the United Kingdom had reported an average of 12.9 outbreaks per year over the previous 10 years.
Among the Salmonella outbreaks for which information is available on the serovar (N = 488), S . Enteritidis was the predominant serovar (N = 402; 82.4%), followed by S . Typhimurium (N = 38; 7.8%), monophasic S . Typhimurium (N = 13; 2.7%) and S . Infantis (N = 5; 1.0%). Overall, outbreaks of S . Enteritidis, S. Typhimurium and S. Typhimurium monophasic accounted for 92.8% of all Salmonella outbreaks.
At EU level, the number of S . Enteritidis and S . Typhimurium outbreaks also decreased in 2020 by 47.2% (761 outbreaks in 2019) and 56.8% (88 outbreaks in 2019), respectively, compared to 2019. Only outbreaks caused by S . Typhimurium monophasic remained stable (one outbreak more than in 2019). A parallel and even higher fall in cases and hospitalisations was observed for all three serovars. The number of cases fell by over 69% (2,215 cases in 2020 vs 7,154 cases in 2019) and hospitalisations by over 68% (521 hospitalisations in 2020 vs 1,117 hospitalisations in 2019). These findings show that the Salmonella outbreaks caused by the most frequent serovars decreased in both number and size in 2020. In fact, the average number of cases per Salmonella outbreak (mean outbreak size) was 5.3 cases in 2020 and 9.9 cases in 2019. Interestingly, concerning these Salmonella outbreaks, the % of cases involved in ‘general’ outbreaks decreased by 16.3% in 2020 compared with 2019 (human cases involved in general outbreaks caused by Salmonella were 52.8% of total cases involved in Salmonella outbreaks in 2020 and 69.2% in 2019), while ‘household’ outbreaks, which usually are small size outbreaks, increased by 9.2%. Human cases involved in ‘household’ outbreaks caused by Salmonella were 26.4% of total cases involved in Salmonella outbreaks in 2020 and 17.2% in 2019. Reduced exposure to contaminated food in public settings such as restaurants and canteens whose activity in many countries was suspended during the COVID‐19 pandemic is a possible reason explaining this finding.
Overall, the other 24 Salmonella serovars accounted for a total of 30 outbreaks (6.1% of all Salmonella outbreaks with a known serovar). The serovars S . Infantis, S. Agona, S. Coeln, S. Dublin, S. Litchfield, S. Strathcona were each reported in more than one outbreak. Other serovars ( S . Bareilly, S. Bovismorbificans, S. Brandenburg, S. Chester, S. Hessarek, S. Kaapstad, S. Kasenyi, S. Kedougou, S. Kottbus, S. Miami, S. Muenchen, S. Newport, S. Orion, S. Rissen, S. Saintpaul, S. Stanley) were each responsible for a single outbreak. Among the less frequently reported serovars, S . Muenchen, S . Brandenburg and S . Coeln were responsible for single, large general outbreaks in 2020. In Germany, S . Muenchen caused 161 cases in an outbreak associated with contaminated ‘coconut pieces’ or ‘coconut flakes’ while S . Brandenburg caused an outbreak involving 70 cases associated with the consumption of turkey kebabs and other meat products. In Croatia, 43 cases were reported as part of a weak‐evidence outbreak caused by S . Coeln.
Overall, for 204 Salmonella outbreaks (29.4% of the total) the serovar was unknown. The absence of this information gives rise to uncertainty in identifying the main sources of Salmonella at primary production level, given that the food vehicles implicated in Salmonella outbreaks differ considerably by serovar (Section 4.3.3). Group B and group D Salmonella, 26 without full serotyping, were responsible for six and four outbreaks, respectively.
Campylobacter
In 2020, Campylobacter was the fourth most frequently reported causative agent for FBO at EU level, with 317 outbreaks communicated to EFSA, causing 1,319 cases of infection and 112 hospitalisations. Campylobacter was confirmed as the leading causative agent in FBO in Austria (10 outbreaks) and Germany (98 outbreaks), as well as in Estonia (7 outbreaks). Campylobacter jejuni and C. coli were identified in 142 and 6 outbreaks, respectively. However, half of these Campylobacter outbreaks were reported without speciation information (169 outbreaks or 53.3% of the total). In 2020, two single large general outbreaks caused by C. jejuni were reported by Denmark and Sweden involving 161 cases (with 33 hospitalisations) and 150 cases, respectively. The contamination of milk at a processing plant was implicated in the first event, while the other was caused by the consumption of chicken meat.
Listeria monocytogenes
In 2020, Listeria monocytogenes was identified in 16 outbreaks in seven MS (Austria, Denmark, Finland, France, Germany, Italy, the Netherlands) and four outbreaks reported by two non‐MS (Switzerland, the United Kingdom). Altogether, these outbreaks were responsible for 163 cases, 126 hospitalisations and 30 deaths. In the EU, L. monocytogenes was associated with the highest case fatality rate among outbreak cases (14.2%). The death toll of listeriosis outbreaks was also particularly high also in non‐MS with 13 fatalities among a total of 43 cases caused by the outbreaks (30.2%), all hospitalised. The L. monocytogenes outbreak reported by Switzerland deserves particular attention for its high impact on health. The outbreak caused the highest number of deaths ever detected in a single outbreak in Europe (10 deaths) and the second highest number of hospitalisations following the big outbreak that occurred in Spain in 2019 (EFSA and ECDC, 2021). The outbreak was caused by L. monocytogenes serovar 4b and the implicated food was ‘cheese’.
Interestingly, the number L. monocytogenes outbreaks reported by MS in 2020 was the second highest number reported since EFSA first started collecting data on FBO, following the 21 listeriosis outbreaks reported in MS in 2019, when the United Kingdom was still part of the EU. Between 2016 and 2019 the mean number of L. monocytogenes outbreaks reported per year in the EU was 13.2 with the United Kingdom reporting just one outbreak on average per year. The trend towards an increasing number of L. monocytogenes outbreaks is a cause of concern, given the decline observed for most other pathogens implicated in outbreaks in the EU, and the high health burden of L. monocytogenes infections.
Shiga toxin‐producing E. coli (STEC)
Similar to recent years, next to Salmonella and Campylobacter, Shiga toxin‐producing E. coli (STEC) were the third most frequent bacterial agents detected in FBO in the EU with 34 outbreaks, 208 cases, 30 hospitalisations and 1 death reported in 2020 by nine MS (Austria, Belgium, Denmark, Finland, France, Germany, Greece, Ireland, Italy). Information on the STEC serogroup was available for six outbreaks with STEC O157, O145 and O26 identified in three, two and one outbreaks, respectively. Almost half of the STEC outbreaks in the EU were reported by Ireland (N = 16; 47.1%). In this country STEC was the leading causative agent of FBO. Information was available on the STEC serogroups implicated in Ireland only for two outbreaks (STEC O26 and STEC O145). STEC O157 was also reported as ‘other causative agent’ in one outbreak primarily caused by Campylobacter in Austria. In non‐MS, six O157 and one O145 STEC outbreaks were also reported by the United Kingdom.
Shigella
Shigella was reported in five outbreaks by four MS (Denmark, France, the Netherlands and Slovakia). S. flexneri was detected in two outbreaks (one strong‐ and one weak‐evidence outbreak) and S. sonnei in one outbreak. The species was not indicated for the remaining two outbreaks.
Yersinia
In 2020, six MS (Denmark, France, Germany, Latvia, Poland and Slovakia) reported outbreaks caused by Yersinia in numbers close to recent years (N = 16). Y. enterocolitica was identified as the aetiologic agent in all but one of these outbreaks. The number of cases involved in outbreaks was slightly higher than in 2019 due to a single large general outbreak in Denmark, which caused 200 cases and was linked to the consumption of a cross‐contaminated pasta‐based dish.
4.2.2. Bacterial toxins
In 2020, the number of outbreaks caused by bacterial toxins food poisoning fell by 47.1% across the EU compared with 2019 (997 outbreaks reported in 2019), accounting for 527 events (17.1% of all outbreaks). These outbreaks were reported by 12 MS (Belgium, Denmark, Finland, France, Germany, Hungary, Italy, the Netherlands, Poland, Portugal, Spain, Sweden) and caused a total of 4,517 cases, 182 hospitalisations and 6 deaths (Table 65). Following the trend of recent years, France was by far the MS making the greatest contribution to reporting with 481 outbreaks notified to EFSA in 2020 (91.3%). Broadly speaking, the overall health impact of these outbreaks in 2020 halved compared with 2019 in terms of either cases (56.6% decrease, N = 997), hospitalisations (49.6% decrease, N = 361) and deaths (49.1% decrease, N = 14). In France, bacterial toxins were the leading cause of FBO. However, for most of these FBO (N = 370; 76.9% of all outbreaks caused by bacterial toxins reported by France) the toxin‐producing agent was not identified and was reported as ‘bacterial toxins, unspecified’.
At EU level, Bacillus cereus toxins were the most frequently reported cause of food poisoning outbreaks (71 outbreaks, 835 cases, 10 hospitalisations, one death), followed by Clostridium perfringens toxins (32 outbreaks, 682 cases, 10 hospitalisations, two deaths) and Staphylococcus aureus toxins (43 outbreaks, 402 cases, 32 hospitalisations). FBO caused by B. cereus and S. aureus were reported by 8 MS (Belgium, Finland, France, Germany, Hungary, the Netherlands, Poland, Spain) and 6 MS (Belgium, Finland, France, Italy, Spain, Sweden), respectively. C. perfringens was identified as the causative agent in FBO in eight MS (Belgium, Denmark, Finland, France, Germany, Italy, Portugal, Spain).
Outbreaks of botulism (N = 9) were reported by three MS (France, Italy and Spain) and involved 34 cases, all hospitalised, with no deaths. This finding is important since foodborne botulism is known as one of the most harmful and deadly forms of food poisoning. Data show that early diagnosis, hospitalisation and treatment are critical to reducing the health burden associated with this type of food poisoning. Botulism was the only form of bacterial toxin food poisoning in the EU that increased slightly in 2020 compared with 2019 (a further two outbreaks), although the number of reported outbreaks fell within the range of variation observed in the last 10 years (a minimum of 6 in 2012, and a maximum of 24 in 2015).
Outbreaks caused by C. perfringens toxins (4 outbreaks), S. aureus and B. cereus toxins (1 outbreak each) were also reported by two non‐MS (North Macedonia and the United Kingdom).
4.2.3. Viruses
The greatest decrease at EU level in 2020 among all causative agents, concerned outbreaks caused by viruses (558 outbreaks in 2019; a decrease of 72.2%). In particular, the numbers of norovirus (and other Calicivirus) and Hepatitis A outbreaks decreased notably by 71.6% (458 outbreaks in 2019) and 65.0% (20 outbreaks in 2019), respectively. Overall, the 155 outbreaks caused by foodborne viruses involved 3,008 cases and caused 211 hospitalisations and 1 death. Viruses reported by MS included norovirus (126 outbreaks), Hepatitis A virus (seven outbreaks) and Hepatitis E virus (three outbreaks), Sapovirus (one outbreak), Calicivirus unspecified (three outbreaks), Flavivirus including tick‐borne encephalitis virus (TBE) (five outbreaks) and other unspecified viruses (10 outbreaks). In addition, the United Kingdom reported two norovirus outbreaks.
Norovirus and other calicivirus
In 2020, norovirus (and other calicivirus) were the fourth most frequently reported causative agents of FBO in the EU, associated with 130 outbreaks in 13 MS (Belgium, Czechia, Denmark, Finland, France, Germany, Italy, Latvia, Malta, the Netherlands, Poland, Spain and Sweden). In two MS (Finland and Sweden), norovirus was the leading cause of FBO. The number of cases caused by norovirus outbreaks also fell importantly, as did the number of hospitalisations (8,581 fewer cases than in 2019; 76.5% decrease; 189 hospitalisations less than in 2019; 67.7% decrease). Based on historical data for 2015–2019, the withdrawal of the United Kingdom from the EU may have contributed to the fall in norovirus outbreaks in 2020, but only by 6.8% since the United Kingdom previously reported 24.4 outbreaks per year, on average.
In the EU, norovirus was associated with large outbreaks (20.4 cases on average) and most of these were classified as general outbreaks (N = 82; 63.1%). In 2020, six outbreaks each involved more than 100 cases. In addition, two outbreaks identified in Denmark were reported to be part of the same multicountry outbreak linked to the consumption of oysters.
Hepatitis A and Flavivirus
Seven Hepatitis A outbreaks involving 206 cases were reported in 2020 by 6 MS (Czechia, Denmark, Germany, Ireland, Poland and Sweden). Only two of them were strong‐evidence outbreaks. In Czechia, a single general outbreak caused 131 cases of Hepatitis A, with 91 of them requiring hospitalisation. Another large outbreak in Germany involved 41 cases with nine hospitalisations. No information on the implicated vehicle was available for either of these large outbreaks.
Flaviviruses were responsible for five strong‐evidence household outbreaks of tick‐borne encephalitis involving 12 cases, all requiring hospitalisation. Raw sheep’s milk and/or raw goat’s milk was identified as the implicated vehicle in all the outbreaks.
Outbreaks and cases of Hepatitis E were reported in 2020 in the same number as in 2019 and 2018 (three weak‐evidence outbreaks and six cases). Two patients required hospitalisation. All outbreaks were reported by Germany.
4.2.4. Parasites
In 2020, the number of reported FBO caused by parasites was low compared to other agents (14 outbreaks in nine MS and three outbreaks in non‐MS).
Trichinella
In 2020, five strong‐evidence and one weak‐evidence outbreaks caused by Trichinella were reported in the EU by 5 MS (France, Italy, Poland, Romania, Spain), with 119 human cases, 13 hospitalisations and no deaths. One single outbreak reported by Italy involving 79 cases (N = 66.4% of all cases involved in Trichinella outbreaks in the EU), was the main cause of the increase in human cases observed in 2020 (75 more than in 2019). The first nine cases involved in this outbreak were notified in 2019. This outbreak was associated with the consumption of salami made with meat from one T. britovi infected wild boar. T. spiralis was identified in two outbreaks reported by Poland, while T. britovi was also identified in the outbreak reported by France. No information was available for the Trichinella species involved in the remaining outbreaks reported by two MS (Romania and Spain). One non‐MS (Serbia) reported two strong‐evidence outbreaks caused by T. spiralis with eight cases and seven hospitalisations. The trichinellosis outbreaks were mostly caused by the consumption of meat and meat products from wild boar and pig.
Anisakis
In 2020, Anisakis caused two outbreaks, both reported by Spain, involving six individuals. No outbreaks were reported in 2019. The causative agent was not identified at the species level.
Giardia
In 2020, Giardia caused only two outbreaks (compared to 14 in 2019, and 19 in 2018), involving four individuals (compared to 233 in 2019, and 45 in 2018). No details on the species were provided for these outbreaks, which were reported by Germany and Ireland.
Cryptosporidium
Cryptosporidium caused three outbreaks and 34 cases in 2020, a remarkable reduction compared to 2019 (11 outbreaks and 468 cases). Sweden reported two outbreaks and 32 cases (compared to seven outbreaks and 304 cases in 2019), one of which was a strong‐evidence outbreak associated with the consumption of kale, a food vehicle already implicated in several outbreaks reported in 2019. The remaining outbreak was reported by Ireland. Overall, C. parvum was implicated in the two Swedish outbreaks while no species information was available for the other two outbreaks. Among non‐EU countries, Iceland reported one outbreak of cryptosporidiosis involving 45 cases. No information on the species is available for the Icelandic outbreak.
Enterocytozoon bieneusi
In 2020, Denmark reported a large outbreak, involving 77 individuals, and caused by Enterocytozoon bieneusi, an obligate intracellular eukaryotic parasite belonging to the order Microsporidia (Li and Xiao, 2020). Although E. bieneusi has been linked to food‐ and waterborne and hospital‐related outbreaks, its identification requires molecular methods, such as qPCR, which are not routinely used in most MS.
4.2.5. Other causative agents
This group of outbreaks includes events caused primarily by ‘histamine and scombrotoxin’, ‘marine biotoxins’ and a few other chemical agents of biological origin that may accidentally contaminate food or its ingredients. For data interpretation, it is important to remember that outbreaks caused by other causative agents are not regularly covered by national outbreak surveillance programmes and that data reported by MS to EFSA are sparse. In consequence, the scale of this type of food poisoning is likely to be highly underestimated at EU level.
In 2020, eight MS (Belgium, Croatia, France, Germany, Italy, Malta, Spain and Sweden) reported 43 outbreaks of ‘histamine and scombrotoxin’ causing 183 cases, 17 hospitalisations and one death. This is the first ever reported death from histamine since EFSA began collecting data on outbreaks in 2005. Histamine poisoning outbreaks were mainly ‘general’ outbreaks (N = 31). This type of outbreak was more frequent than ‘household’ outbreaks (N = 11), which concerned just one in four histamine outbreaks reported in 2020 (for one event, the type of outbreak was unknown). Outbreaks caused by ‘histamine and scombrotoxin’ decreased considerably compared with 2019 (96 outbreaks in 2019, 55.2% decrease). The suspension of catering activities in restaurants and other places such as school and workplace canteens made a substantial contribution to this fall, following the implementation of lockdown measures by many MS to fight the COVID‐19 pandemic. Of the strong‐evidence outbreaks, histamine poisoning in the above settings accounted for just eight outbreaks in 2020 (21 outbreaks in 2019), for a net decrease of 61.9% compared with 2019. The withdrawal of the United Kingdom from the EU had no impact on this decrease since this country had reported no histamine outbreaks since 2019.
Marine biotoxins are mainly produced by algae or phytoplankton and accumulate in fish and filter‐feeding molluscan shellfish. In 2020, four MS (Cyprus, France, the Netherlands and Spain) reported 23 outbreaks caused by marine biotoxins, of which all but one were weak‐evidence outbreaks. Overall, these outbreaks were responsible for 120 cases and 6 hospitalisations. France was the MS contributing the most to these outbreaks (N = 20; 87.0% of all marine biotoxin outbreaks). The implicated type of biotoxins was reported as unknown for most outbreaks. In nine outbreaks, the food poisoning was caused by ciguatoxin, the causative agent of Ciguatera fish poisoning, a severe condition characterised by gastrointestinal, neurological and/or general disorders, most commonly associated with fish from Pacific, Caribbean and Indian Ocean regions. In 2020, the number of marine biotoxin outbreaks reported fell by 25 compared with 2019. This corresponds to a relative decrease of 52.1% (48 outbreaks in 2019), which is similar to the drop observed for histamine and scombrotoxin outbreaks.
Among the other agents, two strong‐evidence and one weak‐evidence outbreaks of lectin poisoning were reported by Denmark, involving 55 cases. This type of food poisoning is a chemical intoxication caused by the presence of lectin, a natural phytohaemagglutinin, in a variety of leguminous seeds and beans. Poisoning occurs following the consumption of raw or incompletely cooked beans, in particular red beans, containing high level of lectin. The symptoms, mainly gastrointestinal manifestations, develop within a few hours after food consumption (Rodhouse et al., 1990). Only a small number of lectin outbreaks have been reported to EFSA in recent years, mainly from Denmark (overall six outbreaks in 2014, 2016 and 2018), Belgium and Sweden (one outbreak reported by each MS in 2018).
4.2.6. Outbreaks caused by unknown/unspecified agents
In 2020, FBO of unknown aetiology (Table 65) accounted for 39.8% (N = 1,229) of all outbreaks in the EU, or more than one in three outbreaks, for 30.7% (N = 6,139) of all outbreak cases, 9.9% (N = 166) of hospitalisations and 2.9% (N = 1) of deaths. The reporting to EFSA of outbreaks of unknown aetiology varied considerably among MS, since it is closely related to the type of outbreak investigated at the level of single MS and to the overall structure of outbreak surveillance. This is clearly visible in Figure 50 where FBO of unknown aetiology are displayed in the grey area. Outbreaks of unknown aetiology were notified to EFSA primarily by Belgium (N = 317), the Netherlands (N = 537) and France (N = 194). In Belgium and in the Netherlands, these outbreaks made up the vast majority of reports (95.8% and 96.1%, respectively), while in France they corresponded to a much smaller proportion (19.2%).
Outbreaks caused by unknown agents occur in confined contexts such as domestic settings or small groups, where it is easy to identify the link between cases. In 2020, the mean outbreak size was five cases (Table 65). However, six MS (Bulgaria, Czechia, Finland, France, Italy and Poland) reported 10 outbreaks of unknown aetiology that each included ≥ 50 cases. Two of them were strong‐evidence outbreaks caused by fish preparation and other/unspecified food.
Several reasons may explain the reporting of unknown/unspecified agents including failure to detect the causative agents in either patients or food, the unavailability of clinical or food samples (e.g. leftovers), etc.
In 2020, the COVID‐19 pandemic may have had an indirect impact in increasing the number of outbreaks of unknown aetiology, since people were less likely to visit doctors or hospitals. As a result, the reporting of milder illnesses was often delayed or interrupted. The reduced availability of laboratories whose resources and activities were frequently diverted to COVID‐19 may also have been a contributing factor.
Short‐term relative variations (%) in 2020 as compared to 2019, in the annual number of strong‐evidence and weak‐evidence outbreaks for specific causative agents per MS, are shown in Figure 51.
Figure 51.

foodborne outbreaks reported in 2020, by country and by causative agent and % of difference compared with 2019, in reporting EU MS and non‐MS
- A blank value in the variation (%) column indicates that the 2020/2019 variation cannot be calculated because no outbreaks were reported in 2020 or in 2019. Slovenia is not shown because no outbreaks were detected in 2020.‘Bacillus toxins’ includes Bacillus cereus, Bacillus cereus enterotoxins, and B. subtilis (only one outbreak of B. subtilis reported by the United Kingdom).‘Staphylococcus aureus toxins’ includes staphylococcal enterotoxins.‘Norovirus and other calicivirus’ includes norovirus (Norwalk‐like virus), sapovirus (Sapporo‐like virus), calicivirus unspecified.‘Marine biotoxins' includes ciguatoxin and other unspecified marine toxins.
4.3. Overview of food vehicles implicated in foodborne outbreaks
This section describes the characteristics of food vehicles implicated in FBO reported by MS and other non‐MS countries in 2020. For this purpose, only strong‐evidence outbreaks are considered since these are the only events for which the link between the food consumption and the illnesses was proved with minimal uncertainty. Strong‐evidence outbreaks represent a minority of all FBO reported in 2020 (248 outbreaks, 8.0%). Given that the number of strong‐evidence FBO decreased considerably in 2020 compared to previous years, the assessment of the time trend (trend‐watching) at EU level is mainly based on a comparison of the relative frequency of occurrence of the foods implicated in outbreaks over the years. Link to EFSA story map on FBO (see story map section on ‘what foods may cause foorborne outbreaks’).
4.3.1. Food vehicles in strong‐evidence outbreaks
An overview of the food vehicles implicated in strong‐evidence outbreaks and illnesses in the EU in 2020 is shown in Table 66. For a correct interpretation of the data, it must be remembered that the pattern of food vehicles implicated in outbreaks at the EU level, is highly influenced by the countries making the greatest contribution to the collection of data on strong‐evidence outbreaks (Table 64). In 2020, three MS (France, Poland and Sweden) provided information on more than half of the total number of strong‐evidence outbreaks (132 outbreaks, 53.2% of strong‐evidence outbreaks), while data on the remaining outbreaks (116 outbreaks) were reported by 16 MS.
Table 66.
Frequency distribution of strong‐evidence foodborne outbreaks, by food vehicle, in reporting EU MS, 2020
| Type of vehicle | Strong‐evidence outbreaks | Reporting Rate per 100,000 | Rank | ||||||||||
|---|---|---|---|---|---|---|---|---|---|---|---|---|---|
| Outbreaks | Cases | Hospitalisations | Deaths | 2020 | 2010–2019 | 2010–2019 (EU‐27) | 2020 | 2010–2019 | |||||
| N | % of total | N | % of total | N | % of total | N | % of total | ||||||
| Fish and fishery products | |||||||||||||
| Crustaceans, shellfish, molluscs and products thereof | 38 | 15.3 | 662 | 13.5 | 6 | 1.5 | 0 | 0 | 0.008 | 0.011 | 0.012 | 2 | 3 |
| Fish and fish products | 27 | 10.9 | 265 | 5.4 | 55 | 13.5 | 8 | 53.3 | 0.006 | 0.010 | 0.012 | 4 | 4 |
| Subtotal | 65 | 26.2 | 927 | 18.9 | 61 | 15.0 | 8 | 53 | 0.015 | 0.022 | 0.023 | – | – |
| Meat and meat products | |||||||||||||
| Pig meat and products thereof | 16 | 6.5 | 123 | 2.5 | 27 | 6.6 | 0 | 0 | 0.004 | 0.008 | 0.009 | 5 | 6 |
| Broiler meat and products thereof | 7 | 2.8 | 206 | 4.2 | 9 | 2.2 | 0 | 0 | 0.002 | 0.007 | 0.006 | 11 | 10 |
| Bovine meat and products thereof | 6 | 2.4 | 114 | 2.3 | 1 | 0.2 | 0 | 0 | 0.001 | 0.004 | 0.004 | 12 | 13 |
| Other or mixed red meat and products thereof | 12 | 4.8 | 255 | 5.2 | 37 | 9.1 | 6 | 40.0 | 0.003 | 0.007 | 0.007 | 6 | 8 |
| Other, mixed and/or unspecified poultry meat and products thereof | 2 | 0.8 | 20 | 0.4 | 15 | 3.7 | 0 | 0 | < 0.001 | 0.002 | 0.001 | 20 | 20 |
| Subtotal | 43 | 17.3 | 718 | 14.6 | 89 | 21.9 | 6 | 40.0 | 0.010 | 0.028 | 0.028 | – | – |
| Eggs and egg products | 39 | 15.7 | 312 | 6.3 | 46 | 11.3 | 0 | 0 | 0.009 | 0.023 | 0.026 | 1 | 1 |
| Food of non‐animal origin | |||||||||||||
| Cereal products including rice and seeds/pulses | 5 | 2.0 | 103 | 2.1 | 0 | 0.0 | 0 | 0 | 0.001 | 0.002 | 0.002 | 13 | 18 |
| Fruit, berries and juices and products thereof | 4 | 1.6 | 175 | 3.6 | 41 | 10.1 | 0 | 0 | 0.001 | 0.002 | 0.002 | 17 | 17 |
| Herbs and spices | 2 | 0.8 | 94 | 1.9 | 13 | 3.2 | 0 | 0 | < 0.001 | < 0.001 | < 0.001 | 22 | 24 |
| Vegetables and juices and products thereof | 12 | 4.8 | 385 | 7.8 | 6 | 1.5 | 0 | 0 | 0.003 | 0.007 | 0.007 | 7 | 9 |
| Subtotal | 23 | 9.3 | 757 | 15.4 | 60 | 14.7 | 0 | 0 | 0.005 | 0.011 | 0.011 | – | – |
| Milk and milk products | |||||||||||||
| Milk | 9 | 3.6 | 186 | 3.8 | 46 | 11.3 | 0 | 0 | 0.002 | 0.003 | 0.003 | 9 | 14 |
| Cheese | 4 | 1.6 | 107 | 2.2 | 19 | 4.7 | 1 | 6.7 | 0.001 | 0.004 | 0.004 | 15 | 12 |
| Dairy products (other than cheeses) | 3 | 1.2 | 32 | 0.7 | 2 | 0.49 | 0 | 0 | 0.001 | 0.001 | 0.001 | 18 | 21 |
| Subtotal | 16 | 6.5 | 325 | 6.6 | 67 | 16.5 | 1 | 6.7 | 0.004 | 0.008 | 0.008 | – | – |
| Composite foods, multi‐ingredients foods and other foods | |||||||||||||
| Bakery products | 11 | 4.4 | 263 | 5.4 | 21 | 5.2 | 0 | 0 | 0.002 | 0.007 | 0.008 | 8 | 7 |
| Buffet meals | 4 | 1.6 | 190 | 3.9 | 3 | 0.7 | 0 | 0 | 0.001 | 0.004 | 0.004 | 16 | 11 |
| Canned food products | 2 | 0.8 | 17 | 0.3 | 17 | 4.2 | 0 | 0 | < 0.001 | < 0.001 | < 0.001 | 21 | 23 |
| Mixed food | 28 | 11.3 | 1,028 | 20.9 | 27 | 6.6 | 0 | 0 | 0.006 | 0.018 | 0.020 | 3 | 2 |
| Sweets and chocolate | 3 | 1.2 | 94 | 1.9 | 11 | 2.7 | 0 | 0 | 0.001 | 0.002 | 0.003 | 19 | 16 |
| Other foods | 8 | 3.2 | 123 | 2.5 | 1 | 0.2 | 0 | 0 | 0.002 | 0.008 | 0.009 | 10 | 5 |
| Subtotal | 56 | 22.6 | 1,715 | 34.9 | 80 | 19.7 | 0 | 0 | 0.013 | 0.040 | 0.044 | – | – |
| Water | 6 | 2.4 | 160 | 3.3 | 4 | 1.0 | 0 | 0 | 0.001 | 0.002 | 0.001 | 14 | 12 |
| Total (EU) | 248 | 100 | 4,914 | 100 | 407 | 100 | 15 | 100 | 0.055 | 0.134 | 0.146 | – | – |
Note: Single food items are consolidated into major groups according to their origin. The columns ‘Outbreak Reporting Rate’ includes the mean outbreak reporting rate per 100,000 for 2020 and for the previous years (2010–2019) for trend watching. The ranking of each food item provides a visual demonstration of the relative importance of the item, among all food vehicles implicated in foodborne outbreaks, for the same year and period.
Bakery products includes ‘Bakery products', ‘Bakery products ‐ cakes', ‘Bakery products ‐ cakes ‐ containing raw cream', ‘Bakery products ‐ desserts ‐ containing raw eggs', ‘Bakery products ‐ pastry ‐ yeast leavened pastry'.
Bovine meat and products thereof include ‘Bovine meat and products thereof', ‘Meat from bovine animals ‐ meat products', ‘Meat from bovine animals ‐ meat products ‐ ready‐to‐eat'.
Cereal products including rice and seeds/pulses include, ‘Cereal products including rice and seeds/pulses (nuts, almonds)', ‘Nuts and nut products'.
Cheese includes ‘Cheese', ‘Cheeses made from cows' milk'.
Crustaceans, shellfish, molluscs and products thereof' includes ‘Crustaceans, shellfish, molluscs and products thereof', ‘Live bivalve molluscs ‐ oysters'.
Eggs and egg products include ‘Eggs', ‘Eggs ‐ raw material (liquid egg) for egg products', ‘Eggs ‐ table eggs ‐ mixed whole', ‘Eggs and egg products'.
Fish and fish products include ‘Fish ‐ smoked', ‘Fish ‐ smoked ‐ hot‐smoked', ‘Fish and fish products'.
Fruit, berries and juices and other products thereof includes ‘Fruit, berries and juices and other products thereof', ‘Fruit ‐ whole'.
Milk includes ‘Milk, cows' ‐ pasteurised milk', ‘Milk, cows' ‐ raw milk', ‘Milk, goats' ‐ raw milk', ‘Milk, sheep's ‐ raw milk'.
Mixed food includes ‘Mixed food', ‘Other processed food products and prepared dishes', ‘Other processed food products and prepared dishes ‐ meat based dishes', ‘Other processed food products and prepared dishes ‐ pasta', ‘Other processed food products and prepared dishes ‐ pasta based dishes', ‘Other processed food products and prepared dishes ‐ sushi', ‘Soups'.
Other or mixed red meat and products thereof includes ‘Meat and meat products', ‘Meat from wild boar ‐ meat products ‐ fresh raw sausages', ‘Meat, mixed meat ‐ meat products ‐ ready‐to‐eat', ‘Other or mixed red meat and products thereof'.
Other, mixed or unspecified poultry meat and products thereof includes ‘Meat from poultry, unspecified ‐ meat products ‐ non‐ready‐to‐eat', ‘Other, mixed or unspecified poultry meat and products thereof'.
Pig meat and products thereof includes ‘Meat from pig ‐ fresh', ‘Meat from pig ‐ meat products ‐ fresh raw sausages', ‘Pig meat and products thereof'.
Vegetables and juices and other products thereof include ‘Vegetables', ‘Vegetables ‐ pre‐cut', ‘Vegetables and juices and other products thereof'.
Food of animal origin
The consumption of foods of animal origin (‘fish and fishery products’, ‘meat and meat products’, ‘eggs and egg products’ and ‘milk and milk products’) was associated with most of the strong‐evidence FBO (163 outbreaks; 65.7%), illnesses (2,282 cases; 46.5%) and hospitalisations (263; 64.2%) reported in the EU in 2020. These foodstuffs were also implicated in all outbreak‐associated deaths reported in strong‐evidence outbreaks.
‘Eggs and egg products’ were implicated in 39 strong‐evidence outbreaks reported by five MS, primarily France and Poland (15 outbreaks each) followed by Italy, Spain and Slovakia (9 outbreaks altogether). Details of the implicated ‘eggs and egg products’ were provided for a few outbreaks and included ‘table eggs ‐ mixed whole’ (12 outbreaks), ‘raw material (liquid egg) for egg products’ (three outbreaks) and ‘eggs’ (one outbreak). For 23 outbreaks no further description of the type of vehicle was available. Almost all the outbreaks caused by the consumption of ‘eggs and egg products’ were associated with Salmonella (N = 37) and in particular with S. Enteritidis (25 outbreaks). For two FBO, the causative agent was unknown. The largest outbreak was reported by Poland and included 116 cases. A major outbreak caused by table egg ‘shells’ contaminated with S. Enteritidis was also reported in the United Kingdom as a continuation of an outbreak reported in the previous year involving 59 cases. All cases were linked to the outbreak through the whole genome sequencing of S. Enteritidis clinical isolates. Compared with recent years the prominence of ‘eggs and egg products’ as an implicated vehicle did not change substantially in 2020 (15.1% of all foods detected in strong‐evidence outbreaks).
‘Crustaceans, shellfish, molluscs and products thereof’ (including ‘live bivalve molluscs’) were linked to 38 strong‐evidence outbreaks reported by four MS, primarily France and Sweden (32 outbreaks, altogether), followed by Spain (four outbreaks) and Denmark (two outbreaks). Most of these outbreaks were caused by norovirus and other calicivirus (28 outbreaks). One outbreak was associated with Campylobacter. For 9 outbreaks, the information on the causative agent was unknown. A total of 662 cases were involved in these outbreaks. In the Danish outbreaks, the implicated food was ‘oysters’, while for the others the type of food was not specified. In 2020, ‘crustaceans, shellfish, molluscs and products thereof’ were reported in a lower percentage of outbreaks than in 2019, although the figure remained considerably higher than in previous years.
‘Fish and fish products’ were the fourth most frequently reported vehicle group implicated in strong‐evidence FBO in the EU. The 27 outbreaks reported had a relevant health impact, with 55 hospitalisations and eight deaths, the highest number of deaths among strong‐evidence outbreaks in 2020 and the highest numbers ever reported for this foodstuff since 2010. Outbreaks associated with the consumption of ‘fish and fish products’ decreased in 2020 following the 2015–2019 period, when 51 outbreaks/year were reported. Ten MS (Austria, Belgium, Denmark, Finland, France, Germany, Italy, the Netherlands, Spain, Sweden) and the United Kingdom reported outbreaks caused by ‘fish and fish products’. The most severe outbreaks were all caused by L. monocytogenes and were reported by the Netherlands and Germany. Two of them were linked to the consumption of ‘trout filet’ and involved a total of 46 cases, 41 hospitalisations and seven deaths. A third outbreak caused by ‘eel’ involved eight cases, all hospitalised, with one death. In the United Kingdom two deaths were also reported among cases involved in an outbreak linked to ‘smoked salmon’ caused by L. monocytogenes. Other causative agents detected in outbreaks associated with the consumption of ‘fish and fish products’ were histamine and scombrotoxin (12 outbreaks), Anisakis, marine biotoxins, toxins by B. cereus, C. botulinum and C. perfringens (one outbreak each). For two outbreaks, the implicated vehicle was unknown.
In 2020, 14 MS (Austria, Belgium, Croatia, Denmark, Finland, France, Germany, Hungary, Italy, Lithuania, Poland, Romania, Spain and Sweden) and three non‐MS (North Macedonia, Serbia and the United Kingdom) reported outbreaks associated with the consumption of ‘meat and meat products’. Within this food group, ‘pig meat and products thereof’ were the meat type most frequently identified (16 outbreaks). The causative agents implicated in these outbreaks included Salmonella (11 outbreaks), Trichinella (two outbreaks) and toxins by C. perfringens and C. botulinum toxins and other unspecified toxin‐producing bacteria (one outbreak each). ‘Bovine meat and products thereof’ were implicated in six outbreaks caused mainly by bacterial toxins, including S. aureus, C. perfringens and other unspecified bacteria (four outbreaks altogether) and Salmonella (two outbreaks).
For a further interactive look into FBO data: Link to the dashboard (different filters can be applied; outbreaks by food vehicle are visualised) in dedicated dashboard pages.
Among the outbreaks associated with the consumption of ‘meat and meat products’, those linked to ‘other or mixed red meat and products thereof’ (12 outbreaks) had the highest health burden in 2020 as these were associated with 255 cases, 37 hospitalisations and six deaths. The causative agents identified in these outbreaks were Salmonella (five outbreaks), Trichinella (three outbreaks), L. monocytogenes (two outbreaks), STEC and C. perfringens toxins (one outbreak each).
Overall, the relative frequency of ‘pig meat and products thereof’, ‘bovine meat and products thereof’ and ‘other or mixed red meat and products thereof’ among the outbreaks reported in 2020 did not change substantially compared with previous years. However, a slight increase was observed for outbreaks associated with the consumption of ‘pig meat and products thereof’ which accounted for 3.7% of all outbreaks in 2016 and for 6.5% in 2020.
Campylobacter (four outbreaks), Salmonella (two outbreaks) and other unspecified bacteria (one outbreak) were the causative agents associated with the consumption of ‘broiler meat and products thereof’ in a total of seven outbreaks. The largest general outbreak associated with this food was caused by C. jejuni and involved 150 cases in Sweden. ‘Other, mixed and/or unspecified poultry meat and products thereof’ were identified as the implicated vehicle in two outbreaks caused by S. Enteritidis.
‘Milk’, ‘cheese’ and ‘dairy products’ were reported in 16 strong‐evidence outbreaks by eight MS (Austria, Denmark, Finland, France, Germany, Italy, the Netherlands and Slovakia), with 325 cases, 67 hospitalisations and one death. Five milk‐borne outbreaks of infection by tick‐borne Encephalitis virus (TBE) involving single households and associated with the consumption of ‘raw milk’ from goats and sheep were reported by Austria and Slovakia. The consumption of ‘raw milk’ from cattle was also responsible for three Campylobacter outbreaks detected in Germany. Campylobacter was also implicated in the post‐harvest contamination of pasteurised cow milk, causing the major general outbreak in Denmark. Various types of ‘cheese’ including soft cheese, raw milk cheese and other unspecified cheeses were identified as the implicated vehicle in outbreaks caused by S. Enteritidis, L. monocytogenes, STEC and S. aureus toxins. In Italy, S. Enteritidis was responsible for a single outbreak linked to cheese, and that caused 86 cases, eight hospitalisations and one death. STEC, Salmonella and S. aureus toxins were also identified in three outbreaks associated with the consumption of contaminated ‘dairy products’.
Among non‐MS, two milk‐borne outbreaks caused by Campylobacter and one caused by STEC O157 were reported by the United Kingdom, which also notified a single outbreak of C. perfringens toxins linked to the consumption of spreadable cheese. Finally, it is important to underline that the most severe outbreak reported to EFSA in 2020, in terms of the number of deaths, was reported by Switzerland and was associated with the consumption of cheese contaminated by L. monocytogenes.
Foods of non‐animal origin
In 2020, ten MS (Belgium, Denmark, Finland, France, Germany, Italy, Luxembourg, Poland, Spain and Sweden) reported 23 outbreaks associated with the consumption of food of non‐animal origin (FNAO). FNAO were associated with outbreaks caused by the largest variety of causative agents. ‘Vegetables and juices and other products thereof’ (12 outbreaks) were the most frequently reported food vehicle in this group. Interestingly, the mean size of the outbreaks associated with this food category (32.1 cases/outbreak) was more than twice that of the outbreaks linked to the consumption of foods of animal origin (14 cases/outbreak). The items described in this group included various types of fresh, pre‐cut and frozen vegetables. ‘Vegetables and juices and other products thereof’ were implicated in food poisoning by the bacterial toxins of B. cereus (three outbreaks), C. botulinum and C. perfringens (two outbreaks each). Other vegetable‐associated outbreaks were caused by S. Kedougou, norovirus, C. parvum (one outbreak each) and lectin (two outbreaks). Vegetable‐associated outbreaks fell considerably in 2020 compared to previous years. The difference with 2019 (31 outbreaks in 2019, a decrease of 60.0%) was mainly due to the fact that this kind of outbreak is less likely to be reported in settings such as ‘restaurants, pubs, street vendors, takeaway, etc.’ (two outbreaks reported in 2020 vs 13 outbreaks reported in 2019).
‘Fruit, berries and juices and other products thereof’ were implicated in two outbreaks caused by S. Enteritidis and S. Muenchen, in Poland and Germany, respectively. The German outbreak was caused by the consumption of contaminated coconut pieces or coconut flakes and involved 161 cases with 37 hospitalisations. Two outbreaks of Hepatitis A were also reported by Sweden and Poland. Hepatitis A outbreaks linked to the consumption of frozen berries have been a recurrent problem in Europe in the last decade (Ruscher et al., 2020).
Other FNAO implicated in outbreaks reported in 2020 included, ‘nuts and nut products’, cooked spaetzli, pre‐cooked rice and other unspecified ‘cereal products including rice and seeds/pulses (nuts, almonds)’. Overall, these FNAO were identified in five outbreaks reported by three MS (France, Germany, Luxembourg) and causing 103 cases. Four of these outbreaks were caused by B. cereus toxins and one by S. Typhimurium. One outbreak reported by Denmark as associated with the consumption of imported fresh mint (included in the ‘herbs and spices’ category) was caused by Shigella sonnei and involved 44 cases and 13 hospitalisations. The cases were part of a major general multicountry outbreak. Vibrio parahaemolyticus was detected in outbreaks associated with the consumption of seagrass in Sweden. Also, in 2020, the United Kingdom notified EFSA of a single outbreak caused by S. Typhimurium in Brazil nuts, which was part of a larger multicountry outbreak.
Composite foods, multi‐ingredient foods and other foods
Composite foods, multi‐ingredient foods and other foods include foods resulting from the assembly of multiple ingredients or highly processed or manipulated foods. Outbreaks associated with these foodstuffs were larger on average (30.6 cases/outbreak) than those associated with foods of animal origin (14 cases/outbreak). In 2020, the consumption of ‘mixed food’ caused the highest number of cases of illness (N = 1,028, Table 66) in 28 strong‐evidence outbreaks. These foodstuffs were associated with a wide range of causative agents including bacteria (Salmonella, Yersinia, Campylobacter), bacterial toxins (Clostridium perfringens, Bacillus cereus, Staphylococcus aureus), parasites (Enterocytozoon bieneusi), norovirus and other caliciviruses and unknown or unspecified agents. Outbreaks caused by ‘mixed food’ were mainly general outbreaks and were reported by 11 MS (Belgium, Denmark, Finland, France, Germany, Italy, the Netherlands, Poland, Portugal, Romania and Spain). Two large outbreaks (> 100 cases) linked to mixed food were reported by Denmark and Italy. Mixed food outbreaks were also reported by Switzerland (two outbreaks) and Iceland (one outbreak). The number of outbreaks associated with the consumption of mixed food in the EU fell dramatically in 2020, with 56 fewer outbreaks than in 2019 (84 outbreaks, 66.7% decrease).
Outbreaks caused by ‘bakery products’ (11 outbreaks) were mostly associated with S. Enteritidis (10 outbreaks) and were mainly reported by Poland. Serbia also reported a single outbreak implicating the same food/agent combination. Two outbreaks caused by norovirus and linked to the consumption of ‘bakery products’ were reported by Sweden and Finland, with the first involving 200 cases. The number of outbreaks linked to bakery products also decreased considerably compared to 2019 (39 outbreaks, 71.8% decrease).
Only four outbreaks associated with the consumption of ‘buffet meals’ were reported in 2020, from Lithuania, Denmark and Finland. The largest event, involving 124 cases in Finland, was caused by norovirus.
In 2020, Hungary and Italy reported three outbreaks, associated with the consumption of ‘sweets and chocolate’, all caused by Salmonella. The outbreak in Hungary involved 78 cases and seven hospitalisations.
All but one of the outbreaks caused by the consumption of ‘other foods’, unspecified were reported by France (seven outbreaks). Six were associated with bacterial toxin food poisoning by B. cereus, C. perfringens and other unidentified toxin‐producing bacteria. Spain also reported a single Salmonella outbreak associated with ‘other foods’.
The causative agents associated with the consumption of different types of food implicated in strong‐evidence FBO are shown in the stacked bar chart in Figure 52.
Figure 52.

Frequency distribution (%) of causative agents associated with strong‐evidence foodborne outbreaks, by food vehicle, in reporting EU MS, 2020
- Note: N = number of strong‐evidence outbreaks by food type.‘Other bacterial agents’ include Escherichia coli other than STEC, Shigella, Vibrio parahaemolyticus and other bacteria, unspecified.‘Bacillus cereus toxins’ include Bacillus cereus, Bacillus cereus enterotoxins.‘Staphylococcus aureus toxins’ include staphylococcal enterotoxins.‘Norovirus and other calicivirus’ include norovirus (Norwalk‐like virus), sapovirus (Sapporo‐like virus), calicivirus unspecified.‘Marine biotoxins' include ciguatoxin and other unspecified marine toxins.Composite foods, multi‐ingredients foods and other foods include ‘Bakery products', ‘Bakery products ‐ cakes', ‘Bakery products ‐ cakes ‐ containing raw cream', ‘Bakery products ‐ desserts ‐ containing raw eggs', ‘Bakery products ‐ pastry ‐ yeast leavened pastry', ‘Buffet meals', ‘Canned food products', ‘Mixed food', ‘Other foods', ‘Other processed food products and prepared dishes', ‘Other processed food products and prepared dishes ‐ meat based dishes', ‘Other processed food products and prepared dishes ‐ pasta', ‘Other processed food products and prepared dishes ‐ pasta based dishes', ‘Other processed food products and prepared dishes ‐ sushi', ‘Soups', ‘Sweets and chocolate'.Eggs and egg products include ‘Eggs', ‘Eggs ‐ raw material (liquid egg) for egg products', ‘Eggs ‐ table eggs ‐ mixed whole', ‘Eggs and egg products'.Fish and fishery products include ‘Crustaceans, shellfish, molluscs and products thereof', ‘Fish ‐ smoked', ‘Fish ‐ smoked ‐ hot‐smoked', ‘Fish and fish products', ‘Live bivalve molluscs ‐ oysters'.Foods of non‐animal origin includes ‘Cereal products including rice and seeds/pulses (nuts, almonds)’, ‘Fruit, berries and juices and other products thereof', ‘Fruit ‐ whole', ‘Herbs and spices', ‘Nuts and nut products', ‘Vegetables', ‘Vegetables ‐ pre‐cut', ‘Vegetables and juices and other products thereof'.Meat and meat products includes ‘Bovine meat and products thereof', ‘Broiler meat (Gallus gallus) and products thereof', ‘Meat and meat products', ‘Meat from bovine animals ‐ meat products', ‘Meat from bovine animals ‐ meat products ‐ ready‐to‐eat', ‘Meat from pig ‐ fresh', ‘Meat from pig ‐ meat products ‐ fresh raw sausages', ‘Meat from poultry, unspecified ‐ meat products ‐ non‐ready‐to‐eat', ‘Meat from wild boar ‐ meat products ‐ fresh raw sausages', ‘Meat, mixed meat ‐ meat products ‐ ready‐to‐eat', ‘Other or mixed red meat and products thereof', ‘Other, mixed or unspecified poultry meat and products thereof', ‘Pig meat and products thereof'.Milk and milk products includes ‘Cheese', ‘Cheeses made from cows' milk', ‘Dairy products (other than cheeses)', ‘Milk, cows' ‐ pasteurised milk', ‘Milk, cows' ‐ raw milk', ‘Milk, goats' ‐ raw milk', ‘Milk, sheep's ‐ raw milk'.Water (and other beverages) includes ‘Tap water, including well water', ‘Water'.
Tables 67–70 show the top 10 pairs of causative agents and food vehicles among outbreaks having the highest health impact in 2020 in the EU in terms of total outbreaks, cases, hospitalisations and deaths, respectively. The number of MS that reported outbreaks implicating each food/agent pair is also included in the tables, to indicate how common these types of outbreaks were in EU MS. Note that the MS making the greatest contribution to the collection of data may influence the rank of the pairs. This information is shown at the same time for the 2010–2019 period, for trend watching purposes.
Table 67.
Top 10 pathogen/food vehicle pairs causing the highest number of strong‐evidence outbreaks in reporting EU MS, 2020
| 2020 | 2010–2019 b | Evaluation 2020 vs. 2010–2019 c | ||||||
|---|---|---|---|---|---|---|---|---|
| Rank a | Causative agent | Food vehicle | Outbreaks (N) | Reporting MS (N outbreaks) | Rank a | Outbreaks (N/year) (range) | Reporting MS (N/year) | |
| 1 | Salmonella | Eggs and egg products d | 37 | France (15), Poland (15), Spain (5) Italy (1), Slovakia (1) | 1 | 104.5 (77–141) | 10.0 | ↓↓ |
| 2 | Norovirus and other calicivirus | Crustaceans, shellfish, molluscs and products thereof e | 28 | France (16), Sweden (9), Denmark (2), Spain (1) | 2 | 36.2 (8–144) | 6.1 | Stable |
| 3 | Histamine/scombrotoxin | Fish and fish products | 14 | Sweden (7), France (4), Germany (2), Belgium (1) | 3 | 31.5 (14–55) | 6.9 | ↓↓ |
| 4 | Salmonella | Pig meat and products thereof f | 11 | France (4), Italy (3), Poland (1), Hungary (1), Belgium (1), Croatia (1) | 6 | 18.9 (9–28) | 7.3 | ↓ |
| 5 | Salmonella | Bakery products g | 9 | Poland (9) | 4 | 25.7 (5–45) | 4.5 | ↓↓ |
| 6 | Clostridium perfringens toxins | Mixed food h | 8 | France (2), Denmark (2), Finland (1), Germany (1), Italy (1), Portugal (1) | 13 | 10.3 (3–23) | 4.5 | Stable |
| 7 | Bacillus cereus toxins | Mixed food i | 6 | France (2), Belgium (1), Germany (1), Poland (1), Spain (1) | 12 | 10.9 (7–16) | 4.7 | ↓ |
| 7 | Listeria monocytogenes | Fish and fish products j | 6 | Netherlands (2), Denmark (2), Germany (1), Austria (1) | 135 | 0.5 (0–2) | 0.4 | ↑↑ |
| 8 | Flavivirus including Tick‐borne encephalitis virus | Milk k | 5 | Slovakia (4), Austria (1) | 65 | 1.7 (0–3) | 1.2 | ↑↑ |
| 8 | Norovirus and other calicivirus | Mixed food l | 5 | Denmark (3), Finland (2) | 7 | 14.6 (3–9) | 6.3 | ↓↓ |
Rank of the food vehicle based on the number of strong‐evidence FBO in which the combination (causative agent/food vehicle) was implicated (rank 1 is the highest rank meaning the most commonly implicated). Strong‐evidence outbreaks with unknown causative agents are not included.
Outbreaks reported by the United Kingdom are also included.
A single arrow indicates variations of 25% and 50% in the number of outbreaks; double arrows indicate variations > 50%; a ‘stable’ value indicates variations between −25% and +25%.
‘Eggs and egg products' includes ‘Eggs and egg products ‐ unspecified' (21); ‘Eggs ‐ table eggs ‐ mixed whole (12)'; Eggs ‐ raw material (liquid egg) for egg products (3) and ‘Eggs ‐ unspecified' (1).
‘Crustaceans, shellfish, molluscs and products thereof' includes ‘Crustaceans, shellfish, molluscs and products thereof ‐ unspecified' (26); ‘Live bivalve molluscs ‐ oysters' (2).
‘Pig meat and products thereof' includes ‘Meat from pig ‐ meat products ‐ fresh raw sausages' (1) and ‘Pig meat and products thereof ‐ unspecified' (10).
‘Bakery products' includes ‘cakes ‐ containing raw cream' (6), ‘desserts ‐ containing raw eggs' (2) and ‘yeast leavened pastry' (1).
‘Mixed food' includes ‘Other processed food products and prepared dishes ‐ meat based dishes (1), pasta' (1); ‘Mixed food ‐ unspecified' (5) and ‘Soups' (1).
‘Mixed food' includes ‘Other processed food products and prepared dishes ‐ meat based dishes' (1); ‘Mixed food ‐ unspecified' (4) and ‘Soups' (1).
‘Fish and fish products' includes ‘Fish and fish products ‐ unspecified' (4); ‘Fish ‐ smoked' (1) and ‘Fish ‐ smoked ‐ hot‐smoked' (1).
‘Milk' includes ‘Milk, goats' ‐ raw milk' (1) and ‘Milk, sheep's ‐ raw milk (4).
‘Mixed food' includes ‘Other processed food products and prepared dishes ‐ meat based dishes' (1), sushi' (1) and ‘Mixed food ‐ unspecified' (3).
Table 70.
Top three pathogen/food vehicle pairs causing the highest number of deaths in strong‐evidence outbreaks, in reporting EU MS, 2020
| 2020 | 2010–2019 b | Evaluation 2020 vs. 2010–2019 c | ||||||
|---|---|---|---|---|---|---|---|---|
| Rank a | Causative agent | Food vehicle | Deaths (N) | Reporting MS (N deaths) | Rank a | Deaths (N/year) (range) | Reporting MS (N/year) | |
| 1 | Listeria monocytogenes | Fish and fish products d | 8 | Netherlands (5), Germany (3) | 34 | 0.1 (0–1) | 0.1 | ↑↑ |
| 2 | Listeria monocytogenes | Other or mixed red meat and products thereof e | 6 | Finland (6) | 3 | 1.6 (0–3) | 0.3 | ↑↑ |
| 3 | Salmonella | Cheese f | 1 | Italy (1) | 12 | 0.2 (0–1) | 0.2 | ↑↑ |
Rank of the food vehicle based on the number of deaths in strong‐evidence FBO in which the causative agent/food vehicle pair was implicated (rank 1 is the highest rank meaning the most commonly implicated). Strong‐evidence outbreaks with unknown causative agents are not included.
Single arrow indicates variations between 25% and 50% in the number of deaths; double arrows indicate variations > 50%; ‘stable’ value indicates variations between −25% and +25%.
A single arrow indicates variations of 25% and 50% in the number of outbreaks; double arrows indicate variations > 50%; a ‘stable’ value indicates variations between −25% and +25%.
‘Fish and fish products' includes ‘Fish and fish products ‐ unspecified' (8).
‘Other or mixed red meat and products thereof' includes ‘Meat, mixed meat ‐ meat products ‐ ready‐to‐eat' (6).
‘Cheese' includes ‘cheese ‐ unspecified' (1).
Among the most frequently implicated pairs of causative agents and food vehicles, Salmonella in ‘eggs and egg products’ caused the highest number of FBO in 2020. This combination ranked second for human cases and hospitalisations. Pairs involving Salmonella in other types of food (i.e. ‘pig meat and products thereof’, ‘bakery products’, ‘fruit, berries and juices and other products thereof’ and other type of mixed red meat or poultry meat and products thereof) were also frequently reported among the top‐10 pairs causing the highest number of hospitalisations.
Norovirus and other calicivirus in ‘crustaceans, shellfish, molluscs and products thereof’ were responsible for the highest number of cases and was the second most frequently reported pair implicated in FBO. Another three pairs involving norovirus and other calicivirus were reported among those associated with the highest number of hospitalisations. Highly manipulated food (i.e. ‘mixed food, ‘bakery products’ and ‘buffet meals’) were involved in all these pairs. L. monocytogenes in ‘fish and fish products’ was the agent/ food pair associated with the highest number of hospitalisations and deaths. This agent was also implicated in the pair causing the second highest number of deaths, in combination with ‘mixed red meat and products thereof’. Among the other combinations frequently reported, C. perfringens in mixed food’ was among the top‐10 pairs causing the highest number of FBO and cases. Contamination of ‘milk’ caused by Campylobacter was among the pairs associated with the highest number of cases and hospitalisations.
For a further interactive look into FBO data: Link to the dashboard (different filters can be applied; outbreaks by food and causative agents are visualised in a dedicated page of the dashboard).
4.3.2. Top‐10 agent/food pairs in strong‐evidence outbreaks associated with the highest impact on health in the EU, 2020
Table 68: Top 10 pathogen/food vehicle pairs causing the highest number of cases in strong‐evidence outbreaks in reporting EU MS, 2020
| 2020 | 2010–2019 b | Evaluation 2020 vs. 2010–2019 c | ||||||
|---|---|---|---|---|---|---|---|---|
| Rank a | Causative agent | Food vehicle | Cases (N) | Reporting MS (N Cases) | Rank a | Cases (N/year) (range) | Reporting MS (N/year) | |
| 1 | Norovirus and other calicivirus | Crustaceans, shellfish, molluscs and products thereof d | 611 | Denmark (393), Sweden (113), France (101), Spain (4) | 11 | 416.1 (104–1,152) | 6.1 | ↑ |
| 2 | Salmonella | Eggs and egg products e | 303 | Poland (162), France (86), Spain (48), Slovakia (5), Italy (2) | 3 | 1,175.1 (699–1,989) | 10.0 | ↓↓ |
| 3 | Clostridium perfringens toxins | Mixed food f | 292 | Denmark (45), Finland (42), France (41), Germany (16), Italy (128), Portugal (20) | 12 | 404.3 (157–835) | 4.5 | ↓ |
| 4 | Norovirus and other calicivirus | Mixed food g | 233 | Denmark (208), Finland (25) | 6 | 626.8 (159–1,741) | 6.3 | ↓↓ |
| 5 | Norovirus and other calicivirus | Bakery products h | 207 | Sweden (200), Finland (7) | 35 | 102.3 (20–306) | 1.9 | ↑↑ |
| 6 | Yersinia | Mixed food i | 200 | Denmark (200) | 129 | 9.3 (13 ‐ 80) | 0.2 | ↑↑ |
| 7 | Norovirus and other calicivirus | Buffet meals | 183 | Finland (124), Denmark (59) | 9 | 450.8 (163–808) | 3.5 | ↓↓ |
| 8 | Campylobacter | Broiler meat (Gallus gallus) and products thereof | 175 | Sweden (150), Denmark (20), France (5) | 5 | 724.6 (105–3,128) | 4.8 | ↓↓ |
| 9 | Campylobacter | Milk j | 174 | Denmark (161), Germany (13) | 37 | 94.1 (16–294) | 2.3 | ↑↑ |
| 10 | Salmonella | Fruit, berries and juices and other products thereof k | 163 | Germany (161), Poland (2) | 9 | 10 (0–54) | 0.8 | ↑↑ |
Rank of the food vehicle based on the number of cases of illness in strong‐evidence FBO in which the combination (causative agent/food vehicle) was implicated (rank 1 is the highest rank meaning the most commonly implicated). Strong‐evidence outbreaks with unknown causative agents are not included.
Outbreaks reported by the United Kingdom are also included.
A single arrow indicates variations of 25% and 50% in the number of outbreaks; double arrows indicate variations > 50%; a ‘stable’ value indicates variations between −25% and +25%.
‘Crustaceans, shellfish, molluscs and products thereof’ includes ‘Crustaceans, shellfish, molluscs and products thereof ‐ unspecified’ (218); ‘Live bivalve molluscs ‐ oysters’ (393).
‘Eggs and egg products’ includes ‘Eggs and egg products ‐ unspecified’ (136); ‘Eggs‐table eggs‐mixed whole (151)’; Eggs ‐ raw material (liquid egg) for egg products (11) and ‘Eggs ‐ unspecified’ (5).
‘Mixed food’ includes ‘Other processed food products and prepared dishes ‐ meat based dishes (16), pasta‐ based dishes (40); ‘Mixed food ‐ unspecified’ (194) and ‘Soups’ (42).
‘Mixed food’ includes ‘Other processed food products and prepared dishes ‐ meat based dishes’ (99), sushi’ (40) and ‘Mixed food ‐ unspecified’ (94).
‘Bakery products’ includes ‘Bakery products‐ unspecified’ (200) and ‘Cakes’ (7).
‘Mixed food’ includes ‘Other processed food products and prepared dishes ‐ pasta’ (200).
‘Milk’ includes ‘Milk, cows’ ‐ pasteurised milk’ (161) and ‘Milk, cows’ ‐ raw milk’ (13).
‘Fruit, berries and juices and other products thereof’ includes ‘Fruit, berries and juices and other products thereof ‐ unspecified’ (161) and ‘Fruit ‐ whole’ (2).
Table 69: Top 10 pathogen/food vehicle pairs causing the highest number of hospitalisations, in strong‐evidence outbreaks in reporting EU MS, 2020
| 2020 | 2010–2019 b | Evaluation 2020 vs. 2010–2019 c | ||||||
|---|---|---|---|---|---|---|---|---|
| Rank a | Causative agent | Food vehicle | Hospitalisations (N) | Reporting MS (N Hospitalisations) | Rank a | Cases (N/year) (range) | Reporting MS (N/year) | |
| 1 | Listeria monocytogenes | Fish and fish products d | 51 | Germany (31), Netherlands (18), Austria (2) | 76 | 4.7 (0–21) | 0.4 | ↑↑ |
| 2 | Salmonella | Eggs and egg products e | 46 | France (19), Poland (19), Spain (8) | 1 | 285. (156–382) | 9.1 | ↓↓ |
| 3 | Salmonella | Fruit, berries and juices and other products thereof f | 38 | Germany (37), Poland (1) | 76 | 2.1 (0–8) | 0.5 | ↑↑ |
| 4 | Campylobacter | Milk g | 34 | Denmark (33), Germany (1) | 28 | 9.9 (1–28) | 1.3 | ↑↑ |
| 5 | Salmonella | Pig meat and products thereof h | 22 | France (7), Hungary (6), Belgium (4), Italy (4), Croatia (1) | 4 | 83.8 (23–228) | 5.5 | ↓↓ |
| 6 | Salmonella | Bakery products i | 21 | Poland (21) | 5 | 82.6 (21–148) | 4.3 | ↓↓ |
| 7 | Salmonella | Other or mixed red meat and products thereof l | 19 | Germany (15), France (2), Spain (2) | 8 | 54.4 (15–156) | 3.1 | ↓↓ |
| 8 | Clostridium botulinum | Canned food products | 17 | Italy (17) | 70 | 2.3 (0–7) | 0.9 | ↑↑ |
| 9 | Salmonella | Other, mixed or unspecified poultry meat and products thereof k | 15 | Lithuania (10), Poland (5) | 32 | 8.9 (0–26) | 1.5 | ↑↑ |
| 10 | Listeria monocytogenes | Other or mixed red meat and products thereof l | 14 | Finland (14) | 14 | 21.2 (0–165) | 0.6 | ↓ |
Rank of the food vehicle based on the number of strong‐evidence FBO in which the combination (causative agent/food vehicle) was implicated (rank 1 is the highest rank meaning the most commonly implicated). Strong‐evidence outbreaks with unknown causative agents are not included.
Outbreaks reported by the United Kingdom are also included.
A single arrow indicates variations of 25% and 50% in the number of outbreaks; double arrows indicate variations > 50%; a ‘stable’ value indicates variations between −25% and +25%.
‘Fish and fish products' includes ‘Fish and fish products ‐ unspecified' (51).
‘Eggs and egg products' includes ‘Eggs and egg products ‐ unspecified' (27); ‘Eggs ‐ table eggs ‐ mixed whole (15)' and ‘Eggs ‐ raw material (liquid egg) for egg products (4).
‘Fruit, berries and juices and other products thereof' includes ‘Fruit, berries and juices and other products thereof ‐unspecified' (37) and ‘Fruit ‐ whole' (1).
‘Milk' includes ‘Milk, cows' ‐ pasteurised milk' (33) and ‘Milk, cows' ‐ raw milk' (1).
‘Pig meat and products thereof' includes ‘Pig meat and products thereof ‐ unspecified' (22).
‘Bakery products' includes ‘cakes ‐ containing raw cream' (17), ‘desserts ‐ containing raw eggs' (3) and ‘yeast leavened pastry' (1).
‘Other or mixed red meat and products thereof' includes ‘Meat and meat products' (18) and ‘Other or mixed red meat and products thereof' (1).
‘Other, mixed or unspecified poultry meat and products thereof' includes ‘Meat from poultry, unspecified ‐ meat products ‐ non‐ready‐to‐eat' (5) and ‘Other, mixed or unspecified poultry meat and products thereof' (10).
‘Other or mixed red meat and products thereof' includes ‘Meat, mixed meat ‐ meat products ‐ ready‐to‐eat' (14).
4.3.3. Distribution of food vehicles implicated in strong‐evidence and weak‐evidence outbreaks caused by different agents in the EU
The description of foodstuffs most frequently implicated in foodborne outbreaks provides useful indications on the sources to be targeted by control policies at primary production level or in the various food preparation sectors in order to reduce the public health impact of foodborne pathogens in humans. For each causative agent, the food vehicles implicated in outbreaks in 2020 are described in Figure 53 which includes several bar charts (one for each causative agent), where foodstuffs implicated in strong‐evidence FBO (dark coloured bars on the right) are viewed against the suspect foods implicated in weak‐evidence outbreaks (light coloured bars on the left). This graphic presents the bulk of the information provided by MS on food, while at the same time showing the different levels of uncertainty affecting the findings. Data on foods implicated in weak‐evidence FBO must be interpreted with caution, given the high level of uncertainty affecting evidence from weak‐evidence FBO.
Figure 53.

Distribution (%) of food vehicles implicated in strong‐ and weak‐evidence foodborne outbreaks in reporting EU MS, 2020.
Despite the fact that strong‐evidence foodborne outbreaks (N = 248) for 2020 totalled just one third of the number reported for 2019 (N = 754), the distribution of food vehicles associated with the various causative agents was fairly consistent with recent years. The ranking of each food type in weak‐evidence outbreaks showed no major discrepancies with the ranking for strong‐evidence outbreaks, whatever the causative agents. In 2020, 21 MS made reports to EFSA concerning the suspected food vehicle in 1,259 weak‐evidence outbreaks (40.8% of all outbreaks).
Of the most risky foods, ‘water’ ranked first in 2020 for vehicles implicated in STEC outbreaks. The increasing importance of water in STEC outbreaks was also highlighted in 2019. Since the zoonotic origin of STEC is well documented, this effectively exemplifies the complexity of STEC epidemiology and the importance of environmental pathways in the transmission of STEC infections to humans. In 2020, 17 waterborne outbreaks were caused by STEC, reported by four MS (France, Greece, Ireland and Italy).
4.4. Overview of the places of exposure in strong‐evidence outbreaks
Outbreaks may take place in a variety of settings and human cases may be exposed to contaminated food in a multiplicity of locations. The description of the place of exposure provides an indication of where to plan risk mitigation strategies and control measures to help prevent foodborne illnesses. Table 71 describes the characteristics of strong‐evidence FBO by place of exposure. The detailed description of the settings implicated in FBO in 2020 was limited to strong‐evidence outbreaks to avoid introducing the high level of uncertainty affecting weak‐evidence outbreaks.
Table 71.
Frequency distribution of strong‐evidence foodborne outbreaks by place of exposure (setting), in reporting EU, MS, 2020
| Place of exposure | Strong‐evidence outbreaks | Reporting Rate per 100,000 | ||||||
|---|---|---|---|---|---|---|---|---|
| Outbreaks | Cases | 2020 | 2010–2019 (mean) |
2010–2019 (mean) EU 27 |
||||
| N | % of total | N | % of total | |||||
| Household | 97 | 39.1 | 617 | 12.6 | 0.022 | 0.050 | 0.057 | |
| Canteen or catering at workplace, school, etc. | ||||||||
| School or kindergarten | 12 | 4.8 | 592 | 12.0 | 0.003 | 0.009 | 0.010 | |
| Canteen or workplace catering | 7 | 2.8 | 262 | 5.3 | 0.002 | 0.005 | 0.006 | |
| Health care and residential facilities | ||||||||
| Hospital and medical care facility | 2 | 0.8 | 37 | 0.8 | < 0.001 | 0.002 | 0.002 | |
| Residential institution (nursing home or prison or boarding school) | 17 | 6.9 | 287 | 5.8 | 0.004 | 0.004 | 0.005 | |
| Multiple place of exposure | ||||||||
| Multiple places of exposure in more than one country | 3 | 1.2 | 59 | 1.2 | 0.001 | 0.001 | 0.001 | |
| Multiple places of exposure in one country | 15 | 6.0 | 835 | 17.0 | 0.003 | 0.003 | 0.002 | |
| Restaurant, pub, street vendors, takeaway, etc. | ||||||||
| Restaurant or café or pub or bar or hotel or catering service | 54 | 21.8 | 1,348 | 27.4 | 0.012 | 0.033 | 0.033 | |
| Mobile retailer or market/street vendor | 1 | 0.4 | 3 | 0.1 | < 0.001 | 0.001 | 0.001 | |
| Takeaway or fast‐food outlet | 7 | 2.8 | 88 | 1.8 | 0.002 | 0.001 | 0.001 | |
| Other place of exposure | ||||||||
| Camp or picnic | 2 | 0.8 | 203 | 4.1 | < 0.001 | 0.002 | 0.002 | |
| Farm | 2 | 0.8 | 11 | 0.2 | < 0.001 | 0.001 | 0.001 | |
| Temporary mass catering (fairs or festivals) | 1 | 0.4 | 17 | 0.3 | < 0.001 | 0.002 | 0.002 | |
| Others | 16 | 6.5 | 378 | 7.7 | 0.004 | 0.009 | 0.007 | |
| Unknown | 12 | 5 | 176 | 4 | 0.003 | 0.013 | 0.015 | |
| Total (EU) | 248 | 100 | 4,914 | 100 | 0.056 | 0.135 | 0.147 | |
EU‐27 provides the estimation of the mean outbreak reporting rate for the 2010–2019 period excluding the United Kingdom.
To exploit the bulk of data provided by MS, the ranking of the places of exposure identified or simply suspected in strong‐ and weak‐evidence outbreaks, respectively, is shown in Figure 54. The first figure provides information on where the outbreaks were more likely to occur while the second one describes where people were more likely to be exposed to contaminated food.
Figure 54.

Distribution of the number of strong‐ and weak‐evidence foodborne outbreaks (left side) and human cases (right side), by place of exposure (setting), in reporting EU MS, 2020
In 2020, most strong‐evidence FBO occurred in a ‘domestic setting’ (N = 97; 39.1% of strong‐evidence outbreaks). This number is probably underestimated given that not all MS communicate data on household outbreaks. Most of the outbreaks occurring in domestic settings were also classified as ‘household outbreaks’, meaning that all cases belonged to the same household (81 outbreaks; 83.5% of total outbreaks in a domestic setting). Outbreaks in domestic settings fell in 2020 by 70.0% compared with 2019 (323 outbreaks). A similar decrease was also observed for outbreaks in ‘restaurant, pub, street vendors, takeaway, etc.’ (211 outbreaks in 2019; 70.6% decrease), which were the main places of exposure reported for ‘general outbreaks’ (i.e. outbreaks involving cases from more than one household). The closure and suspension of activities during the COVID‐19 pandemic was the main likely reason for the lower occurrence of FBO in these settings.
For a further interactive look into FBO data: Link to the dashboard (different filters can be applied; outbreaks by place of exposure are visualised in a dedicated page of the dashboard).
Strong evidence‐outbreaks in other places of exposure fell to a lesser extent in 2020. Outbreaks fell by 64.8% in ‘canteen or catering to workplace school, hospital, etc.’ (54 outbreaks in 2019), by 56.8% in ‘health care and residential facilities’ (44 outbreaks in 2019) and by 48.5% in ‘multiple places of exposure’ (34 outbreaks in 2019. The relative decrease of FBO in ‘multiple places of exposure’ would be even lower (29.2%) if outbreaks from the United Kingdom were not counted in 2019 (10 outbreaks).
Restaurant or café or pub or bar or hotel or catering service were the place of exposure linked to the highest number of cases (N = 1,348; more than one in four). Outbreaks linked to ‘school or kindergarten’ and ‘canteen or workplace catering’ were on average much larger (mean cases: 49.3 and 37.4, respectively) than those linked to a ‘restaurant or café or pub or bar or hotel or catering service’ (mean cases: 25 cases).
Outbreaks in a ‘residential institution (nursing home or prison or boarding school)’ saw a proportional increase compared to recent years. Between 2015 and 2019, the percentage of outbreaks detected in these settings did not exceed 7.1% of all outbreaks, while in 2020, the figure rose to 11.2%, representing a net increase of 4.1%. Food poisoning caused by bacterial toxins, in particular C. perfringens and B. cereus were the main causative agents implicated in these settings.
For ‘general outbreaks’, i.e. outbreaks involving cases from more than one household (152 outbreaks, 61.3% of strong‐evidence outbreaks), the most frequent places of exposure fell into the category ‘restaurant, pub, street vendors, takeaway, etc.’ (58 outbreaks, 38.2% of strong‐evidence general outbreaks), which is similar to recent years.
Causative agents identified in strong‐evidence outbreaks in the different settings are described in Figure 55. The bar chart presents the relative importance of agents in each setting group.
Figure 55.

- Note: N = number of strong‐evidence outbreaks by food type.‘Other bacterial agents’ include Escherichia coli other than STEC, Shigella, Vibrio parahaemolyticus and other bacteria, unspecified.‘Bacillus toxins’ include Bacillus cereus, Bacillus cereus enterotoxins, and B. subtilis (only one outbreak of B. subtilis reported by the United Kingdom).‘Staphylococcus aureus toxins’ include Staphylococcal enterotoxins.‘Norovirus and other calicivirus’ include norovirus (Norwalk‐like virus), sapovirus (Sapporo‐like virus), calicivirus unspecified.‘Marine biotoxins' include ciguatoxin and other unspecified marine toxins.
4.5. Contributing factors in strong‐evidence foodborne outbreaks
Information on factors contributing to food contamination and outbreaks was available for a minority of foodborne outbreaks (Figure 56). In ‘general’ outbreaks, risk factors were documented in 152 strong‐evidence outbreaks (47.4% of strong‐evidence ‘general’ outbreaks). Contamination by ‘food handlers’ was reported in 16 outbreaks in various settings and was mainly associated with norovirus (eight outbreaks, 30.8% of total strong‐evidence norovirus FBO) and Bacillus cereus (four outbreaks; 26.7% of total strong‐evidence general outbreaks caused by this agent). ‘Cross‐contamination’ was identified in 12 outbreaks, mainly caused by Salmonella (six outbreaks; 16.7% of total strong‐evidence general outbreaks caused by this agent) and L. monocytogenes (three outbreaks; 37.5% of total strong‐evidence general outbreaks caused by this agent). ‘Inadequate heat treatment’ was identified in 12 outbreaks. ‘Time/temperature storage abuse’ was identified in 14 outbreaks mainly associated with either C. perfringens toxins (six outbreaks; 42.8% of total strong‐evidence general outbreaks caused by this agent). ‘Inadequate chilling’ contributed to seven outbreaks, almost all linked to food poisoning by bacterial toxins.
Figure 56.

- Note: Restaurant, pub, street vendors, takeaway, etc. includes Restaurant or café or pub or bar or hotel or catering service, mobile retailer or market/street vendor, takeaway or fast‐food outlet.Canteen or catering at workplace, school, hospital, etc., includes school or kindergarten, residential institution (nursing home or prison or boarding school), canteen or workplace catering, hospital or medical care facility, catering on aircraft or ship or train.Other settings includes camp or picnic, farm, multiple places of exposure in one country, multiple places of exposure in more than one country, other settings unspecified, temporary mass catering (fairs or festivals).
Link to EFSA story map on FBO (see story map section on ‘how, why and where contamination may occur’)
4.6. Temporal trends by causative agents 2010–2020
4.6.1. Temporal trend at EU level
Figure 57 shows the number of FBO reported by MS over 2010–2020, by causative agent, including strong‐evidence and weak‐evidence FBO. The two graphs show the predominance of the causative agents at EU level, in terms of the absolute number of FBO, as well as highlighting the major differences. It is important to remember that variations in the frequency distribution of causative agents over the years may not reflect the true epidemiological pattern at EU level, since the collection of outbreak data is not fully harmonised among MS.
Figure 57.

- Note: Outbreaks reported by the United Kingdom are included for the years 2010–2019.‘Escherichia coli' other than STEC includes Enteropathogenic Escherichia coli (EPEC).‘Bacillus cereus toxins’ include Bacillus cereus, and Bacillus cereus enterotoxins.‘Staphylococcus aureus toxins’ include staphylococcal enterotoxins.‘Norovirus and other calicivirus’ include norovirus (Norwalk‐like virus), sapovirus (Sapporo‐like virus), and calicivirus unspecified.‘Marine biotoxins' include ciguatoxin and other unspecified marine toxins.
For a further interactive look into FBO data: Link to the dashboard (see the dedicated dashboard page on temporal trends).
4.6.2. Temporal country‐specific trends
The distribution of Salmonella outbreaks over 2010–2020 including strong‐evidence and weak‐evidence outbreaks, and the reporting rate (for 100,000 population) in MS and non‐MS is shown in Figure 58. The trend analysis showed a statistically significant decrease in the number of Salmonella outbreaks for five MS (Austria, Germany, Hungary, Latvia and Lithuania). The trend was driven primarily by S. Enteritidis outbreaks, whose progressive decrease over the time period in question was also statistically significant in Austria, Germany, Hungary and Lithuania. A decreasing trend in S. Enteritidis outbreaks was also observed in Slovakia (Figure 59). Austria and Germany also reported significant decreasing trends for outbreaks caused by S. Typhimurium and monophasic S. Typhimurium. In Austria and Germany, the observed trends were mainly due to the successful application of National Control Programmes for Salmonella (Figure 4).
Figure 58.

- Note: The orange line (right axis) in the graphs represents the Salmonella outbreak reporting rate and was measured on the same scale for all MS (except for Slovakia), to allow a direct comparison between countries. The blue bars show the yearly trend in terms of absolute numbers of Salmonella outbreaks (left axis), using the most appropriate scale for each country.Blue has been used to show both the trend line and the secondary Y‐axis representing the outbreak reporting rate. This was adopted for Slovakia to highlight that the scale was different from the other countries.* Indicates countries with a statistically significant trend (p < 0.05) over several years.
Figure 59.

Trends in the number of outbreaks (left vertical axis) and outbreak reporting rate (per 100,000 population) (right axis), by causative agent, in reporting EU MS, 2010–2020. Only MS and causative agents with a statistically significant temporal trend are shown
- Note: only causative agents and countries with statistically significant trends and more than five outbreaks reported per year, on average are shown.
Other statistically significant trends in the occurrence of FBO by causative agents and MS are shown in Figure 59. Given the lack of specific control programmes, it is difficult to analyse the reasons underlying these trends. The number of Campylobacter outbreaks in Austria has dropped significantly in recent years. However, no information on the implicated food vehicles was available for most of these outbreaks (449 of the 509 outbreaks reported between 2010 and 2020) to elucidate the reasons behind the falls. During the same period and even in 2020, the number of Campylobacter outbreaks in France progressively increased, despite a general reduction in outbreak reporting. An increase in the number of strong‐ and weak‐evidence outbreaks caused by the consumption of ‘broiler meat and products thereof’ was the most likely reason for this rise (39 outbreaks in 2020 vs 10 outbreaks in 2019, a 56.5% increase compared with 2019).
The reasons underlying the decreasing trends in outbreaks caused by norovirus in Germany and in Latvia cannot be elucidated, since the drop was mainly linked to a reduction in the reporting of outbreaks linked to ‘unknown’ food.
No information is available to explain the statistically significant increasing trend of FBO with unknown aetiology in the Netherlands.
4.6.3. Temporal trends by implicated food vehicles
Figure 60 shows country‐specific statistically significant trends in the number of strong‐evidence outbreaks for specific food vehicles, during 2010–2020. Decreasing trends were observed for various types of food vehicles including ‘buffet meals’, ‘eggs and egg products’, ‘fish and fish products’, ‘mixed foods’. The decreasing trend in outbreaks caused by the consumption of contaminated ‘eggs and egg products’ was fully attributable to reduced reporting of S. Enteritidis outbreaks by Poland. The fall in figures for buffet meals in Denmark was mainly linked to a decrease in the number of norovirus outbreaks reported since 2014. No clear reasons appear for the other identified trends. Variations in the number of Campylobacter outbreaks in Germany was the main reason underlying the positive trend in the number of outbreaks associated with ‘milk and milk products’. However, the increase in outbreaks observed between 2015 and 2017 was counterbalanced by a gradual reduction since 2018.
Figure 60.

Trends in the number of strong‐evidence outbreaks (left vertical axis) and outbreak reporting rate (for 100,000 population) (right axis), by food vehicle, in reporting EU MS, 2010–2020. Only MS and food with a statistically significant temporal trend are shown
- Note: only food vehicles and countries with statistically significant trends and more than five outbreaks reported per year, on average, are shown.
4.7. Waterborne outbreaks
Outbreaks associated with the consumption of contaminated water have been already presented in the previous sections as part of foodborne outbreaks. However, due to the peculiarities of these outbreaks, detailed information on waterborne outbreaks has been also summarised in this dedicated section.
In 2020, nine MS (Austria, Belgium, Denmark, Finland, France, Greece, Ireland, Italy and Sweden) reported 35 waterborne outbreaks, i.e. outbreaks associated with the consumption of either ‘tap water, including well water’ (26 outbreaks), ‘drinks, including bottled water’ (8 outbreaks) or ‘water, unspecified’ (1 outbreak). Compared to 2019, waterborne outbreaks decreased by 27.1% (48 outbreaks in 2019) in the EU in 2020. The number of cases involved in waterborne outbreaks has decreased significantly (1,969 cases linked to waterborne outbreaks in 2019; an 84.6% decrease). The mean outbreak size of waterborne outbreaks was 8.7 cases, which is the lowest value in waterborne outbreaks since 2010. This finding suggests that small household water supply systems were more likely to be the cause of water contamination than large public aqueducts and pipelines.
Overall, six waterborne outbreaks were reported as strong‐evidence outbreaks by five MS (Denmark, Finland, France, Greece and Italy). They involved 160 cases with four hospitalisations. All these outbreaks were caused by the consumption of contaminated ‘tap water including well water’ except for a single outbreak that was linked to ‘water, unspecified’. The agents detected in strong‐evidence outbreaks in MS were Shiga toxin‐producing E. coli (two outbreaks overall with one of them caused by STEC O157), norovirus, C. jejuni, Salmonella and other unspecified agents (one outbreak, each).
Most of the weak‐evidence waterborne outbreaks were reported by Ireland (17 outbreaks) and Belgium (seven outbreaks). Overall, five other weak‐evidence waterborne outbreaks were reported by four MS (Austria, France, Italy and Sweden). For the weak‐evidence outbreaks, the consumption of ‘drinks, including bottled water’ was suspected in eight outbreaks while for the others the suspect source was ‘tap water including well water’. In total, 17 outbreaks were caused by STEC, with serogroups O26 and O145 detected in one outbreak each (no information on the serogroup was available for the others). STEC O157 was also reported as the secondary causative agent in a household waterborne outbreak primarily caused by C. jejuni in Austria. Other causative agents included S. Enteritidis, Cryptosporidium, C. jejuni and Giardia. These were detected in single waterborne outbreaks, each involving two cases. For 10 weak‐evidence waterborne outbreaks causing 115 cases, the aetiologic agent remained unknown.
ECDC and EFSA rapid outbreak assessment of multi‐country foodborne outbreaks.
In 2020, ECDC and EFSA worked closely to assess the public health risk posed by different multi‐country FBO and to publish Rapid Outbreak Assessments (ROAs). In these assessments, whole genome sequencing (WGS) was used for outbreak investigation, making it possible to identify outbreak associated cases and the food isolates matching the representative outbreak strains. The first assessment concerned an outbreak caused by Salmonella Typhimurium sequence type (ST)19 and Salmonella Anatum ST64. It involved three MS (France, the Netherlands and Luxembourg), as well as the United Kingdom and Canada. Overall, between August 2019 and August 2020, 124 human cases were linked to this outbreak, of which 123 were caused by S. Typhimurium ST19 and one by S. Anatum ST64. The United Kingdom reported the highest number of cases (N = 104), followed by France (N = 14), Luxembourg (N = 3), the Netherlands (N = 1) and Canada (N = 1). Although thirteen hospitalisations and one death were reported, the role of the Salmonella infection as regards the cause of death could not be elucidated. Evidence from epidemiological, microbiological and traceability investigations identified Brazil nuts from Bolivia and products containing Brazil nuts as the probable vehicle of infections in this outbreak. However, it was not possible to establish the exact point of contamination in the food chain. Extensive recalls and withdrawals of nut products have been implemented in EU since August 2020 (ECDC and EFSA, 2020) in order to control the likely occurrence of new cases of infections.
A second outbreak caused by Salmonella Enteritidis ST11 occurred between May 2018 and December 2020. This pathogen was responsible for 193 human cases (153 confirmed and 40 probable) reported by eight EU countries (Denmark, Finland, France, Germany, Ireland, the Netherlands, Poland and Sweden) and the United Kingdom. In addition, one in five cases were hospitalised and one death was reported by France. Information from patients’ interviews pointed to chicken products as the likely vehicle of infection. An analytical epidemiological study carried out in the United Kingdom highlighted the increased risk of S. Enteritidis infection linked to the consumption of frozen breaded chicken products. Following national food investigations in Europe, five batches of non‐ready‐to‐eat poultry products were found to be contaminated with the Salmonella outbreak strain and were traced back to meat suppliers, slaughterhouses and farms located in Poland. However, although some Polish farms tested positive for S. Enteritidis, it was not possible to establish a link with the contaminated products due to the scarce typing information available. Withdrawals and recalls of the affected products were implemented as control measures (ECDC and EFSA, 2021).
5. Conclusions
5.1. Health impact, causative agents and trends
In 2020, the number of foodborne and waterborne outbreaks notified to EFSA was the lowest ever reported since the beginning of data collection in 2007. Compared with 2019, a remarkable drop in the number of outbreaks was observed for both MS and non‐MS countries. Overall, the number of outbreaks decreased by 47.0% in MS, while a similar or even larger absolute decrease was observed for other indicators relating to the impact of foodborne and waterborne outbreaks on health. Outbreak cases of illness decreased by 61.3%, while hospitalisations and deaths among outbreak cases fell by 60.0% and 43.3%, respectively, compared with 2019. This remarkable drop can probably be attributed almost entirely to the indirect impact of the COVID‐19 pandemic in Europe. The contribution of the withdrawal of the United Kingdom from the EU appears to be only marginal. This is evidenced by the fact that the United Kingdom contributed to cases at EU level in only a very small proportion, ranging between 0.8% and 1.1% of the overall FBO reported annually by MS between 2015 and 2019.
These findings should be interpreted with caution, since outbreaks may have decreased in 2020 either as a result of reduced exposure to contaminated food or of the underdetection and under‐reporting of outbreaks.
The reasons underlying the reduced health burden of foodborne outbreaks in 2020 must interpreted cautiously, considering that the decrease in reported FBO could correspond to a true fall in the number of outbreaks at EU level or, alternatively, it could mirror a reduced sensitivity in MS surveillance systems, i.e. the ability to detect, investigate, collect and report outbreak data. The impact of the COVID‐19 pandemic on FBO surveillance and reporting will be evaluated retrospectively in the coming years.
Control measures to limit the spread of COVID‐19 may have helped prevent the contamination of foodstuffs in domestic and public settings. The lockdown measures adopted in 2020, including stay‐at‐home orders, the banning of private gatherings, the closures and restrictions applied to restaurants, pubs and public catering as well as canteens in schools, universities, workplaces, etc., may have substantially reduced the food poisoning typically linked to these settings (e.g. food contamination by norovirus, bacterial toxins and Salmonella). On the other hand, the reinforced measures taken to control COVID‐19, including personal hygiene equipment (masks, gloves, etc.) and other safety and hygiene measures (washing and sanitising hands, temperature monitoring, etc.), along with frequent cleaning of domestic kitchens and public settings (shops, restaurants), may have reduced food contamination and contributed to a general improvement in food safety at consumer level. Restrictions on international travel and mobility may also have contributed to reducing travel‐related FBO.
It is nevertheless likely that a proportion of foodborne outbreaks remained unidentified in 2020. The pandemic has impacted primary care globally (Kastritis et al., 2020) with major voluntary and involuntary changes in the healthcare seeking behaviours of patients. A number of foodborne illnesses among the population, especially cases with mild symptoms, may have gone undetected. A significant decrease in the number of patients visiting doctors, the samples submitted to laboratories and the people accessing emergency departments during the pandemic was documented in many European countries (Verhoeven et al., 2020; Kurotschka et al., 2021; Lim et al., 2021), with most regular GP consultations replaced by telephone triage or even suspended. FBO investigation and response is a complex activity involving several players. It also requires a well‐structured and flexible organisation, and this was dramatically challenged in 2020. During the pandemic, the fragmentation of the primary care structure, which is the level at which suspicions of outbreak are usually raised, may have impaired the identification and investigation of foodborne outbreaks. The diversion of technical and human resources, and the lack of coordination with public health and food safety departments, hospitals and diagnostic laboratories during the pandemic, may also have impaired the identification and investigation of FBO.
It is interesting to note that the decline in outbreaks in 2020 did not affect all causative agents equally. In particular, the number of outbreaks of botulisms and listeriosis decreased less than other agents, as a percentage. Given that severe conditions such as botulism or invasive listeriosis are unlikely to remain undiagnosed, this finding shows that exposure to food contaminated with C. botulinum toxins or Listeria monocytogenes did not substantially change in 2020 and that, for other causative agents associated with milder illnesses, the reasons for the fall in the number of outbreaks are more likely to be linked to underdiagnosis/under‐reporting than to a true reduction in population exposure through food.
At country level, considerable variability was observed in the epidemiological indicators adopted to describe FBO, such as the reporting rate, the mean outbreak size, the type of outbreaks and their severity. This reflects the epidemiological differences and divergences in the approach and sensitivity of FBO surveillance at national level.
The pattern of causative agents implicated in FBO in the EU in 2020 did not differ substantially from 2019. This observation applies not only at EU level to the overall number of outbreaks reported, but in particular at MS level. At EU level, among the outbreaks with known aetiology, the highest impact on health in terms of the number of outbreaks, cases and hospitalisations was associated with Salmonella. At MS level, this was true for only 10 MS (Croatia, Estonia, Italy, Latvia, Lithuania, Luxembourg, Malta, Poland, Romania, Slovakia). For the other MS, the aetiology was more varied, with either norovirus, Campylobacter, bacterial toxins or STEC playing a noteworthy role. It is important to remember that these differences may depend not only on true variability in the epidemiology of FBO but also on the scope and objectives of the outbreak surveillance in place in MS. This is clearly documented by the significant differences in MS reporting behaviour for outbreaks of unknown aetiology. While, for some MS, these outbreaks make up the vast majority of FBO, for others, this type of reporting is absent. This finding highlights the different approaches of each MS to outbreak surveillance, with countries such as Belgium and the Netherlands reporting small family outbreaks, and others reporting only general outbreaks of known aetiology.
One major finding emerging from the analysis of 2020 outbreak data is the high burden of L. monocytogenes in terms of hospitalisations and deaths. The death toll of a L. monocytogenes outbreak may be high or very high, as was the case for the outbreak in Switzerland caused by a persistent contamination of cheese with L. monocytogenes from 2018 to 2020 (Nüesch‐Inderbinen et al., 2021). At EU level, both the case fatality and hospitalisation rate for listeriosis outbreaks have increased progressively over the last 5 years and this is a reason of concern, given the multi‐faceted epidemiology of L. monocytogenes. In recent years, this agent has been responsible for small size family clusters as well as for large or very large prolonged cross‐border outbreaks, as in Spain in 2019 and in many EU countries in 2017, respectively. Moreover, foodborne exposure to L. monocytogenes has been documented in a wide range of settings, including hospital and residential institutions, and this is a cause for concern (Lachmann et al., 2021; Russini et al., 2021). Listeriosis outbreaks are associated with a variety of foodstuffs including cheese, meat and meat products and fish and fishery products as well as food of non‐animal origin as is clearly indicated by the data reported in 2020. The increased occurrence and severity of L. monocytogenes outbreaks may also reflect more widespread application of the fine‐tuning characterisation methods for L. monocytogenes, and in particular Whole Genome Sequencing (WGS), which has considerably improved the detection of outbreaks within the community in recent years. The routine implementation of WGS in laboratories is rapidly changing the surveillance approach to foodborne pathogens. WGS improves the linking of sporadic cases associated with different food products and geographical regions to a point source outbreak. It can also facilitate epidemiological investigations, allowing the use of previously sequenced genomes (EFSA BIOHAZ Panel, 2019a). Although sequence‐based typing is primarily applied to the surveillance of major foodborne bacterial agents (Listeria, STEC, Salmonella, Campylobacter), the possible expansion of this approach to viruses (Enkirch et al., 2019) and other pathogens holds out promising perspectives for outbreak detection and control.
5.2. Food vehicles and places of exposure
The relative fall in outbreaks in domestic settings, compared with 2019, could be the result of a weakened capacity to detect and investigate household foodborne outbreaks in domestic settings during the pandemic, for the reasons described in Section 5.1. In addition, sanitisation and improvements in general and personal hygiene during the COVID‐19‐pandemic have probably led to a general improvement in hygiene spanning food manipulation in domestic kitchens and shopping at food retailers or markets. This has likely contributed to the decrease of outbreaks in domestic settings, providing direct evidence of the importance of promoting food safety and appropriate hygiene practices in home kitchens (e.g. washing hands, wearing gloves, cleaning surfaces, etc.).
On the other hand, the proportion of strong‐evidence general outbreaks associated with the consumption of food in ‘restaurants, pubs, street vendors, takeaway’ also fell sharply in 2020 (8.3% less). The number totalled 58 in 2020 (38.2% of total strong‐evidence general outbreaks) and 204 in 2019 (46.5% of total strong‐evidence general outbreaks). The reasons for this drop include restrictions on gatherings at restaurants with fewer people from different households consuming meals together, and the closure of restaurants, pubs, bar, etc.
The range of foodstuffs implicated in FBO closely reflects the known epidemiology of the implicated causative agents. Eggs and egg products, pig meat and products thereof and bakery products were the main food sources in many countries, primarily implicated in Salmonella outbreaks. Fish and fishery products including crustaceans, shellfish and molluscs were associated with a high number of cases, hospitalisations and deaths in 2020 in food poisoning events caused by L. monocytogenes, histamine or norovirus.
The consumption of highly manipulated foodstuffs such as mixed foods and other composite, multi‐ingredient foods was also frequently implicated in outbreaks and caused the highest number of cases among strong‐evidence outbreaks. The contamination of these food vehicles may occur in several ways, including unsafe food mixing, processing and manipulation by infected food handlers or cross contamination. Incorrect storage conditions, including time/temperature abuse and inadequate chilling may boost contamination with harmful bacteria or toxins introduced in the final stage of food preparation through single ingredients. This heterogeneity in the risk factors and mechanisms leading to food poisoning makes it difficult to identify the primary source of contamination in many cases. Strengthening the implementation of HACCP in public settings, with high standard of hygiene and correct procedures for food preparation and storage in domestic kitchens should be recommended.
6. Related projects and internet sources
Link to EFSA story map on FBO (see story map section on ‘References and further readings on this topic’)
Zoonoses monitored according the epidemiological situation (Directive 2003/99 List B)
1. Yersinia
Tables and figures that are not presented in this chapter are published as supporting information to this report and are available as downloadable files from the EFSA Knowledge Junction on Zenodo at https://doi.org/10.5281/zenodo.5682809. Summary statistics of human surveillance data with downloadable files are retrievable using ECDC’s Surveillance Atlas of Infectious Diseases at http://atlas.ecdc.europa.eu/public/index.aspx

1.1. Key facts
-
•
Yersiniosis is the third most commonly reported zoonosis in humans in the EU. In 2020, the number of confirmed cases of human yersiniosis was 5,668.
-
•
The EU notification rate of yersiniosis was 1.8 per 100,000 population in 2020. This is an increase of 5.9% compared with the rate in 2019 (1.7 per 100,000 population) with data from the United Kingdom included, and a decrease of 13.4% compared with the rate in 2019 (2.1 per 100,000 population) without the 2019 data from the United Kingdom.
-
•
There was a statistically significant decreasing trend (p < 0.01) of human yersiniosis cases for 2016–2020.
-
•
foodborne outbreaks of yersiniosis (N = 16) were reported by six MS, involving 236 human cases. One outbreak reported by Denmark with strong‐evidence was caused by ‘mixed food (pasta‐based dish)’.
-
•
In 2020, five MS reported information on 766 ‘ready‐to‐eat’ food sampling units tested for the presence of Yersinia. There were 40 positive units and all were from the ‘ready‐to‐eat’ meat and meat products category, in particular, ‘mixed meat and meat products from bovine animals and pigs’ (5.9% positive samples).
-
•
In ‘non ready‐to‐eat’ food, seven MS provided results on 811 sampling units and reported 43 positive units among samples from ‘meat and meat products’ (34) and from ‘milk and milk products’ (9). In ‘fresh meat’, Yersinia was isolated from ‘fresh meat of pigs’ in about one of ten samples tested.
-
•
In animals, seven MS and two non‐MS reported results of sampling activities in 2020 in pigs, ‘domestic livestock other than pigs’ and ‘other animal species’: the highest overall proportion of Yersinia‐positive units was observed in ‘other animal species’ (4.4%).
1.2. Surveillance and monitoring of Yersinia in the EU
1.2.1. Humans
Notification of yersiniosis is mandatory in 21 EU MS, Iceland and Norway. In five MS, the notification is based on a voluntary system (Belgium, France, Greece, Italy and Luxembourg). No yersiniosis surveillance system is in place in the Netherlands. The surveillance systems for yersiniosis have national coverage in all reporting countries, except for three: France, Italy and Spain. For these three countries, no information on population coverage was provided, and notification rates were not calculated. For 2020, Spain has not received data from all regions and rates are therefore not displayed for this year. Greece reported data on laboratory‐confirmed cases collected from public hospitals from 2018 onwards. All countries reporting data on yersiniosis in 2020 provided case‐based data, except Belgium, Bulgaria and Greece, which reported aggregated data. Both reporting formats were included to calculate annual numbers of cases and notification rates.
Since 1 February 2020, the United Kingdom has become a third country and is therefore no longer an EU MS. Human data from the United Kingdom were not collected by ECDC for 2020.
1.2.2. Food and animals
Although reporting of Yersinia presence in food and animals is not mandatory, MS can report monitoring data on Yersinia to EFSA, in accordance with the Zoonoses Directive 2003/99/EC. The Directive specifies that, in addition to the zoonoses and zoonotic agents for which monitoring is mandatory, zoonoses such as yersiniosis and agents thereof must also be monitored if the epidemiological situation is not negligible. At present, no harmonised Yersinia monitoring plan is in place for food or animals in the EU. Therefore, data on Yersinia presence in food and animals submitted to EFSA by the MS are not harmonised. Data allow for descriptive summary statistics at the EU level only and do not support trend analyses and trend watching (Table 1).
Harmonised monitoring and reporting criteria for Y. enterocolitica in slaughter pigs were recommended by EFSA in a scientific report (EFSA, 2009c). The reported occurrence of Yersinia in major food categories for the year 2020 and for the 4‐year period 2016–2019 was descriptively summarised, making a distinction between RTE and non‐RTE foods.
For the purpose of the 2020 data analysis, only results obtained from samples collected and tested for Yersinia under an ‘objective sampling’ strategy were considered, in order to limit selection bias. Objective sampling indicates that MS collected and tested the samples according to a planned strategy based on a random sampling design representative of the population under study.
1.2.3. foodborne outbreaks of yersiniosis
Reporting of foodborne yersiniosis disease outbreaks in humans is mandatory according to the Zoonoses Directive 2003/99/EC.
Since 1 February 2020, the United Kingdom has become a third country. Food, animal and foodborne outbreak data from the United Kingdom were still collected by EFSA for 2020 in the framework of the Zoonoses Directive 2003/99/EC, but are excluded for the calculation of EU statistics.
1.3. Results
1.3.1. Overview of key statistics, EU, 2016–2020
Table 72 summarises EU‐level statistics on human yersiniosis, and on the occurrence and prevalence of Yersinia in food and animals, for the period 2016–2020. Data on the most relevant foodstuffs for Yersinia were grouped into major categories, in particular ‘meat and meat products’ and ‘fruits and vegetable products’. Data were aggregated by year to obtain an annual overview of the volume of data submitted. Although yersiniosis was the third most frequently reported zoonosis in the EU in 2020, few MS reported data on Yersinia in food and animals, like in previous years.
Table 72.
Summary of Yersinia statistics related to humans, major food categories and animal species, EU, 2016–2020
| 2020 | 2019 a | 2018 a | 2017 a | 2016 a | Data source | |
|---|---|---|---|---|---|---|
| Humans | ||||||
| Total number of confirmed cases | 5,668 | 6,967 | 7,015 | 6,825 | 6,888 | ECDC |
| Total number of confirmed cases/100,000 population (notification rates) | 1.8 | 1.7 | 1.7 | 1.8 | 1.8 | ECDC |
| Number of reporting MS | 25 | 27 | 27 | 26 | 26 | ECDC |
| Infection acquired in the EU | 2,679 | 3,468 | 3,446 | 3,410 | 3,378 | ECDC |
| Infection acquired outside the EU | 61 | 96 | 106 | 88 | 82 | ECDC |
| Unknown travel status or unknown country of infection | 2,928 | 3,403 | 3,463 | 3,327 | 3,428 | ECDC |
| Number of foodborne outbreak‐related cases | 236 | 160 | 58 | 130 | 41 | EFSA |
| Total number of foodborne outbreaks | 16 | 23 | 12 | 11 | 8 | EFSA |
| Food | ||||||
| Meat and meat products | ||||||
| Number of sampling units | 1,597 | 2,304 | 1,470 | 1,211 | 980 | EFSA |
| Number of reporting MS | 6 | 6 | 6 | 7 | 5 | EFSA |
| Fruits and vegetable products | ||||||
| Number of sampling units | 251 | 17 | 7 | 116 | 93 | EFSA |
| Number of reporting MS | 4 | 2 | 2 | 4 | 1 | EFSA |
| Animals | ||||||
| Bovine animals | ||||||
| Number of sampling units | 14,772 | 15,468 | 11,480 | 15,391 | 25,362 | EFSA |
| Number of reporting MS | 5 | 4 | 5 | 7 | 7 | EFSA |
| Pigs | ||||||
| Number of sampling units | 2,368 | 2,561 | 2,340 | 3,142 | 3,098 | EFSA |
| Number of reporting MS | 4 | 5 | 6 | 6 | 5 | EFSA |
ECDC: European Centre for Disease Prevention and Control; EFSA: European Food Safety Authority; MS: Member State.
Since 1 February 2020, the United Kingdom has been a third country. United Kingdom data are presented for 2016–2019, whereas for 2020, United Kingdom data are not presented.
In 2020, the number of sampling units tested for Yersinia for ‘fruits and vegetable products’ increased substantially compared with 2019.
A detailed description of the foodborne outbreak statistics is presented in the chapter on foodborne outbreaks.
1.3.2. Human yersiniosis
In 2020, 5,668 confirmed cases of yersiniosis were reported by 25 EU countries. As in recent years, Germany accounted for the highest number of cases, followed by France (Table 73). Cases reported by these countries accounted altogether for 50.2% of all confirmed yersiniosis cases in the EU. The highest country‐specific notification rates (per 100,000 population) were observed for Denmark (7.1), Finland (7.0), Lithuania (4.9) and Latvia (4.6).
Table 73.
Reported human cases of yersiniosis and notification rates per 100,000 population in EU MS and non‐MS countries, by country and year, 2016–2020
| Country | 2020 | 2019 | 2018 | 2017 | 2016 | |||||||
|---|---|---|---|---|---|---|---|---|---|---|---|---|
| National coverage a | Data format a | Confirmed cases and rate | Confirmed cases and rate | Confirmed cases and rate | Confirmed cases and rate | Confirmed cases and rate | ||||||
| Cases | Rate | Cases | Rate | Cases | Rate | Cases | Rate | Cases | Rate | |||
| Austria | Y | C | 128 | 1.4 | 112 | 1.3 | 136 | 1.5 | 95 | 1.1 | 86 | 0.99 |
| Belgium | Y | A | 260 | 2.3 | 406 | 3.5 | 392 | 3.4 | 317 | 2.8 | 355 | 3.1 |
| Bulgaria | Y | A | 4 | 0.06 | 11 | 0.16 | 9 | 0.13 | 17 | 0.24 | 10 | 0.14 |
| Croatia | Y | C | 11 | 0.27 | 12 | 0.29 | 20 | 0.49 | 29 | 0.70 | 22 | 0.52 |
| Cyprus | Y | C | 0 | 0 | 0 | 0 | 0 | 0 | 0 | 0 | 0 | 0 |
| Czechia | Y | C | 437 | 4.1 | 618 | 5.8 | 622 | 5.9 | 611 | 5.8 | 608 | 5.8 |
| Denmark | Y | C | 413 | 7.1 | 221 | 3.8 | 282 | 4.9 | 206 | 3.6 | 278 | 4.9 |
| Estonia | Y | C | 44 | 3.3 | 42 | 3.2 | 63 | 4.8 | 43 | 3.3 | 45 | 3.4 |
| Finland | Y | C | 386 | 7.0 | 406 | 7.4 | 529 | 9.6 | 423 | 7.7 | 407 | 7.4 |
| France(b) | N | C | 988 | – | 1,135 | – | 929 | – | 738 | – | 735 | – |
| Germany | Y | C | 1,860 | 2.2 | 2,164 | 2.6 | 2,193 | 2.6 | 2,581 | 3.1 | 2,763 | 3.4 |
| Greece | – | A | – | – | 13 | 0.12 | 21 | 0.20 | – | – | – | – |
| Hungary | Y | C | 25 | 0.26 | 38 | 0.39 | 36 | 0.37 | 30 | 0.31 | 70 | 0.71 |
| Ireland | Y | C | 13 | 0.26 | 9 | 0.18 | 8 | 0.17 | 6 | 0.13 | 3 | 0.06 |
| Italy(b) | N | C | 21 | – | 12 | – | 14 | – | 8 | – | 9 | – |
| Latvia | Y | C | 88 | 4.6 | 60 | 3.1 | 68 | 3.5 | 47 | 2.4 | 47 | 2.4 |
| Lithuania | Y | C | 136 | 4.9 | 181 | 6.5 | 139 | 4.9 | 174 | 6.1 | 155 | 5.4 |
| Luxembourg | Y | C | 26 | 4.2 | 18 | 2.9 | 16 | 2.7 | 15 | 2.5 | 12 | 2.1 |
| Malta | Y | C | 0 | 0 | 0 | 0 | 0 | 0 | 0 | 0 | 0 | 0 |
| Netherlands | – | – | – | – | – | – | – | – | – | – | – | – |
| Poland | Y | C | 87 | 0.23 | 196 | 0.52 | 170 | 0.45 | 191 | 0.50 | 167 | 0.44 |
| Portugal | Y | C | 25 | 0.24 | 29 | 0.28 | 30 | 0.29 | 35 | 0.34 | 14 | 0.14 |
| Romania | Y | C | 6 | 0.03 | 36 | 0.19 | 22 | 0.11 | 36 | 0.18 | 40 | 0.20 |
| Slovakia | Y | C | 168 | 3.1 | 255 | 4.7 | 259 | 4.8 | 242 | 4.5 | 200 | 3.7 |
| Slovenia | Y | C | 26 | 1.2 | 28 | 1.3 | 32 | 1.5 | 18 | 0.87 | 31 | 1.5 |
| Spain b),(c | N | C | 296 | – | 409 | – | 549 | – | 585 | – | 514 | – |
| Sweden | Y | C | 220 | 2.1 | 393 | 3.8 | 278 | 2.7 | 236 | 2.4 | 230 | 2.3 |
| EU Total 27 | – | – | 5,668 | 1.8 | 6,804 | 2.1 | 6,817 | 2.1 | 6,683 | 2.2 | 6,801 | 2.3 |
| United Kingdom | – | – | – | – | 163 | 0.24 | 198 | 0.30 | 142 | 0.22 | 87 | 0.13 |
| EU Total d | – | – | 5,668 | 1.8 | 6,967 | 1.7 | 7,015 | 1.7 | 6,825 | 1.8 | 6,888 | 1.8 |
| Iceland | Y | C | 3 | 0.82 | 2 | 0.56 | 2 | 0.57 | 0 | 0 | 1 | 0.30 |
| Norway | Y | C | 83 | 1.5 | 85 | 1.6 | 105 | 2.0 | 67 | 1.3 | 57 | 1.1 |
–: Data not reported.
: Y: yes; N: no; A: aggregated data; C: case‐based data.
(b): Sentinel surveillance; no information on estimated coverage. Notification rate not estimated.
Data not complete in 2020, rate not estimated.
Cases reported from the United Kingdom in 2016–2019 were also considered for this estimate (EU‐28). When 2016–2019 UK data were collected, the UK was an EU MS but since 1 February 2020, it has become a third country.
The EU notification rate of confirmed yersiniosis cases was 1.8 cases per 100,000 population. This corresponds to an increase of 5.9% compared with the rate in 2019 (1.7 per 100,000 population) with data from the United Kingdom included, and a decrease of 14.3% compared with the rate in 2019 (2.1 per 100,000 population) without the data from the United Kingdom.
Most (97.7%) of the yersiniosis cases reported with known origin were infected in the EU (Table 72). The highest proportions of travel‐associated cases (85.7%) were reported from eight MS (Belgium Czechia, Denmark, Finland, France, Germany, Spain and Sweden). Overall, the proportion of travel‐associated cases of yersiniosis was 3.7%, including travel within and outside the EU. There were 61 (1.1%) cases associated with travel outside the EU.
Like in recent years, cases of yersiniosis did not show clear seasonality. In 2020, the highest number of cases was reported in January and small peaks were reported in April and October (Figure 61).
Figure 61.

- Source(s): Austria, Cyprus, Czechia, Denmark, Estonia, Finland, Germany, Hungary, Ireland, Italy, Latvia, Luxembourg, Malta, Poland, Romania, Slovakia, Slovenia, Sweden.
There is a statistically significant decreasing trend (p < 0.01) of human yersiniosis cases for 2016–2020. At the MS level, a statistically significant decrease (p < 0.01) over the years 2016–2020 was observed for three MS (Germany, Hungary and Romania). For the same time period, there was a statistically significantly increase (p < 0.01) for two MS (Italy and Latvia).
Of the 1,214 yersiniosis cases with available information on hospitalisation reported by 12 MS, 353 cases (29.1%) were hospitalised. Two deaths were reported among 3,072 confirmed cases with information available on clinical outcomes. The outcome was reported for 54.2% of all confirmed cases of yersiniosis in 13 MS. The case fatality rate was 0.07%.
Information on Yersinia species detected in confirmed cases was reported by 21 countries for 5,182 cases (93.83%) in the EU in 2020. Y. enterocolitica was the most commonly reported species in all countries, with 4,520 human cases attributable to this species (86.2% of all cases with information on species available). Information about Y. enterocolitica serotypes was provided for 2,010 confirmed cases. The most commonly reported serotype was O3 (85.6% of cases with information on serotype available), followed by O9 (10%). Altogether, the other serotypes (O8, O1 and O5, O27 and others) accounted for 4.4% of the cases with known serotype. Biotype information was provided for 996 confirmed cases. The most commonly reported biotype was biotype 4 (87.1% of all cases with this information available), followed by biotype 2 (12.1%) and biotype 3 (0.7%). Information about Y. enterocolitica bioserotypes was provided for 978 confirmed cases. The most common bioserotypes were 4/O3 (87.7%) and 2/O9 (10.9%).
Seven countries reported a total of 94 Y. pseudotuberculosis cases in 2020.
Human yersiniosis cases and cases associated with foodborne outbreaks
In total, 5,668 confirmed human yersiniosis cases were reported to TESSy in 2020.
Six MS reported 16 yersiniosis foodborne outbreaks for the year 2020, causing 236 illnesses and 11 hospitalisations, but no deaths. These numbers were similar to recent years. Y. enterocolitica was the species identified as the causative agent in all the outbreaks, except one (unspecified). The only strong‐evidence outbreak reported in 2020 was notified by Denmark, which involved 200 cases who had been exposed to Y. enterocolitica through the consumption of a contaminated pasta‐based dish, at a picnic. Further details and statistics on the yersiniosis foodborne outbreaks for 2020 are reported in the chapter on foodborne outbreaks.
Comparing the foodborne outbreak cases (236) and confirmed cases of human yersiniosis acquired in the EU (5,542), and also considering the estimated cases with unknown travel data (0.978 × 5,668) (Table 72), could suggest that in the EU overall in 2020, only 4.3% of human yersiniosis cases would have been reported through foodborne outbreak investigation. It is important to clarify that the classification of cases for reporting is different between these two databases. In TESSy, reported cases are classified based on the EU case definition. All these cases visited a doctor and are either confirmed by a laboratory test (confirmed case) or not (probable case and classification is based on the clinical symptoms and epidemiological link). Cases that never visited a doctor are not reported to TESSy. Moreover, there may be missing probable cases in TESSy, as these data are not analysed or published, and there is no incentive for reporting such cases. Information on which cases are linked to an outbreak and which are not is also not systematically collected. In practice, the cases reported to TESSy are considered to be mostly sporadic. In foodborne outbreaks, the human cases are the people involved in the outbreak as defined by the investigators (case definition), and cases must be linked, or probably linked, to the same food source (Directive 2003/99/EC). This can include both ill people (whether confirmed microbiologically or not) and people with confirmed asymptomatic infections (EFSA, 2014).
1.3.3. Yersinia in food
Statistics on the presence of Yersinia in the major food categories in 2020 and for 2016–2019 are summarised in Table 74 according to the food type (i.e. RTE and non‐RTE foods).
Table 74.
Occurrence of Yersinia in major food categories, EU, 2016–2020
| Food | 2020 | 2016–2019 a | ||||
|---|---|---|---|---|---|---|
| N reporting MS | N sampling units | Positive N (%) | N reporting MS | N sampling units | Positive N (%) | |
| RTE food | ||||||
| All | 5 | 766 | 40 (5.2) | 5 | 1,003 | 82 (8.2) |
| Meat and meat products | 3 | 731 | 40 (5.5) | 4 | 977 | 81 (8.3) |
| Meat and meat products from pigs | 2 | 6 | 0 | 2 | 31 | 0 |
| Mixed meat and meat products from bovine animals and pigs | 1 | 679 | 40 (5.9) | 2 | 874 | 71 (8.1) |
| Mixed meat | 1 | 40 | 0 | 2 | 60 | 10 (16.7) |
| Milk and milk products | 2 | 29 | 0 | 1 | 2 | 0 |
| Fruits and vegetables | 2 | 6 | 0 | 2 | 4 | 0 |
| Other processed food products and prepared dishes | 1 | 1 | 0 | 2 | 4 | 1 (25.0) |
| Non‐RTE food | ||||||
| All | 7 | 811 | 43 (5.3) | 7 | 4,355 | 386 (8.9) |
| Meat and meat products | 6 | 581 | 34 (5.9) | 7 | 3,919 | 365 (9.3) |
| Milk and milk products | 3 | 148 | 9 (6.1) | 2 | 90 | 20 (22.2) |
| Other food | 3 | 76 | 0 | 3 | 334 | 1 (0.30) |
| Fresh meat | ||||||
| All fresh meat | 5 | 310 | 27 (8.7) | 7 | 1,803 | 176 (9.8) |
| Fresh meat from pigs | 3 | 279 | 25 (9.0) | 6 | 1,617 | 145 (9.0) |
| Fresh meat from bovine animals | 0 | 0 | – | 3 | 24 | 1 (4.2) |
| Other fresh meat | 3 | 31 | 2 (6.5) | 3 | 162 | 30 (18.5) |
MS: Member State; RTE: ‘ready‐to‐eat'.
Since 1 February 2020, the United Kingdom has become a third country. United Kingdom data are presented for 2016–2019, whereas for 2020, United Kingdom data are not presented.
As in recent years, in 2020 RTE food samples tested for the presence of Yersinia (N = 766) mostly belonged to ‘meat and meat products’ (731 samples; 95.4%) and were reported by five MS. A total of 40 (5.9%) RTE food samples from ‘mixed meat and meat products from bovine animals and pigs’ were positive for Yersinia in 2020. During 2016–2019, 71 (8.1%) Yersinia‐positive sampling units were found in RTE food from ‘mixed meat and meat products from bovine animals and pigs’ and 10 (16.7%) from ‘mixed meat’ samples. Despite few MS reporting food monitoring on Yersinia to EFSA and few results being reported for food categories other than ‘meat and meat products’, the detection of Yersinia in RTE foods is a finding of concern because this contamination poses a direct risk to consumers.
Among non‐RTE foods, results of sampling and testing were reported in 2020 by seven MS. Yersinia was detected in ‘meat and meat products’ and ‘milk and milk products’ only. For both these food types, the percentages of positive samples in 2020 were lower compared with years 2016–2019. In ‘fresh meat’, Yersinia was isolated from ‘fresh meat of pigs’ in about one of ten tested samples (9%).
Biotype and serotype of Y. enterocolitica were rarely reported in 2020. Due to the importance of certain biotypes in the epidemiology of Y. enterocolitica, access to typing information is extremely important to correctly assess the public health significance and pathogenicity of Y. enterocolitica for humans.
1.3.4. Yersinia in animals
Table 75 summarises the reported occurrence of Yersinia in animals for the year 2020. In 2020, six MS reported data on monitoring of Yersinia in animals. A total of 20,742 units from animals (either individual animals or herds/flocks) were tested for Yersinia. Apart from pigs, other livestock was tested, as well as other animal species. Two non‐MS also reported on Yersinia in animals.
Table 75.
Summary of Yersinia statistics related to animal species, reporting MS, 2020
| Animals | N reporting MS | N tested units a | Units positive for Y. enterocolitica | |
|---|---|---|---|---|
| N | % | |||
| Pigs | 4 | 2,368 | 0 | 0 |
| Domestic livestock other than pigs b | 5 | 17,373 | 40 | 0.23 |
| Other animal species c | 6 | 1,001 | 44 | 4.4 |
MS: Member State.
The summary statistics were obtained summing all sampling units (single and batch samples).
Alpacas, cattle (bovine animals), domestic solipeds, farmed camels, farmed rabbits, farmed wild boars, goats, llamas, poultry and sheep.
All animals ‐ zoo animals, Antelopes – wild, Badgers – wild, Birds, Birds ‐ pet animals, Birds – wild, cantabrian chamois – wild, capybaras – wild, cats, cats ‐ pet animals, deer – wild, deer ‐ wild ‐ fallow deer, deer ‐ wild ‐ roe deer, dogs ‐ pet animals, dolphin, doves – wild, falcons – wild, ferrets – wild, fish, foxes – wild, gerbils ‐ pet animals, guinea pigs ‐ pet animals, gulls – wild, hares, hares – wild, hedgehogs – wild, marine mammals – wild, martens – wild, monkeys ‐ zoo animal, other animals ‐ exotic pet animals, parrots ‐ pet animals, parrots ‐ zoo animals, pheasants, rabbits, rabbits ‐ pet animals, raccoons, rats – wild, rhinoceros ‐ zoo animal, rodents – wild, squirrels, squirrels – wild, steinbok – wild, water buffalos, wild boars – wild, wolves – wild, zoo animals.
1.4. Discussion
In 2020, yersiniosis was the third most commonly reported foodborne zoonotic disease in the EU. Among the two pathogenic species that are notified, Y. enterocolitica and Y. pseudotuberculosis, the first caused the majority of human infections. Denmark and Finland reported the highest yersiniosis rates.
There is a decreasing trend for human yersiniosis cases in 2016–2020. The decrease in 2020 is probably due to the COVID‐19 pandemic, at least for a proportion of cases. Information on the biotype, which is one important marker of Yersinia pathogenicity, was provided for a minority of yersiniosis cases. Biotype is important information that could help to better characterise the epidemiology of Yersinia infection in humans and to better investigate the relevant animal sources in the EU.
In 2020, similarly to recent years, few MS reported data on sampling activities for Yersinia in food and animals. This is probably due to the lack of mandatory control programmes in non‐human sources, leading to remarkable differences between MS in the monitoring approach to Yersinia in food and animals, depending on the specific epidemiological situation. However, interestingly sampling activities in 2020 were not significantly affected by the consequences of the COVID‐19 pandemic, with the number of food samples tested for Yersinia being similar to recent years.
It is difficult to compare data among countries and across different years because sampling plans lack harmonisation on many details such as sampling design, target animal species, type of food sampled, point of sampling in the food production chain, and level and target of strain characterisation. These aspects make it impossible to perform trend analyses and even trend watching, and to use the data collected in the EU and the key statistics on the sources of Yersinia in food or animals. An EFSA scientific report suggested technical specifications for the harmonised monitoring and reporting of Y. enterocolitica in slaughter pigs in the EU (EFSA, 2009c).
Despite a low number of MS providing data on Yersinia in RTE food, the proportion of samples that tested positive for Yersinia in 2020 was quite high (5.2%), considering the fact that RTE food can be consumed without any further processing to reduce or eliminate the Yersinia contamination, such as heat treatment. All positive samples were from the RTE ‘meat and meat products’ category, in particular, ‘mixed meat and meat products from bovine animals and pigs’.
Information on Yersinia species and Y. enterocolitica biotype was supplied for a small fraction of data, probably because species identification and characterisation methods are laborious and time‐consuming. However, documenting trends and sources of Yersinia along the food chain, including reporting of information on the biotype (EFSA BIOHAZ Panel, 2007) of each Y. enterocolitica, is essential to the overall goal of reducing yersiniosis at both the primary production level and other critical points along the food production chain. Food may be contaminated with Y. enterocolitica primarily or by contact with contaminated surfaces or equipment. During the slaughter of animals and processing of meat, Y. enterocolitica may be transferred from contaminated tissues onto other meat. Meat from the areas close to the head and sternum presents the greatest risk of being contaminated (Chlebicz and Slizewska, 2018).
In this context, real‐time PCR‐based methods offer the advantage of detecting this pathogen rapidly and with greater sensitivity compared to culture methods. In particular, the ISO method (the method ISO 18867:2015 (ISO, 2015b) describes real‐time PCR assays for the detection of pathogenic bioserotypes of Y. enterocolitica and for Y. pseudotuberculosis (Rivas et al., 2021). Finally, in a One‐Health approach, the use of WGS for the typing of Yersinia isolates in food, animals and humans will allow for monitoring of human transmission and will improve public health surveillance (Hunter et al., 2019).
1.5. Related projects and internet sources
| Subject | For more information see | |
|---|---|---|
| Humans | Fact sheet yersiniosis (Yersinia enterocolitica) | https://www.cdc.gov/yersinia/faq.html |
| ECDC Surveillance Atlas of Infectious Diseases | http://atlas.ecdc.europa.eu/public/index.aspx | |
| EU case definition of yersiniosis | https://www.ecdc.europa.eu/en/surveillance‐and‐disease‐data/eu‐case‐definitions | |
| Disease Programme on Emerging, Food‐ and Vector‐Borne Diseases | https://ecdc.europa.eu/en/about‐us/who‐we‐are/disease‐programmes/food‐and‐waterborne‐diseases‐and‐zoonoses‐programme | |
| European Food‐ and Waterborne Diseases and Zoonoses Network (FWD‐Net) | https://ecdc.europa.eu/en/about‐us/partnerships‐and‐networks/disease‐and‐laboratory‐networks/fwd‐net | |
| Food‐Animals | Monitoring and identification of human enteropathogenic Yersinia spp. – Scientific Opinion of the Panel on Biological Hazards | https://www.efsa.europa.eu/en/efsajournal/pub/595 |
| Annual national zoonoses country reports (reports of reporting countries on national trends and sources of zoonoses) | https://www.efsa.europa.eu/en/data‐report/biological‐hazards‐reports |
2. Toxoplasma gondii
Tables and figures that are not presented in this chapter are published as supporting information to this report and are available as downloadable files from the EFSA Knowledge Junction on Zenodo at https://doi.org/10.5281/zenodo.5682809. Summary statistics of human surveillance data with downloadable files are retrievable using ECDC’s Surveillance Atlas of Infectious Diseases at http://atlas.ecdc.europa.eu/public/index.aspx
2.1. Key facts
-
•
Only confirmed cases of congenital toxoplasmosis are reported to ECDC, with a 2‐year delay in human data analyses and reporting at the EU level.
-
•
In 2019, 176 confirmed human cases of congenital toxoplasmosis were reported in the EU. The notification rate was 5.2 cases per 100,000 live births, which decreased by 13.3% in 2019 compared to 2018.
-
•
In 2019, France accounted for 76% of reported cases of congenital toxoplasmosis due to the active screening of pregnant women.
-
•
Overall, the number of human cases of congenital toxoplasmosis has shown a gradual decrease in the EU in the 2015–2019 period, mainly due to the reduction in cases reported by a single MS (France), which reported 85.4% of EU cases in 2015, down to 76.1% in 2019.
-
•
No foodborne toxoplasmosis outbreaks were reported in the EU in 2020, and no such single foodborne outbreak has been reported to EFSA since the start of its foodborne outbreak data collection in 2004.
-
•
In total, 11 MS and three non‐MS reported 2020 monitoring data on Toxoplasma gondii infections in animals. Most animals tested were sheep and goats, which also showed the highest overall prevalence of T. gondii infections in animals (21.3%), as reported by 11 MS. Most samples were obtained from clinical investigations. It is not possible to accurately estimate the prevalence of T. gondii infections in animals due to the use of different diagnostic methods, the different sampling schemes in the MS, and the lack of information on the animals’ ages and rearing conditions.
2.2. Surveillance and monitoring of Toxoplasma in the EU
2.2.1. Humans
In 2019, in 19 MS, notification was based on a mandatory system and in two MS (France and the United Kingdom) on a voluntary system. Data from France are reported to TESSy with a 2‐year delay. Six countries (Denmark, Italy, the Netherlands, Norway, Portugal and Sweden) do not have a surveillance system for toxoplasmosis. Surveillance systems cover the whole population in all reporting MS except in Spain. No estimate for population coverage in Spain was provided so no notification rate was calculated. For 2019, Spain has not received data from all regions and rates are therefore not displayed for this year. Case‐based data were reported by all countries except Bulgaria, which reported aggregated data. Both reporting formats were included to calculate numbers of cases and notification rates.
Five countries (Austria, Belgium, France, Slovakia and Slovenia) have active surveillance of congenital cases, with compulsory screening of pregnant women. Austria and Belgium, however, do not report to TESSy. In the case of Austria, the disease is not notifiable and official data are therefore lacking. In Belgium, there are no clear recommendations on the follow‐up of seroconversion cases during pregnancy. Four countries (Bulgaria, Czechia, Germany and Hungary) have voluntary screening (ECDC, 2021b).
2.2.2. Animals
There is no EU regulation concerning the surveillance and monitoring of T. gondii in animals. Therefore, the available and reported information relies on national legislation and whether the countries have a mandatory reporting system following the detection of T. gondii. The main animal species tested are small ruminants (goats and sheep), cattle, pigs and pet animals (cats and dogs), using samples from aborted animals (ruminants) or clinically suspect animals. Mainly blood samples, but also samples from tissues and organs, are analysed either by indirect antibody detection methods (ELISA, LAT, complement fixation test (CFT), direct agglutination (DA) or immunofluorescence assay (IFA)), or by direct methods (PCR, histology, flotation and immunohistochemistry (IHC)). As the surveillance of T. gondii in animals is not harmonised, data allow only for descriptive summaries at the EU level. This is because the results submitted by different countries, as well as by different regions within a given country, are mostly not directly comparable due to differences in sampling strategy, testing methods and different sampling schemes. Both the age of animals and the production systems at the farm level may influence the occurrence of T. gondii.
2.2.3. foodborne outbreaks of toxoplasmosis
According to Zoonoses Directive 2003/99/EC, reporting of foodborne toxoplasmosis outbreaks in humans is mandatory, although no standard is available for the laboratory detection of Toxoplasma contamination in foodstuffs (e.g. fresh produce, raw milk, meat products and shellfish). No outbreaks of toxoplasmosis were reported in 2020.
From 1 February 2020, the United Kingdom became a third country. Food, animal and foodborne outbreak data from the United Kingdom were still being collected by EFSA for 2020 in the framework of Zoonoses Directive 2003/99/EC, but are excluded from EU statistics.
2.3. Results
2.3.1. Human congenital toxoplasmosis
In 2019, 21 EU MS reported congenital toxoplasmosis data (Table 76), with a total of 176 confirmed cases. Thirteen countries reported zero cases, whereas seven MS (Austria, Belgium, Denmark, Italy, the Netherlands, Portugal and Sweden) did not report congenital toxoplasmosis at the EU level (Table 76). The notification rate was 5.2 per 100,000 live births in the EU, with the highest rate in France (18.8), followed by Latvia (5.2), Slovenia (5.1) and Poland (3.7) (Table 76).
Table 76.
Reported human cases of congenital toxoplasmosis and notification rates per 100,000 live births in EU MS and non‐MS countries, by country and year, 2015–2019
| Country | 2019 | 2018 | 2017 | 2016 | 2015 | |||||||
|---|---|---|---|---|---|---|---|---|---|---|---|---|
| National coverage a | Data format a | Confirmed cases and rate | Confirmed cases and rate | Confirmed cases and rate | Confirmed cases and rate | Confirmed cases and rate | ||||||
| Cases | Rate | Cases | Rate | Cases | Rate | Cases | Rate | Cases | Rate | |||
| Austria b | – | – | – | – | – | – | – | – | – | – | – | – |
| Belgium b | – | – | – | – | – | – | – | – | – | – | – | – |
| Bulgaria | Y | A | 0 | 0 | 0 | 0 | 2 | 3.1 | 0 | 0 | 0 | 0 |
| Croatia c | Y | C | 0 | 0 | 1 | 2.7 | 0 | 0 | 0 | 0 | 0 | 0 |
| Cyprus | Y | C | 0 | 0 | 0 | 0 | 0 | 0 | 0 | 0 | 0 | 0 |
| Czechia | Y | C | 1 | 0.88 | 0 | 0 | 2 | 1.8 | 0 | 0 | 1 | 0.91 |
| Denmark b | – | – | – | – | – | – | – | – | – | – | – | – |
| Estonia | Y | C | 0 | 0 | 1 | 7.2 | 0 | 0 | 0 | 0 | 0 | 0 |
| Finland | Y | C | 0 | 0 | 0 | 0 | 0 | 0 | 1 | 1.8 | 0 | 0 |
| France | Y | C | 134 | 18.8 | 151 | 20.8 | 153 | 20.7 | 195 | 25.9 | 246 | 31.8 |
| Germany | Y | C | 17 | 2.2 | 18 | 2.3 | 8 | 1.0 | 10 | 1.3 | 15 | 2.1 |
| Greece | Y | C | 0 | 0 | 0 | 0 | 0 | 0 | – | – | – | – |
| Hungary b | – | – | 1 | – | 0 | – | 0 | – | 0 | – | 1 | – |
| Ireland | Y | C | 0 | 0 | 0 | 0 | 0 | 0 | 0 | 0 | 1 | 1.5 |
| Italy b | – | – | – | – | – | – | – | – | – | – | – | – |
| Latvia | Y | C | 1 | 5.2 | 0 | 0 | 0 | 0 | 0 | 0 | 0 | 0 |
| Lithuania | Y | C | 0 | 0 | 0 | 0 | 0 | 0 | 0 | 0 | 1 | 3.3 |
| Luxembourg | Y | C | 0 | 0 | 0 | 0 | 0 | 0 | 0 | 0 | 0 | 0 |
| Malta | Y | C | 0 | 0 | 0 | 0 | 0 | 0 | 0 | 0 | 0 | 0 |
| Netherlands b | – | – | – | – | – | – | – | – | – | – | – | – |
| Poland | Y | C | 14 | 3.7 | 25 | 6.3 | 18 | 4.8 | 20 | 5.5 | 15 | 4.1 |
| Portugal b | – | – | – | – | – | – | – | – | – | – | – | – |
| Romania | Y | C | 0 | 0 | 1 | 0.48 | 0 | 0 | 0 | 0 | 0 | 0 |
| Slovakia | Y | C | 0 | 0 | 0 | 0 | 0 | 0 | 2 | 3.6 | 0 | 0 |
| Slovenia | Y | C | 1 | 5.1 | 2 | 9.9 | 2 | 9.8 | 1 | 4.8 | 1 | 4.7 |
| Spain d | N | C | 0 | – | 2 | – | 3 | – | 5 | – | 0 | – |
| Sweden b | – | – | – | – | – | – | – | – | – | – | – | – |
| United Kingdom e | Y | C | 7 | 0.95 | 7 | 0.91 | 7 | 0.91 | 8 | 1.0 | 7 | 0.90 |
| EU Total | – | – | 176 | 5.2 | 208 | 6.0 | 195 | 5.5 | 242 | 7.1 | 288 | 8.6 |
| Iceland | Y | C | 0 | 0 | 0 | 0 | 0 | 0 | 0 | 0 | 0 | 0 |
| Norway b | – | – | – | – | – | – | – | – | – | – | – | – |
| Switzerland b | – | – | – | – | – | – | – | – | – | – | – | – |
–: Data not reported.
Y: yes; N: no; A: aggregated data; C: case‐based data.
Not notifiable, no surveillance system in place.
Croatia reported aggregated data for 2016.
Notification rate was not calculated since information on estimated coverage was not available.
When data were collected, the United Kingdom was an EU MS but since 1 February 2020 it has become a third country.
France accounted for 76.1% of all reported cass in the EU, followed by Germany, Poland and the United Kingdom. France regularly reports the highest number of congenital toxoplasmosis cases in the EU, whereas the other three countries accounted for 21.6% of the cases reported in the EU.
A relevant and gradual decrease in the number of reported cases of 45.5% was observed from France between 2015 and 2019. A similar decrease was not observed for other countries such as Germany, Poland or the United Kingdom. As a result of fewer cases reported by France, the notification rate in the EU decreased by 13.3% in 2019 compared to 2018 (Table 76).
In 2019, information on hospitalisation was provided by five MS (Czechia, Hungary, Latvia, Poland and Slovenia) on 18 cases. Of these, 17 cases required hospitalisation with the majority (14 cases) reported by Poland. Cases with known fatal outcomes were 5 out of 141 (case fatality of 3.5%), with all fatal cases reported by France.
2.3.2. Toxoplasma in food and animals
Toxoplasma in food
One MS (Italy) submitted monitoring results for T. gondii in food in 2020, as well as in the previous 3 years. In total, 1,493 samples were reported from meat products from pigs, and one sample from pasteurised cow milk. 27 Thirty‐five samples were positive (2.3%) and all were from meat products from pigs.
Toxoplasma in animals
Table 77 summarises statistics on T. gondii occurrence in major animal species for the 2016–2020 period in the EU. Animal data of interest reported were classified into the major categories and aggregated by year to obtain an annual overview of the volume of data submitted.
Table 77.
Summary of Toxoplasma gondii infection detected in major animal species, EU, 2016–2020
| Animals | 2020 | 2019 a | 2018 a | 2017 a | 2016 a | Data source |
|---|---|---|---|---|---|---|
| Small ruminants | ||||||
| Number of sampling units | 6,113 | 12,120 | 6,756 | 6,410 | 6,404 | EFSA |
| Proportion of positive units (%) | 21.3 | 13.5 | 18.3 | 18.3 | 16.6 | EFSA |
| Number of reporting MS | 11 | 12 | 12 | 13 | 13 | EFSA |
| Cattle | ||||||
| Number of sampling units | 254 | 664 | 158 | 2,163 | 451 | EFSA |
| Proportion of positive units (%) | 9.8 | 9.2 | 27.8 | 10.6 | 3.3 | EFSA |
| Number of reporting MS | 4 | 6 | 6 | 7 | 8 | EFSA |
| Pigs | ||||||
| Number of sampling units | 948 | 1,108 | 263 | 689 | 360 | EFSA |
| Proportion of positive units (%) | 9.7 | 11.7 | 22.1 | 15.2 | 2.2 | EFSA |
| Number of reporting MS | 4 | 4 | 4 | 4 | 3 | EFSA |
| Cats | ||||||
| Number of sampling units | 1,880 | 1,525 | 1,382 | 690 | 1,250 | EFSA |
| Proportion of positive units (%) | 6.5 | 5.2 | 4.7 | 7.5 | 21.1 | EFSA |
| Number of reporting MS | 6 | 8 | 9 | 8 | 8 | EFSA |
For the summary statistics, indirect and direct diagnostic methods were taken together to calculate the proportion of positive units.
MS: Member State.
Since 1 February 2020, the United Kingdom has become a third country. United Kingdom data are presented for 2016–2019, whereas for 2020, United Kingdom data are not presented.
Monitoring data on T. gondii in livestock (small ruminants, cattle, solipeds, pigs, alpacas, rabbits and water buffaloes) were provided by 11 MS (Austria, Finland, Germany, Greece, Hungary, Ireland, Italy, Latvia, the Netherlands, Slovakia and Spain), and by three non‐MS (Norway, Switzerland and the United Kingdom).
In small ruminants (sheep and goats), 11 MS (Austria, Finland, Germany, Greece, Hungary, Ireland, Italy, Latvia, the Netherlands, Slovakia and Spain) and three non‐MS (Norway, Switzerland and the United Kingdom) reported data. In total, 6,667 animals were tested and 1,605 were found to be positive (24.1%). In cattle, four MS (Austria, Ireland, Italy and Slovakia) and two non‐MS (Switzerland and the United Kingdom) reported data on Toxoplasma‐specific antibodies. In total, 262 animals were tested and 31 were found to be positive (11.8%). In pigs, three MS (Austria, Germany and Italy) and one non‐MS (the United Kingdom) reported monitoring data: in total, 949 animals were tested and 92 (9.7%) were found to be positive. For other livestock (solipeds, alpacas, rabbits and water buffaloes), four MS (Austria, Ireland, Italy and Slovakia) reported monitoring data: in total, 46 animals were tested and three (6.5%) were found to be positive. In pet animals (cats and dogs), seven MS (Austria, Finland, Germany, Italy, Latvia, the Netherlands and Slovakia) and one non‐MS (Switzerland) tested in total 3,859 animals (2,141 cats and 1,718 dogs). There were 408 (10.5%) positive samples, 191 (8.9%) samples from cats and 217 (12.6%) samples from dogs, obtained mainly from clinical investigations. Six MS (Austria, Finland, Germany, Ireland, Italy and Slovakia) and one non‐MS (Switzerland) reported on testing for T. gondii in wildlife. In total, 728 animals (mainly from Italy) were tested and 60 were positive (8.2%).
The 2020 monitoring data reported by MS concerning animals show that T. gondii is present in most livestock species across the EU. The limitations of these surveillance data preclude any trend watching or prevalence trend analysis in animals.
2.4. Discussion
Cases of congenital toxoplasmosis in the EU are strongly biased by the high reporting rate of France, which has always accounted for the majority of reported cases, representing 76.1%‐85.4% of overall EU cases in 2015–2019. The high reporting rate for France reflects mandatory systematic screening for toxoplasmosis in pregnant women established in 1978: Seronegative women are followed up during pregnancy to detect seroconversion early, and congenital toxoplasmosis cases are laboratory confirmed. The constant decrease in cases in the EU mirrored the lower number of cases reported by France in the 2015–2019 period. The most remarkable decrease in reported cases occurred in 2016 and 2017 and continued in subsequent years, with the lowest rate in 2019. The lower number of cases reported by France may be explained by a continuous decrease in seroprevalence in pregnant women in France (from 54% in 1995, to 31% in 2016), as well as by a decreased number of seroconversions during pregnancy (from 5.4 per 1,000 at‐risk pregnancies in 1995, to 2.1 in 2010, and expected to be 1.6 by 2020) (Robinson et al., 2021). This trend may be the result of reduced exposure to contaminated raw/undercooked meat (e.g. changes in food habits and improved hygiene practices in meat production) or other raw foods at risk of contamination (e.g. fresh produce, molluscs). In contrast to France, broad variability is found in congenital toxoplasmosis surveillance among EU MS, with a high number of countries reporting zero cases, not reporting to ECDC, or lacking any surveillance for congenital toxoplasmosis. This reflects international discussions about the effectiveness of prenatal screening in preventing or reducing the impact of congenital toxoplasmosis. Consequently, an estimate of congenital toxoplasmosis prevalence in the EU is not possible, limiting assessment of the burden of this form of the disease. However, not only prenatal, but also postnatal sensitive and effective diagnostic screening should be implemented and improved in the EU in order to efficiently detect cases of congenital toxoplasmosis, particularly when anti‐toxoplasma maternal treatment is performed, which might decrease diagnostic sensitivity generating false negatives (Guegan et al., 2021). Primary infection in pregnancy, particularly if early in gestation and even in the asymptomatic form, is of particular concern. It can result in intrauterine transmission to the fetus and congenital toxoplasmosis, possibly leading to abortion, still‐birth, perinatal death or congenital diseases with immediate or late (up to adolescence) manifestations, including ocular diseases, seizures and learning disabilities. All possible strategies for the prevention of congenital toxoplasmosis, including appropriate information to pregnant woman and active screening, should be reinforced.
The 2020 monitoring data from animals reported by MS show that T. gondii is present in most livestock species across the EU, as well as in wildlife. The limitations of these surveillance data preclude any trend watching or prevalence trend analysis in animals.
The current European surveillance system of T. gondii in animals is strongly affected by several important limitations: (i) the small number of tested animals, intensified by the fact that since 1 February 2020, the United Kingdom has become a third country, therefore United Kingdom data are excluded from EU statistics; (ii) the use of different indirect and direct detection methods, which have not been validated by an independent body in most cases; (iii) unknown age of the tested animals; and (iv) no information on the type of husbandry system (housing). Furthermore, there is no relationship between the presence of anti‐T. gondii antibodies and infecting parasites in cattle and horses (Aroussi et al., 2015; Blaga et al., 2019; Opsteegh et al., 2019). For pigs, poultry and small ruminants, serological methods could be useful for the detection of high‐risk animals or herds, but not as an indicator of infection in individual animals, as the agreement between direct and indirect methods was estimated to be low to moderate.
The risk associated with consumption of fresh produce and raw/undercooked meat has been linked to outbreaks of toxoplasmosis worldwide. The absence of reporting of toxoplasmosis outbreaks in the EU is likely the result of: (i) difficulty linking the infection with food consumption since in healthy immunocompetent individuals, toxoplasmosis mostly occurs without symptoms or with mild flu‐like symptoms that are possibly misdiagnosed; and (ii) scarce and non‐standardised monitoring of foodstuff contamination in EU MS and non‐MS countries. Efforts at the EU level to standardise and implement molecular procedures for T. gondii detection in food, particularly fresh produce, are in progress and will likely contribute to improved data reporting (https://onehealthejp.eu/jrp‐toxosources/).
The above‐mentioned limitations associated with toxoplasmosis detection and diagnosis, and surveillance rules, do not allow for direct comparison of the reported data across MS.
2.5. Related project and internet sources
| Subject | For more information see | |
|---|---|---|
| Humans | Fact sheet toxoplasmosis | https://www.cdc.gov/parasites/toxoplasmosis/index.html |
| ECDC Surveillance Atlas of Infectious Diseases | http://atlas.ecdc.europa.eu/public/index.aspx | |
| EU case definition of congenital toxoplasmosis | https://www.ecdc.europa.eu/en/surveillance‐and‐disease‐data/eu‐case‐definitions | |
| ECDC Congenital toxoplasmosis ‐ Annual Epidemiological Report for 2018 | https://www.ecdc.europa.eu/en/publications‐data/congenital‐toxoplasmosis‐annual‐epidemiological‐report‐2018 | |
| Disease Programme on Emerging, Food‐ and Vector‐Borne Diseases | https://www.ecdc.europa.eu/en/about‐us/who‐we‐are/units/disease‐programmes‐unit | |
| European Food‐ and Waterborne Diseases and Zoonoses Network (FWD‐Net) | https://www.ecdc.europa.eu/en/about‐us/partnerships‐and‐networks/disease‐and‐laboratory‐networks/fwd‐net | |
| Guidelines for the Prevention and Treatment of Opportunistic Infections in HIV‐Exposed and HIV‐Infected Children | https://clinicalinfo.hiv.gov/en/guidelines/pediatric‐opportunistic‐infection/toxoplasmosis | |
| Animals | EFSA External Scientific Report: Relationship between seroprevalence in the main livestock species and presence of Toxoplasma gondii in meat (GP/EFSA/BIOHAZ/2013/01) An extensive literature review | http://onlinelibrary.wiley.com/doi/10.2903/sp.efsa.2016.EN‐996/pdf |
| EFSA Supporting Publication: Experimental studies on Toxoplasma gondii in the main livestock species (GP/EFSA/BIOHAZ/2013/01) Final report. M. Opsteegh, G. Schares, R. Blaga and J. van der Giessen | https://efsa.onlinelibrary.wiley.com/doi/abs/10.2903/sp.efsa.2016.EN‐995 | |
| Annual national zoonoses country reports (reports of reporting countries on national trends and sources of zoonoses) | https://www.efsa.europa.eu/en/data‐report/biological‐hazards‐reports | |
| OIE Manual Chapter 2.9.9. Toxoplasmosis | http://www.oie.int/fileadmin/Home/eng/Health_standards/tahm/2.09.09_TOXO.pdf | |
| Human, Food and Animal | EFSA Scientific Opinion: Surveillance and monitoring of Toxoplasma in humans, food and animals | http://onlinelibrary.wiley.com/doi/10.2903/j.efsa.2007.583/epdf |
| European Union Reference Laboratory for Parasites | https://www.iss.it/en/web/iss‐en/eurlp‐about‐us | |
| Public health risks associated with foodborne parasites (EFSA Panel on Biological Hazards, BIOHAZ)) | https://efsa.onlinelibrary.wiley.com/doi/epdf/10.2903/j.efsa.2018.5495 | |
| OHEJP TOXOSOURCES: Toxoplasma gondii sources quantified | https://onehealthejp.eu/jrp‐toxosources/ |
3. Rabies
Tables and figures that are not presented in this chapter are published as supporting information to this report and are available as downloadable files from the EFSA Knowledge Junction on Zenodo at https://doi.org/10.5281/zenodo.5682809. Summary statistics of human surveillance data with downloadable files are retrievable using ECDC’s Surveillance Atlas of Infectious Diseases at http://atlas.ecdc.europa.eu/public/index.aspx
3.1. Key facts
-
•
For 2020, EU MS and non‐MS countries reported no human Lyssavirus infections for the first time since 2015. Travel‐associated rabies cases have been reported every year in Europe since then (N = 4 in 2019, N = 1 per year 2016–2018).
-
•
In non‐flying terrestrial animals, a total of 12 cases of rabies of autochthonous origin were reported by two MS: seven cases in Poland (five foxes, one cow and one dog) and five cases in Romania (one fox, two cows and two dogs). The total number of reported indigenous rabies cases in terrestrial animals in the EU increased in 2020 (N = 5 in 2019; N = 8 in 2018; N = 6 in 2017).
-
•
Surveillance data on Lyssavirus in bats were reported by 15 EU MS. Five MS reported positive results for Lyssavirus, mainly of the European bat 1 lyssavirus (EBLV‐1) species, with a total of 31 cases in bats.
-
•
A case of rabies was reported by France in an illegally imported dog, infected with a virus lineage (Africa 1 lineage) from North Africa. In Ireland, an imported sable (Martes zibellina) kept as a pet was reported positive for rabies.
-
•
Two indigenous cats were reported positive for a bat lyssavirus [N = 1 EBLV‐1 in France and N = 1 West Caucasian bat lyssavirus (WCBV) in Italy].
3.2. Surveillance and monitoring of rabies in the EU
3.2.1. Humans
Rabies in humans is a mandatory notifiable disease at the EU level and cases are reported through TESSy. For 2020, 26 EU MS reported case‐based data (Denmark did not report). Twenty‐four countries used the EU case definition and two countries used an alternative case definition (Germany and Italy). Reporting is mandatory and case‐based in all MS. Disease surveillance is comprehensive in all reporting countries and is mostly passive, except in Czechia, Portugal and Slovakia.
Since 1 February 2020, the United Kingdom has become a third country. Human data from the United Kingdom were not collected by ECDC for 2020.
3.2.2. Animals
The objective of rabies surveillance is to detect the presence and the geographic distribution of the virus over time, to allow timely dissemination of information for immediate integrated control actions among different sectors, such as the public health and veterinary sectors. For rabies‐free countries, surveillance aims to confirm the absence of the disease. According to Regulation (EU) No 652/2014 28 and Commission Delegated Regulation (EU) No 2020/689 29 , multiannual programmes for eradication of rabies may be co‐financed by the EU. In 2020, 12 MS (Bulgaria, Croatia, Estonia, Finland, Greece, Hungary, Latvia, Lithuania, Poland, Romania, Slovakia and Slovenia) had approved eradication, control and surveillance programmes for rabies. Wildlife oral rabies vaccination campaigns (ORV) are currently ongoing in 11 MS (Bulgaria, Croatia, Estonia, Finland, Greece, Hungary, Latvia, Lithuania, Poland, Romania and Slovakia), as well as in some EU‐bordering countries. The surveillance of rabies is carried out by sampling and testing ‘indicator animals’; these are wild or domestic animals (foxes, raccoon dogs, badgers, dogs, cattle, cats, sheep, equines, goats, rabbits, etc.) that are found dead (including road‐killed) and/or suspected animals, i.e. animals showing neurological clinical signs or abnormal behaviour compatible with rabies, or biting, licking or scratching a human in the absence of clear neurological signs.
To monitor the efficacy of the ORV campaigns, healthy animals of the wild species targeted by oral vaccination (foxes, raccoon dogs and golden jackals) are collected to determine immunity and oral vaccine bait uptake. These animals are also currently tested for rabies and very few of them are found to be positive for rabies.
Imported or travel‐related companion animals (mainly dogs and cats) from territories and non‐EU countries not included in Annex II of Commission Implementing Regulation (EU) No 577/2013 30 are currently tested for rabies neutralising antibodies.
EU MS must also notify outbreaks of infection with rabies virus in non‐flying terrestrial animals to the EU ADNS. 31 Surveillance of non‐rabies lyssavirus is not mandatory nor is it compulsory for EU MS to notify cases of non‐rabies lyssavirus in animals.
The data reported here include all animals tested for rabies, collected either for disease surveillance or for monitoring purposes.
Since 1 February 2020, the United Kingdom has become a third country. Animal data from the United Kingdom were collected by EFSA for 2020 in the framework of Zoonoses Directive 2003/99/EC, but are excluded from EU statistics.
3.3. Results
3.3.1. Overview of key statistics, EU, 2016–2020
A summary of EU‐level rabies statistics in humans and in wild and domestic animals is shown in Table 78. For animals, the total number of samples analysed from foxes, raccoon dogs, raccoons, dogs and bats, as well as the number of MS from which these samples originated, are shown. A slight increase has been observed in the number of tested samples from foxes, the main reservoir, over the last 3 years at the EU level. However, more MS reported data in 2020 compared to 2019 and 2018. The number of tested raccoon dogs remained stable in 2020 compared to 2019. A slight decrease has been observed in the number of tested dogs, while a 37% decrease for tested bats occurred in 2020 compared to 2019.
Table 78.
Summary of Lyssavirus statistics related to humans and the main animal reservoirs, EU, 2016–2020
| 2020 | 2019 a | 2018 a | 2017 a | 2016 a | Data source | |
|---|---|---|---|---|---|---|
| Humans | ||||||
| Total number of confirmed cases | 0 | 4 | 1 | 1 | 1 | ECDC |
| Total number of confirmed cases/100,000 population (notification rates) | 0 | < 0.01 | < 0.01 | < 0.01 | < 0.01 | ECDC |
| Number of reporting countries | 26 | 28 | 28 | 28 | 27 | ECDC |
| Infection acquired in the EU | 0 | 1 | 0 | 0 | 0 | ECDC |
| Infection acquired outside the EU | 0 | 3 | 1 | 1 | 1 | ECDC |
| Unknown travel status or unknown country of infection | 0 | 0 | 0 | 0 | 0 | ECDC |
| Animals | ||||||
| Foxes (Vulpes vulpes) | ||||||
| Number of tested animals | 24,221 | 23,141 | 21,570 | 30,485 | 35,232 | EFSA |
| Number of reporting MS | 21 | 19 | 19 | 20 | 20 | EFSA |
| Raccoon dogs (Nyctereutes procyonoides) and raccoons (Procyon lotor) | ||||||
| Number of tested raccoon dogs (raccoons) | 1,539 (513) b | 1,542 (6) | 1,358 (6) | 992 (12) | 1,169 (3) | EFSA |
| Number of reporting MS (racoons) | 9 (3) | 9 (2) | 8 (2) | 7 (4) | 6 (2) | EFSA |
| Dogs (Canis lupus familiaris) | ||||||
| Number of tested animals | 1,732 | 1,901 | 2,097 | 2,334 | 2,469 | EFSA |
| Number of reporting MS | 22 | 22 | 23 | 22 | 24 | EFSA |
| Bats (order Chiroptera) | ||||||
| Number of tested animals | 1,308 | 2,069 | 2,278 | 2,079 | 1,405 | EFSA |
| Number of reporting MS | 15 | 18 | 17 | 19 | 19 | EFSA |
| Farmed mammals c | ||||||
| Number of tested animals | 392 | 394 | 570 | 796 | 706 | EFSA |
| Number of reporting MS | 17 | 15 | 17 | 17 | 16 | EFSA |
ECDC: European Centre for Disease Prevention and Control; EFSA: European Food Safety Authority; MS: Member States.
Since 1 February 2020, the United Kingdom has become a third country. United Kingdom data are presented for 2016–2019, whereas for 2020, United Kingdom data are not presented.
In 2020, 513 raccoons were tested (505 from Germany, five from Poland and three from Czechia).
Farmed mammal category includes: cattle, farmed deer (species not specified), fallow deer (Dama dama), red deer (Cervus elaphus), roe deer (Capreolus capreolus), farmed foxes (species not specified), goats, land game mammals, pigs, farmed boars, farmed rabbits, sheep and horses.
The number of tested animals includes national statistics submitted by MS and not regional data that were submitted without a national summary.
3.3.2. Human Lyssavirus infections
EU MS and non‐MS countries reported no human Lyssavirus infections for 2020, an achievement never registered in the 2016–2019 period under evaluation. In the period 2016–2019, travel‐associated cases were reported each year from EU MS. In 2016 and 2017, France reported one travel‐associated case per year, with exposure in Pakistan and Sri Lanka, respectively. In 2018, the United Kingdom reported one human case following exposure in Morocco. In 2019, four human Lyssavirus infections were reported by EU MS. Three travel‐associated human rabies cases were reported by EU MS, namely Italy, Latvia and Spain, acquired in Tanzania, India and Morocco, respectively. Most human cases were linked to dog exposure. A human infection due to European bat lyssavirus 1 (EBLV‐1) was reported for 2019 from France.
3.3.3. Lyssavirus infections in animals
Wildlife rabies
In 2020, 24,221 foxes (Vulpes vulpes) were investigated by 21 MS. Almost half of the tested samples (44.4%) were analysed by two MS: Poland and Romania. In total, six cases of rabies in foxes were detected in the EU: five cases in Poland and one in Romania. The geographical distribution and number of cases in foxes, as well as a choropleth map of the total number of foxes sampled per MS, are shown in Figure 62. Four non‐EU countries (Norway, North Macedonia, Serbia and Switzerland) reported 170 tested foxes. None of these countries reported positive cases for rabies.
Figure 62.

Choropleth map of the number of tested and positive foxes, and geographical distribution of the reported rabies cases in foxes in EU MS and non‐EU countries, 2020
In 2020, 1,539 raccoon dogs (Nyctereutes procyonoides) were tested for rabies by nine MS (Czechia, Estonia, Finland, Germany, Italy, Latvia, Lithuania, Poland and Spain). Most (89.5%) of these samples originated from raccoon dogs from three MS (Estonia, Finland and Latvia). All tested samples were negative for rabies. A total of 513 raccoons (Procyon lotor) were tested for rabies by three MS (Czechia, Germany and Poland); most of them were reported from Germany (505). These samples were also all negative for rabies.
19 MS reported diagnostic data for 2,554 terrestrial wild animals other than foxes, raccoon dogs and raccoons. Almost half of these samples (45.9%) were reported by Bulgaria, with 1,254 of these originating from jackals. Other commonly tested species were badgers (432), martens (306), wolves (88), red and wild deer (70) and roe deer (67). Other species tested included bears, lynxes, ferrets, hares, hedgehogs, mice, minks, otters, polecats, rats, rodents, squirrels, wild boars, wolverines, coypus and Cantabrian chamois. All animals tested negative for rabies. Moreover, 925 mammals other than dogs, cats, foxes, raccoon dogs and raccoons, with unspecified habitats were also reported and all tested negative
In 2020, 15 MS and two non‐MS reported surveillance data on bats. In total, 1,308 bats were investigated in the EU (Figure 63). Of these, 31 samples tested positive in five MS: France (13 EBLV‐1), Germany (6 EBLV‐1), the Netherlands (5 EBLV‐1), Poland (5 Lyssavirus unspecified) and Spain (2 EBLV‐1). Two non‐MS, Switzerland and the United Kingdom, analysed 11 and 347 bats, respectively, with 3 samples testing positive in the United Kingdom (2 EBLV‐2 and one reported as unspecified).
Figure 63.

Choropleth map of the number of tested and positive bats, and geographical distribution of the reported rabies cases in bats in EU MS and non‐EU countries, 2020
Rabies cases in domestic animals
Romania reported four cases of rabies (RABV strain), of which two cases were reported in cows and two in dogs, and Poland recorded one case in a cow and one case in a dog.
In France, one dog was reported positive for rabies (RABV strain from North Africa). The animal had been imported from a canine rabies endemic area.
In Ireland, a sable (Martes zibellina) imported from Russia with transit via Italy and the United Kingdom that was being kept as a pet displayed atypical behaviour and was found to be positive for rabies, with RABV genetic material detected in the animal’s brain specimen. No further information was available on the strain responsible for the infection.
Two cats were reported positive for rabies by two MS (Italy and France); they were infected with Lyssavirus species other than RABV. The two autochthonous cats developed clinical signs suggestive of rabies. The virus isolated from the cat detected positive in Italy was further characterised as West Caucasian bat lyssavirus (WCBV). This lyssavirus was detected only once in 2002 in an insectivorous bat, Schreibers’ bent‐wing bat (Miniopterus schreibersii), in the western Caucasus Mountains of South‐eastern Europe. The virus isolated from the cat detected positive in France was an EBLV‐1, commonly found in serotine bats (Eptesicus serotinus). These very rare spillover cases represent the first detection of a bat lyssavirus in Italy and first spillover event of WCBV, and the third case of bat lyssavirus cat‐acquired infection in France (and in Europe). Both were dead‐end infections based on the evidence available so far.
The geographical distribution and number of the tested and reported cases in pets are shown in Figure 64.
Figure 64.

Choropleth map of the number of tested and positive pets, and geographical distribution of the reported rabies cases in pets in EU MS and non‐EU countries, 2020
In 2020, 22 MS tested and reported more than 4,000 samples for dogs (1,732) and cats (2,440). The number of samples reported for both species remained stable compared to 2019 (1,901 dogs and 2,389 cats were reported). Five non‐EU countries (Norway, North Macedonia, Serbia, Switzerland and the United Kingdom) reported in total 91 tested dogs and 33 tested cats. None of them reported positive cases for rabies.
A total of 392 samples from farmed mammals (Figure 65) were tested by 17 MS (reports included mainly cattle, small ruminants and domestic solipeds). The number of samples tested from domestic farmed mammals in 2020 was similar to that in 2019 (394 samples tested); these figures are lower than those in the last 5 years.
Figure 65.

Choropleth map of the number of tested and positive farmed animals, and geographical distribution of the reported rabies cases in farmed animals in EU MS and non‐EU countries, 2020
3.4. Discussion
In Europe, human rabies is a rare disease, with the last locally acquired EU case of RABV human infection dating back to 2012 (Romania). Nowadays, the infection is mainly acquired abroad in dog rabies endemic countries and the development of the disease is due to absent pre‐exposure prophylaxis or late/inappropriate/incomplete administration of post‐exposure treatment (Gossner et al., 2020). The illegal import of dogs also poses a risk of rabies introduction (Klevar et al., 2015). Another rare source of infection may be through organ transplantation (Maier et al., 2010). The absence of human rabies deaths in 2020 might be attributable to the travel restrictions adopted along with the COVID‐19 lockdown measures applied in most MS.
Concerning infections caused by lyssaviruses other than RABV, five human deaths have been reported so far in Europe, more specifically in Ukraine (1977: species not characterised), Russia (1985: EBLV‐1), Finland (1985: EBLV‐2), the United Kingdom (2002: EBLV‐2) and France (2019: EBLV‐1) (Fooks et al., 2003; Regnault et al., 2021). All these infections were linked to direct exposure to infected bats; however, indirect exposure to lyssaviruses by contact with infected domestic animals (mainly free‐roaming cats, occasionally infected by a bat lyssavirus) must not be overlooked. In this context, the absence of tools against divergent lyssaviruses circulating in European bats must be underlined (Echevarría et al., 2019).
These results show the persistence of the infection in its wildlife reservoir in Europe, as a total of 12 cases of rabies were reported in foxes and in domestic animals in Poland and Romania. The epidemiological data suggest stable rabies incidence, with a minimum of five cases reported annually since 2017 in non‐flying terrestrial animals in the MS reporting infections.
Data relating to rabies surveillance in wildlife, mainly in foxes and raccoon dogs/raccoons, show stability in the number of samples tested, and even a slight increase in the fox sampling effort. The EU programmes for rabies eradication, including oral vaccination campaigns, monitoring, surveillance and awareness activities, were implemented despite the COVID‐19 health crisis. The results shown for foxes, raccoon dogs/raccoons and jackals include data from monitoring and surveillance sampling strategies, with data aggregated at the country level. As monitoring sampling is conducted by collecting healthy animals to assess the efficacy of vaccination campaigns, the true surveillance data for these species (assessing the occurrence of the disease in suspect or symptomatic individuals) are considerably fewer than reported here (at least 67.2% of the fox data are from monitoring sampling). The cases still reported for several years in the few remaining MS with infections highlight the importance of a sustainable surveillance programme and awareness campaigns for the general public and professionals, to ensure the early detection of any potential rabies cases.
Regarding rabies surveillance in bats, the number of tests decreased in 2020. This is partly due to the withdrawal of the United Kingdom from the EU, and the United Kingdom not being considered in the 2020 EU statistics as compared to prior EU statistics. The United Kingdom analysed 347 bats in 2020 and 488 in 2019. The decrease observed is also related to a slightly lower number of tested bats in most reporting countries (e.g. 660 and 416 samples analysed in France, and 275 and 194 bats tested in Poland in 2019 and 2020, respectively), as well as a slight decrease in the number of MS reporting. Positive results obtained in the framework of bat surveillance (N = 31 cases) are in line with the previous years’ findings and confirm that European bats act as reservoirs for lyssaviruses other than rabies virus, reaffirming the public recommendation to handle bats with utmost caution, if at all. The public health hazard of bat lyssaviruses in Europe should not be underestimated.
In 2020, two cases of imported rabies in animals kept as pets (a dog in France and a sable in Ireland) were reported. Such imported cases might pose a threat of rabies reintroduction into rabies‐free areas. Two cats from France and Italy were also found to be infected with strains isolated on insectivorous bats (EBLV‐1 and WCBV), raising the risk of spillover transmission of these viruses from bats to non‐flying terrestrial mammals in Europe. More research studies are needed to investigate whether cats could actively transmit such viruses to a new host, and particularly for WCBV for which no immunising devices are available, as non‐flying mammals seem to act as dead‐end hosts for EBLVs.
As rabies is still endemic in EU‐bordering countries in areas not far from the borders, several MS are involved in collaborations with bordering non‐EU countries in the implementation of vaccination and testing schemes in buffer zones. The Global Framework for the Progressive Control of Transboundary Animal Diseases (GF‐TADs) created a new Standing Group of Experts on Rabies (SGE RAB) in 2019, and the second meeting was organised in 2020 with the goal of coordinating rabies control and surveillance activities, primarily in the Balkan sub‐region, where a case was detected in a dog in 2020.
Maintaining appropriate surveillance is of paramount importance for all MS, despite a context of disappearance of the virus from the EU territory (Cliquet et al., 2010; EFSA AHAW Panel, 2015; Robardet et al., 2019). Surveillance is the most challenging issue to achieve rabies elimination in the EU.
3.5. Related project and internet sources
| Subject | For more information see | |
|---|---|---|
| Humans | Global Alliance for Rabies Control | https://rabiesalliance.org/world‐rabies‐day |
| Rabies surveillance blueprint | http://rabiessurveillanceblueprint.org/?lang=en | |
| EU case definitions of rabies | https://www.ecdc.europa.eu/en/surveillance‐and‐disease‐data/eu‐case‐definitions | |
|
ECDC Surveillance Atlas of Infectious Diseases Disease Programme on Emerging, Food‐ and Vector‐Borne Diseases |
http://atlas.ecdc.europa.eu/public/index.aspx https://www.ecdc.europa.eu/en/about‐us/who‐we‐are/units/disease‐programmes‐unit |
|
| Emerging Viral Diseases‐Expert Laboratory Network (EVD‐LabNet) | https://ecdc.europa.eu/en/about‐us/partnerships‐and‐networks/disease‐and‐laboratory‐networks/evd‐labnet | |
| World Health Organisation – Rabies fact sheet | http://www.who.int/mediacentre/factsheets/fs099/en/ | |
| Animals | EURL Rabies | https://eurl‐rabies.anses.fr/ |
| Summary Presentations on the situation as regards Rabies veterinary programmes in MS | https://ec.europa.eu/food/animals/health/regulatory_committee/presentations_en | |
| General information on EU Food Chain Funding | https://ec.europa.eu/food/funding_en | |
| EU approved and co‐financed veterinary programmes for Rabies carried out by the MS | http://ec.europa.eu/dgs/health_food‐safety/funding/cff/animal_health/vet_progs_en.htm | |
| World Health Organisation Rabies Bulletin Europe | http://www.who‐rabies‐bulletin.org/ | |
| EFSA Scientific Opinion on a request from the Commission regarding an assessment of the risk of rabies introduction into the UK, Ireland, Sweden, Malta, as a consequence of abandoning the serological test measuring protective antibodies to rabies | https://www.efsa.europa.eu/en/efsajournal/pub/436 | |
| EFSA Scientific Opinion ‘Update on oral vaccination of foxes and raccoon dogs against rabies’ | https://www.efsa.europa.eu/fr/efsajournal/pub/4164 | |
| World Organisation for Animal health, Questions and Answers on Rabies | http://www.oie.int/fileadmin/Home/fr/Animal_Health_in_the_World/docs/pdf/Portail_Rage/QA_Rage_EN.pdf | |
| Annual national zoonoses country reports (reports of reporting countries on national trends and sources of zoonoses) | https://www.efsa.europa.eu/en/data‐report/biological‐hazards‐reports |
4. Q fever
Tables and figures that are not presented in this chapter are published as supporting information to this report and are available as downloadable files from the EFSA Knowledge Junction on Zenodo at https://doi.org/10.5281/zenodo.5682809. Summary statistics of human surveillance data with downloadable files are retrievable using ECDC’s Surveillance Atlas of Infectious Diseases at http://atlas.ecdc.europa.eu/public/index.aspx
4.1. Key facts
-
•
For 2020, EU MS reported 523 confirmed human cases of Q fever corresponding to an EU notification rate of 0.12 per 100,000 population. This is a decrease of 36.7% and 44.6% compared with the rate in 2019 (0.19 and 0.22 per 100,000 population) with and without the 2019 data from the United Kingdom, respectively.
-
•
In 2020, the seasonal pattern was different to previous years and human cases were largely distributed from winter to early autumn. Cases increased with age and were highest in the age group over 65 years.
-
•
From 2016 to 2020 there was a significantly declining trend of confirmed human cases of Q fever in the EU.
-
•
In animals, cattle and small ruminants were mostly sampled due to clinical investigations and passive monitoring of animals suspected to be infected with Coxiella burnetii. In the absence of harmonised reporting data in animals in the EU, the data reported to EFSA cannot be used to track or analyse spatial representativeness and trends over years for Q fever at the EU level or to compare differences among reporting countries.
-
•
In total, 15 MS (18 in 2019 including the United Kingdom) and six non‐MS including the United Kingdom (four in 2019) reported 2020 data for C. burnetii from cattle, sheep and goats and several other domestic and wild animal species. The overall proportion of test‐positive animals was 14.7% in sheep and goats (8.9% in 2019), 4.3% in cattle (5.3% in 2019) and 2.5% in other domestic and wild animals (1% in 2019). Herd‐scale analysis was added this year. The overall proportion of test‐positive herds was 4.1% in sheep and goats (6.6% in 2019) and 7.2% in cattle (9.9% in 2019).
-
•
Other species have sometimes been investigated, mostly farmed or exotic animals in captivity. Among them, only pigs and water buffalos tested positive.
4.2. Surveillance and monitoring of Coxiella burnetii in the EU
4.2.1. Humans
Q fever in humans is a mandatory notifiable disease at the EU level and cases are reported through TESSy. For 2020, 25 EU MS (Austria and Denmark did not report any data) provided data on Q fever in humans. The United Kingdom, considered a third country after its withdrawal from the EU, did not report data to ECDC. The EU case definition was used by 22 EU countries, whereas France, Germany and Italy used another case definition. Reporting is mandatory in 24 EU countries and voluntary in France. Disease surveillance is comprehensive 32 and generally passive except in Czechia, Portugal and Slovakia. Data reporting is case‐based except in Belgium and Bulgaria.
4.2.2. Animals
At the EU level, there is no harmonised monitoring system in place for Q fever in animals. The main animal categories tested are cattle, goats and sheep. Samples are mostly blood samples, samples from fetuses and stillborn animals, placentas, vaginal swabs from animals suspected of being infected with C. burnetii, as well as bulk milk samples for screening. In most MS, reporting was based on clinical investigation and passive monitoring. A few countries (Belgium, Bulgaria, Italy, the Netherlands, Poland, Sweden and Norway) implemented planned surveillance in cattle and small ruminants by regularly sampling and analysing samples, mainly using ELISA serology and more rarely PCR tests. Poland performed the most substantial sampling on the three animal categories and analysed the samples using PCR. Some countries in northern Europe (Belgium and the Netherlands) carried out regular tests on bulk tank milk (BTM) from dairy sheep and goats. Some countries reported very low numbers of tests, corresponding to local surveys or selective tests. In addition, samples were taken from other domestic and wild animal species on farms, in zoos or from natural habitats.
Because Q fever monitoring data reported by MS to EFSA are generated from non‐harmonised monitoring schemes across MS with no mandatory reporting requirements, the data can only be used for descriptive summaries and preclude additional data analyses such as tracking or assessing EU‐level temporal and spatial trends.
Since 1 February 2020, the United Kingdom has become a third country. Animal data from the United Kingdom were still collected by EFSA for 2020 as part of the Zoonoses Directive 2003/99/EC, but were excluded from the 2020 EU statistics.
4.3. Results
4.3.1. Overview of key statistics, EU, 2016–2020
Table 79 summarises EU‐level statistics on Q fever in humans and in major animal species, respectively, during 2016–2020. Animal data of interest were classified into the major categories and aggregated by year to obtain an annual overview of the volume of data submitted.
Table 79.
Summary of Coxiella burnetii statistics related to humans and the main animal categories, EU, 2016–2020
| 2020 | 2019(a) | 2018(a) | 2017(a) | 2016(a) | Data source | |
|---|---|---|---|---|---|---|
| Humans | ||||||
| Total number of confirmed cases | 523 | 951 | 790 | 884 | 975 | ECDC |
| Total number of confirmed cases/100,000 population (notification rates) | 0.12 | 0.19 | 0.16 | 0.18 | 0.19 | ECDC |
| Number of reporting EU MS | 25 | 27 | 27 | 27 | 27 | ECDC |
| Infection acquired in the EU | 347 | 810 | 629 | 720 | 713 | ECDC |
| Infection acquired outside the EU | 6 | 14 | 12 | 9 | 21 | ECDC |
| Unknown travel status or unknown country of infection | 170 | 127 | 149 | 155 | 241 | ECDC |
| Animals | ||||||
| Sheep and goats | ||||||
| Number of tested animals | 4,554 | 4,824 | 6,386 | 4,245 | 8,323 | EFSA |
| % positive animals | 14.6 | 11.2 | 11.0 | 9.2 | 11.6 | EFSA |
| Number of tested herds | 4,274 | 4,384 | 5,219 | 6,359 | 4,225 | EFSA |
| % positive herds | 4.0 | 6.6 | 2.8 | 5.4 | 4.0 | EFSA |
| Number of reporting MS | 13 | 15 | 15 | 12 | 16 | EFSA |
| Cattle | ||||||
| Number of tested animals | 9,366 | 13,701 | 23,461 | 16,272 | 18,496 | EFSA |
| % positive animals | 5.2 | 7.0 | 7.6 | 8.6 | 6.0 | EFSA |
| Number of tested herds | 3,883 | 4,267 | 3,677 | 1,885 | 1,310 | EFSA |
| % positive herds | 7.3 | 10.3 | 7.4 | 13.1 | 3.3 | EFSA |
| Number of reporting MS | 14 | 17 | 15 | 15 | 16 | EFSA |
ECDC: European Centre for Disease Prevention and Control; EFSA: European Food Safety Authority; MS: Member State.
(a): Since 1 February 2020, the United Kingdom became a third country. United Kingdom data are included for years 2016–2019, but not for 2020.
Humans
In 2020, the number of Q fever cases decreased compared with the previous 4 years and it was the lowest rate of EU‐acquired human C. burnetii infections compared with the past 4 years (2016–2019). This decrease might partly be due to the increasing proportion of cases with unknown travel status or unknown country of infection (32.5%) (Table 79). Six cases of C. burnetii infection (1.2%) were acquired outside the EU. Travel‐associated cases were reported in people who had travelled to Afghanistan, Angola, Bosnia and Herzegovina, Iraq or Namibia.
Animal categories
Animal data of interest were classified into the major categories and aggregated by year to obtain an annual overview of the volume of data submitted, as well as of the proportions of positive animals and herds, holdings or flocks (OIE, 2018).
In 2020, compared with year 2019, the number of (individual) animal samples submitted by EU MS remained stable for sheep and goats and decreased by 31.6% for cattle. Since 2016, the number of submitted samples from animals has been decreasing (N = 26,819 to N = 13,920), except for year 2018 when samples collected increased (N = 29,847) due to specific national surveillance programs (e.g. in Finland). The overall proportions of positive animal samples during 2016–2020 ranged from 9.2% to 14.6% for sheep and goats (14.6% in 2020) and from 5.2% to 8.6% (5.2% in 2020) in cattle.
In comparison with 2019, the number of samples collected from herds submitted by EU MS in 2020 remained stable for sheep and goats and decreased slightly for cattle (18.1%). The herd unit was tested more often for sheep and goats than for cattle. The overall proportions of positive herd samples ranged from 2.8% to 6.6% for sheep and goats (4.0% in 2020) and from 3.3% to 13.1% (7.3% in 2020) in cattle during 2016–2020.
4.3.2. Coxiella burnetii in humans
For 2020, 19 EU MS reported 523 confirmed cases of Q fever (Table 80). The highest numbers of cases were reported by Spain, Bulgaria, France and Germany with 170, 103, 96 and 55 confirmed cases, respectively. Six EU MS (Estonia, Finland, Italy, Lithuania, Malta and Poland) did not report any cases. In 2020, the overall EU notification rate was 0.12 per 100,000 population, a decrease compared with the previous 4 years. Bulgaria had the highest notification rate with 1.48 per 100,000 followed by Spain, Hungary and Luxembourg, with 0.36, 0.35 and 0.32 per 100,000 population, respectively. In 2020, the number of reported Q fever cases decreased compared with the 2016–2019 period, mainly due to a large decrease in human cases in Spain, France and Germany.
Table 80.
Reported human cases of Q fever and notification rates per 100,000 population in EU MS and non‐MS countries by country and by year, 2016–2020
| Country | 2020 | 2019 | 2018 | 2017 | 2016 | |||||||
|---|---|---|---|---|---|---|---|---|---|---|---|---|
| National coverage a | Data format a | Confirmed cases and rates | Confirmed cases and rates | Confirmed cases and rates | Confirmed cases and rates | Confirmed cases and rates | ||||||
| Cases | Rate | Cases | Rate | Cases | Rate | Cases | Rate | Cases | Rate | |||
| Austria b | – | – | – | – | – | – | – | – | – | – | – | – |
| Belgium | Y | A | 4 | 0.03 | 10 | 0.09 | 6 | 0.05 | 7 | 0.06 | 16 | 0.14 |
| Bulgaria | Y | A | 103 | 1.5 | 36 | 0.51 | 45 | 0.64 | 28 | 0.39 | 17 | 0.24 |
| Croatia | Y | C | 2 | 0.05 | 8 | 0.20 | 11 | 0.27 | 23 | 0.55 | 8 | 0.19 |
| Cyprus | Y | C | 1 | 0.11 | 1 | 0.11 | 0 | 0 | 3 | 0.35 | 2 | 0.24 |
| Czechia | Y | C | 1 | 0.01 | 1 | 0.01 | 1 | 0.01 | 0 | 0 | 2 | 0.02 |
| Denmark | – | – | – | – | – | – | – | – | – | – | – | – |
| Estonia | Y | C | 0 | 0 | 0 | 0 | 0 | 0 | 0 | 0 | 0 | 0 |
| Finland | Y | C | 0 | 0 | 2 | 0.04 | 2 | 0.04 | 4 | 0.07 | 2 | 0.04 |
| France | Y | C | 96 | 0.14 | 156 | 0.23 | 172 | 0.26 | 194 | 0.29 | 251 | 0.38 |
| Germany | Y | C | 55 | 0.07 | 148 | 0.18 | 91 | 0.11 | 107 | 0.13 | 270 | 0.33 |
| Greece | Y | C | 4 | 0.04 | 14 | 0.13 | 13 | 0.12 | 4 | 0.04 | 9 | 0.08 |
| Hungary | Y | C | 34 | 0.35 | 47 | 0.48 | 28 | 0.29 | 29 | 0.30 | 39 | 0.40 |
| Ireland | Y | C | 2 | 0.04 | 2 | 0.04 | 0 | 0 | 2 | 0.04 | 6 | 0.13 |
| Italy | Y | C | 0 | 0 | 6 | 0.01 | 1 | < 0.01 | 7 | 0.01 | 3 | < 0.01 |
| Latvia | Y | C | 1 | 0.05 | 0 | 0 | 0 | 0 | 0 | 0 | 0 | 0 |
| Lithuania | Y | C | 0 | 0 | 0 | 0 | 0 | 0 | 0 | 0 | 0 | 0 |
| Luxembourg | Y | C | 2 | 0.32 | 0 | 0 | 0 | 0 | 0 | 0 | 0 | 0 |
| Malta | Y | C | 0 | 0 | 1 | 0.20 | 2 | 0.42 | 0 | 0 | 0 | 0 |
| Netherlands | Y | C | 7 | 0.04 | 16 | 0.09 | 18 | 0.10 | 22 | 0.13 | 14 | 0.08 |
| Poland | Y | C | 0 | 0 | 4 | 0.01 | 0 | 0 | 0 | 0 | 0 | 0 |
| Portugal | Y | C | 22 | 0.21 | 32 | 0.31 | 36 | 0.35 | 48 | 0.47 | 17 | 0.16 |
| Romania | Y | C | 12 | 0.06 | 109 | 0.56 | 22 | 0.11 | 46 | 0.23 | 32 | 0.16 |
| Slovakia | Y | C | 5 | 0.09 | 1 | 0.02 | 2 | 0.04 | 0 | 0 | 0 | 0 |
| Slovenia | Y | C | 1 | 0.05 | 6 | 0.29 | 1 | 0.05 | 3 | 0.15 | 1 | 0.05 |
| Spain | Y | C | 170 | 0.36 | 332 | 0.71 | 313 | 0.67 | 333 | 0.72 | 249 | 0.54 |
| Sweden | Y | C | 1 | 0.01 | 10 | 0.10 | 7 | 0.07 | 3 | 0.03 | 3 | 0.03 |
| EU Total 27 | – | – | 523 | 0.12 | 942 | 0.22 | 771 | 0.18 | 863 | 0.20 | 941 | 0.22 |
| United Kingdom | – | – | – | – | 9 | 0.01 | 19 | 0.03 | 21 | 0.03 | 34 | 0.05 |
| EU Total c | – | – | 523 | 0.12 | 951 | 0.19 | 790 | 0.16 | 884 | 0.18 | 975 | 0.19 |
| Iceland | Y | C | 0 | 0 | 0 | 0 | 0 | 0 | 0 | 0 | 0 | 0 |
| Norway | Y | C | 5 | 0.09 | 8 | 0.15 | 5 | 0.09 | 4 | 0.08 | 2 | 0.04 |
| Switzerland d | Y | C | 51 | 0.59 | 101 | 1.2 | 52 | 0.61 | 42 | 0.50 | 47 | 0.56 |
–: Data not reported.
Y: yes; N: no; A: aggregated data; C: case‐based data.
Not notifiable, no surveillance system exists.
When 2016–2019 data were collected, the United Kingdom was an EU MS, but since 1 February 2020 it has become a third country. Data from the United Kingdom are taken into account for years 2016–2019, whereas for 2020, the United Kingdom did not report any data.
Switzerland provided data directly to EFSA. The human data for Switzerland include data from Liechtenstein.
EU MS reported five deaths due to Q fever for 2020 (two cases in Spain, two in Hungary and one in Portugal), resulting in an EU case fatality of 2.13% among the 235 confirmed cases with reported outcome.
In 2020, cases occurred year‐round. The number of cases by month was lower than during the 2016–2019 period (Figure 66). In 2020, unlike the seasonality (spring and summer months) reported over the previous 4 years, most cases occurred from January to October 2020. In 2020, there was a statistically significant decrease in confirmed Q fever cases over the past 5 years (2016–2020), and this decrease was particularly notable (p < 0.01) in Germany and France. The rate of confirmed human Q fever cases was higher among men than women with a male‐to‐female ratio of 2.6:1. Notification rates in men and women increased with age with a drop between 61 and 64 years.
Figure 66.

- Source: Data from Cyprus, Czechia, Estonia, Finland, France, Germany, Greece, Hungary, Ireland, Latvia, Lithuania, Malta, the Netherlands, Poland, Portugal, Romania, Slovakia, Slovenia and Sweden. Austria, Belgium, Bulgaria, Croatia, Denmark, Italy, Luxembourg and Spain did not report data at the level of detail required for the analysis.
4.3.3. Coxiella burnetii in animals
Sheep and goats: 13 MS and four non‐MS (Switzerland, North Macedonia, Serbia and the United Kingdom) provided data for sheep and goats for 2020. In total, 4,274 herds and 4,554 animals were tested, of which, respectively, 4.0% and 14.6% tested positive for C. burnetii. Samples at the animal level were mainly taken in Italy (N = 2,017, 23.6% positive), the Netherlands (N = 1,181, 0.0% positive) and Bulgaria (N = 910; 16.8% positive). Poland tested 82.2% of the herds reported (0% positive), and Italy and Belgium tested, respectively, 9.3% (34.2% positive) and 7.8% (5.7% positive) of the herds reported. In 2020, Norway did not report any tests on sheep and goats, whereas 2,282 tests (0.0% positive) on animals had been reported in 2019.
Cattle: 14 MS and five non‐MS (Switzerland, Iceland, North Macedonia, Norway and the United Kingdom) provided data for cattle for 2020. In total, 3,883 herds and 9,366 animals were tested, of which, respectively, 7.3% and 5.2% tested positive. Belgium, Poland and Italy tested, respectively, 50.2%, 37.4% and 10.3% of herds; Italy (35.1%), Switzerland (24.0%), Austria (11.9%) and Slovakia (11.3%) accounted for 82.3% of the tested animals. In comparison with 2019, Czechia did not report any tests in cattle in 2020 (N = 3,721 in 2019) and Norway reported much fewer tests (N = 2,243 in 2019 and only 134 in 2020).
Other animal species: Four MS and two non‐MS (Switzerland and Norway) reported data on animals other than sheep, goats and cattle. In total, 357 animals and 26 herds were tested from various domestic and wild animal species, such as other ruminant species (e.g. alpaca, water buffalo, camel, chamois, deer, llama, steenbok), pets (cats and dogs) or diverse other species (e.g. horse, rabbit, donkey, pig, wolf, birds, dolphin, otter) and unspecified farmed and zoo animals. Only 25 out of 357 tested animals were wild. Animal results were mainly submitted by Italy (N = 331; 14 different animal species), Switzerland (N = 11; pigs, llamas, steenboks and zoo animals) and Austria (N = 7 alpacas, deer and pigs). Among all species tested, only pigs and water buffalos (farmed animals) were reported positive. Italy reported 2.4% of positive tested water buffalos (N = 247 animals). For pigs, Italy, Austria and Switzerland reported in total eight tested animals (37.5% positive) and five tested herds (20%).
4.4. Discussion
C. burnetii is the aetiological agent of the Q fever disease and, if aerosolised, is also considered a potential biological weapon for bioterrorism. Humans can acquire the infection mainly through environmental contamination due to bacterial shedding of infected animals, but also through tick‐borne or foodborne transmissions. In Europe, the majority of clinical cases are sporadic. However, several outbreaks among humans have been reported. Up to 2016, France and Germany reported most of the confirmed cases; since 2017, Spain has reported the highest number of cases annually. The increase in the number of human cases reported by Spain is most likely explained by a change in their reporting system from voluntary to mandatory.
The lowest number of human Q fever cases in the EU was recorded in 2020, with a statistically significant (p < 0.01) decrease over the last 5 years (2016–2020). A decrease was also observed in France, Germany and Spain possibly due to the impact of the COVID‐19 pandemic. However, Spain accounted for about one third of the overall number of cases and Bulgaria saw an increase in Q fever disease in humans compared with previous years. This increase was mainly driven by four outbreaks of Q fever recorded in Gabrovo and in Shumen, two defined zones within the country. Cases were linked to occupational exposure and patients were veterinarians and staff from two cow farms and one sheep farm (ProMED‐mail, 2020a,b). In 2017, in addition to sporadic Q fever cases, two outbreaks were reported from Bulgaria in the Gabrovo and Blagoevgrad regions (Genova‐Kalou et al., 2019).
Overall, case fatality increased between 2016 and 2020 from 0.39% to 2.13% with a drop (0.63%) in 2019. In 2020, the withdrawal of the United Kingdom from the EU did not affect the human data on Q fever, because very few cases were ascribed to the United Kingdom during the 2016–2019 period. Regarding the impact of the COVID‐19 pandemic on Q fever surveillance and reporting, all MS estimated a marginal influence with a comparability level of data generally expected as medium to high. However, the possibility that some cases may not have been detected cannot be excluded.
The results obtained from animals — mainly from small ruminants and cattle — are insufficient for tracking or analysing trends for Q fever at the EU level. The results submitted are not directly comparable, mainly due to differences in sampling strategy (testing methods, coverage of the monitoring, case definitions), completeness of the data and sensitivity of the surveillance method. The deployment of mandatory reporting from 2021 (Q fever in category E in the new EU animal health law) is the first step in improving data quality in each MS. Data based on criteria harmonised among countries will thus be crucial for an understanding of the Q fever situation in animals in the EU, and especially the risk factors that may operate at a local scale (Georgiev et al., 2013). In the light of results from non‐ruminants, a broad range of species has been identified as reservoirs for C. burnetii, including mammals, birds and arthropods (ticks). Caution should be taken to distinguish between C. burnetii and other Coxiella species (especially avirulent Coxiella‐like strains). In coming years, it is also of utmost importance to collect more data on the persistence of environmental contamination (Carrié et al., 2019). The major challenge is to reduce human exposure to this zoonosis through a preventive ‘one health’ approach.
4.5. Related projects and Internet sources
| Subject | For more information see | |
|---|---|---|
| Humans | ECDC Surveillance Atlas of Infectious Diseases | https://atlas.ecdc.europa.eu/public/index.aspx |
| EURL Q fever | https://www.anses.fr/fr/content/laboratoire‐de‐sophia‐antipolis | |
| EU case definition of Q fever | https://www.ecdc.europa.eu/en/surveillance‐and‐disease‐data/eu‐case‐definitions | |
| Disease Programme on Emerging, Food‐ and Vector‐Borne Diseases | https://www.ecdc.europa.eu/en/about‐us/who‐we‐are/units/disease‐programmes‐unit | |
| Animals | World Organisation for Animal Health, Summary of Information on Q Fever | https://www.oie.int/en/disease/q‐fever/ |
| OIE Manual of Diagnostic Tests and Vaccines for Terrestrial Animals: chapter on Q fever, 2018 | https://www.oie.int/en/what‐we‐do/standards/codes‐and‐manuals/terrestrial‐manual‐online‐access/ | |
| EFSA: Scientific Opinion on Q Fever | http://onlinelibrary.wiley.com/doi/10.2903/j.efsa.2010.1595/full | |
|
Annual national zoonoses country reports (reports of reporting countries on national trends and sources of zoonoses) DISCONTOOLS: gaps in Q fever knowledge and tools |
https://www.efsa.europa.eu/en/data‐report/biological‐hazards‐reports |
5. West Nile virus
Tables and figures that are not presented in this chapter are published as supporting information to this report and are available as downloadable files from the EFSA Knowledge Junction on Zenodo at https://doi.org/10.5281/zenodo.5682809. Summary statistics of human surveillance data with downloadable files are retrievable using the ECDC’s Surveillance Atlas of Infectious Diseases at http://atlas.ecdc.europa.eu/public/index.aspx
5.1. Key facts
-
•
In 2020, the number of locally acquired probable and confirmed human cases of West Nile virus infection was 322, corresponding to an EU notification rate of 0.07 per 100,000 population. This is a decrease of 12.9% and 24.4% compared with the rate in 2019 (0.08 and 0.10 per 100,000 population, with and without 2019 data from the United Kingdom, respectively).
-
•
Most locally acquired human infections were reported by Greece, Spain and Italy, accounting, respectively, for 44.7%, 23.9% and 21.4% of the total number of reported probable/confirmed infections in the EU. In 2020, Spain reported an unprecedented increase in WNV infections.
-
•
Excluding the epidemic year of 2018, there was no statistically significant (p = 0.07) increase or decrease of reported WNV infections over the last 5 years (2016–2020) in the EU. At national level, Spain has reported a significantly (p = 0.04) increasing trend in the past 5 years (2016–2020). Aside from an epidemic peak observed in 2018, when the EU notification rate of confirmed and probable human WNV infections per 100,000 population reached 0.31, the yearly EU notification rate for the period 2016–2020 ranged from 0.05 in 2017 to 0.08 in 2019. In 2020, 325 confirmed/probable human WNV infections were reported. Of those, 323 were acquired in the EU (322 locally acquired and one imported from another EU country).
-
•
In 2020, 15 MS submitted WNV monitoring and surveillance data from birds and equids to EFSA. Italy and Spain submitted, respectively, 48.8% and 25.3% of these data for birds, while Germany, Greece and Spain submitted most of the data for equids, at 33.7%, 15.8% and 28.3%, respectively.
-
•
Ten MS reported 191 WNV outbreaks in birds (two) and equids (189) to the ADNS. Bulgaria reported two outbreaks in birds. Italy, Germany and Spain reported the highest number of outbreaks in equids among MS, accounting for 8.5%, 12% and 74% of the total number of outbreaks, respectively.
-
•
ADNS outbreak data and surveillance data submitted to EFSA for 2020 indicated WNV circulation in countries in central and eastern Europe (Austria, Hungary, Germany and Bulgaria) and in the Mediterranean basin (Greece, Italy, France and Spain). WNV infections of humans and equids now regularly occur in those countries.
5.2. WNV ecology and epidemiology
The number of EU countries reporting locally acquired WNV infections in humans and cases of infection in birds/equids has increased in recent years. In 2020, the Netherlands reported locally acquired human WNV infections and outbreaks among birds. It also detected WNV in mosquito pools for the first time.
West Nile fever, also known as ‘West Nile virus disease’, is an arboviral disease caused by the West Nile virus (WNV). WNV lineages one and two are associated with human and equine diseases.
This virus is transmitted primarily through the bite of infected mosquitoes, mainly of the Culex genus (Hubálek and Halouzka, 1999), but also occasionally through transfusion/transplantation of substances of human origin (SoHO) (i.e. blood, organs or cells), percutaneous or conjunctival exposure in laboratories or transplacental passage from mother to fetus. Mosquitoes serve as vectors and birds are the main amplifying hosts.
The transmission period typically extends from early or mid‐summer to the end of October, when mosquitoes are most active and more abundant. The mosquitoes in which the WNV replicates acquire the infection by feeding on viraemic birds. WNV is maintained in an enzootic bird–mosquito cycle, but the virus can be transmitted through mosquito bites to dead‐end hosts such as humans or equids, which cannot, in turn transmit the virus to other vectors. Thus, both human cases and outbreaks in animals typically occur in areas that are likely to harbour competent mosquito vectors.
Most humans and equids infected with WNV remain asymptomatic and about 20% develop influenza‐like symptoms and signs. However, a small proportion (less than 1% of humans, and less than 10% of equids) develop severe signs such as encephalitis, meningoencephalitis or meningitis. Elderly and immunocompromised individuals are at higher risk of developing severe symptoms (Young et al., 2021).
For the purposes of this report, the following definitions of human disease are used: West Nile fever (WNF) clinical illness without neurological symptoms, West Nile neuro‐invasive disease (WNND) and ‘other WNV infections’ including asymptomatic infections (e.g. among blood donors).
From a veterinary standpoint, WNV is the causative agent of West Nile Fever (WNF), a disease that develops in asymptomatic forms, benign forms (flu‐like syndrome) and neuro‐invasive forms (OIE, 2018).
5.3. Surveillance and monitoring of West Nile virus in the EU
The main objective of timely WNV surveillance at EU level is to provide early warning to public health professionals of areas with human WNV infections, and thereby to prevent human‐to‐human transmission through the donation of contaminated SoHO. WNV infections have been notifiable at European Union (EU) level since 2008, but only became notifiable within some EU countries at a later date (Young et al., 2021).
WNV surveillance in several countries is multidisciplinary, involving human, equine, bird and entomological components. In Europe, surveillance design is mostly passive for both horses and humans and for equids based on the surveillance of neuro‐invasive cases (Gossner et al., 2017). Nevertheless, some European countries implement active surveillance of equids and/or birds and/or mosquitoes (Riccardo et al., 2020; García San Miguel Rodríguez‐Alarcón et al., 2021; Scaramozzino et al., 2021).
5.3.1. Humans
Data on human WNV infections are collected through two complementary data collection processes. During the period where mosquitoes are most abundant and active (June–November), countries report human infections to the ECDC through TESSy on a weekly basis. Alongside this seasonal data collection, annual data collection is also carried out. Countries that detected no infections during the year are asked to report ‘zero cases’; all other countries are encouraged to report complementary data on detected infections, if considered relevant.
On 1 February 2020, the United Kingdom became a third country. Human data from the United Kingdom were not collected by the ECDC for 2020.
In 2020, 26 of 27 EU MS (Denmark did not report) reported information on WNV infections in humans to TESSy. The EU case definition was used by 24 of these 26 countries, all of which had a comprehensive surveillance system. France used a different case definition and Germany did not specify which case definition was used or the type of surveillance system adopted. Reporting is compulsory in 24 EU MS. In France, surveillance is voluntary, but this is not specified for Germany. Surveillance is passive among EU MS, except in Czechia, Greece, Portugal and Slovakia (not specified for Germany). All countries have case‐based reporting. Additional information on surveillance systems, also including non‐EU MS, is available in Table 82.
Table 82.
Locally acquired human WNV infections and notification rates per 100,000 population in EU MS and non‐MS countries, by country per year, 2016–2020
| Country | 2020 | 2019 | 2018 | 2017 | 2016 | ||||||||
|---|---|---|---|---|---|---|---|---|---|---|---|---|---|
| National coverage a | Data format a | Confirmed cases | Total cases* and rates | Total cases* and rates | Total cases* and rates | Total cases* and rates | Total cases* and rates | ||||||
| Cases | Rate | Cases | Rate | Cases | Rate | Cases | Rate | Cases | Rate | ||||
| Austria | Y | C | 0 | 0 | 0 | 4 | 0.05 | 21 | 0.24 | 6 | 0.07 | 5 | 0.06 |
| Belgium | Y | C | 0 | 0 | 0 | 0 | 0 | 0 | 0 | 0 | 0 | 0 | 0 |
| Bulgaria | Y | C | 1 | 1 | 0.01 | 5 | 0.07 | 15 | 0.21 | 1 | 0.01 | 2 | 0.03 |
| Croatia | Y | C | 0 | 0 | 0 | 0 | 0 | 58 | 1.4 | 5 | 0.12 | 2 | 0.05 |
| Cyprus | Y | C | 0 | 0 | 0 | 23 | 2.6 | 1 | 0.12 | 0 | 0 | 1 | 0.12 |
| Czechia | Y | C | 0 | 0 | 0 | 1 | 0.01 | 5 | 0.05 | 0 | 0 | 0 | 0 |
| Denmark b | – | – | – | – | – | – | – | – | – | – | – | – | – |
| Estonia | Y | C | 0 | 0 | 0 | 0 | 0 | 0 | 0 | 0 | 0 | 0 | 0 |
| Finland | Y | C | 0 | 0 | 0 | 0 | 0 | 0 | 0 | 0 | 0 | 0 | 0 |
| France | Y | C | 0 | 0 | 0 | 2 | < 0.01 | 27 | 0.04 | 2 | < 0.01 | 0 | 0 |
| Germany | Y | C | 14 | 14 | 0.02 | 5 | 0.01 | 1 | < 0.01 | – | – | – | – |
| Greece | Y | C | 67 | 144 | 1.3 | 227 | 2.1 | 315 | 2.9 | 48 | 0.45 | 0 | 0 |
| Hungary | Y | C | 1 | 3 | 0.03 | 36 | 0.37 | 215 | 2.2 | 20 | 0.20 | 44 | 0.45 |
| Ireland | Y | C | 0 | 0 | 0 | 0 | 0 | 0 | 0 | 0 | 0 | 0 | 0 |
| Italy | Y | C | 69 | 69 | 0.12 | 54 | 0.09 | 610 | 1.0 | 53 | 0.09 | 76 | 0.13 |
| Latvia | Y | C | 0 | 0 | 0 | 0 | 0 | 0 | 0 | 0 | 0 | 0 | 0 |
| Lithuania | Y | C | 0 | 0 | 0 | 0 | 0 | 0 | 0 | 0 | 0 | 0 | 0 |
| Luxembourg | Y | C | 0 | 0 | 0 | 0 | 0 | 0 | 0 | 0 | 0 | 0 | 0 |
| Malta | Y | C | 0 | 0 | 0 | 0 | 0 | 0 | 0 | 0 | 0 | 0 | 0 |
| Netherlands | Y | C | 8 | 8 | 0.05 | 0 | 0 | 0 | 0 | 0 | 0 | 0 | 0 |
| Poland | Y | C | 0 | 0 | 0 | 0 | 0 | 0 | 0 | 0 | 0 | 0 | 0 |
| Portugal | Y | C | 0 | 0 | 0 | 0 | 0 | 0 | 0 | 0 | 0 | 0 | 0 |
| Romania | Y | C | 3 | 6 | 0.03 | 67 | 0.35 | 277 | 1.4 | 66 | 0.34 | 93 | 0.47 |
| Slovakia | Y | C | 0 | 0 | 0 | 1 | 0.02 | 0 | 0 | 0 | 0 | 0 | 0 |
| Slovenia | Y | C | 0 | 0 | 0 | 0 | 0 | 4 | 0.19 | 0 | 0 | 0 | 0 |
| Spain | Y | C | 40 | 77 | 0.16 | 0 | 0 | 0 | 0 | 0 | 0 | 3 | 0.01 |
| Sweden | Y | C | 0 | 0 | 0 | 0 | 0 | 0 | 0 | 0 | 0 | 0 | 0 |
| EU Total 27 | – | – | 203 | 322 | 0.07 | 425 | 0.10 | 1,549 | 0.35 | 201 | 0.06 | 226 | 0.06 |
| United Kingdom | – | – | – | 0 | – | 0 | 0 | 0 | 0 | 0 | 0 | 0 | 0 |
| EU Total c | – | – | 203 | 322 | 0.07 | 425 | 0.08 | 1,549 | 0.31 | 201 | 0.05 | 226 | 0.05 |
| Iceland | Y | C | 0 | 0 | 0 | 0 | 0 | 0 | 0 | 0 | 0 | – | – |
| Norway | Y | C | 0 | 0 | 0 | 0 | 0 | 0 | 0 | 0 | 0 | 0 | 0 |
| Switzerland d | Y | C | 1 | 1 | 0.01 | 1 | 0.01 | 0 | 0 | 0 | 0 | 0 | 0 |
–: Data not reported.
Y: yes; N: no; A: aggregated data; C: case‐based data.
Not notifiable, no surveillance system exists.
Cases reported by the United Kingdom for the years 2016–2019 were also considered for this estimate (EU‐28). When 2016–2019 UK data were collected, the UK was an EU MS, but on 1 February 2020, it became a third country.
Switzerland provided data directly to EFSA. The human data for Switzerland include data from Liechtenstein.
Cases reported include both confirmed and probable cases of WNV human infection.
5.3.2. Animals
Concerning West Nile fever (WNF) in animals, two sources of information are used to complete this report: data from the annual surveillance and monitoring activities submitted to EFSA and data from the outbreaks notified to the ADNS.
In compliance with Directive 2003/99/EC 33 , WNV infections in animals are not included in the zoonoses listed in Annex I, Part A of the Directive, requiring mandatory monitoring and surveillance as well as reporting. Nevertheless, WNV is listed in Annex I, Part B (viruses transmitted by arthropods) as a virus to be monitored, if warranted by the epidemiological situation in an MS, in compliance with Article 4.1 of the same Directive. EFSA receives annual WNV monitoring data from MS experiencing regular or recent WNV outbreaks (in animals or humans), or that are at high risk and that have therefore put in place a surveillance system for early detection of the disease in animals. Alongside EU MS, Switzerland and the United Kingdom submit reports on animal surveillance and monitoring activities to EFSA. Owing to the different study designs and the variety of analytical methods used, the WNV data reported by different countries are not directly comparable. These data provide the basis for descriptive summaries at EU level (Tables 81 and 84). Nonetheless, according to Council Directive 82/894/EEC 34 , it is mandatory for MS to notify outbreaks 35 of WNF equine encephalomyelitis to the EU ADNS.21 Every week, each officially confirmed outbreak should be notified by the Veterinary Authority of the MS concerned, to all other countries connected to the ADNS application. Report summaries and annual reports on disease outbreaks are available online on the ADNS webpage. Moreover, data on animal WNF outbreaks reported to the World Organisation for Animal Health (OIE) are publicly available on the World Animal Health Information System Database (WAHIS interface).
Several countries, including Italy and Spain, have put in place active surveillance for equids and birds, while other countries (Greece, Czechia and Slovakia) have active surveillance for equids alone. Other EU members (e.g. France and Slovenia) rely entirely on passive surveillance.
On 1 February 2020, the United Kingdom became a third country. Animal data from the United Kingdom were still collected by EFSA for 2020 as part of the Zoonoses Directive 2003/99/EC but are excluded from EU statistics.
5.4. Results
5.4.1. Overview of key statistics, EU, 2016–2020
Table 81.
Summary of WNV infection statistics related to humans, birds and equids, in the EU, 2016–2020
| 2020 | 2019 a | 2018 a | 2017 a | 2016 a | Data source | |
|---|---|---|---|---|---|---|
| Humans | ||||||
| Total number of confirmed and probable cases | 325 | 443 | 1,615 | 208 | 240 | ECDC |
| Total number of confirmed and probable cases/100,000 population (notification rates) | 0.07 | 0.08 | 0.31 | 0.05 | 0.06 | ECDC |
| Number of reporting MS | 26 | 27 | 27 | 26 | 26 | ECDC |
| Infection acquired in the EU | 323 | 435 | 1,573 | 205 | 228 | ECDC |
| Infection acquired outside the EU | 2 | 5 | 29 | 2 | 3 | ECDC |
| Unknown travel status or unknown country of infection | 0 | 3 | 13 | 1 | 9 | ECDC |
| Animals | ||||||
| Birds | ||||||
| Number of animals tested | 13,924 | 14,932 | 14,216 | 11,531 | 8,258 | EFSA |
| Number of positive animals in PCR methods | 165 | 104 | 425 | 93 | 75 | EFSA |
| Number of MS having reported surveillance/monitoring data to EFSA | 12 | 13 | 11 | 8 | 4 | EFSA |
| Number of outbreaks notified to the ADNS | 2 | 53 | 22 | 0 | 0 | ADNS |
| Number of MS having notified outbreaks to the ADNS | 1 | 2 | 6 | 0 | 0 | ADNS |
| Equids | ||||||
| Number of animals tested | 6,749 | 5,563 | 13,785 | 11,670 | 9,949 | EFSA |
| Number of positive animals in PCR methods | 1 | 4 | 7 | 1 | 2 | EFSA |
| Number of animals positive for IgM by ELISA | 209 | 74 | 393 | 110 | 192 | EFSA |
| Number of MS having reported surveillance/monitoring data to EFSA | 14 | 14 | 12 | 12 | 10 | EFSA |
| Number of outbreaks notified to the ADNS | 189 | 100 | 292 | 84 | 173 | ADNS |
| Number of MS having notified outbreaks to the ADNS | 9 | 8 | 10 | 7 | 5 | ADNS |
ADNS: Animal Disease Notification System; ECDC: European Centre for Disease Prevention and Control; EFSA: European Food Safety Authority; ELISA: enzyme‐linked immunosorbent assay; MS: Member State; PCR: polymerase chain reaction.
When UK data were collected for the period 2016–2019, the UK was an EU MS, but on 1 February 2020, it became a third country. Data from the UK are taken into account for the years 2016–2019 but are not considered in the EU overview for 2020.
5.4.2. West Nile virus infections in humans
In 2020, 325 WNV infections in humans (including 206 confirmed cases) were reported. Of these, 323 were acquired in the EU (including 204 confirmed cases). Of the 323 cases acquired in the EU, 322 were locally acquired and one was imported from another EU country. The EU notification rate per 100,000 population in 2020 was 0.07, a slight decrease compared with 2019 (Table 81). Of the 322 cases of probable/confirmed infection that were locally acquired in 2020 (males 215, 67%), over 80% of cases occurred in people aged 50 or older. Travel‐associated WNV infection outside the EU was reported for two cases. Both had travelled in India.
Six EU MS reporting locally acquired infections provided data on the hospitalisation status of their cases. Of the cases with known hospitalisation status (239 cases, 74% of total infections) in 2020, 92% (N = 219) were hospitalised.
Of the infections with known clinical manifestations (98% of total infections), 79% (N = 252) of infections were neuro‐invasive and 6% (N = 19) were asymptomatic, this compares with 67% (N = 282) neuro‐invasive and 2% (N = 8) asymptomatic infections in 2019. The remaining 46 cases (15%) were cases with non‐neurological symptoms.
Data on the outcome of infections were provided by six EU MS. For 2020, 39 deaths among cases with WNV infections were reported, compared with 52 in 2019. The case fatality rate in 2020 was 12% (12% in 2019) among all locally acquired WNV infections and 15% (18% in 2019) among locally acquired WNV infections with West Nile neuro‐invasive disease (WNND).
Eight EU MS (Bulgaria, Germany, Greece, Hungary, Italy, the Netherlands, Romania and Spain) reported at least one locally acquired human case of WNV infection in 2020. Most locally acquired infections were reported by Greece, Spain and Italy, accounting, respectively, for 44.7%, 23.9% and 21.4% of the total number of probable/confirmed cases in the EU. In 2020, the Netherlands reported locally acquired human WNV infections for the first time, while Spain reported an unprecedented increase in locally acquired infections (García San Miguel Rodríguez‐Alarcón et al., 2021) (Table 82).
Locally acquired cases of West Nile neuro‐invasive disease (WNND) characterised by neurological syndromes such as encephalitis, meningoencephalitis or meningitis were reported in eight EU MS (Table 83). In 2020, WNND reporting rates in EU MS remained stable or fell compared with 2019, except in Italy and Spain in which an increase was observed (46 cases reported in Italy and 72 in Spain). The increase was greater in Spain, where cases were reported for the first time since 2016.
Table 83.
Locally acquired human WNND notification rates per 100,000 population in EU MS and non‐MS countries, by country per year, 2016–2020
| Country | 2020 | 2019 | 2018 | 2017 | 2016 | ||||||||
|---|---|---|---|---|---|---|---|---|---|---|---|---|---|
| National coverage a | Data format a | Confirmed cases | Total cases* and rates | Total cases* and rates | Total cases* and rates | Total cases* and rates | Total cases* and rates | ||||||
| Cases | Rate | Cases | Rate | Cases | Rate | Cases | Rate | Cases | Rate | ||||
| Austria | Y | C | 0 | 0 | 0 | 1 | 0.01 | 4 | 0.05 | 2 | 0.02 | 1 | 0.01 |
| Belgium | Y | C | 0 | 0 | 0 | 0 | 0 | 0 | 0 | 0 | 0 | 0 | 0 |
| Bulgaria | Y | C | 1 | 1 | 0.01 | 4 | 0.06 | 13 | 0.18 | 1 | 0.01 | 1 | 0.01 |
| Croatia | Y | C | 0 | 0 | 0 | 0 | 0 | 47 | 1.1 | 5 | 0.12 | 2 | 0.05 |
| Cyprus | Y | C | 0 | 0 | 0 | 20 | 2.3 | 1 | 0.12 | 0 | 0 | 1 | 0.12 |
| Czechia | Y | C | 0 | 0 | 0 | 1 | 0.01 | 3 | 0.03 | 0 | 0 | 0 | 0 |
| Denmark b | – | – | – | – | – | – | – | – | – | – | – | – | – |
| Estonia | Y | C | 0 | 0 | 0 | 0 | 0 | 0 | 0 | 0 | 0 | 0 | 0 |
| Finland | Y | C | 0 | 0 | 0 | 0 | 0 | 0 | 0 | 0 | 0 | 0 | 0 |
| France | Y | C | 0 | 0 | 0 | 1 | < 0.01 | 7 | 0.01 | 0 | 0 | 0 | 0 |
| Germany | Y | C | 4 | 4 | < 0.01 | 3 | < 0.01 | 0 | 0 | – | – | – | – |
| Greece | Y | C | 59 | 116 | 1.1 | 140 | 1.3 | 241 | 2.2 | 28 | 0.26 | 0 | 0 |
| Hungary | Y | C | 1 | 1 | 0.01 | 23 | 0.24 | 152 | 1.6 | 17 | 0.17 | 33 | 0.34 |
| Ireland | Y | C | 0 | 0 | 0 | 0 | 0 | 0 | 0 | 0 | 0 | 0 | 0 |
| Italy | Y | C | 46 | 46 | 0.08 | 24 | 0.04 | 243 | 0.40 | 26 | 0.04 | 39 | 0.06 |
| Latvia | Y | C | 0 | 0 | 0 | 0 | 0 | 0 | 0 | 0 | 0 | 0 | 0 |
| Lithuania | Y | C | 0 | 0 | 0 | 0 | 0 | 0 | 0 | 0 | 0 | 0 | 0 |
| Luxembourg | Y | C | 0 | 0 | 0 | 0 | 0 | 0 | 0 | 0 | 0 | 0 | 0 |
| Malta | Y | C | 0 | 0 | 0 | 0 | 0 | 0 | 0 | 0 | 0 | 0 | 0 |
| Netherlands | Y | C | 6 | 6 | 0.03 | 0 | 0 | 0 | 0 | 0 | 0 | 0 | 0 |
| Poland | Y | C | 0 | 0 | 0 | 0 | 0 | 0 | 0 | 0 | 0 | 0 | 0 |
| Portugal | Y | C | 0 | 0 | 0 | 0 | 0 | 0 | 0 | 0 | 0 | 0 | 0 |
| Romania | Y | C | 3 | 6 | 0.03 | 65 | 0.33 | 277 | 1.4 | 66 | 0.34 | 93 | 0.47 |
| Slovakia | Y | C | 0 | 0 | 0 | 0 | 0 | 0 | 0 | 0 | 0 | 0 | 0 |
| Slovenia | Y | C | 0 | 0 | 0 | 0 | 0 | 4 | 0.19 | 0 | 0 | 0 | 0 |
| Spain | Y | C | 40 | 72 | 0.15 | 0 | 0 | 0 | 0 | 0 | 0 | 2 | < 0.01 |
| Sweden | Y | C | 0 | 0 | 0 | 0 | 0 | 0 | 0 | 0 | 0 | 0 | 0 |
| EU Total 27 | 159 | 252 | 0.06 | 282 | 0.06 | 992 | 0.23 | 145 | 0.04 | 172 | 0.05 | ||
| United Kingdom | – | – | – | 0 | – | 0 | 0 | 0 | 0 | 0 | 0 | 0 | 0 |
| EU Total(c) | 159 | 252 | 0.06 | 282 | 0.06 | 992 | 0.20 | 145 | 0.03 | 172 | 0.04 | ||
| Iceland | Y | C | 0 | 0 | 0 | 0 | 0 | 0 | 0 | 0 | 0 | – | – |
| Norway | Y | C | 0 | 0 | 0 | 0 | 0 | 0 | 0 | 0 | 0 | 0 | 0 |
WNND: West Nile neuro‐invasive disease.
–: Data not reported.
Cases reported by the United Kingdom in years 2016–2019 were also considered for this estimate (EU‐28). When 2016–2019 UK data were collected, the UK was an EU MS, but on 1 February 2020, it became a third country.
Y: yes; N: no; A: aggregated data; C: case‐based data.
: Not notifiable, no surveillance system exists.
Cases reported include both confirmed and probable cases of WNV human infection.
Within MS, WNV infections typically do not occur across the entire country but in small or large areas where conditions for transmission are more favourable. The geographical distribution (NUTS3) of human WNV infections reported in 2020 is shown in (Figure 67).
Figure 67.

- Data source: ECDC for human cases, ADNS for animal outbreaks. Outbreaks in birds or equids that were not notified to the ADNS are not included in the map.
5.4.3. West Nile virus infections in animals
Concerning West Nile fever (WNF) in animals, two main sources of information are used for this report: data from the annual surveillance and monitoring activities submitted to EFSA and data from the outbreaks notified to the ADNS. The geographical distribution of these outbreaks is shown in Figure 67.
Table 84 displays data from both data sources for each MS. In some cases, the comparison may show discrepancies, so the following points should be taken into consideration for interpretation: (i) the number of animals tested for the EFSA data source include all the animals analysed, regardless of the methods; (ii) the data reported by the ADNS include only the outbreaks for which the disease was confirmed clinically and/or in a laboratory setting, either by the detection of IgM‐specific antibodies (indicating a recent infection with WNV) or by the detection of RNA particles using PCR‐based methods (iii) an outbreak can refer to more than one affected animal if they constitute a single epidemiological unit or/and are identified at the same location; (iv) some countries have not submitted data to either the ADNS or EFSA.
Table 84.
Summary of surveillance/monitoring activities submitted to EFSA, and WNV outbreaks notified to the ADNS by EU MS and non‐MS countries in 2020
| Country (EU MS, non‐EU countries) | Birds | Equids | ||||||
|---|---|---|---|---|---|---|---|---|
| Data(*) on surveillance activities submitted to EFSA | N (%) outbreaks in ADNS | Data(*) on surveillance activities submitted to EFSA | N (%) outbreaks in ADNS | |||||
| N (%) animals tested | N (%) animals positive using PCR a | N (%) animals tested | N (%) animals positive using ELISA‐IgM b | N (%) animals positive using PCR a | ||||
| EU MS | ||||||||
| Austria | 13 (0.09) | 2 (1.2) | NR | 7 (0.10) | – | 1 (100) | 2 (1.1) | |
| Bulgaria | NR | – | 2 (100) | – | – | – | NR | |
| Cyprus | 446 (3.2) | – | NR | 142 (2.1) | 0 | – | NR | |
| Czechia | NR | – | NR | 783 (11.6) | – | – | NR | |
| France | 60 (0.43) | 0 | NR | 32 (0.47) | 5 (2.4) | – | 5 (2.7) | |
| Germany | NR | – | NR | 2,273 (33.7) | 22 (10.5) | – | 23 (12.2) | |
| Greece | 8 (0.06) | 0 | NR | 1,064 (15.8) | 8 (3.8) | 0 | 1 (0.53) | |
| Hungary | 9 (0.06) | 0 | NR | 9 (0.13) | – | 0 | 1 (0.53) | |
| Italy | 6,799 (48.8) | 151 (91.5) | NR | 298 (4.4) | 17 (8.1) | – | 16 (8.5) | |
| Netherlands c | 2,783 (20.0) | – | NR | NR | – | – | NR | |
| Portugal | 1 (0.01) | 0 | NR | 20 (0.30) | 2 (0.96) | 0 | 2 (1.1) | |
| Romania | 2 (0.01) | – | NR | 156 (2.3) | 0 | – | NR | |
| Slovakia | NR | – | NR | 50 (0.74) | 0 | – | NR | |
| Slovenia | 63 (0.45) | 0 | NR | 2 (0.03) | – | 0 | NR | |
| Spain | 3,518 (25.3) | 12 (7.3) | NR | 1,907 (28.3) | 155 (74.2) | – | 139 (73.5) | |
| Sweden | 222 (1.6) | 0 | NR | 6 (0.09) | – | 0 | NR | |
| EU Total | 13,924 (100) | 165 (100) | 2 (100) | 6,749 (100) | 209 (100) | 1 (100) | 189 (100) | |
| Non‐EU Countries | ||||||||
| Switzerland | 0 | – | NR | 26 | – | 0 | NR | |
| United Kingdom | 463 | 6 | NR | 5 | – | – | NR | |
MS: member states; ADNS: Animal Disease Notification System.
NR: Not reported to EFSA or to the ADNS. These countries have not submitted data on their WNF surveillance activities to EFSA or have not notified any outbreaks to the ADNS.
–: Analytical method not used.
0: Analytical method used with negative results.
: PCR: polymerase chain reaction (for identification of the virus genome).
ELISA: enzyme‐linked immunosorbent assay.
The Netherlands reported test data on 2,783 units to EFSA, of which one was positive. However, the analytical method used was not reported. For this reason, it was not possible to include these results in the table.
When the analytical method was not specified, data were not included.
Annual results of surveillance and monitoring activities
In birds
In 2020, according to the annual surveillance and monitoring data reported by 12 MS to EFSA, a total 13,924 samples from birds were tested for WNV, using either molecular testing or the seroneutralisation method. Italy and Spain, respectively, submitted 48.8% and 25.3% of these data for birds to EFSA (Table 84). One non‐MS (the United Kingdom) also reported the results of 463 samples of birds tested for WNV to EFSA (Table 84). Of the EU bird samples, 8,525 were tested using the PCR method. This approach confirms WNV infection in birds by testing for the presence of WNV genomic RNA. Positive results from serum neutralisation tests are not shown in Table 84 as it is not possible to establish when the WNV infection occurred.
Three MS reported positive results to EFSA. Positive results detected in birds using the Reverse transcriptase‐polymerase chain reaction (RT‐PCR) method were located in Austria (two), Italy (151) and Spain (12), (Table 81 and Figure 67). All positive results were from wild birds. Based on available data, WNV was detected in doves, magpies, jays, owls, pigeons and crows.
Also in 2020, two WNF outbreaks in birds were notified only to the ADNS by the Veterinary Authorities of the Bulgarian MS (Table 84).
Results from the Netherlands were not included in the table because they did not specify the analytical methods used. It should be noted that WNV‐positive birds were detected in this country in 2020 (Sikkema et al., 2020). Finally, Germany did not declare WNV‐positive birds to the ADNS or EFSA, although positive cases were also detected in this country in 2020 (ECDC, 2021a).
Most positive cases in birds were reported in countries where human outbreaks also occurred (Bulgaria, Italy, Germany, Spain and the Netherlands) (Figure 67).
In equids
Fourteen MS reported the results of 6,749 samples from equids, following surveillance and monitoring activities, to EFSA (Tables 81 and 84). Germany, Greece and Spain submitted 33.7%, 15.8% and 28.3% of these data, respectively. The analytical methods used to confirm positive WNV infection were the detection of IgM‐specific antibodies (indicator of recent infection with WNV) with an IgM‐capture ELISA, or the detection of RNA particles via PCR‐based methods. Seven MS reported positive results: 209 positive results using the IgM method and one using the RT‐PCR method. These cases were detected in Austria (one), France (five), Germany (22), Greece (eight), Italy (17), Portugal (two) and Spain (155).
Two non‐MS (Switzerland and the United Kingdom) also reported the WNV results of 26 and five samples of equids, respectively, to EFSA (Table 84).
In 2020, 189 WNF outbreaks in equids (an outbreak can refer to more than one affected animal) were notified to the ADNS by the Veterinary Authorities of eight MS (Table 81). These outbreaks were reported in Austria (two), France (five), Germany (23), Greece (one), Hungary (one), Italy (16), Portugal (two) and Spain (139). Italy, Germany and Spain reported the highest number of outbreaks in equids among MS, accounting for 8.5%, 12% and 74% of the total number of outbreaks, respectively (Table 84).
The number of animals tested (birds and horses) in 2020 is comparable to 2019 and appears to indicate that the COVID‐19 crisis had no impact on WNV surveillance in Europe. Moreover, the number of birds and horses testing positive for WNV infection was higher than in any other year, excluding 2018, when the level of WNV circulation was exceptionally high (Table 81).
5.4.4. Joint analysis of trends and seasonality
WNV is endemic in several EU countries and WNV infections are detected every year (Figure 68). Human and animal WNV infections occur seasonally, with most cases being reported in the summer and early autumn.
Figure 68.

- Source(s): Austria, Belgium, Cyprus, Czechia, Estonia, Finland, France, Greece, Hungary, Ireland, Italy, Latvia, Lithuania, Luxembourg, Malta, the Netherlands, Poland, Romania, Slovakia, Slovenia, Spain and Sweden. Bulgaria, Croatia, Germany and Portugal did not report data to the level of detail required for the analysis.
Figures 68 and 69 show the observed peak in the number of human cases each year. Excluding the epidemic year of 2018, the trend in the number of reported cases seems to be slowly increasing, however no statistically significant (p = 0.07) increase or decrease in the number of reported WNV infections has been observed over the last 5 years (2016–2020) in the EU. At national level, Spain reported a significantly (p = 0.04) increasing trend in the past 5 years (2016–2020).
Figure 69.

Reported human cases of West Nile virus infection in EU MS, by month across the different years (2016–2020)
Aside from 2018, when the EU notification rate per 100,000 population reached 0.31, the yearly EU notification rate for the period 2016–2020 ranged from 0.05 in 2017 to 0.08 in 2019 (Table 81).
During the period 2016–2020, most cases of human and animal WNV infection reported in the EU were observed between June and October, peaking in August or September (Figure 69). This did not occur in 2018, when an unusually intense and protracted transmission season was observed (Figure 68). In that year, France, Greece, Hungary, Italy, Romania and Serbia all observed a high number of cases very early in the transmission season (ECDC, 2018; Riccardo et al., 2018, 2020; Beck et al., 2020; Pervanidou et al., 2020). Furthermore, infections continued until the end of November, marking an extended transmission season (Young et al., 2021).
During the 5‐year period of 2016–2020, 916 WNF outbreaks in animals were notified to the ADNS by 12 EU MS, a number comparable to other years, mainly among equids and birds, but sporadically also among other species. This 5‐year period was marked by a sharp increase in WNV outbreaks in equids and birds in 2018, a drop in 2019 and a new increase in 2020, albeit lower than in 2018 (Table 81) The increase in the number of reported cases in 2020 mainly reflects notifications from Spain of outbreaks among equids (Table 81 and Figure 67). The distribution of animal outbreaks of West Nile infection in EU, by month and years (seasonality) is shown in Figure 70. Details on animal outbreaks of West Nile infection by single MS are showed in Appendcies F and G.
Figure 70.

- Data source: ADNS for animal outbreaks. Outbreaks in birds or equids that were not notified to ADNS are not included.
5.5. Discussion
Between 2016 and 2020, cases of WNV human infection were reported every year by several EU MS. However, environmental and ecological conditions are elements that are relevant to the establishment of endemic WNV transmission. Therefore, EU MS also include countries in which WNV is a newly emerging locally acquired disease and countries that only report imported cases of WNV.
The year 2018 was characterised by an unusually intense and protracted WNV transmission season in several countries across Europe (ECDC, 2018; Haussig et al., 2018; Riccardo et al., 2018, 2020; Beck et al., 2020; Pervanidou et al., 2020; Young et al., 2021). Notification rates of human WNV infections decreased in 2019 and 2020 to levels comparable with the years preceding 2018. Nevertheless, the peak in the number of reported cases of WNV human infection each year, excluding the epidemic year of 2018, shows a slowly increasing trend that could be explained by the gradual increase in the number of EU countries reporting local WNV transmission (Bakonyi and Haussig, 2020), as well as by subnational increases in transmission, as was the case in Spain in 2020, and by the gradual improvement of EU surveillance systems. In several EU countries, these systems are also increasingly able to detect mildly symptomatic cases (e.g. WNF).
Genetic studies indicate that WNV infections after 2004 in central and southern Europe were predominantly caused by descendants of the lineage 2 strain that emerged in 2004 and became endemic in the region (Bakonyi and Haussig, 2020). Since the detection of WNV lineage 2 in Germany (2018), this strain has been spreading towards northern Europe (the Netherlands in 2020) and further west in Mediterranean regions such as southern France in 2018 (Beck et al., 2020) and northern Spain in 2020 (García San Miguel Rodríguez‐Alarcón et al., 2021).
WNV lineage 1, however, is still documented in the EU and was detected in southern Spain in 2020 amidst an unprecedented increase in the number of WNV infections (77 cases of confirmed/probable human WNV infections, of which 72 WNND cases, with no cases reported in the period 2017–2019) and a major equine outbreak. According to the Spanish health authorities, possible causes for this unexpected increase in the number of severe WNV infections include increased vector activity, a decline in vector control activities in the context of the COVID‐19 pandemic, and a possible change in the transmissibility or virulence of the circulating WNV strain (García San Miguel Rodríguez‐Alarcón et al., 2021).
The number of countries reporting local WNV transmission has increased in EU MS in recent years (Hubálek and Halouzka, 1999; Young et al., 2021). In 2020, the Netherlands reported its first cases in birds and humans (Sikkema et al., 2020). Moreover, since detecting its first epizoonosis in 2018, Germany has reported locally acquired human cases every year, suggesting an establishment of local transmission (Ziegler et al., 2019). Even though fewer human cases and animal outbreaks were reported in Europe in 2019 and 2020 compared to 2018, we can expect to see a changing epidemiological pattern of WNV circulation in Europe during the coming years.
The impact of WNV on human health in EU MS and is relevant in terms of hospitalisation and case fatality. As shown in this report, in the period 2016–2020, five EU countries (Bulgaria, Greece, Hungary, Italy and Romania) reported WNND cases every year. Germany first reported WNND cases in 2019, while the Netherlands in 2020. In Spain, a large number of WNND were reported in 2020 for the first time since 2016. Excluding the 2018 epidemic year, during which over 900 WNND were reported in the EU, the number of annual WNND cases over the past 5 years from 145 in 2017 to over 250 in 2019 and 2020.
As in prior years, neuro‐invasive infections continued to be the most frequently reported clinical presentation in 2020, among cases for which this information is known. This suggests substantial under‐detection/under‐reporting of clinically asymptomatic and/or mildly symptomatic WNV infections. The number of reported human infections each year therefore underestimates the true number of human infections that occur across EU MS. This might be more evident in countries only reporting more severe cases of infection (WNND), as was the case of a limited number of EU MS countries in 2020.
The epidemiological data presented in this report, together with the findings of after‐action reviews conducted following the 2018 exceptional transmission season (Riccardo et al., 2020), highlight the need to strengthen integrated WNV surveillance in Europe, primarily to ensure the security of human blood, cells or organ products. Some countries (e.g. Italy, Spain, Greece) implement active surveillance for equids and birds. However, in most countries, veterinary WNV surveillance and human surveillance remain passive, focusing on the analysis of dead birds and of horses with clinical symptoms. passive surveillance of clinical cases in humans and equids has limited value for the early detection of WNV circulation, since it typically detects circulation later in the transmission season (Riccardo et al., 2018).
An action‐oriented One Health approach to WNV surveillance is encouraged, in liaison with the authorities governing SoHO safety, in order to implement timely prevention measures. The combination of clinical, laboratory and event‐based surveillance activities across the human–animal spectrum, including the active surveillance of wild resident birds using molecular tests, the early activation of entomological surveillance and monitoring, the screening of blood donors in high‐risk areas and the active monitoring of seroconversions in sentinel and/or resident birds and equids could contribute to the early detection of WNV circulation.
The current report covers a period during which two events with a possible influence on human EU surveillance data occurred. Firstly, the ongoing COVID‐19 pandemic could have led to a lower risk perception for other diseases, including WNV, resulting in under‐reporting/under‐ascertainment of WNV infections. Secondly, the withdrawal of the United Kingdom from the EU resulted in a fall in the number of reporting MS in 2020.
However, neither event seems to have had a major impact on WNV data reporting. Firstly, because the number of observed cases of WNV human infection and of WNND reported in 2020 was consistent with the number of cases reported in previous non‐epidemic years in the EU MS. Excluding the epidemic year of 2018, we observed no statistically significant increasing or decreasing trend in the number of reported WNV infections over the last 5 years (2016–2020). This suggests that under‐reporting/under‐ascertainment was likely not substantially higher in 2020. Secondly, because the United Kingdom has not reported any locally acquired WNV cases in the past 5 years and has therefore not contributed to the WNV epidemiological data analysed in the report.
5.6. Related projects and Internet sources
| Subject | For more information see | |
|---|---|---|
| Humans | ECDC Surveillance Atlas of Infectious Diseases | http://atlas.ecdc.europa.eu/public/index.aspx |
| EU case definitions of West Nile virus infection | https://www.ecdc.europa.eu/en/surveillance‐and‐disease‐data/eu‐case‐definitions | |
| Disease Programme on Emerging, Food‐ and Vector‐Borne Diseases | https://www.ecdc.europa.eu/en/about‐us/who‐we‐are/units/disease‐programmes‐unit | |
| Emerging Viral Diseases‐Expert Laboratory Network (EVD‐LabNet) | https://ecdc.europa.eu/en/about‐us/partnerships‐and‐networks/disease‐and‐laboratory‐networks/evd‐labnet | |
| ECDC – Surveillance and disease data for West Nile virus infections | https://ecdc.europa.eu/en/west‐nile‐fever/surveillance‐and‐disease‐data | |
| World Health Organisation – West Nile virus fact sheet | http://www.who.int/mediacentre/factsheets/fs354/en/ | |
| ECDC – Fact sheet about West Nile virus infection | https://www.ecdc.europa.eu/en/west‐nile‐fever/facts/factsheet‐about‐west‐nile‐fever | |
| Animals | World Organisation for Animal Health (OIE), Summary of Information on West Nile fever | West Nile fever ‐ OIE ‐ World Organisation for Animal Health |
| OIE Reference Laboratory for West Nile Fever | http://www.izs.it/IZS/Centres_of_excellence/International_Centres/OIE_Reference_Laboratory_for_West_Nile_Fever | |
| EU Animal Disease Notification System (ADNS) | https://ec.europa.eu/food/animals/animal‐diseases/not‐system_en | |
| Vector‐borne diseases, Scientific Opinion of the Animal Health and Welfare Panel of EFSA, published 11 May 2017 | http://www.efsa.europa.eu/en/efsajournal/pub/4793 | |
| VectorNet, a joint initiative of the European Food Safety Authority (EFSA) and the European Centre for Disease Prevention and Control (ECDC), which started in May 2014. The project supports the collection of data on vectors and pathogens in vectors, related to both animal and human health | https://vectornet.ecdc.europa.eu/ | |
| An interactive presentation of WNF virus in Vector Born Diseases Story Maps application | https://efsa.maps.arcgis.com/apps/MapJournal/index.html?appid=512a03aa8df84d54a51bcb69d1b62735 | |
| Assessment of listing and categorisation of animal diseases within the framework of the Animal Health Law, Regulation (EU) No 2016/429): West Nile fever, Vector‐borne diseases, Scientific Opinion of the Animal Health and Welfare Panel of EFSA, published 8 August 2017 | http://www.efsa.europa.eu/en/efsajournal/pub/4955 | |
| Annual national zoonoses country reports (reports of reporting countries on national trends and sources of zoonoses) | https://www.efsa.europa.eu/en/data‐report/biological‐hazards‐reports |
6. Tularaemia
Tables and figures that are not presented in this chapter are published as supporting information for this report and are available as downloadable files from the EFSA Knowledge Junction on Zenodo at https://doi.org/10.5281/zenodo.5682809. Summary statistics on human surveillance data with downloadable files are retrievable using the ECDC Surveillance Atlas of Infectious Diseases at http://atlas.ecdc.europa.eu/public/index.aspx
6.1. Key facts
-
•
In 2020, the number of confirmed human cases of tularaemia was 641, corresponding to an EU notification rate of 0.15 per 100,000 population. This was a decrease of 42.5% and 50.0% compared with the rates in 2019 (0.25 and 0.29 per 100,000 population) with and without the 2019 data from the United Kingdom, respectively.
-
•
In 2020, the seasonal pattern was similar to previous years with infections peaking in September. Cases increased with age and were highest in the age group over 65 years.
-
•
No foodborne disease outbreaks due to Francisella tularensis were reported for 2020.
-
•
Tularaemia in animals is rarely reported in the EU as submission of the data to EFSA is on a voluntary basis. In 2020, three MS (Austria, Finland and Sweden) reported data on the occurrence of F. tularensis in hares. Sweden also reported cases in dogs and squirrels. One non‐MS (Switzerland) reported samples taken from wild species, zoo animals and pets.
-
•
Three MS (Austria, Finland and Sweden) reported that 81 out of 223 wild animals had positive results (36.5%) (31.7% in 2019), all of which were hares. Among pets, only one dog tested serologically positive. In Switzerland, the occurrence of F. tularensis in the tested hares was 46.2%.
6.2. Surveillance and monitoring of tularaemia in the EU
6.2.1. Humans
Tularaemia in humans is a mandatory notifiable disease at the EU level and cases are reported through TESSy. For 2020, 26 EU MS (Denmark did not report) provided information on tularaemia in humans. The United Kingdom, considered a third country after the withdrawal from the EU, did not report any data to ECDC. The EU case definition was used by 23 EU countries. France, Germany and Italy used another case definition. Reporting is compulsory in all countries. Surveillance is mostly passive except in Czechia, Portugal and Slovakia, where it is active. Belgium and Bulgaria reported aggregated data, while all other countries reported case‐based data.
6.2.2. Animals
Tularaemia in animals is an internationally reportable disease (to OIE); therefore, at European level, each country receives communication from its veterinary services. In some countries, notification is mandatory by national law. Monitoring data from animals on Francisella tularensis are voluntarily submitted by EU MS and non‐MS countries to EFSA. Notably, for 2020, only three EU MS (Austria, Finland and Sweden) and one non‐MS (Switzerland) reported these data to EFSA. Surveillance is mostly passive.
6.2.3. foodborne outbreaks of tularaemia
The reporting of foodborne tularaemia disease outbreaks in humans is mandatory according to Zoonoses Directive 2003/99/EC.
Since 1 February 2020, the United Kingdom has become a third country. Animal data from the United Kingdom were still collected by EFSA for 2020 in the framework of Zoonoses Directive 2003/99/EC; however, they have been excluded from EU statistics.
6.3. Results
6.3.1. Overview of key statistics, EU, 2016–2020
Table 85 summarises EU‐level statistics on tularaemia in humans and in major animal species, respectively, for 2016–2020. Animal data of interest were classified into the main categories and aggregated by year to obtain an annual overview of the volume of data submitted.
Table 85.
Summary of tularaemia statistics related to humans and major animal species, EU, 2016–2020
| 2020 | 2019 a | 2018 a | 2017 a | 2016 a | Data source | |
|---|---|---|---|---|---|---|
| Humans | ||||||
| Total number of confirmed cases | 641 | 1,280 | 269 | 323 | 1,056 | ECDC |
| Total number of confirmed cases/100,000 population (notification rates) | 0.15 | 0.25 | 0.05 | 0.06 | 0.21 | ECDC |
| Number of reporting MS | 26 | 27 | 27 | 27 | 27 | ECDC |
| Infection acquired in the EU | 466 | 1,118 | 232 | 236 | 144 | ECDC |
| Infection acquired outside the EU | 2 | 3 | 3 | 2 | 2 | ECDC |
| Unknown travel status or unknown country of infection | 173 | 159 | 34 | 85 | 910 | ECDC |
| Number of foodborne outbreak‐related cases | 0 | 0 | 0 | 0 | 6 | EFSA |
| Total number of foodborne outbreaks | 0 | 0 | 0 | 0 | 1 | EFSA |
| Animals | ||||||
| Hares | ||||||
| Number of sampling units | 222 | 211 | 112 | 39 | 41 | EFSA |
| Number of positive animals | 81 | 67 | 20 | 7 | 6 | EFSA |
| % of positive animals | 36.5 | 31.8 | 17.9 | 17.9 | 14.6 | EFSA |
| Number of reporting MS | 3 | 2 | 2 | 1 | 1 | EFSA |
| Wildlife animals other than hares | ||||||
| Number of sampling units | 1 | 152 | 0 | 0 | 0 | EFSA |
| Number of positive animals | 0 | 8 | 0 | 0 | 0 | EFSA |
| % of positive animals | 0 | 5.3 | – | – | – | EFSA |
| Number of reporting MS | 1 | 1 | 0 | 0 | 0 | EFSA |
ECDC: European Centre for Disease Prevention and Control; EFSA: European Food Safety Authority; MS: Member State.
Since 1 February 2020, the United Kingdom has become a third country. The United Kingdom’s data are included for 2016–2019, whereas for 2020, the United Kingdom’s data are not included.
6.3.2. Tularaemia in humans
For 2020, 17 EU MS reported 641 confirmed cases of tularaemia (Table 86). In 2020, Finland had the highest notification rate with 2.6 per 100,000; it was followed by Sweden and Czechia, with 2.4 and 0.63 per 100,000 population, respectively. The human cases reported showed a decrease compared to 2016 and 2019 and an increase compared to 2017 and 2018.
Table 86.
Reported human cases of tularaemia and notification rates per 100,000 population in EU MS and non‐MS countries, by country and by year, 2016–2020
| Country | 2020 | 2019 | 2018 | 2017 | 2016 | ||||||||
|---|---|---|---|---|---|---|---|---|---|---|---|---|---|
| National coverage a | Data format a | Confirmed cases and rates | Confirmed cases and rates | Confirmed cases and rates | Confirmed cases and rates | Confirmed cases and rates | |||||||
| Cases | Rate | Cases | Rate | Cases | Rate | Cases | Rate | Cases | Rate | ||||
| Austria | Y | C | 33 | 0.37 | 20 | 0.23 | 7 | 0.08 | 13 | 0.15 | 9 | 0.10 | |
| Belgium | Y | A | 1 | 0.01 | 4 | 0.03 | 0 | 0 | 5 | 0.04 | 1 | 0.01 | |
| Bulgaria | Y | A | 2 | 0.03 | 1 | 0.01 | 1 | 0.01 | 1 | 0.01 | 2 | 0.03 | |
| Croatia | Y | C | 0 | 0 | 1 | 0.02 | 0 | 0 | 3 | 0.07 | 2 | 0.05 | |
| Cyprus | Y | C | 0 | 0 | 0 | 0 | 0 | 0 | 0 | 0 | 0 | 0 | |
| Czechia | Y | C | 67 | 0.63 | 102 | 0.96 | 32 | 0.30 | 51 | 0.48 | 59 | 0.56 | |
| Denmark | – | – | – | – | – | – | – | – | – | – | – | – | |
| Estonia | Y | C | 1 | 0.08 | 2 | 0.15 | 1 | 0.08 | 0 | 0 | 1 | 0.08 | |
| Finland | Y | C | 143 | 2.6 | 48 | 0.87 | 7 | 0.13 | 32 | 0.58 | 699 | 12.7 | |
| France | Y | C | 45 | 0.07 | 45 | 0.07 | 11 | 0.02 | 19 | 0.03 | 47 | 0.07 | |
| Germany | Y | C | 59 | 0.07 | 71 | 0.09 | 51 | 0.06 | 52 | 0.06 | 41 | 0.05 | |
| Greece | Y | C | 0 | 0 | 0 | 0 | 0 | 0 | 0 | 0 | 0 | 0 | |
| Hungary | Y | C | 20 | 0.20 | 22 | 0.23 | 17 | 0.17 | 11 | 0.11 | 22 | 0.22 | |
| Ireland | Y | C | 0 | 0 | 0 | 0 | 0 | 0 | 0 | 0 | 0 | 0 | |
| Italy | Y | C | 0 | 0 | 1 | < 0.01 | 0 | 0 | 2 | < 0.01 | 0 | 0 | |
| Latvia | Y | C | 0 | 0 | 2 | 0.10 | 0 | 0 | 0 | 0 | 1 | 0.05 | |
| Lithuania | Y | C | 2 | 0.07 | 4 | 0.14 | 5 | 0.18 | 5 | 0.18 | 2 | 0.07 | |
| Luxembourg | Y | C | 0 | 0 | 0 | 0 | 0 | 0 | 0 | 0 | 0 | 0 | |
| Malta | Y | C | 0 | 0 | 0 | 0 | 0 | 0 | 0 | 0 | 0 | 0 | |
| Netherlands | Y | C | 1 | 0.01 | 3 | 0.02 | 2 | 0.01 | 1 | 0.01 | 5 | 0.03 | |
| Poland | Y | C | 5 | 0.01 | 21 | 0.06 | 16 | 0.04 | 30 | 0.08 | 18 | 0.05 | |
| Portugal | Y | C | 1 | 0.01 | 1 | 0.01 | 2 | 0.02 | 0 | 0 | 0 | 0 | |
| Romania | Y | C | 0 | 0 | 0 | 0 | 0 | 0 | 0 | 0 | 0 | 0 | |
| Slovakia | Y | C | 12 | 0.22 | 20 | 0.37 | 6 | 0.11 | 2 | 0.04 | 7 | 0.13 | |
| Slovenia | Y | C | 1 | 0.05 | 7 | 0.34 | 4 | 0.19 | 1 | 0.05 | 3 | 0.15 | |
| Spain | Y | C | 1 | < 0.01 | 88 | 0.19 | 4 | 0.01 | 11 | 0.02 | 3 | 0.01 | |
| Sweden | Y | C | 247 | 2.4 | 817 | 8.0 | 102 | 1.0 | 84 | 0.84 | 134 | 1.4 | |
| EU Total 27 | – | – | 641 | 0.15 | 1,280 | 0.29 | 268 | 0.06 | 323 | 0.07 | 1,056 | 0.24 | |
| United Kingdom | – | – | – | – | 0 | 0 | 1 | < 0.01 | 0 | 0 | 0 | 0 | |
| EU Total b | – | – | 641 | 0.15 | 1,280 | 0.25 | 269 | 0.05 | 323 | 0.06 | 1,056 | 0.21 | |
| Iceland | Y | C | 0 | 0 | 0 | 0 | 0 | 0 | 0 | 0 | 0 | 0 | |
| Norway | Y | C | 99 | 1.8 | 183 | 3.4 | 58 | 1.1 | 92 | 1.7 | 40 | 0.77 | |
| Switzerland c | Y | C | 117 | 1.4 | 154 | 1.8 | 117 | 1.4 | 152 | 1.8 | 67 | 0.80 | |
–: Data not reported.
Y: yes; N: no; A: aggregated data; C: case‐based data.
Cases reported by the United Kingdom in years 2016–2019 were also considered for this estimate (EU‐28). When 2016–2019 UK data were collected, the UK was an EU MS but since 1 February 2020, it has become a third country.
Switzerland provided data directly to EFSA. The human data for Switzerland include data from Liechtenstein.
In 2020, most human tularaemia cases (72.4%) were acquired in the EU. Germany and Sweden reported two cases (0.3%) that were associated with travel outside the EU (Ghana and Turkey), whereas for 27% of cases, there were no data on travel or the country of infection (Table 85).
Tularaemia shows a seasonal pattern, with most cases occurring from July to November, but some cases are also observed in winter. In 2020, infections peaked in September, which was later than in 2019, but was still in line with the mean for the 2016–2018 period.
Data on hospitalisation status were provided by 10 MS for 123 confirmed cases. A total of 64 hospitalisations were reported in the EU by eight MS (Austria, Czechia, Estonia, Hungary, Poland, Portugal, Slovakia and Spain), corresponding to a proportion of hospitalisations of 52.0% among confirmed cases with information available on hospitalisation (N = 123).
As in previous years, the proportion of male cases was higher, with a male‐to‐female ratio of 1.6:1. Children below 14 years of age accounted for 44 cases (6.9%). The number of cases increased with age and the highest notification rate was for the age group over 65 years, followed by the age groups of 60–65 years and 55–59 years.
Over the past 5 years, no significant trend in the number of reported cases was observed (Figure 71), except for Austria, where a significant (p < 0.01) increasing trend was found. However, over the 2016–2020 period, two peaks in terms of the number of cases were observed largely due to high numbers of cases reported by Finland and Sweden in 2016 and by Sweden and Czechia in 2019. In 2020, the number of tularaemia cases decreased by about 50% compared to 2019, mainly due to a large decrease in human cases in Sweden, Spain and Czechia.
Figure 71.

- Source: Austria, Cyprus, Czechia, Estonia, Finland, France, Germany, Greece, Hungary, Ireland, Latvia, Luxembourg, Malta, Poland, Romania, Slovakia, Slovenia, Spain and Sweden. Belgium, Bulgaria, Croatia, Denmark, Italy, Lithuania, the Netherlands and Portugal did not report data to the level of detail required for the analysis.
Human cases associated with foodborne outbreaks caused by Francisella tularensis
No foodborne tularaemia outbreaks caused by Francisella tularensis were reported for 2020.
6.3.3. Tularaemia in animals
In 2020, three EU MS (Austria, Finland and Sweden) recorded 81 hares positive for tularaemia, while Switzerland reported 12 positive hares (Table 87). Among pets, only one dog tested serologically positive, in Sweden. Overall, 34.9% of tested animals had positive results with a direct (PCR and/or culture) or indirect (antibody) test. The total number of hares tested has been increasing during the previous years.
Table 87.
Occurrence of Francisella tularensis in animals, EU MS and non‐MS countries, 2020
| Country | Pets | Wild animals | Zoo animals | Total | ||||||||||
|---|---|---|---|---|---|---|---|---|---|---|---|---|---|---|
| Cats | Dogs | Hares | Squirrels | Other wild animals a | ||||||||||
| N Tested | N Pos* (%) | N Tested | N Pos (%) | N Tested | N Pos (%) | N Tested | N Pos (%) | N Tested | N Pos (%) | N Tested | N Pos (%) | N Tested | N Pos (%) | |
| EU MS | ||||||||||||||
| Austria | − | − | − | − | 97 | 22 (22.7) | − | − | − | − | − | − | 97 | 22 (22.7) |
| Finland | − | − | − | − | 49 | 27 (55.1) | − | − | − | − | − | − | 49 | 27 (55.1) |
| Sweden | − | − | 4 | 1 (25.0) | 76 | 32 (42.1) | 1 | 0 (0) | − | − | − | − | 81 | 33 (40.7) |
| EU Total | − | − | 4 | 1 (25.0) | 222 | 81 (36.5) | 1 | 0 (0) | − | − | − | − | 227 | 82 (36.1) |
| Non‐EU Countries | ||||||||||||||
| Switzerland | 2 | 0 (0) | 3 | 0 (0) | 26 | 12 (46.2) | 3 | 0 (0) | 6 | 0 (0) | 2 | 0 (0) | 42 | 12 (28.6) |
| Total EU + non‐EU countries | 2 | 0 (0) | 7 | 1 (14.3) | 248 | 93 (37.5) | 4 | 0 (0) | 6 | 0 (0) | 2 | 0 (0) | 269 | 94 (34.9) |
MS: Member State.
Other wild animals: two beavers, two foxes, one lynx and one marten.
Positive.
6.4. Discussion
Francisella tularensis is the causative agent of tularaemia and is also considered a potential biological weapon for bioterrorism. Humans can acquire the disease through several routes, including arthropod vectors. Tularaemia is widely distributed throughout most of Europe, and in endemic regions within Scandinavian countries, it is typically transmitted by mosquito bites (Kenney et al., 2017). In some countries, the ingestion of contaminated water is the main route of transmission of the disease (Hennebique et al., 2019). The disease shows a seasonal pattern in humans (Hestvik et al., 2015), consistent with a higher likelihood of exposure in summer and autumn months due to recreational outdoor activities (notably hunting), exposure to contaminated water and vector bites. Notification rates for tularaemia vary among Member States and over time. Between 2014 and 2015, Sweden had the highest notification rate. In 2016, Finland had the highest rate observed among Member States. In 2017, Norway and Sweden reported higher numbers of cases, while the number of cases reported from Finland decreased compared with 2016. In 2018, a major outbreak occurred in western France, whereas in 2019, Sweden recorded the largest outbreak of tularaemia in over 50 years (Dryselius et al., 2019).
In 2020, the number of human cases was about half that observed in 2019, and more than 60% of cases were reported from Scandinavian countries. The data on tularaemia were not affected by the withdrawal of the United Kingdom from the EU in 2020, as only one case was attributed to the United Kingdom in the period 2016–2019. Regarding the COVID‐19 pandemic’s impact on tularaemia surveillance and reporting, all MS estimated a marginal influence with a level of data comparability generally expected as medium to high. However, the possibility that some cases may not have been detected cannot be ruled out.
Tularaemia is present in wildlife, which continues to play a role in the maintenance of F. tularensis in the ecological cycle and in the occurrence of human cases. Francisella spp. are widely present in the environment, and a wide range of wild animals (such as hares) as well as vectors (e.g. ticks and mosquitos) could be used to enforce passive surveillance in the EU as they can be sources of infections in humans (WHO, 2007; Maurin and Gyuranecz, 2016). Among animals, hares are good indicators to monitor the occurrence of the disease.
Lately the circulation of Francisella tularensis among wild animals has been reported in numerous European countries in north‐central Europe where it is considered endemic (Hestvik et al., 2017; Faber et al., 2018; Seiwald et al., 2020) as well as in Spain (Mínguez‐González et al., 2021), but few MS report to EFSA. As for the previous years, only Austria, Sweden and Switzerland (a non‐MS) reported data to EFSA and in 2020, Finland also joined the MS which notified tularaemia. In the last 5 years among the reporting MS, the number of hares tested has increased (from 41 to 222), and positivity has increased from 14.6% to 36.5%.
However, because tularaemia surveys are very often passive and therefore do not reflect the status of the entire population, it is difficult to paint an accurate picture of the spread of the disease among animals. In this regard, the percentage of positivity in hares reported in 2020 does not appear indicative of the disease’s widespread presence among wild animals. It is important to point out that risks of exposure and/or new outbreaks in humans are often preceded by the appearance of the disease in animals and for this reason, wildlife monitoring is crucial.
Many epidemiological aspects, such as ecosystem maintenance, the role of animal reservoirs and vectors, and different routes of transmission of the disease, remain poorly understood. Tularaemia has two main ecological cycles. The terrestrial cycle is particularly involved in Central Europe, while the aquatic cycle is known in Scandinavia and in the Balkans. The terrestrial cycle includes hares and rodents as the main reservoirs. Sporadic tick‐borne human infections are also reported, while foodborne or profession‐associated infections (e.g. in hunters and lumbermen) may result in smaller outbreaks. In the aquatic cycle, human infection is typically acquired from open waters contaminated with bacteria from excrement and carcases of infected animals. Human infections from aquatic sources are more frequent than from the terrestrial cycle, and they usually cause larger outbreaks (Maurin and Gyuranecz, 2016). Tularaemia is therefore a disease with a multifaceted epidemiology; it is therefore difficult to control, and appropriate preventive measures are currently difficult to evaluate. All these aspects underline the importance of collaboration between public health and veterinary units for the control of this zoonotic disease.
6.5. Related projects and Internet sources
7. Other zoonoses and zoonotic agents
Tables and figures that are not presented in this chapter are published as supporting information to this report and are available as downloadable files from the EFSA Knowledge Junction on Zenodo at https://doi.org/10.5281/zenodo.5682809.
In 2020, data on Bacillus, Chlamydia, Clostridium, Cysticercus, Enterococcus, Klebsiella, hepatitis A virus, calicivirus, Leishmania, Leptospira, marine biotoxins, non‐pathogenic Escherichia coli, Proteus, Sarcocystis, Shigella, Staphylococcus, Streptococcus, tick‐borne encephalitis virus and Vibrio, among others, were reported to EFSA.
7.1. Bacillus spp.
Lithuania submitted 2020 data on Bacillus spp. in food (N = 15), and Bulgaria and Greece in animals (N = 29). Greece reported 13 (59.1%) positives in cattle, goats and sheep collected at the farm level during clinical investigations out of 22 animals tested. Lithuania and Bulgaria reported no positive samples.
7.2. Chlamydia spp.
Austria and the non‐MS North Macedonia reported data on Chlamydia spp. in various animal species. Austria reported 155 (2.9%) positives out of 5,400 samples, and North Macedonia reported 31 (57.4%) positives out of 54 samples.
7.3. Clostridium spp.
Greece, Lithuania and the non‐MS North Macedonia reported data on Clostridium spp. from various animals. Greece obtained 45 animal samples on farms during clinical investigations, whereof 18 were positive. None of the 27 food samples collected by Lithuania at food catering services, processing plants or slaughterhouses were positive. None of the 256 food samples collected by North Macedonia were positive, but Clostridium perfringens was detected in one animal sample collected during passive monitoring at the farm level.
7.4. Hepatitis A virus
Bulgaria, France and Romania provided data on hepatitis A virus monitoring in fruits and vegetables collected at retail establishments, processing plants, wholesale establishments and border control posts. None of the 404 tested samples were positive.
7.5. Norovirus (calicivirus)
Bulgaria, Croatia, France, Portugal and Romania tested 814 samples of ‘fruits’ and ‘vegetables’ for caliciviruses, whereof nine (1.1%) were positive.
7.6. Proteus spp.
Greece reported data from 171 animal samples (from cattle, goats and sheep) collected during clinical investigations, whereof overall 13 (7.6%) were positive for Proteus spp.
7.7. Staphylococcus spp. and staphylococcal enterotoxins
Four MS (Bulgaria, Greece, Italy and Poland) provided data on Staphylococcus spp. (reported as Staphylococcus unspecified or S. aureus) in various animals (N = 1,004) and food matrices (N = 6,095). Overall, 35.8% from animals and 11.7% from food were reported positive. ‘Milk from other animal species or unspecified – pasteurised milk’, ‘cheese made from unspecified milk or other animal milk – unspecified’ and ‘other processed food products and prepared dishes – pasta’ were the food categories with the highest numbers of positive results.
Eleven MS (Bulgaria, Cyprus, Czechia, Estonia, Germany, Italy, Portugal, Romania, Slovakia, Slovenia and Spain) reported data on staphylococcal enterotoxins collected in contexts other than the framework of Regulation (EC) No 2073/2005. From an overall total of 267 batches tested, one was positive and was from ‘ice cream and similar frozen desserts’ collected at a ‘processing plant’ during an official sampling programme in Slovakia. Sixteen out of the 3,835 single samples collected from different foods were positive. Staphylococcal enterotoxins were found in samples of ‘milk from other animal species or unspecified – pasteurised’, ‘cheeses’, ’ready‐to‐eat salads’, ‘other processed food products and prepared dishes’, ‘cakes’ and ‘egg products’.
7.8. Tick‐borne encephalitis virus
Slovenia provided data on tick‐borne encephalitis virus monitoring from raw goats’ and sheep’s milk. None of the 19 tested batches were positive.
7.9. Cysticercus spp.
Eight MS (Belgium, Finland, Luxembourg, Malta, Slovakia, Slovenia, Spain and Sweden) submitted data on Cysticercus spp. in various animal species. Data were collected at slaughterhouses (N = 64,117,417), game handling establishments (N = 193,790), hunting establishments (N = 3,935) and on farms (N = 6,534). Belgium collected 785,559 bovine carcases from slaughterhouses and found 1,138 positive samples (0.145%). None of the 2,179,846 carcases from cattle, pigs or wild boars collected by Finland were positive. Luxembourg found 52 positive bovine carcases out of 26,575 collected samples (0.196%). None of the 66,070 cattle, goat or sheep carcases collected by Malta were positive. Slovakia reported four positive pig carcases out of 689,446 collected samples, but no positives were found from tests on 36,656 cattle carcases. Slovenia provided results on 118,245 cattle and 245,921 pig carcases, detecting 10 positives in cattle carcases (0.008%). Sweden found no positives out of 434,450 cattle and 2,622,800 pig carcases. Spain provided data on Cysticercus spp. in various animal species: 214 out of 2,420,563 cattle (0.009%), 15,772 out of 933,337 goats (1.7%), 3,189 out of 46,007,287 pigs (0.007%), 192,692 out of 7,549,509 sheep (2.55%), 94 out of 7,687 other domestic solipeds (1.22%), as well as 47 out of 100,232 (0.47%) wild boars were positive. No positives were found upon testing 92,260 deer and 5,233 mouflons.
Overall, almost all positive samples (213,163 out of 213,212) were collected at the slaughterhouse level.
7.10. Leishmania
Greece and North Macedonia provided data on Leishmania in pet dogs and stray dogs. Greece found 109 (7.7%) positive blood samples out of 1,410, and North Macedonia reported 1,313 positives (34.1%) out of 3,852.
7.11. Sarcocystis spp.
Belgium reported data from 785,559 cattle samples collected at the slaughterhouse, whereof 65 (0.008%) were positive for Sarcocystis spp.
7.12. Other
Bulgaria provided data on non‐pathogenic E. coli and Enterococcus spp. in various food matrices and potable water, respectively. None of the 1,039 collected samples were positive. Greece reported data on Klebsiella spp. monitoring, with no positives from 76 cattle and 33 goats’ milk samples collected at the farm level. For Leptospira spp., Bulgaria and Slovenia collected 322 samples from cattle, pigs, dogs and domestic solipeds, with no positives. Data on monitoring of Shigella spp. in meat preparations and ready‐to‐eat salads were provided by Greece, with no positives of out of five tested samples. Greece also reported data on Streptococcus spp. in dairy, goats’ and sheep’s milk collected at the farm level, detecting 44 positives out of 200 tested samples. The Netherlands provided data on Vibrio spp. in cooked shrimp and fish products collected at border control posts, and in leaf vegetables collected at the retail and wholesale levels. None of the 169 vegetable samples were positive, but 35 of out 382 samples of fish and crustaceans were positive. Bulgaria provided data on marine biotoxins in live bivalve molluscs and frozen shelled and raw molluscs, with no positives of out 70 tested samples.
Microbiological contaminants subject to food safety criteria (Regulation (EC) No 2073/2005)
Tables that are not presented in this chapter are published as supporting information to this report and are available as downloadable files from the EFSA Knowledge Junction on Zenodo at https://doi.org/10.5281/zenodo.5682809.
This chapter summarises the 2020 information and data provided by reporting countries on microbiological contaminants in food, histamine, staphylococcal enterotoxins and Cronobacter sakazakii, for which food safety criteria (FSC) have been set down in EU legislation (Regulation (EC) No 2073/2005).
1. Histamine
Histamine is a biogenic amine involved in important physiological functions of the human body. However, its ingestion at high concentrations through food is associated with the onset of health disorders such as scombroid poisoning.
Regulation (EC) No 2073/2005 on microbiological criteria for foodstuffs defines FSC for histamine in food at the retail level in three categories: ‘fishery products from fish species associated with a high amount of histidine’ (food category 1.26), ‘fishery products which have undergone enzyme maturation treatment in brine, manufactured from fish species associated with a high amount of histidine’ (food category 1.27), and ‘fish sauce produced by fermentation of fishery products’ (food category 1.27a). Data on histamine in the aforementioned food categories were reported by 18 MS (Austria, Belgium, Bulgaria, Croatia, Czechia, Denmark, Estonia, France, Germany, Ireland, Italy, Latvia, Lithuania, Portugal, Romania, Slovakia, Slovenia and Spain) and two non‐MS (Iceland and Serbia).
In official control samples (n = 2,637) for histamine in food category 1.26 at the distribution level (wholesale establishments, retail establishments, border control posts and restaurants), 0.46% had a histamine content higher than 200 mg/kg, 0.38% a histamine content between 100 and 20 mg/kg and 70.42% a histamine content above the limit of detection, but less than or equal to 100 mg/kg. An EU origin (Romania, Spain, the Netherlands, Ireland, Norway) was reported for 16% of sample units, 11% were of non‐EU origin (Vietnam, Indonesia, non‐EU countries), whereas for 72%, no information was available. Fish species information (tuna, mackerel, sardine and escolar) was reported by Denmark for 99 samples (3.75%). At the manufacturing level (processing plants, packaging centres), 1,337 official control sampling units were collected and the results were as follows: 0.8% had a histamine amount higher than 200 mg/kg, 0.29% a histamine content between 100 and 20 mg/kg, and 73.24% a histamine content higher than the limit of detection, but less than or equal to 100 mg/kg. An EU origin was reported for 24.83% of samples (Romania, Greenland, Denmark, Estonia, Portugal), 3.26% were of non‐EU origin and, for 71.75%, no information was reported. The fish species was mentioned in 9.15% of the sample units (mackerel, herring).
For food category 1.27, 442 and 148 official control sample units were collected at the distribution and manufacturing level, respectively. At the distribution level, 63.35% of the samples had a histamine concentration less than or equal to 200 mg/kg and, at the manufacturing level, that percentage was 70.95%. An EU origin was indicated for 6.1% and 33.1% samples at the distribution and manufacturing level, respectively; 26.4% of the samples were of non‐EU origin at the distribution level.
For food category 1.27a, Spain reported 19 units at the manufacturing level and 18 units at the distribution level. All samples had a histamine content lower than 400 mg/kg. All official sample units were collected as part of official surveillance activity.
2. Staphylococcal enterotoxins
Data on staphylococcal enterotoxins collected in the context of Regulation (EC) No 2073/2005 were reported by four MS (Croatia, Estonia, Romania and Spain). No positives were found in 1,269 samples collected at the distribution level (wholesale establishments and retail establishments). Out of 723 tested samples, only one sample (0.138%) of goat cheese made from raw or low‐heat‐treated milk collected at the processing plant in Spain was positive.
3. Cronobacter sakazakii
Cronobacter sakazakii in infant formula and dietary foods for special medical purposes was reported by six MS (Estonia, Hungary, Luxembourg, Slovakia, Slovenia and Spain). No positives were found in 91 samples collected at the processing plant and 244 at the distribution level (235 samples collected at retail establishments and nine at wholesale establishments).
Abbreviations
- ADIS
Animal Disease Information System
- ADNS
Animal Disease Notification System
- AE
Alveolar echinococcosis
- AHAW
EFSA Panel on Animal Health and Welfare
- aw
Water activity
- BIOHAZ
EFSA Panel on Biological Hazards
- BTM
Bulk tank milk
- CA
Competent authority
- CE
Cystic echinococcosis
- CFT
Complement fixation test
- CFU
Colony forming unit
- cgMLST
Core genome Multilocus sequence typing
- CHC
Controlled housing conditions
- CONTAM
EFSA Panel on Contaminants in the Food Chain
- COVID‐19
Coronavirus Disease 2019
- DA
Direct agglutination
- DCF
Data Collection Framework
- DHs
Definitive hosts
- EBLV
European bat lyssavirus
- ECDC
European Centre for Disease Prevention and Control
- EEA
European Economic Area
- EFSA
European Food Safety Authority
- EFTA
European Free Trade Association
- Egsl
Echinococcus granulosus sensu lato
- ELISA
Enzyme‐linked immunosorbent assay
- Em
Echinococcus multilocularis
- EQA
external quality assessment
- ERCE
European Register of Cystic Echinococcosis
- ESRI
Environmental Systems Research Institute
- EU
European Union
- EU‐FORS
European Union Foodborne reporting System
- EUOHZ
European Union One Health Zoonoses Report
- EurEchino
Reg European (Alveolar) Echinococcosis Registry
- EURL
European Union Reference Laboratory
- EVD
Emerging and Vector‐borne Disease
- EVD‐LabNet
Emerging Viral Diseases‐Expert Laboratory Network
- FAO
Food and Agriculture Organization
- FBO
Foodborne outbreak
- FBOp
Food business operator
- FNAO
Food of non‐animal origin
- FSC
Food safety criteria
- FWD
Foodborne and waterborne disease
- g
gram
- GAPs
Good Agricultural Practices
- GMP
Good Manufacturing Practices
- GP
Good Practices
- HACCP
Hazard analysis and critical control point
- HC
Hard cheeses
- HERACLES
Human cystic Echinococcosis ReseArch in CentraL and Eastern Societies
- HUS
Haemolytic–uraemic syndrome
- i‐ELISA
Indirect enzyme‐linked immunosorbent assay
- IFA
Immunofluorescence assay
- IHC
Immunohistochemistry
- IHs
Intermediate hosts
- ISO
International Organization for Standardization
- IZSAM
Istituto Zooprofilattico Sperimentale Abruzzo e Molise
- JEMRA
Joint FAO/WHO Expert Meeting on Risk Assessment
- LAT
Latex agglutination test
- LHT
Low heat‐treated
- MALDI-TOF MS
matrix-assisted laser desorption/ionisation, time-offlight mass spectrometry
- MS
Member State
- MSM
Mechanically separated meat
- N
Number
- NACMCF
National Advisory Committee on Microbiological Criteria for Foods
- NCP
National control programmes
- NMKL
Nordic Committee on Food Analysis
- NPHRL
National Public Health Reference Laboratories
- NRCHC
Not raised under controlled housing conditions
- NT
Not typable
- OBF
Official brucellosis‐free in cattle
- ObmF
Official Brucella melitensis‐free in sheep and goats
- OIE
World Organisation for Animal Health
- ORV
Oral rabies vaccination
- OTF
Official tuberculosis‐free in cattle
- PCR
Polymerase chain reaction
- PFGE
Pulsed‐field Gel Electrophoresis
- PHC
Process hygiene criteria
- RABV
Rabies virus
- RCHC
Raised under controlled housing conditions
- ROA
Rapid Outbreak Assessments
- ROC
receiver operating characteristic
- RTE
Ready‐to‐eat
- RT‐PCR
Reverse transcriptase‐polymerase chain reaction
- s.l.
sensu lato
- SoHO
Substances of Human Origin
- SSC
Semi‐soft cheeses
- STEC
Shiga toxin‐producing Escherichia coli
- TB,
Tuberculosis
- TBE
Tick‐borne encephalitis
- TESSy
The European Surveillance System
- VTEC
Verocytotoxigenic Escherichia coli
- WAHIS
World Animal Health Information System
- WB
Western blot
- WCBV
West Causasian Bat Lyssavirus
- WGS
Whole‐genome sequencing
- WHO
World Health Organisation
- WNF
West Nile fever
- WNV
West Nile virus
- WNND
West Nile neuroinvasive disease
Country codes
- Albania
AL
- Austria
AT
- Belgium
BE
- Bosnia and Herzegovina
BA
- Bulgaria
BG
- Croatia
HR
- Cyprus
CY
- Czechia
CZ
- Denmark
DK
- Estonia
EE
- Finland
FI
- France
FR
- Germany
DE
- Greece
GR
- Hungary
HU
- Iceland
IS
- Ireland
IE
- Italy
IT
- Latvia
LV
- Liechtenstein
LI
- Lithuania
LT
- Luxembourg
LU
- Malta
MT
- Montenegro
ME
- Netherlands
NL
- North Macedonia
MK
- Norway
NO
- Poland
PL
- Portugal
PT
- Romania
RO
- Serbia
RS
- Slovakia
SK
- Slovenia
SI
- Spain
ES
- Sweden
SE
- Switzerland
CH
- United Kingdom
UK
Appendix A – Number of tested samples for Listeria monocytogenes for the main ready‐to‐eat (RTE) food categories, by reporting MS and non‐MS, 2020
| Country | RTE milk and milk products | RTE fish and fishery products | RTE meat and meat products | Other RTE products | RTE food intended for infants and for medical purposes |
|---|---|---|---|---|---|
| Austria | 980 | 160 | 678 | 1,251 | 1 |
| Belgium | 2,353 | 694 | 2,397 | 1,039 | 337 |
| Bulgaria | 5,424 | 416 | 1,618 | 699 | 1 |
| Croatia | 558 | 80 | 662 | 171 | 1 |
| Cyprus | 360 | 18 | 137 | 337 | 10 |
| Czechia | 93 | 38 | 73 | 438 | 9 |
| Denmark | – | 230 | 20 | 5 | 20 |
| Estonia | 65 | 170 | 180 | 100 | 13 |
| Finland | – | – | – | – | – |
| France | 989 | 1,141 | 1,507 | 2,147 | 25 |
| Germany | 5,724 | 1,427 | 6,490 | 5,943 | 245 |
| Greece | 507 | 51 | 173 | 60 | – |
| Hungary | 1,296 | 160 | 710 | 1,407 | 58 |
| Ireland | 653 | 160 | 997 | 1,221 | 184 |
| Italy | 11,310 | 599 | 5 | 715 | 92 |
| Latvia | 50 | 145 | 135 | 25 | – |
| Lithuania | 55 | – | – | 25 | – |
| Luxembourg | 2 | 25 | 403 | 513 | – |
| Malta | – | – | – | – | – |
| Netherlands | 3,902 | 1,945 | 602 | 1,236 | 106 |
| Poland | – | – | – | – | – |
| Portugal | 194 | 36 | 55 | 808 | 20 |
| Romania | 9,436 | 1,623 | 17,081 | 11,005 | 10 |
| Slovakia | 2,118 | 165 | 1,986 | 1,582 | 427 |
| Slovenia | 49 | 30 | 80 | 199 | 10 |
| Spain | 3,000 | 1,821 | 3,872 | 3,478 | 191 |
| Sweden | 14 | 5 | – | 50 | – |
| EU Total | 49,132 | 11,139 | 39,861 | 34,454 | 1,760 |
| Albania | 1 | 2 | 2 | – | 1 |
| Iceland | – | 5 | – | – | – |
| Montenegro | 4,350 | – | 75 | 10 | – |
| North Macedonia | 250 | – | 70 | 5 | – |
| Serbia | 412 | 38 | 360 | 75 | – |
| Switzerland | 710 | – | – | – | – |
| Total non‐EU countries | 5,723 | 45 | 507 | 90 | 1 |
| Total EU + non‐EU countries | 54,855 | 11,184 | 40,368 | 34,544 | 1,761 |
MS: Member States; RTE: ready‐to‐eat; –: no data available.
For each food category, the numbers of samples reported in the table were obtained without exclusion criteria.
Appendix B – Occurrence of Listeria monocytogenes at all sampling stages combined in ready‐to eat (RTE) food categories using a detection method, EU, 2018–2020
| RTE food category | Food subcategories | Sampling unit | 2018 a | 2019 a | 2020 | |||
|---|---|---|---|---|---|---|---|---|
| N tested samples | Positive samples (%) | N tested samples | Positive samples (%) | N tested samples | Positive samples (%) | |||
| Fish and fishery products | Fish | Batch | 122 | 3.3 | 22 | 0 | 124 | 1.6 |
| Single | 3,980 | 2.5 | 3,775 | 4.3 | 2,521 | 4.4 | ||
| Fishery products | Batch | 420 | 0.24 | 25 | 0 | 113 | 2.7 | |
| Single | 1,753 | 3.6 | 2,472 | 3.7 | 1,606 | 4.2 | ||
| Milk | Pasteurised | Batch | 60 | 0 | 144 | 0 | 153 | 0 |
| Single | 997 | 0 | 813 | 0.12 | 297 | 0 | ||
| UHT | Batch | – | – | – | – | 5 | 0 | |
| Single | 15 | 0 | 99 | 0 | 64 | 0 | ||
| Raw, intended for direct human consumption | Batch | 55 | 1.82 | 144 | 0.69 | 132 | 0 | |
| Single | 276 | 6.2 | 44 | 0 | 336 | 1.5 | ||
| Hard cheeses from pasteurised milk | From cow milk | Batch | 2,431 | 0.16 | 1,912 | 0.10 | 2,031 | 0.30 |
| Single | 912 | 0.11 | 1,183 | 0 | 805 | 0 | ||
| From goat milk | Batch | 15 | 0 | 107 | 0 | 8 | 0 | |
| Single | 22 | 0 | 100 | 0 | 42 | 0 | ||
| From sheep milk | Batch | 9 | 0 | 4 | 0 | 20 | 0 | |
| Single | 18 | 0 | 30 | 0 | 45 | 6.7 | ||
| Hard cheeses from raw or low heat‐treated milk | From cow milk | Batch | 460 | 2.0 | 541 | 0.55 | 542 | 1.1 |
| Single | 313 | 3.2 | 727 | 1.1 | 516 | 0 | ||
| From goat milk | Batch | – | – | – | – | – | – | |
| Single | 22 | 0 | 29 | 3.5 | 34 | 0 | ||
| From sheep milk | Batch | – | – | – | – | 5 | 0 | |
| Single | 94 | 5.3 | 170 | 3.5 | 240 | 5.4 | ||
| Soft and semi‐soft cheeses from pasteurised milk (including fresh cheese) | From cow milk | Batch | 147 | 0 | 172 | 0 | 71 | 0 |
| Single | 2,718 | 0.33 | 1,355 | 0.59 | 844 | 1.1 | ||
| From goat milk | Batch | 21 | 0 | 17 | 0 | 32 | 0 | |
| Single | 258 | 0 | 25 | 0 | 61 | 0 | ||
| From sheep milk | Batch | 25 | 0 | 19 | 0 | 23 | 0 | |
| Single | 130 | 0 | 45 | 0 | 40 | 0 | ||
| Soft and semi‐soft cheeses from raw or low heat‐treated milk (including fresh cheese) | From cow milk | Batch | 135 | 0.74 | 130 | 0 | 82 | 0 |
| Single | 322 | 1.2 | 651 | 1.4 | 878 | 0.46 | ||
| From goat milk | Batch | – | – | – | – | – | – | |
| Single | 21 | 0 | 42 | 0 | 27 | 0 | ||
| From sheep milk | Batch | – | – | – | – | – | – | |
| Single | 162 | 0.62 | 164 | 0 | 127 | 3.1 | ||
| Meat products | From bovine animals | Batch | 7 | 0 | 3 | 0 | 12 | 0 |
| Single | 1,075 | 3.3 | 1,240 | 4.3 | 844 | 7.5 | ||
| From broilers | Batch | – | – | – | – | 11 | 0 | |
| Single | 664 | 1.2 | 803 | 2.0 | 291 | 0.69 | ||
| From turkeys | Batch | 142 | 0 | 3 | 0 | 5 | 0 | |
| Single | 116 | 0.86 | 125 | 1.6 | 157 | 0.64 | ||
| From pigs | Batch | 1,326 | 5.0 | 127 | 4.7 | 115 | 0 | |
| Single | 14,644 | 1.6 | 13,908 | 4.2 | 6,470 | 3.0 | ||
| Other RTE products | Salads b | Batch | 69 | 2.9 | 47 | 0 | 99 | 1.0 |
| Single | 2,352 | 1.4 | 2,993 | 3.6 | 2,664 | 2.3 | ||
| Bakery products c | Batch | 40 | 0 | 22 | 0 | 3 | 0 | |
| Single | 2,811 | 0.14 | 3,202 | 0.34 | 2,563 | 0.55 | ||
| Fruits & Vegetables d | Batch | 41 | 0 | 66 | 0 | 17 | 0 | |
| Single | 944 | 2.4 | 1,717 | 2.3 | 1,857 | 2.9 | ||
| Sauces & dressings e | Batch | 1 | 0 | – | – | – | – | |
| Single | 33 | 0 | 83 | 0.12 | – | – | ||
| Egg products | Batch | 3 | 0 | 3 | 0 | 6 | 0 | |
| Single | – | – | 23 | 0 | 1 | 0 | ||
| Confectionery products & pastes f | Batch | – | – | 3 | 0 | 2 | 0 | |
| Single | 61 | 0 | 37 | 0 | 28 | 0 | ||
| Spices & herbs g | Batch | 2 | 0 | 2 | 0 | 1 | 0 | |
| Single | 38 | 0 | 139 | 1.4 | 113 | 0 | ||
| Other processed food products & prepared dishes | Batch | 165 | 0.61 | 252 | 0 | 123 | 0 | |
| Single | 1,168 | 1.4 | 10,585 | 1.1 | 10,365 | 0.39 | ||
Data reported by the United Kingdom in years 2016–2019 were also considered for these estimates (EU‐28). When 2016–2019 UK data were collected, the UK was an EU MS but since 1 February 2020, it has become a third country.
Includes RTE salads (containing mayonnaise).
Includes bread, cakes, desserts and pastry.
Includes fruits: edible part, pre‐cut, products, fruits and vegetables: pre‐cut, products, juice: fruit juice, mixed juice, vegetable juice and vegetables: pre‐cut, products.
Includes sauces and dressings (containing mayonnaise).
Includes confectionery products and pastes such as chocolate‐based product and soft and hard candy.
Includes spices and herbs, either dried, fresh or frozen.
Appendix C – Atlas of STEC serogroups in food and animals, in reporting Member States, 2016–2020

Note: The presence and absence of STEC serogroups in food (left) and animals (right). Proportions of STEC serogroups: red boxes > 1%, orange boxes > 0.1% and ≤ 1%, yellow boxes > 0.0001% and ≤ 0.1% of positive samples. White boxes indicate the absence of the serogroup.
Appendix D – Atlas of STEC serogroups in food and animals, in reporting Member States, 2020

Note: The presence and absence of STEC serogroups in food (left) and animals (right). Proportions of STEC serogroups: red boxes > 1%, orange boxes > 0.1% and ≤ 1%, yellow boxes > 0.0001% and ≤ 0.1% of positive samples. White boxes indicate the absence of the serogroup.
Appendix E – Atlas of STEC serogroups in food, by reporting country, 2020

Note: The presence and absence of STEC serogroups in food (left) and animals (right). Proportions of STEC serogroups: red boxes > 1%, orange boxes > 0.1% and ≤ 1%, yellow boxes > 0.0001% and ≤ 0.1% of positive samples. White boxes indicate the absence of the serogroup.
Appendix F – Monthly distribution of animal outbreaks of West Nile virus infections by month, EU MS, in 2020 and 2015–2019

Data source: ADNS for animal outbreaks. Outbreaks in birds or equids that were not notified to ADNS are not included.
Appendix G – Analysis of trends for each EU MS in equids and birds over the last 5 years, reporting EU MS, 2015–2020

Data source: ADNS for animal outbreaks. Outbreaks in birds or equids that were not notified to ADNS are not included.
Suggested citation: EFSA and ECDC (European Food Safety Authority and European Centre for Disease Prevention and Control ), 2021. The European Union One Health 2020 Zoonoses Report. EFSA Journal 2021;19(12):6971, 324 pp. 10.2903/j.efsa.2021.6971
Requestor: European Commission
Question number: EFSA‐Q‐2020‐00787
Declarations of interest: The declarations of interest of all scientific experts active in EFSA’s work are available at https://ess.efsa.europa.eu/doi/doiweb/doisearch.
Acknowledgements: EFSA and the ECDC wish to thank the members of the EFSA Scientific Network for Zoonoses Monitoring Data and of the ECDC Food and Waterborne Diseases and Zoonoses Network, the ECDC Emerging and Vector‐borne Diseases Network and the ECDC Tuberculosis Network, who provided the data and reviewed the report; the members of the Scientific Network for Zoonoses Monitoring Data for their endorsement of this scientific report; the EFSA staff members (Frank Boelaert, Giusi Amore, Winy Messens, Michaela Hempen, Valentina Rizzi, Anca Stoicescu, Sotiria‐Eleni Antoniou, Inma Aznar Asensio, Francesca Baldinelli and Sofie Dhollander), the ECDC staff members (Taina Niskanen, Joana Haussig, Marlena Kaczmarek and Joana Gomes Dias) and the EFSA and ECDC contractor: Istituto Superiore di Sanità (Gaia Scavia, Ilaria Altieri, Fabrizio Anniballi, Antonino Bella, Simone Cacciò, Adriano Casulli, Alessandra Ciervo, Elisabetta Delibato, Maria Grazia Dente, Michele Luca D'Errico, Aurora Garcia Fernandez, Arnold Knijn, Maria Angeles Gomez Morales, Francesca Iacoponi, Marco Lalle, Claudia Lucarelli, Massimiliano Francia, Stefano Morabito, Marco Ortoffi, Paolo Pasquali, Pierfrancesco Barbariol, Flavia Riccardo, Elisabetta Suffredini, Rosangela Tozzoli, Laura Villa); Istituto Zooprofilattico delle Venezie (Lisa Barco, Giorgia Angeloni, Simone Belluco, Katia Capello, Paola De Benedictis, Tiziano Dorotea, Laura Gagliazzo, Annie Ishebabi, Elena Lazzaro, Monica Lorenzetto, Grazia Manca, Marzia Mancin, Claudio Mantovani, Martina Simonato, Marica Toson); the French Agency for Food, Environmental and Occupational Health & Safety (Christophe Cordevant, Cécile Beck, Radu Blaga, Maria Laura Boschiroli, Florence Cliquet, Emmanuelle Robardet, Corinne Danan, Benjamin Felix, Mélanie Gay, Caroline Le Marechal, Claire Ponsart, Dana Pottratz, Elodie Rousset, Aurélie Couesnon, Isabelle Vallée, Stephan Zientara); Istituto Zooprofilattico Sperimentale dell'Abruzzo e del Molise ‘G. Caporale’ (Paolo Calistri, Enrico De Albentiis, Fabrizio De Massis, Giuliano Garofolo, Francesco Pomilio); Istituto Zooprofilattico Sperimentale della Lombardia ed Emilia Romagna B. Ubertini – IZSLER (Maria Lodovica Pacciarini, Nadia Vicari) for the support provided to this scientific report.
Approved: 12 November 2021
This article was originally published on the EFSA website http://www.efsa.europa.eu on 9 December 2021 as part of EFSA’s publication procedures.
Notes
Directive 2003/99/EC of the European Parliament and of the Council of 17 November 2003 on the monitoring of zoonoses and zoonotic agents, amending Council Decision 90/424/EEC and repealing Council Directive 92/117/EEC. OJ L 325, 12.12.2003 p. 31–40.
See mandate M‐2015‐0231 within OpenEFSA Question: https://open.efsa.europa.eu/questions/EFSA-Q-2020-00787
Decision No. 1082/2013/EU of the European Parliament and of the Council of 22 October 2013 on serious cross‐border threats to health and repealing Decision No 2119/98/EC. OJ L 293, 5.11.2013, p. 1–15.
Commission Implementing Decision 2018/945/EU on the communicable diseases and related special health issues to be covered by epidemiological surveillance as well as relevant case definitions. OJ L 170, 6.7.2018, p. 1–74.
Agreement on the withdrawal of the United Kingdom of Great Britain and Northern Ireland from the European Union and the European Atomic Energy Community. OJ L 29, 31.1.2020, p. 7 (‘Withdrawal Agreement’).
Based on the customs union treaty of the Principality of Liechtenstein with Switzerland, Liechtenstein is part of the Swiss customs territory. Due to the strong connection between the veterinary authorities of Liechtenstein and Switzerland, and Liechtenstein’s integration into the Swiss system in the veterinary field, in principal, all legislation, rules and data on contagious diseases are identical for both Switzerland and Liechtenstein. If not mentioned otherwise, the Swiss data also include the data from Liechtenstein.
Commission Regulation (EC) No 2073/2005 of 15 November 2005 on microbiological criteria for foodstuffs OJ L 338, 22.12.2005, p. 1–26.
Commission Implementing Regulation (EU) 2019/627 of 15 March 2019, laying down uniform practical arrangements for the performance of official controls on products of animal origin intended for human consumption in accordance with Regulation (EU) 2017/625 of the European Parliament and of the Council and amending Commission Regulation (EC) No 2074/2005 as regards official controls. OJ L 131, 17.5.2019, p. 51–100.
This means official sampling using the same method and sampling area as food business operators. At least 49 random samples shall be taken in each slaughterhouse each year. The number of samples may be reduced in small slaughterhouses and based on a risk evaluation.
Directive 2003/99/EC of the European Parliament and of the Council of 17 November 2003 on the monitoring of zoonoses and zoonotic agents, amending Council Decision 90/424/EEC and repealing Council Directive 92/117/EEC. OJ L 325, 12.12.2003, p. 31–40.
Regulation (EC) No 852/2004 of the European Parliament and of the Council of 29 April 2004 on the hygiene of foodstuffs. OJ L 139, 30.4.2004, p. 1–54.
Commission Regulation (EU) No 1086/2011 of 27 October 2011 amending Annex II to Regulation (EC) No 2160/2003 of the European Parliament and of the Council and Annex I to Commission Regulation (EC) No 2073/2005 as regards salmonella in fresh poultry meat Text with EEA relevance. OJ L 281, 28.10.2011, p. 7–11.
Regulation (EC) No 853/2004 of the European Parliament and of the Council of 29 April 2004 laying down specific hygiene rules for food of animal origin. OJ L 139, 30.4.2004, p. 55–205.
Regulation (EC) No 2160/2003 of the European Parliament and of the Council of 17 November 2003 on the control of salmonella and other specified foodborne zoonotic agents. OJ L 325, 12.12.2003, p. 1–15.
Commission Regulation (EU) No 200/2010 of 10 March 2010 implementing Regulation (EC) No 2160/2003 of the European Parliament and of the Council as regards a Union target for the reduction of the prevalence of Salmonella serotypes in adult breeding flocks of Gallus gallus (Text with EEA relevance). OJ L 61, 11.3.2010, p. 1–9.
Commission Regulation (EU) No 200/2012 of 8 March 2012 concerning a Union target for the reduction of Salmonella Enteritidis and Salmonella Typhimurium in flocks of broilers, as provided for in Regulation (EC) No 2160/2003 of the European Parliament and of the Council Text with EEA relevance. OJ L 71, 9.3.2012, p. 31–36.
Commission Regulation (EU) No 1190/2012 of 12 December 2012 concerning a Union target for the reduction of Salmonella Enteritidis and Salmonella Typhimurium in flocks of turkeys, as provided for in Regulation (EC) No 2160/2003 of the European Parliament and of the Council Text with EEA relevance. OJ L 340, 13.12.2012, p. 29–34.
Commission Regulation (EU) No 517/2011 of 25 May 2011 implementing Regulation (EC) No 2160/2003 of the European Parliament and of the Council as regards a Union target for the reduction of the prevalence of certain Salmonella serotypes in laying hens of Gallus gallus and amending Regulation (EC) No 2160/2003 and Commission Regulation (EU) No 200/2010. OJ L 138, 26.5.2011, p. 45–51.
Also known as verotoxigenic, verocytotoxigenic, verotoxin‐producing, verocytotoxin‐producing E. coli (VTEC).
The EU Animal Disease Notification System has been replaced by the EU Animal Diseases Information System (ADIS) since 21 April 2021. More information is available at https://ec.europa.eu/food/animals/animal-diseases/animal-disease-information-system-adis_en
PAFF Committee meeting, Brussels, 15 July 2020. Available online: https://ec.europa.eu/food/system/files/2020-10/reg-com_ahw_20200715_pres_bov-tb_ire.pdf
(a) For Greece, the programme for sheep and goat brucellosis is only accepted for the vaccination part.
Commission Implementing Regulation (EU) 2015/1375 of 10 August 2015 laying down specific rules on official controls for Trichinella in meat (text with EEA relevance). OJ L 212, 11.8.2015, pp. 7–34.
Poland reported that 63 pigs and 508 wild boar tested positive for Trichinella infection; however, these data were not considered for this report because information regarding the total number of animals tested, animal category and housing conditions were not specified and not reported to the EFSA database.
Commission Delegated Regulation (EU) 2018/772 of 21 November 2017 supplementing Regulation (EU) No 576/2013 of the European Parliament and of the Council with regard to preventive health measures for the control of Echinococcus multilocularis infection in dogs and repealing Delegated Regulation (EU) No 1152/2011 C/2017/7619 OJ L 130, 28.5.2018, pp. 1–10.
For further information on Salmonella serovars included in the historically designated group B and group D, see D Grimont, P.A.D. and Weill, F‐X., 2007. Antigenic formulae of the Salmonella serovars, 9th ed. WHO Collaborating Centre for Reference and Research on Salmonella. Institute Pasteur, Paris, France. https://www.pasteur.fr/sites/default/files/veng_0.pdf
Additional information from the Italian reference centre for Toxoplasma spp.: ‘A real time PCR test was carried out on raw bulk milk from a cattle herd with a history of abortions. No other analyses for the diagnosis of toxoplasmosis were performed either on the affected cows or on the aborted foetuses.’
Regulation (EU) No 652/2014 of the European Parliament and of the Council of 15 May 2014 laying down provisions for the management of expenditure relating to the food chain, animal health and animal welfare, and relating to plant health and plant reproductive material, amending Council Directives 98/56/EC, 2000/29/EC and 2008/90/EC, Regulations (EC) No 178/2002, (EC) No 882/2004 and (EC) No 396/2005 of the European Parliament and of the Council, Directive 2009/128/EC of the European Parliament and of the Council and Regulation (EC) No 1107/2009 of the European Parliament and of the Council and repealing Council Decisions 66/399/EEC, 76/894/EEC and 2009/470/EC. OJ L 189, 27.6.2014, pp. 1–32.
Commission Delegated Regulation (EU) 2020/689 of 17 December 2019 supplementing Regulation (EU) 2016/429 of the European Parliament and of the Council as regards rules for surveillance, eradication programmes, and disease‐free status for certain listed and emerging diseases.
Commission Implementing Regulation (EU) No 577/2013 of 28 June 2013 on the model identification documents for the non‐commercial movement of dogs, cats and ferrets, the establishment of lists of territories and third countries and the format, layout and language requirements of the declarations attesting compliance with certain conditions provided for in Regulation (EU) No. 576/2013 of the European Parliament and of the Council. OJ L 178, 28.6.2013, pp. 109–148.
The EU Animal Disease Notification System has been replaced by the EU Animal Diseases Information System (ADIS) since 21 April 2021. More information is available at: https://ec.europa.eu/food/animals/animal-diseases/animal-disease-information-system-adis_en
(i) Comprehensive: All healthcare providers of at least one level of care in a defined geographical area, e.g. all general practitioners of the region, should report their cases. See: https://www.eurosurveillance.org/content/10.2807/1560-7917.ES.2020.25.27.1900708
Directive 2003/99/EC of the European Parliament and of the Council of 17 November 2003 on the monitoring of zoonoses and zoonotic agents, amending Council Decision 90/424/EEC and repealing Council Directive 92/117/EEC http://data.europa.eu/eli/dir/2003/99/oj
Council Directive 82/894/EEC of 21 December 1982 on the notification of animal diseases within the Community http://data.europa.eu/eli/dir/1982/894/oj
Definitions of the terms ‘outbreak’ and ‘case’ (Article 4 Directive 82/894): ‘outbreak’ means the holding or place situated in the territory of the Community where animals are assembled and where one or more cases have been officially confirmed. While ‘case’ means the official confirmation of any of the diseases listed in Annex I of the Directive 82/894 in any animal or carcass.
References
- Abubakar RH, Madoroba E, Adenubi O, Morar‐Leather D and Fasina FO, 2017. Bacterial pathogens of pigs with particular reference to Escherichia coli: a systematic review and meta‐analysis. Journal of Veterinary Medicine and Animal Health, 9, 159–185. [Google Scholar]
- Alban L, Pozio E, Boes J, Boireau P, Boué F, Claes M, Cook AJC, Dorny P, Enemark HL, van der Giessen J, Hunt KR, Howell M, Kirjusina M, Nöckler K, Rossi P, Smith GC, Snow L, Taylor MA, Theodoropoulos G, Vallée I, Viera‐Pinto MM and Zimmer IA, 2011. Towards a standardised surveillance for Trichinella in the European Union. Preventive Veterinary Medicine, 99, 148–160. 10.1016/j.prevetmed.2011.02.008 [DOI] [PubMed] [Google Scholar]
- APHA (Animal and Plant Health Agency) , 2021. Canine Brucellosis: Summary Information Sheet. [Google Scholar]
- Aroussi A, Vignoles P, Dalmay F, Wimel L, Darde M‐L, Mercier A and Ajzenberg D, 2015. Detection of Toxoplasma gondii DNA in horse meat from supermarkets in France and performance evaluation of two serological tests. Parasite, 22, 14. 10.1051/parasite/2015014 [DOI] [PMC free article] [PubMed] [Google Scholar]
- Bakonyi T and Haussig JM, 2020. West Nile virus keeps on moving up in Europe. Eurosurveillance ‐ European Communicable Disease Bulletin, 25. 10.2807/1560-7917.ES.2020.25.46.2001938 [DOI] [PMC free article] [PubMed] [Google Scholar]
- Balog T, Nagy G, Halász T, Csányi E, Zomborszky Z and Csivincsik Á, 2021. The occurrence of Echinococcus spp. in golden jackal (Canis aureus) in southwestern Hungary: should we need to rethink its expansion? Parasitology International, 80, 102214. 10.1016/j.parint.2020.102214 [DOI] [PubMed] [Google Scholar]
- Beck C, Leparc Goffart I, Franke F, Gonzalez G, Dumarest M, Lowenski S, Blanchard Y, Lucas P, Lamballerie XD, Grard G, Durand GA, Zientara S, Tapprest J, L’Ambert G, Durand B, Desvaux S and Lecollinet S, 2020. Contrasted epidemiological patterns of west nile virus lineages 1 and 2 infections in France from 2015 to 2019. Pathogens, 9. 10.3390/pathogens9110908 [DOI] [PMC free article] [PubMed] [Google Scholar]
- Blaga R, Aubert D, Thébault A, Perret C, Geers R, Thomas M, Alliot A, Djokic V, Ortis N and Halos L, 2019. Toxoplasma gondii in beef consumed in France: regional variation in seroprevalence and parasite isolation. Parasite, 26. 10.1051/parasite/2019076 [DOI] [PMC free article] [PubMed] [Google Scholar]
- Bless PJ, Schmutz C and Mäusezahl D, 2017. The recurrent campylobacteriosis epidemic over Christmas and New Year in European countries, 2006–2014. BMC Research Notes, 10, 266. 10.1186/s13104-017-2587-8 [DOI] [PMC free article] [PubMed] [Google Scholar]
- Boelaert F, Amore G, Van der Stede Y and Hugas M, 2016. EU‐wide monitoring of biological hazards along the food chain: achievements, challenges and EFSA vision for the future. Current Opinion in Food Science, 12, 52–62. 10.1016/j.cofs.2016.08.004 [DOI] [Google Scholar]
- Bruschi F, Gómez‐Morales MA and Hill DE 2019. International Commission on Trichinellosis: recommendations on the use of serological tests for the detection of Trichinella infection in animals and humans. Food and Waterborne Parasitology, 14, e00032. 10.1016/j.fawpar.2018.e00032 [DOI] [PMC free article] [PubMed] [Google Scholar]
- Carrié P, Barry S, Rousset E, de Crémoux R, Sala C, Calavas D, Perrin J‐B, Bronner A, Gasqui P, Gilot‐Fromont E, Becker CAM, Gache K and Jourdain E, 2019. Swab cloths as a tool for revealing environmental contamination by Q fever in ruminant farms. Transboundary and Emerging Diseases, 66, 1202–1209. 10.1111/tbed.13137 [DOI] [PubMed] [Google Scholar]
- Casulli A, 2020. Recognising the substantial burden of neglected pandemics cystic and alveolar echinococcosis. The Lancet Global Health, 8, e470–e471. 10.1016/S2214-109X(20)30066-8 [DOI] [PubMed] [Google Scholar]
- Casulli A, Barth TFE and Tamarozzi F, 2019a. Echinococcus multilocularis. Trends in Parasitology, 35, 738–739. 10.1016/j.pt.2019.05.005 [DOI] [PubMed] [Google Scholar]
- Casulli A, Siles‐Lucas M and Tamarozzi F, 2019b. Echinococcus granulosus sensu lato. Trends in Parasitology, 35, 663–664. 10.1016/j.pt.2019.05.006 [DOI] [PubMed] [Google Scholar]
- Chlebicz A and Slizewska K, 2018. Campylobacteriosis, salmonellosis, yersiniosis, and listeriosis as zoonotic foodborne diseases: a Review. International Journal of Environmental Research and Public Health, 15, 1660–4601. 10.3390/ijerph15050863 [DOI] [PMC free article] [PubMed] [Google Scholar]
- Clayton D and Hills M, 2013. Statistical Models in Epidemiology. Oxford University Press, New York. 367 pp. [Google Scholar]
- Cliquet F, Freuling C, Smreczak M, Van der Poel WHM, Horton D, Fooks AR, Robardet E, Picard‐Meyer E and Müller T, 2010. Development of harmonised schemes for monitoring and reporting of rabies in animals in the European Union. EFSA Supporting Publications, 7, 60 pp. 10.2903/sp.efsa.2010.EN-67 [DOI] [Google Scholar]
- Conraths FJ, Probst C, Possenti A, Boufana B, Saulle R, La Torre G, Busani L and Casulli A, 2017. Potential risk factors associated with human alveolar echinococcosis: systematic review and meta‐analysis. PLoS Neglected Tropical Diseases, 11, e0005801. 10.1371/journal.pntd.0005801 [DOI] [PMC free article] [PubMed] [Google Scholar]
- Cuperlovic K, Djordjevic M and Pavlovic S, 2005. Re‐emergence of trichinellosis in southeastern Europe due to political and economic changes. Veterinary Parasitology, 132, 159–166. 10.1016/j.vetpar.2005.05.047 [DOI] [PubMed] [Google Scholar]
- Deplazes P, Hegglin D, Gloor S and Romig T, 2004. Wilderness in the city: the urbanization of Echinococcus multilocularis. Trends in Parasitology, 20, 77–84. 10.1016/j.pt.2003.11.011 [DOI] [PubMed] [Google Scholar]
- DIN (Deutsches Institut Fur Normung E.V. ‐ German National Standard‐) , 2004. DIN 10167:2004 ‐03. Nachweis von Escherichia coli O157 in Fleisch und Fleischerzeugnissen. [Detection of Escherichia coli O157 in meat and meat products].
- Djordjevic M, Bacic M, Petricevic M, Cuperlovic K, Malakauskas A, Kapel CM and Murrell KD, 2003. Social, political, and economic factors responsible for the reemergence of trichinellosis in Serbia: a case study. Journal of Parasitology, 89, 226–231. 10.1645/0022-3395(2003)089[0226:SPAEFR]2.0.CO;2 [DOI] [PubMed] [Google Scholar]
- Dryselius R, Hjertqvist M, Mäkitalo S, Lindblom A, Lilja T, Eklöf D and Lindström A, 2019. Large outbreak of tularaemia, central Sweden, July to September 2019. Eurosurveillance, 24, 1900603. 10.2807/1560-7917.ES.2019.24.42.1900603 [DOI] [PMC free article] [PubMed] [Google Scholar]
- Dušek D, Vince A, Kurelac I, Papić N, Višković K, Deplazes P and Beck R, 2020. Human Alveolar Echinococcosis, Croatia. Emerging Infectious Diseases, 26, 364–366. 10.3201/eid2602.181826 [DOI] [PMC free article] [PubMed] [Google Scholar]
- ECDC (European Centre for Disease Prevention and Control), 2018. Early Large Increase in West Nile Virus Infections in the EU/EEA and EU Neighbouring Countries. ECDC, Stockholm. [Google Scholar]
- ECDC (European Centre for Disease Prevention and Control) , 2021a. West nile virus outbreaks among equids and birds 2020 transmission season.
- ECDC (European Centre for Disease Prevention and Control) , 2021b. Congenital toxoplasmosis. ECDC. Annual epidemiological report for 2018, Stockholm.
- ECDC and EFSA (European Centre for Disease Prevention and Control and European Food Safety Authority) , 2019. Multi‐country outbreak of Listeria monocytogenes clonal complex 8 infections linked to consumption of cold‐smoked fish products. EFSA Supporting Publications 2019;EN1665. 10.2903/sp.efsa.2019.EN-1665 Available online: https://www.efsa.europa.eu/en/publications [DOI]
- ECDC and EFSA (European Centre for Disease Prevention and Control and European Food Safety Authority) , 2020. Multi‐country outbreak of Salmonella Typhimurium and S. Anatum infections linked to Brazil nuts – 21 October 2020. Available online: 10.2903/sp.efsa.2020.EN-1944 [DOI]
- ECDC and EFSA (European Centre for Disease Prevention and Control and European Food Safety Authority) , 2021. Multi‐country outbreak of Salmonella Enteritidis sequence type (ST)11 infections linked to poultry products in the EU/EEA and the United Kingdom. Available online: https://www.ecdc.europa.eu/en/publications-data/salmonella-enteritidis-multi-country-poultry-joint-outbreak-risk-assessment#no-link
- ECDC, EFSA and ANSES (European Centre for Disease Prevention and Control, European Food Safety Authority, French Agency for Food, Environmental and Occupational Health & Safety) , 2021. European Listeria typing exercise (ELiTE). Available online: https://www.ecdc.europa.eu/en/publications-data/joint-ecdc-efsa-and-eurl-lm-report-european-listeria-typing-exercise-elite#no-link
- Echevarría JE, Banyard AC, McElhinney LM and Fooks AR, 2019. Current rabies vaccines do not confer protective immunity against divergent lyssaviruses circulating in Europe. Viruses, 11. 10.3390/v11100892 [DOI] [PMC free article] [PubMed] [Google Scholar]
- EFSA (European Food Safety Authority) , 2009a. Statistical analysis of temporal and spatial trends of zoonotic agents in animals and food. Part I: Critical review of the statistical analysis carried out on the Community Summary Report 2006 data. EFSA Journal 2009;253, 77 pp. 10.2903/j.efsa.2009.253r [DOI] [Google Scholar]
- EFSA (European Food Safety Authority) , 2009b. Technical specifications for the monitoring and reporting of verotoxigenic Escherichia coli (VTEC) on animals and food (VTEC surveys on animals and food). EFSA Journal 2009;7(11):1366, 43 pp. 10.2903/j.efsa.2009.1366 [DOI] [Google Scholar]
- EFSA (European Food Safety Authority) , 2009c. Technical specifications for harmonised national surveys on Yersinia enterocolitica in slaughter pigs. EFSA Journal 2009;7(11):1374, 23 pp. 10.2903/j.efsa.2009.1374 [DOI] [Google Scholar]
- EFSA (European Food Safety Authority) , 2010. Analysis of the baseline survey on the prevalence of Campylobacter in broiler batches and of Campylobacter and Salmonella on broiler carcasses in the EU, 2008, Part A: Campylobacter and Salmonella prevalence estimates. EFSA Journal 2010;8(3):1503, 100 pp. 10.2903/j.efsa.2010.1503 [DOI] [Google Scholar]
- EFSA (European Food Safety Authority) , 2011. Statistical analysis of temporal and spatial trends of zoonotic agents in animals and food, Part II: applications of spatial analysis and further developments of temporal analysis. EFSA Journal 2011;9(8):2331, 72 pp. 10.2903/j.efsa.2011.2331 [DOI] [Google Scholar]
- EFSA (European Food Safety Authority) , 2014. Update of the technical specifications for harmonised reporting of foodborne outbreaks through the European Union reporting system in accordance with Directive 2003/99/EC. EFSA Journal 2014;12(3):3598, 25 pp. 10.2903/j.efsa.2014.3598 [DOI] [Google Scholar]
- EFSA (European Food Safety Authority) and Ioannidou S, 2019. EFSA Catalogue Browser User Guide. EFSA supporting publication 2019;EN‐1726, 39 pp. 10.2903/sp.efsa.2019.EN-1726 [DOI]
- EFSA (European Food Safety Authority) , Amore G, Beloeil P‐A, Bocca V, Boelaert F, Gibin D, Papanikolaou A, Rizz V and Stoicescu A‐V, 2021a. Zoonoses, antimicrobial resistance and foodborne outbreaks guidance for reporting 2020 data. EFSA supporting publication 2021;EN‐6438, 112 pp. 10.2903/sp.efsa.2021.EN-6438 [DOI]
- EFSA (European Food Safety Authority) , Amore G, Boelaert F, Papanikolaou A, Rizzi V and Stoicescu A‐V, 2021b. Manual for reporting on zoonoses and zoonotic agents,within the framework of Directive 2003/99/EC, and on some other pathogenic microbiological agents for information derived from the year 2020. EFSA supporting publication 2021;EN‐6440, 67 pp. 10.2903/sp.efsa.2021.EN-6440 [DOI]
- EFSA (European Food Safety Authority) , Bocca V, Boelaert F, Gibin D, Papanikolaou A, Rizzi V and Stoicescu AV, 2021c. Prevalence sample‐based guidance for reporting 2020 data. EFSA supporting publication 2021;EN‐6439, 67 pp. 10.2903/sp.efsa.2021.EN-6439 [DOI]
- EFSA (European Food Safety Authority) and Zancanaro G, 2021. Annual assessment of Echinococcus multilocularis surveillance reports submitted in 2020 in the context of Commission Delegated Regulation (EU) 2018/772. EFSA Journal 2021;19(1):6382, 63 pp. 10.2903/j.efsa.2021.6382 [DOI] [PMC free article] [PubMed]
- EFSA AHAW Panel (EFSA Panel on Animal Health and Welfare) , 2014. Statement on a conceptual framework for bovine tuberculosis. EFSA Journal 2012;12(5):3711, 59 pp. 10.2903/j.efsa.2014.3711 [DOI]
- EFSA Ahaw Panel (EFSA Panel on Animal Health and Welfare) , 2015. Update on oral vaccination of foxes and raccoon dogs against rabies. EFSA Journal 2015;13(7):4164, 70 pp. 10.2903/j.efsa.2015.4164 [DOI]
- EFSA and ECDC (European Food Safety Authority and European Centre for Disease Prevention and Control) , 2009. The Community Summary Report on Trends and Sources of Zoonoses and Zoonotic Agents in the European Union in 2007. EFSA Journal 2009;7(1):223, 350 pp. 10.2903/j.efsa.2009.223r [DOI]
- EFSA and ECDC (European Food Safety Authority and European Centre for Disease Prevention and Control) , 2010. The Community Summary Report on trends and sources of zoonoses, zoonotic agents and foodborne outbreaks in the European Union in 2008. EFSA Journal 2008;8(1):1496, 35 pp. 10.2903/j.efsa.2010.1496 [DOI] [Google Scholar]
- EFSA and ECDC (European Food Safety Authority and European Centre for Disease Prevention and Control) , 2011. The European Union Summary Report on Trends and Sources of Zoonoses, Zoonotic Agents and foodborne Outbreaks in 2009. EFSA Journal 2011;9(3):2090, 378 pp. 10.2903/j.efsa.2011.2090 [DOI] [Google Scholar]
- EFSA and ECDC (European Food Safety Authority and European Centre for Disease Prevention and Control) , 2012. The European Union Summary Report on Trends and Sources of Zoonoses, Zoonotic Agents and foodborne Outbreaks in 2010. EFSA Journal 2012;10:2597, 442 pp. 10.2903/j.efsa.2012.2597 [DOI] [Google Scholar]
- EFSA and ECDC (European Food Safety Authority and European Centre for Disease Prevention and Control) , 2013. The European Union Summary Report on Trends and Sources of Zoonoses, Zoonotic Agents and foodborne Outbreaks in 2011. EFSA Journal 2013;11(4):3129, 250 pp. 10.2903/j.efsa.2013.3129 [DOI]
- EFSA and ECDC (European Food Safety Authority and European Centre for Disease Prevention and Control) , 2014. The European Union Summary Report on Trends and Sources of Zoonoses, Zoonotic Agents and foodborne Outbreaks in 2012. EFSA Journal 2014;12(2):3547, 312 pp. 10.2903/j.efsa.2014.3547 [DOI]
- EFSA and ECDC (European Food Safety Authority and European Centre for Disease Prevention and Control) , 2015a. The European Union. summary report on trends and sources of zoonoses, zoonotic agents and foodborne outbreaks in 2014. EFSA Journal 2015;13(12):4329, 190 pp. 10.2903/j.efsa.2015.4329 [DOI]
- EFSA and ECDC (European Food Safety Authority and European Centre for Disease Prevention and Control) , 2015b. The European Union. summary report on trends and sources of zoonoses, zoonotic agents and foodborne outbreaks in 2013. EFSA Journal 2015;13(1):3991, 165 pp. 10.2903/j.efsa.2015.3991 [DOI]
- EFSA and ECDC (European Food Safety Authority and European Centre for Disease Prevention and Control) , 2016. The European Union summary report on trends and sources of zoonoses, zoonotic agents and foodborne outbreaks in 2015. EFSA Journal 2016;14(12):4634, 231 pp. 10.2903/j.efsa.2016.4634 [DOI] [PMC free article] [PubMed]
- EFSA and ECDC (European Food Safety Authority and European Centre for Disease Prevention and Control) , 2017. The European Union summary report on trends and sources of zoonoses, zoonotic agents and foodborne outbreaks in 2016. EFSA Journal 2017;15(12):5077, 228 pp. 10.2903/j.efsa.2017.5077 [DOI] [PMC free article] [PubMed]
- EFSA and ECDC (European Food Safety Authority and European Centre for Disease Prevention and Control) , 2018a. The European Union. summary report on trends and sources of zoonoses, zoonotic agents and foodborne outbreaks in 2017. EFSA Journal 2018;16(12):5500, 262 pp. 10.2903/j.efsa.2018.5500 [DOI] [PMC free article] [PubMed]
- EFSA and ECDC (European Food Safety Authority and European Centre for Disease Prevention and Control) , 2018b. Multi‐country outbreak of Listeria monocytogenes serogroup IVb, multi‐locus sequence type 6, infections linked to frozen corn and possibly to other frozen vegetables – first update. EFSA Supporting Publications 2018;15(7):EN‐1448, 22 pp. 10.2903/sp.efsa.2018.EN-1448 [DOI]
- EFSA and ECDC (European Food Safety Authority and European Centre for Disease Prevention and control) , 2019. The European Union one health 2018 zoonoses report. EFSA Journal 2010;8(1):1496, 410 pp. 10.2903/j.efsa.2019.5926 [DOI] [PMC free article] [PubMed]
- EFSA and ECDC (European Food Safety Authority and European Centre for Disease Prevention and Control) , 2021. The European Union One Health 2019 Zoonoses Report. EFSA Journal 2021;19(2):6406, 286 pp. 10.2903/j.efsa.2021.6406 [DOI] [PMC free article] [PubMed]
- EFSA BIOHAZ Panel (EFSA Panel on Biological Hazards) , 2007. Monitoring and identification of human enteropathogenic Yersinia spp. ‐ Scientific Opinion of the Panel on Biological Hazards. EFSA Journal 2007;5(12):595, 30 pp. 10.2903/j.efsa.2007.595 [DOI] [Google Scholar]
- EFSA BIOHAZ Panel (EFSA Panel on Biological Hazards) , 2011. Scientific Opinion on Campylobacter in broiler meat production: control options and performance objectives and/or targets at different stages of the food chain. EFSA Journal 2011;9(4):2105, 141 pp. 10.2903/j.efsa.2011.2105 [DOI]
- EFSA BIOHAZ Panel, EFSA CONTAM Panel and EFSA AHAW Panel (EFSA Panels on Biological Hazards, on Contaminants in the Food Chain and on Animal Health and Welfare) , 2011. Scientific Opinion on the public health hazards to be covered by inspection of meat (swine). EFSA Journal 2011;9(10):2351, 198 pp. 10.2903/j.efsa.2011.2351 [DOI] [Google Scholar]
- EFSA BIOHAZ Panel, EFSA CONTAM Panel and EFSA AHAW Panel (EFSA Panels on Biological Hazards, on Contaminants in the Food Chain and on Animal Health and Welfare) , 2012. Scientific Opinion on the public health hazards to be covered by inspection of meat (poultry). EFSA Journal 2012;10(6):2741, 179 pp. 10.2903/j.efsa.2012.2741 [DOI] [Google Scholar]
- EFSA BIOHAZ Panel (EFSA Panel on Biologicial Hazards) , 2013a. Scientific Opinion on the public health hazards to be covered by inspection of meat (solipeds). EFSA Journal 2013;11(6):3263, 161 pp. 10.2903/j.efsa.2013.3263 [DOI] [PMC free article] [PubMed]
- EFSA BIOHAZ Panel (EFSA Panel on Biological Hazards) , 2013b. Scientific Opinion on VTEC‐seropathotype and scientific criteria regarding pathogenicity assessment. EFSA Journal 2013;11(4):3138, 106 pp. 10.2903/j.efsa.2013.3138 [DOI] [Google Scholar]
- EFSA BIOHAZ Panel (EFSA Panel on Biological Hazards) , Ricci A, Allende A, Bolton D, Chemaly M, Davies R, Fernández Escámez PS, Girones R, Herman L, Koutsoumanis K, Nørrung B, Robertson L, Ru G, Sanaa M, Simmons M, Skandamis P, Snary E, Speybroeck N, Ter Kuile B, Threlfall J, Wahlström H, Takkinen J, Wagner M, Arcella D, Da Silva Felicio MT, Georgiadis M, Messens W and Lindqvist R, 2018. Listeria monocytogenes contamination of ready‐to‐eat foods and the risk for human health in the EU. EFSA Journal 2018;16(1):5134, 173 pp. 10.2903/j.efsa.2018.5134 [DOI] [PMC free article] [PubMed] [Google Scholar]
- EFSA BIOHAZ Panel (EFSA Panel on Biological Hazards) , Koutsoumanis K, Allende A, Alvarez‐Ordóñez A, Bolton D, Bover‐Cid S, Chemaly M, Davies R, De Cesare A, Hilbert F, Lindqvist R, Nauta M, Peixe L, Ru G, Simmons M, Skandamis P, Suffredini E, Jenkins C, Malorny B, Ribeiro Duarte AS, Torpdahl M, da Silva Felício MT, Guerra B, Rossi M and Herman L, 2019a. Whole genome sequencing and metagenomics for outbreak investigation, source attribution and risk assessment of foodborne microorganisms. EFSA Journal 2019;17(12):5898, 78 pp. 10.2903/j.efsa.2019.5898 [DOI] [PMC free article] [PubMed]
- EFSA BIOHAZ Panel (EFSA Panel on Biological Hazards) , Koutsoumanis K, Allende A, Alvarez‐Ordóñez A, Bolton D, Bover‐Cid S, Chemaly M, De Cesare A, Herman L, Hilbert F, Lindqvist R, Nauta M, Peixe L, Ru G, Simmons M, Skandamis P, Suffredini E, Dewulf J, Hald T, Michel V, Niskanen T, Ricci A, Snary E, Boelaert F, Messens W and Davies R, 2019b. Salmonella control in poultry flocks and its public health impact. EFSA Journal 2019;17(2):5596, 155 pp. 10.2903/j.efsa.2019.5596 [DOI] [PMC free article] [PubMed]
- EFSA BIOHAZ Panel (EFSA Panel on Biological Hazards) , Koutsoumanis K, Allende A, Alvarez‐Ordóñez A, Bolton D, Bover‐Cid S, Davies R, De Cesare A, Herman L, Hilbert F, Lindqvist R, Nauta M, Peixe L, Ru G, Simmons M, Skandamis P, Suffredini E, Alter T, Crotta M, Ellis‐Iversen J, Hempen M, Messens W and Chemaly M, 2020a. Update and review of control options for Campylobacter in broilers at primary production. EFSA Journal 2020;18(4):6090, 89 pp. 10.2903/j.efsa.2020.6090 [DOI] [PMC free article] [PubMed]
- EFSA BIOHAZ Panel (EFSA Panel on Biological Hazards) , Koutsoumanis K, Allende A, Alvarez‐Ordóñez A, Bover‐Cid S, Chemaly M, Davies R, De Cesare A, Herman L, Hilbert F, Lindqvist R, Nauta M, Peixe L, Ru G, Simmons M, Skandamis P, Suffredini E, Jenkins C, Monteiro Pires S, Morabito S, Niskanen T, Scheutz F, da Silva Felício MT, Messens W and Bolton D, 2020b. Pathogenicity assessment of Shiga toxin‐producing Escherichia coli (STEC) and the public health risk posed by contamination of food with STEC. EFSA Journal 2020;18(1):5967, 105 pp. 10.2903/j.efsa.2020.5967 [DOI]
- EFSA BIOHAZ Panel (EFSA Panel on Biological Hazards) , Koutsoumanis K, Alvarez‐Ordóñez A, Bolton D, Bover‐Cid S, Chemaly M, Davies R, De Cesare A, Herman L, Hilbert F, Lindqvist R, Nauta M, Peixe L, Ru G, Simmons M, Skandamis P, Suffredini E, Jordan K, Sampers I, Wagner M, Da Silva Felicio MT, Georgiadis M, Messens W, Mosbach‐Schulz O and Allende A, 2020c. The public health risk posed by Listeria monocytogenes in frozen fruit and vegetables including herbs, blanched during processing. EFSA Journal 2020;18(4):6092, 102 pp. 10.2903/j.efsa.2020.6092 [DOI] [PMC free article] [PubMed] [Google Scholar]
- Enkirch T, Severi E, Vennema H, Thornton L, Dean J, Borg M‐L, Ciccaglione AR, Bruni R, Christova I, Ngui SL, Balogun K, Němeček V, Kontio M, Takács M, Hettmann A, Korotinska R, Löve A, Avellón A, Muñoz‐Chimeno M, de Sousa R, Janta D, Epštein J, Klamer S, Suin V, Aberle SW, Holzmann H, Mellou K, Ederth JL, Sundqvist L, Roque‐Afonso A‐M, Filipović SK, Poljak M, Vold L, Stene‐Johansen K, Midgley S, Fischer TK, Faber M, Wenzel JJ, Takkinen J and Leitmeyer K, 2019. Improving preparedness to respond to cross‐border hepatitis A outbreaks in the European Union/European Economic Area: towards comparable sequencing of hepatitis A virus. Eurosurveillance, 24. 10.2807/1560-7917.ES.2019.24.28.1800397 [DOI] [PMC free article] [PubMed] [Google Scholar]
- EUROSTAT , 2021. Population structure and ageing. Available online: https://ec.europa.eu/eurostat/statistics‐explained/index.php?title=Population_structure_and_ageing
- Faber M, Heuner K, Jacob D and Grunow R, 2018. Tularemia in Germany—a re‐emerging zoonosis. Frontiers in Cellular and Infection Microbiology, 8, 40. 10.3389/fcimb.2018.00040 [DOI] [PMC free article] [PubMed] [Google Scholar]
- Fooks AR, Brookes SM, Johnson N, McElhinney LM and Hutson AM, 2003. European bat lyssaviruses: an emerging zoonosis. Epidemiology and Infection, 131, 1029–1039. 10.1017/S0950268803001481 [DOI] [PMC free article] [PubMed] [Google Scholar]
- García San Miguel Rodríguez‐Alarcón L, Fernández‐Martínez B, Sierra Moros MJ, Vázquez A, Julián Pachés P, García Villacieros E, Gómez Martín MB, Figuerola Borras J, Lorusso N, Ramos Aceitero JM, Moro E, de Celis A, Oyonarte S, Mahillo B, Romero González LJ, Sánchez‐Seco MP, Suárez Rodríguez B, Ameyugo Catalán U, Ruiz Contreras S, Pérez‐Olmeda M and Simón Soria F, 2021. Unprecedented increase of West Nile virus neuroinvasive disease, Spain, summer 2020. Eurosurveillance, 26. 10.2807/1560-7917.ES.2021.26.19.2002010 [DOI] [PMC free article] [PubMed] [Google Scholar]
- Genova‐Kalou P, Vladimirova N, Stoitsova S, Krumova S, Kurchatova A and Kantardjiev T, 2019. Q fever in Bulgaria: laboratory and epidemiological findings on human cases and outbreaks, 2011 to 2017. Eurosurveillance, 24. 10.2807/1560-7917.ES.2019.24.37.1900119 [DOI] [PMC free article] [PubMed] [Google Scholar]
- Georgiev M, Afonso A, Neubauer H, Needham H, Thiéry R, Rodolakis A, Roest HJ, Stärk KD, Stegeman JA, Vellema P, van der Hoek W and More SJ, 2013. Q fever in humans and farm animals in four European countries, 1982 to 2010. Eurosurveillance, 18. 10.2807/ese.18.08.20407-en [DOI] [PubMed] [Google Scholar]
- Gossner CM, Mailles A, Aznar I, Dimina E, Echevarria JE, Feruglio SL, Lange H, Maraglino FP, Parodi P, Perevoscikovs J, Van der Stede Y and Bakonyi T, 2020. Prevention of human rabies: a challenge for the European Union and the European Economic Area. Eurosurveillance Weekly, 25, 1560–7917. 10.2807/1560-7917.ES.2020.25.38.2000158 [DOI] [PMC free article] [PubMed] [Google Scholar]
- Gossner CM, Marrama L, Carson M, Allerberger F, Calistri P, Dilaveris D, Lecollinet S, Morgan D, Nowotny N, Paty M‐C, Pervanidou D, Rizzo C, Roberts H, Schmoll F, Van Bortel W and Gervelmeyer A, 2017. West Nile virus surveillance in Europe: moving towards an integrated animal‐human‐vector approach. Eurosurveillance, 22. 10.2807/1560-7917.ES.2017.22.18.30526 [DOI] [PMC free article] [PubMed] [Google Scholar]
- Guegan H, Stajner T, Bobic B, Press C, Olariu RT, Olson K, Srbljanovic J, Montoya JG, Djurković‐Djaković O and Robert‐Gangneux F, 2021. Maternal anti‐toxoplasma treatment during pregnancy is associated with reduced sensitivity of diagnostic tests for congenital infection in the neonate. Journal of Clinical Microbiology, 59, e01368‐20. 10.1128/JCM.01368-20 [DOI] [PMC free article] [PubMed] [Google Scholar]
- Guillier L, Thébault A, Fravalo P, Mughini‐Gras L, Jourdan‐da Silva N, David J, Kooh P, Cadavez V and Gonzales‐Barron U, 2021. Risk factors for sporadic salmonellosis: a systematic review and meta‐analysis. Microbial Risk Analysis, 17. 100138. 10.1016/j.mran.2020.100138 [DOI] [Google Scholar]
- Haldane V, De Foo C, Abdalla SM, Jung A‐S, Tan M, Wu S, Chua A, Verma M, Shrestha P, Singh S, Perez T, Tan SM, Bartos M, Mabuchi S, Bonk M, McNab C, Werner GK, Panjabi R, Nordström A and Legido‐Quigley H, 2021. Health systems resilience in managing the COVID‐19 pandemic: lessons from 28 countries. Nature Medicine, 27, 964–980. 10.1038/s41591-021-01381-y [DOI] [PubMed] [Google Scholar]
- Haussig JM, Young JJ, Gossner CM, Mezei E, Bella A, Sirbu A, Pervanidou D, Drakulovic MB and Sudre B, 2018. Early start of the West Nile fever transmission season 2018 in Europe. Eurosurveillance Weekly, 23, 1560–7917. 10.2807/1560-7917.ES.2018.23.32.1800428 [DOI] [PMC free article] [PubMed] [Google Scholar]
- Hennebique A, Boisset S and Maurin M, 2019. Tularemia as a waterborne disease: a review. Emerging Microbes & Infections, 8, 1027–1042. 10.1080/22221751.2019.1638734 [DOI] [PMC free article] [PubMed] [Google Scholar]
- Herrador Z, Gherasim A, Lopez‐Velez R and Benito A, 2019. Listeriosis in Spain based on hospitalisation records, 1997 to 2015: need for greater awareness. Eurosurveillance Weekly, 24, 1560–7917. 10.2807/1560-7917.ES.2019.24.21.1800271 [DOI] [PMC free article] [PubMed] [Google Scholar]
- Hestvik G, Uhlhorn H, Sodersten F, Akerstrom S, Karlsson E, Westergren E and Gavier‐Widen D, 2017. Tularaemia in European Brown Hares (Lepus europaeus) and Mountain Hares (Lepus timidus) Characterized by histopathology and immunohistochemistry: organ lesions and suggestions of routes of infection and shedding. Journal of Comparative Pathology, 157, 1532–3129, 103–114. 10.1016/j.jcpa.2017.06.003 [DOI] [PubMed] [Google Scholar]
- Hestvik G, Warns‐Petit E, Smith LA, Fox NJ, Uhlhorn H, Artois M, Hannant D, Hutchings MR, Mattsson R, Yon L and Gavier‐Widen D, 2015. The status of tularemia in Europe in a one‐health context: a review. Epidemiology and Infection, 143, 2137–2160. 10.1017/S0950268814002398 [DOI] [PMC free article] [PubMed] [Google Scholar]
- Hubálek Z and Halouzka J, 1999. West Nile fever–a reemerging mosquito‐borne viral disease in Europe. Emerging Infectious Diseases, 5, 643–650. 10.3201/eid0505.990505 [DOI] [PMC free article] [PubMed] [Google Scholar]
- Hunter E, Greig DR, Schaefer U, Wright MJ, Dallman TJ, McNally A and Jenkins C, 2019. Identification and typing of Yersinia enterocolitica and Yersinia pseudotuberculosis isolated from human clinical specimens in England between 2004 and 2018. Journal of Medical Microbiology, 68, 538–548. 10.1099/jmm.0.000943 [DOI] [PubMed] [Google Scholar]
- ISO (International Organization for Standardization) , 2001. ISO 16654:2001. Microbiology of food and animal feeding stuffs – Horizontal method for the detection of Escherichia coli O157. Available online: https://www.iso.org/standard/29821.html [DOI] [PubMed]
- ISO (International Organization for Standardization) , 2012. ISO/TS 13136:2012. Microbiology of food and animal feed — Real‐time polymerase chain reaction (PCR)‐based method for the detection of foodborne pathogens — Horizontal method for the detection of Shiga toxin‐producing Escherichia coli (STEC) and the determination of O157, O111, O26, O103 and O145 serogroups. Available online: https://www.iso.org/standard/53328.html
- ISO (International Organization for Standardization) , 2015a. ISO, 18743, 2015. Microbiology of the food chain — Detection of Trichinella larvae in meat by artificial digestion method. Available online: https://www.iso.org/standard/63251.html
- ISO (International Organization for Standardization) , 2015b. . ISO/TS 18867:2015. Microbiology of the food chain — Polymerase chain reaction (PCR) for the detection of foodborne pathogens — Detection of pathogenic Yersinia enterocolitica and Yersinia pseudotuberculosis. Available online: https://www.iso.org/standard/63635.html
- ISO (International Organization for Standardization) , 2017a. ISO 11290–2:2017. Microbiology of food and animal feeding stuffs. Horizontal method for the detection and enumeration of Listeria monocytogenes and Listeria spp. Part 2: Enumeration method Available online: https://www.iso.org/standard/60314.html [Google Scholar]
- ISO (International Organization for Standardization) , 2017b. ISO 11290‐1:2017. Microbiology of food and animal feeding stuffs. Horizontal method for the detection and enumeration of Listeria monocytogenes and Listeria spp. Part 1: Detection method. Available online: https://www.iso.org/standard/60313.html
- IZSAM (Istituto Zooprofilattico Sperimentale dell'Abruzzo e del Molise "G. Caporale") , 2020. (Istituto Zooprofilattico Sperimentale dell'Abruzzo e del Molise.Brucellosi canina da Brucella canis: descrizione della malattia e modalità di controllo.
- Jansen W, Linard C, Noll M, Nöckler K and Al Dahouk S, 2019. Brucella‐positive raw milk cheese sold on the inner European market: a public health threat due to illegal import? Food Control, 100, 130–137. 10.1016/j.foodcont.2019.01.022 [DOI] [Google Scholar]
- Kaakoush NO, Castaño‐Rodríguez N, Mitchell HM and Man SM, 2015. Global epidemiology of Campylobacter infection. Clinical Microbiology Reviews, 28, 687–720. 10.1128/CMR.00006-15 [DOI] [PMC free article] [PubMed] [Google Scholar]
- Kastritis E, Tsitsimpis K, Anninos E, Stamatelopoulos K, Kanakakis I, Lampropoulos C, Chatzidou S, Michopoulos S, Papamichail C, Kostis E, Manios E, Kontogiannis S, Paraskevaidis I, Terpos E, Mitrakou A and Dimopoulos MA, 2020. Significant reduction in the visits to the emergency room department during the COVID‐19 pandemic in a tertiary hospital in Greece: indirect victims of the pandemic? Medicine, 99, e23845. 10.1097/MD.0000000000023845 [DOI] [PMC free article] [PubMed] [Google Scholar]
- Kenney A, Cusick A, Payne J, Gaughenbaugh A, Renshaw A, Wright J, Seeber R, Barnes R, Florjanczyk A and Horzempa J, 2017. The potential for flower nectar to allow mosquito to mosquito transmission of Francisella tularensis . PLoS One, 12, 1–12. 10.1371/journal.pone.0175157 [DOI] [PMC free article] [PubMed] [Google Scholar]
- Kern P, Bardonnet K, Renner E, Auer H, Pawlowski Z, Ammann RW, Vuitton DA and Kern P, 2003. European echinococcosis registry: human alveolar echinococcosis, Europe, 1982–2000. Emerging Infectious Diseases, 9, 343–349. 10.3201/eid0903.020341 [DOI] [PMC free article] [PubMed] [Google Scholar]
- Klevar S, Høgåsen HR, Davidson RK, Hamnes IS, Treiberg Berndtsson L and Lund A, 2015. Cross‐border transport of rescue dogs may spread rabies in Europe. Veterinary Record, 176, 672–672. 10.1136/vr.102909 [DOI] [PMC free article] [PubMed] [Google Scholar]
- Kurotschka PK, Serafini A, Demontis M, Serafini A, Mereu A, Moro MF, Carta MG and Ghirotto L, 2021. General practitioners' experiences during the first phase of the COVID‐19 Pandemic in Italy: a critical incident technique study. Frontiers in Public Health, 9. 19. 10.3389/fpubh.2021.623904 [DOI] [PMC free article] [PubMed] [Google Scholar]
- Lachmann R, Halbedel S, Adler M, Becker N, Allerberger F, Holzer A, Boone I, Falkenhorst G, Kleta S, Al Dahouk S, Stark K, Luber P, Flieger A and Wilking H, 2021. Nationwide outbreak of invasive listeriosis associated with consumption of meat products in health care facilities, Germany, 2014–2019. Clinical Microbiology and Infection, 27, 1035.e1031–1035.e1035. 10.1016/j.cmi.2020.09.020 [DOI] [PubMed] [Google Scholar]
- Lake IR, Colon‐Gonzalez FJ, Takkinen J, Rossi M, Sudre B, Dias JG, Tavoschi L, Joshi A, Semenza JC and Nichols G, 2019. Exploring Campylobacter seasonality across Europe using The European Surveillance System (TESSy), 2008 to 2016. Eurosurveillance, 24, 1560–7917. 10.2807/1560-7917.ES.2019.24.13.180028 [DOI] [PMC free article] [PubMed] [Google Scholar]
- Leati M, Zaccherini A, Ruocco L, D'Amato S, Busani L, Villa L, Barco L, Ricci A and Cibin V, 2021. The challenging task to select Salmonella target serovars in poultry: the Italian point of view. Epidemiology & Infection, 149, 1–9. 10.1017/S0950268821001230 [DOI] [PMC free article] [PubMed] [Google Scholar]
- Li W and Xiao L, 2020. Ecological and public health significance of Enterocytozoon bieneusi. One Health, 12, 100209. [DOI] [PMC free article] [PubMed] [Google Scholar]
- Lim J, Broughan J, Crowley D, O’Kelly B, Fawsitt R, Burke MC, McCombe G, Lambert JS and Cullen W, 2021. COVID‐19’s impact on primary care and related mitigation strategies: a scoping review. European Journal of General Practice, 271, 166–175. 10.1080/13814788.2021.1946681 [DOI] [PMC free article] [PubMed] [Google Scholar]
- Maier T, Schwarting A, Mauer D, Ross RS, Martens A, Kliem V, Wahl J, Panning M, Baumgarte S, Müller T, Pfefferle S, Ebel H, Schmidt J, Tenner‐Racz K, Racz P, Schmid M, Strüber M, Wolters B, Gotthardt D, Bitz F, Frisch L, Pfeiffer N, Fickenscher H, Sauer P, Rupprecht CE, Roggendorf M, Haverich A, Galle P, Hoyer J and Drosten C, 2010. Management and outcomes after multiple corneal and solid organ transplantations from a donor infected with rabies virus. Clinical Infectious Diseases, 50, 1112–1119. 10.1086/651267 [DOI] [PubMed] [Google Scholar]
- Marquer P, Rabade T and Forti R, 2014. Pig farming in the European Union: considerable variations from one Member State to another. Statistics in Focus, 15:ISSN: 2314‐9647. [Google Scholar]
- Maurin M and Gyuranecz M, 2016. Tularaemia: clinical aspects in Europe. The Lancet Infectious Diseases, 16, 113–124. 10.1016/s1473-3099(15)00355-2 [DOI] [PubMed] [Google Scholar]
- Meyer A, Olias P, Schüpbach G, Henzi M, Barmettler T, Hentrich B, Gottstein B and Frey CF, 2020. Articles initially published in Veterinary Parasitology: X issues 3–4. Combined cross‐sectional and case‐control study on Echinococcus multilocularis infection in pigs in Switzerland. Veterinary Parasitology, 277. 100031. 10.1016/j.vpoa.2020.100031 [DOI] [PubMed] [Google Scholar]
- Mínguez‐González O, Gutiérrez‐Martín C‐B, Martínez‐Nistal MdC, Esquivel‐García MdR, Gómez‐Campillo J‐I, Collazos‐Martínez J‐Á, Fernández‐Calle L‐M, Ruiz‐Sopeña C, Tamames‐Gómez S, Martínez‐Martínez S, Caminero‐Saldaña C, Hernández M, Rodríguez‐Lázaro D and Rodríguez‐Ferri E‐F, 2021. Tularemia outbreaks in Spain from 2007 to 2020 in Humans and domestic and wild animals. Pathogens, 10. 10.3390/pathogens10070892 [DOI] [PMC free article] [PubMed] [Google Scholar]
- Mohammed M, Le Hello S, Leekitcharoenphon P and Hendriksen R, 2017. The invasome of Salmonella Dublin as revealed by whole genome sequencing. BMC Infectious Diseases, 17, 1–9. 10.1186/s12879-017-2628-x [DOI] [PMC free article] [PubMed] [Google Scholar]
- Mughini‐Gras L, van Hoek AHAM, Cuperus T, Dam‐Deisz C, van Overbeek W, van den Beld M, Wit B, Rapallini M, Wullings B, Franz E, van der Giessen J, Dierikx C and Opsteegh M, 2021. Prevalence, risk factors and genetic traits of Salmonella Infantis in Dutch broiler flocks. Veterinary Microbiology, 258. 109120. 10.1016/j.vetmic.2021.109120 [DOI] [PubMed] [Google Scholar]
- Müller O, Razum O and Jahn, A 2021. Effects of non‐pharmaceutical interventions against COVID‐19 on the incidence of other diseases. The Lancet Regional Health ‐ Europe, 6, 100139. 10.1016/j.lanepe.2021.100139 [DOI] [PMC free article] [PubMed] [Google Scholar]
- Newell DG, Elvers KT, Dopfer D, Hansson I, Jones P, James S, Gittins J, Stern NJ, Davies R, Connerton I, Pearson D, Salvat G and Allen VM, 2011. Biosecurity‐based interventions and strategies to reduce Campylobacter spp. on poultry farms. Applied and Environmental Microbiology, 77, 8605–8614. 10.1128/AEM.01090-10 [DOI] [PMC free article] [PubMed] [Google Scholar]
- NMKL (Nordisk Metodikkomité for Næringsmidler ‐ Nordic Committee on Food Analysis) , 2005. Escherichia coli O157. Detection in food and feeding stuffs. NMKL. No. 164, 2 Ed. 2005, Available online: http://www.NMKL..org/index.php?option=com_zoo&task=item&item_id=337&Itemid=319&lang=en
- Nüesch‐Inderbinen M, Bloemberg G, Müller A, Stevens MJA, Cernela N, Kollöffel B and Stephan R, 2021. Listeriosis caused by persistence of Listeria monocytogenes serotype 4b sequence type 6 in Cheese production environment. Emerging Infectious Disease Journal, 27, 1080–6059, 284. 10.3201/eid2701.203266 [DOI] [PMC free article] [PubMed] [Google Scholar]
- OIE (World Organisation for Animal Health) , 2018. Manual of Diagnostic Tests and Vaccines for Terrestrial Animals. Available online: https://www.oie.int/standard‐setting/terrestrial‐manual/
- Oksanen A, Siles‐Lucas M, Karamon J, Possenti A, Conraths FJ, Romig T, Wysocki P, Mannocci A, Mipatrini D, La Torre G, Boufana B and Casulli A, 2016. The geographical distribution and prevalence of Echinococcus multilocularis in animals in the European Union and adjacent countries: a systematic review and meta‐analysis. Parasites and Vectors, 9, 519. 10.1186/s13071-016-1746-4 [DOI] [PMC free article] [PubMed] [Google Scholar]
- Opsteegh M, Spano F, Aubert D, Balea A, Burrells A, Cherchi S, Cornelissen J, Dam‐Deisz C, Guitian J, Györke A, Innes EA, Katzer F, Limon G, Possenti A, Pozio E, Schares G, Villena I, Wisselink HJ and van der Giessen J, 2019. The relationship between the presence of antibodies and direct detection of Toxoplasma gondii in slaughtered calves and cattle in four European countries. International Journal for Parasitology, 49, 515–522. 10.1016/j.ijpara.2019.01.005 [DOI] [PubMed] [Google Scholar]
- Persad AK and Lejeune JT, 2015. Animal reservoirs of Shiga toxin‐producing Escherichia coli. In Enterohemorrhagic Escherichia coli and Other Shiga Toxin‐Producing E. coli, Wiley Online Library, pp. 211–230. [Google Scholar]
- Pervanidou D, Vakali A, Georgakopoulou T, Panagiotopoulos T, Patsoula E, Koliopoulos G, Politis C, Stamoulis K, Gavana E, Pappa S, Mavrouli M, Emmanouil M, Sourvinos G, Mentis A, Tsakris A, Hadjichristodoulou C, Tsiodras S and Papa A, 2020. West Nile virus in humans, Greece, 2018: the largest seasonal number of cases, 9 years after its emergence in the country. Eurosurveillance, 25. 10.2807/1560-7917.ES.2020.25.32.1900543 [DOI] [PMC free article] [PubMed] [Google Scholar]
- Possenti A, Manzano‐Román R, Sánchez‐Ovejero C, Boufana B, La Torre G, Siles‐Lucas M and Casulli A, 2016. Potential risk factors associated with human cystic echinococcosis: systematic review and meta‐analysis. PLoS Neglected Tropical Diseases, 10, e0005114. 10.1371/journal.pntd.0005114 [DOI] [PMC free article] [PubMed] [Google Scholar]
- Pozio E, 2014. Searching for Trichinella: not all pigs are created equal. Trends in Parasitology, 30, 4–11. 10.1016/j.pt.2013.11.001 [DOI] [PubMed] [Google Scholar]
- Pozio E, 2016. Trichinella pseudospiralis an elusive nematode. Veterinary Parasitology, 231, 97–101. 10.1016/j.vetpar.2016.03.021 [DOI] [PubMed] [Google Scholar]
- Pozio E, Rinaldi L, Marucci G, Musella V, Galati F, Cringoli G, Boireau P and La Rosa G, 2009. Hosts and habitats of Trichinella spiralis and Trichinella britovi in Europe. International Journal for Parasitology, 39, 71–79. 10.1016/j.ijpara.2008.06.006 [DOI] [PubMed] [Google Scholar]
- ProMED‐mail , 2020a. Q fever‐Bulgaria: (GB). ProMED‐mail, 2020. May: 20200521.7362087, Available online: http://www.promedmail.org
- ProMED‐mail , 2020b. Q fever ‐ Bulgaria (02): (GB, SH) sheep, goat, cattle, OIE. ProMED‐mail 2020. 11 June: 20200611.7458895, Available online: http://www.promedmail.org
- Regnault B, Evrard B, Plu I, Dacheux L, Troadec E, Cozette P, Chrétien D, Duchesne M, Vallat J‐M, Jamet A, Leruez M, Pérot P, Bourhy H, Eloit M and Seilhean D, 2021. First case of lethal encephalitis in Western Europe due to European Bat Lyssavirus Type 1. Clinical Infectious Diseases. 10.1093/cid/ciab443 [DOI] [PubMed] [Google Scholar]
- Remfry SE, Amachawadi RG, Shi X, Bai J, Tokach MD, Dritz SS, Goodband RD, DeRouchey JM, Woodworth JC and Nagaraja TG, 2021. Shiga toxin‐producing Escherichia coli in feces of finisher pigs: isolation, identification, and public health implications of major and minor serogroups. Journal of Food Protection, 84, 169–180. 10.4315/JFP-20-329 [DOI] [PubMed] [Google Scholar]
- Riccardo F, Bolici F, Fafangel M, Jovanovic V, Socan M, Klepac P, Plavsa D, Vasic M, Bella A, Diana G, Rosi L, Pezzotti P, Andrianou XD, Di Luca M, Venturi G, Maraglino F, Pervanidou D, Cenciarelli O, Baka A, Young J, Bakonyi T, Rezza G and Suk JE, 2020. West Nile virus in Europe: after action reviews of preparedness and response to the 2018 transmission season in Italy, Slovenia, Serbia and Greece. Globalization and Health, 16, 1–13. 10.1186/s12992-020-00568-1 [DOI] [PMC free article] [PubMed] [Google Scholar]
- Riccardo F, Monaco F, Bella A, Savini G, Russo F, Cagarelli R, Dottori M, Rizzo C, Venturi G, Di Luca M, Pupella S, Lombardini L, Pezzotti P, Parodi P, Maraglino F, Costa AN, Liumbruno GM, Rezza G and group tw, 2018. An early start of West Nile virus seasonal transmission: the added value of One Heath surveillance in detecting early circulation and triggering timely response in Italy, June to July 2018. Eurosurveillance, 23. 10.2807/1560-7917.ES.2018.23.32.1800427 [DOI] [PMC free article] [PubMed] [Google Scholar]
- Richter J, Esmann L, Lindner AK, Trebesch I, Equihua‐Martinez G, Niebank M, Georgi S, Schürmann D, Pfäfflin F, Pasić M and Gertler M, 2019. Cystic echinococcosis in unaccompanied minor refugees from Afghanistan and the Middle East to Germany, July 2016 through June 2017. European Journal of Epidemiology, 34, 611–612. 10.1007/s10654-019-00492-8 [DOI] [PubMed] [Google Scholar]
- Rivas L, Strydom H, Paine S, Wang J and Wright J, 2021. Yersiniosis in New Zealand. Pathogens, 10. 10.3390/pathogens10020191 [DOI] [PMC free article] [PubMed] [Google Scholar]
- Robardet E, Bosnjak D, Englund L, Demetriou P, Martín PR and Cliquet F, 2019. Zero endemic cases of wildlife rabies (Classical rabies virus, RABV) in the European Union by 2020: an achievable goal. Tropical Medicine and Infectious Disease, 4. 10.3390/tropicalmed4040124 [DOI] [PMC free article] [PubMed] [Google Scholar]
- Robinson E, de Valk H, Villena I, Le Strat Y and Tourdjman M, 2021. National perinatal survey demonstrates a decreasing seroprevalence of Toxoplasma gondii infection among pregnant women in France, 1995 to 2016: impact for screening policy. Eurosurveillance, 26. 1900710. 10.2807/1560-7917.ES.2021.26.5.1900710 [DOI] [PMC free article] [PubMed] [Google Scholar]
- Rodhouse JC, Haugh CA, Roberts D and Gilbert RJ, 1990. Red kidney bean poisoning in the UK: an analysis of 50 suspected incidents between 1976 and 1989. Epidemiology and Infection, 105, 485–491. 10.1017/S095026880004810X [DOI] [PMC free article] [PubMed] [Google Scholar]
- Rossi P, Tamarozzi F, Galati F, Pozio E, Akhan O, Cretu CM, Vutova K, Siles‐Lucas M, Brunetti E and Casulli A, 2016. The first meeting of the European Register of Cystic Echinococcosis (ERCE). Parasites & Vectors, 9, 243. 10.1186/s13071-016-1532-3 [DOI] [PMC free article] [PubMed] [Google Scholar]
- Rossi P, Tamarozzi F, Galati F, Akhan O, Cretu CM, Vutova K, Siles‐Lucas M, Brunetti E and Casulli A, 2020. The European Register of Cystic Echinococcosis, ERCE: state‐of‐the‐art five years after its launch. 13, Springer, 1–10. [DOI] [PMC free article] [PubMed]
- Ruscher C, Faber M, Werber D, Stark K, Bitzegeio J, Michaelis K, Sagebiel D, Wenzel JJ and Enkelmann J, 2020. Resurgence of an international hepatitis A outbreak linked to imported frozen strawberries, Germany, 2018 to 2020. Eurosurveillance, 25. 10.2807/1560-7917.ES.2020.25.37.1900670 [DOI] [PMC free article] [PubMed] [Google Scholar]
- Russini V, Spaziante M, Zottola T, Fermani AG, Di Giampietro G, Blanco G, Fabietti P, Marrone R, Parisella R, Parrocchia S, Bossù T, Bilei S and De Marchis ML, 2021. A nosocomial outbreak of invasive listeriosis in an Italian Hospital: epidemiological and genomic features. Pathogens, 10. 10.3390/pathogens10050591 [DOI] [PMC free article] [PubMed] [Google Scholar]
- Sapountzis P, Segura A, Desvaux M and Forano E, 2020. An Overview of the elusive passenger in the gastrointestinal tract of cattle: the shiga toxin producing Escherichia coli. Microorganisms, 8, 2076–2607. 10.3390/microorganisms8060877 [DOI] [PMC free article] [PubMed] [Google Scholar]
- Scaramozzino P, Carvelli A, Bruni G, Cappiello G, Censi F, Magliano A, Manna G, Ricci I, Rombolà P, Romiti F, Rosone F, Sala MG, Scicluna MT, Vaglio S and De Liberato C, 2021. West Nile and Usutu viruses co‐circulation in central Italy: outcomes of the 2018 integrated surveillance. Parasites & Vectors, 14, 243. 10.1186/s13071-021-04736-z [DOI] [PMC free article] [PubMed] [Google Scholar]
- Seiwald S, Simeon A, Hofer E, Weiss G and Bellmann‐Weiler R, 2020. Tularemia goes west: epidemiology of an emerging infection in Austria. Microorganisms, 8. 10.3390/microorganisms8101597 [DOI] [PMC free article] [PubMed] [Google Scholar]
- Sikkema RS, Schrama M, van den Berg T, Morren J, Munger E, Krol L, van der Beek JG, Blom R, Chestakova I, van der Linden A, Boter M, van Mastrigt T, Molenkamp R, Koenraadt CJM, van den Brand JMA, Oude Munnink BB, Koopmans MPG and van der Jeugd H, 2020. Detection of West Nile virus in a common whitethroat (Curruca communis) and Culex mosquitoes in the Netherlands, 2020. Eurosurveillance, 25. 10.2807/1560-7917.ES.2020.25.40.2001704 [DOI] [PMC free article] [PubMed] [Google Scholar]
- Siles‐Lucas M, Casulli A, Conraths FJ and Müller N, 2017. Laboratory diagnosis of Echinococcus spp. in human patients and infected animals. Advances in Parasitology, 96, 159–257. 10.1016/bs.apar.2016.09.003 [DOI] [PubMed] [Google Scholar]
- Špačková M, Gašpárek M and Stejskal F, 2021. Listeriosis ‐ an analysis of human cases in the Czech Republic in 2008–2018. Epidemiologie, Mikrobiologie, Imunologie, 70, 1210–7913, 42–51. [PubMed] [Google Scholar]
- Széll Z, Marucci G, Pozio E and Sréter T, 2013. Echinococcus multilocularis and Trichinella spiralis in golden jackals (Canis aureus) of Hungary. Veterinary Parasitology, 197, 393–396. 10.1016/j.vetpar.2013.04.032 [DOI] [PubMed] [Google Scholar]
- Tamarozzi F, Akhan O, Cretu CM, Vutova K, Akinci D, Chipeva R, Ciftci T, Constantin CM, Fabiani M, Golemanov B, Janta D, Mihailescu P, Muhtarov M, Orsten S, Petrutescu M, Pezzotti P, Popa AC, Popa LG, Popa MI, Velev V, Siles‐Lucas M, Brunetti E and Casulli A, 2018. Prevalence of abdominal cystic echinococcosis in rural Bulgaria, Romania, and Turkey: a cross‐sectional, ultrasound‐based, population study from the HERACLES project. The Lancet Infectious Diseases, 18 , 769–778. 10.1016/s1473-3099(18)30221-4 [DOI] [PubMed] [Google Scholar]
- Teunis PFM, Falkenhorst G, Ang CW, Strid MA, De Valk H, Sadkowska‐Todys M, Zota L, Kuusi M, Rota MC, Simonsen JB, Mølbak K, Van Duynhoven YTHP and Van Pelt W, 2013. Campylobacter seroconversion rates in selected countries in the European Union. Epidemiology and Infection, 141 , 2051–2057. 10.1017/S0950268812002774 [DOI] [PMC free article] [PubMed] [Google Scholar]
- Ullrich A, Schranz M, Rexroth U, Hamouda O, Schaade L, Diercke M and Boender TS, 2021. Impact of the COVID‐19 pandemic and associated non‐pharmaceutical interventions on other notifiable infectious diseases in Germany: an analysis of national surveillance data during week 1–2016 ‐ week 32–2020. The Lancet Regional Health ‐ Europe, 6, 2666–7762. 10.1016/j.lanepe.2021.100103 [DOI] [PMC free article] [PubMed] [Google Scholar]
- Verhoeven V, Tsakitzidis G, Philips H and Van Royen P, 2020. Impact of the COVID‐19 pandemic on the core functions of primary care: will the cure be worse than the disease? A qualitative interview study in Flemish GPs. British Medical Journal Open, 10. 10.1136/bmjopen-2020-039674 [DOI] [PMC free article] [PubMed] [Google Scholar]
- Vose D, 2019. Risk Analysis: A Quantitative Guide, 3rd Edition. John Wiley & Sons, Chichester. [Google Scholar]
- WHO (World Health Organization) , 2007. WHO Guidelines on tularaemia.9789645191397, Geneva. 115 pp. Available online: https://apps.who.int/iris/handle/10665/43793
- WHO and FAO (World Health Organization and Food Agriculture Organization of the United Nations) , 2018. Shiga toxin‐producing Escherichia coli (STEC) and food: attribution, characterization, and monitoring: report. Microbiological risk assessment series:1726‐5274, Rome. Available online: https://apps.who.int/iris/handle/10665/272871
- Wilking H, Lachmann R, Holzer A, Halbedel S, Flieger A and Stark K, 2021. Ongoing high incidence and case‐fatality rates for invasive listeriosis, Germany, 2010–2019. Emerging Infectious Diseases, 27, 1080–6059, 2485–2488. 10.3201/eid2709.210068 [DOI] [PMC free article] [PubMed] [Google Scholar]
- Young JJ, Haussig JM, Aberle SW, Pervanidou D, Riccardo F, Sekulić N, Bakonyi T and Gossner CM, 2021. Epidemiology of human West Nile virus infections in the European Union and European Union enlargement countries, 2010 to 2018. Eurosurveillance, 26. 10.2807/1560-7917.ES.2021.26.19.2001095 [DOI] [PMC free article] [PubMed] [Google Scholar]
- Ziegler U, Lühken R, Keller M, Cadar D, van der Grinten E, Michel F, Albrecht K, Eiden M, Rinder M, Lachmann L, Höper D, Vina‐Rodriguez A, Gaede W, Pohl A, Schmidt‐Chanasit J and Groschup MH, 2019. West Nile virus epizootic in Germany, 2018. Antiviral Research, 162, 39–43. 10.1016/j.antiviral.2018.12.005 [DOI] [PubMed] [Google Scholar]