Abstract
A large body of evidence has indicated that the phasic responses of midbrain dopamine neurons show a remarkable similarity to a type of teaching signal (temporal difference [TD] error) used in machine learning. However, previous studies failed to observe a key prediction of this algorithm: that when an agent associates a cue and a reward that are separated in time, the timing of dopamine signals should gradually move backward in time from the time of the reward to the time of the cue over multiple trials. Here, we demonstrate that such a gradual shift occurs both at the level of dopaminergic cellular activity and dopamine release in the ventral striatum in mice. Our results establish a long-sought link between dopaminergic activity and the TD learning algorithm, providing fundamental insights into how the brain associates cues and rewards that are separated in time.
Introduction
Maximizing future reward is one of the most important objectives of learning necessary for survival. To achieve this, animals learn to predict the outcome associated with different objects or environmental cues, and optimize their behavior based on the predictions. Dopamine neurons play an important role in reward-based learning. Dopamine neurons respond to an unexpected reward by phasic excitation. When animals learn to associate a reward with a preceding cue, dopamine neurons gradually decrease responses to the reward itself1,2. Because these dynamics resemble the prediction error term in animal learning models such as that in the Rescorla-Wagner model3, it is thought that dopamine neurons broadcast reward prediction errors (RPEs), the discrepancy between actual and expected reward value, to support associative learning1,2.
In machine learning, the temporal difference (TD) learning algorithm is one of the most influential algorithms, which uses a specific form of teaching signal, called TD error4. The aforementioned Rescorla-Wagner model treats an entire trial as a single discrete event, and does not take into account timing within a trial. In contrast, TD learning considers timing within a trial, and computes moment-by-moment prediction errors based on the difference (or change) in values between consecutive time points in addition to rewards received at each moment. TD learning models explain dopamine neurons’ responses to reward-predictive cues as a TD error: a cue-evoked dopamine response occurs because a reward-predictive cue indicates a sudden increase in value.
Despite these remarkable resemblance between the activity of dopamine neurons and TD error signals, a key prediction of TD errors – whether the activity of dopamine neurons follows TD learning models during learning – remains elusive. An important feature of TD learning algorithms, as evident in the classic models1,2, is that the timing of TD errors gradually moves backward from the timing of reward to the timing of cue (Figure 1a)2,5 (hereafter, “temporal shift”). This temporal shift is distinct from a change in the relative amplitudes between the responses time-locked to the cue and reward (hereafter, “relative amplitude shift”) (Figure 1b), which has been reported by a number of previous studies6–11. Although a temporal shift of dopamine signals has been historically considered as an important feature for the TD error account of dopamine responses11–16, it has not been observed in dopamine activity, despite previous attempts7,8,11,17. On one hand, the lack of such a unique signature of TD (even if not all TD errors show gradual shifts18) together with other observations indicating complexities of dopamine activity has encouraged alternative theories for dopamine12–15,19 which reject a comprehensive account of TD learning. On the other hand, recent findings reinforce the idea that dopamine activity follows TD errors even for non-canonical activity, such as ramping dopamine signals observed in dynamic environments20 and the dynamic dopamine signal that tracks moment-by-moment changes in the expected reward (value) that unfold as the animal goes through different mental states within a trial21.
Figure 1. Temporal shift of TD error.
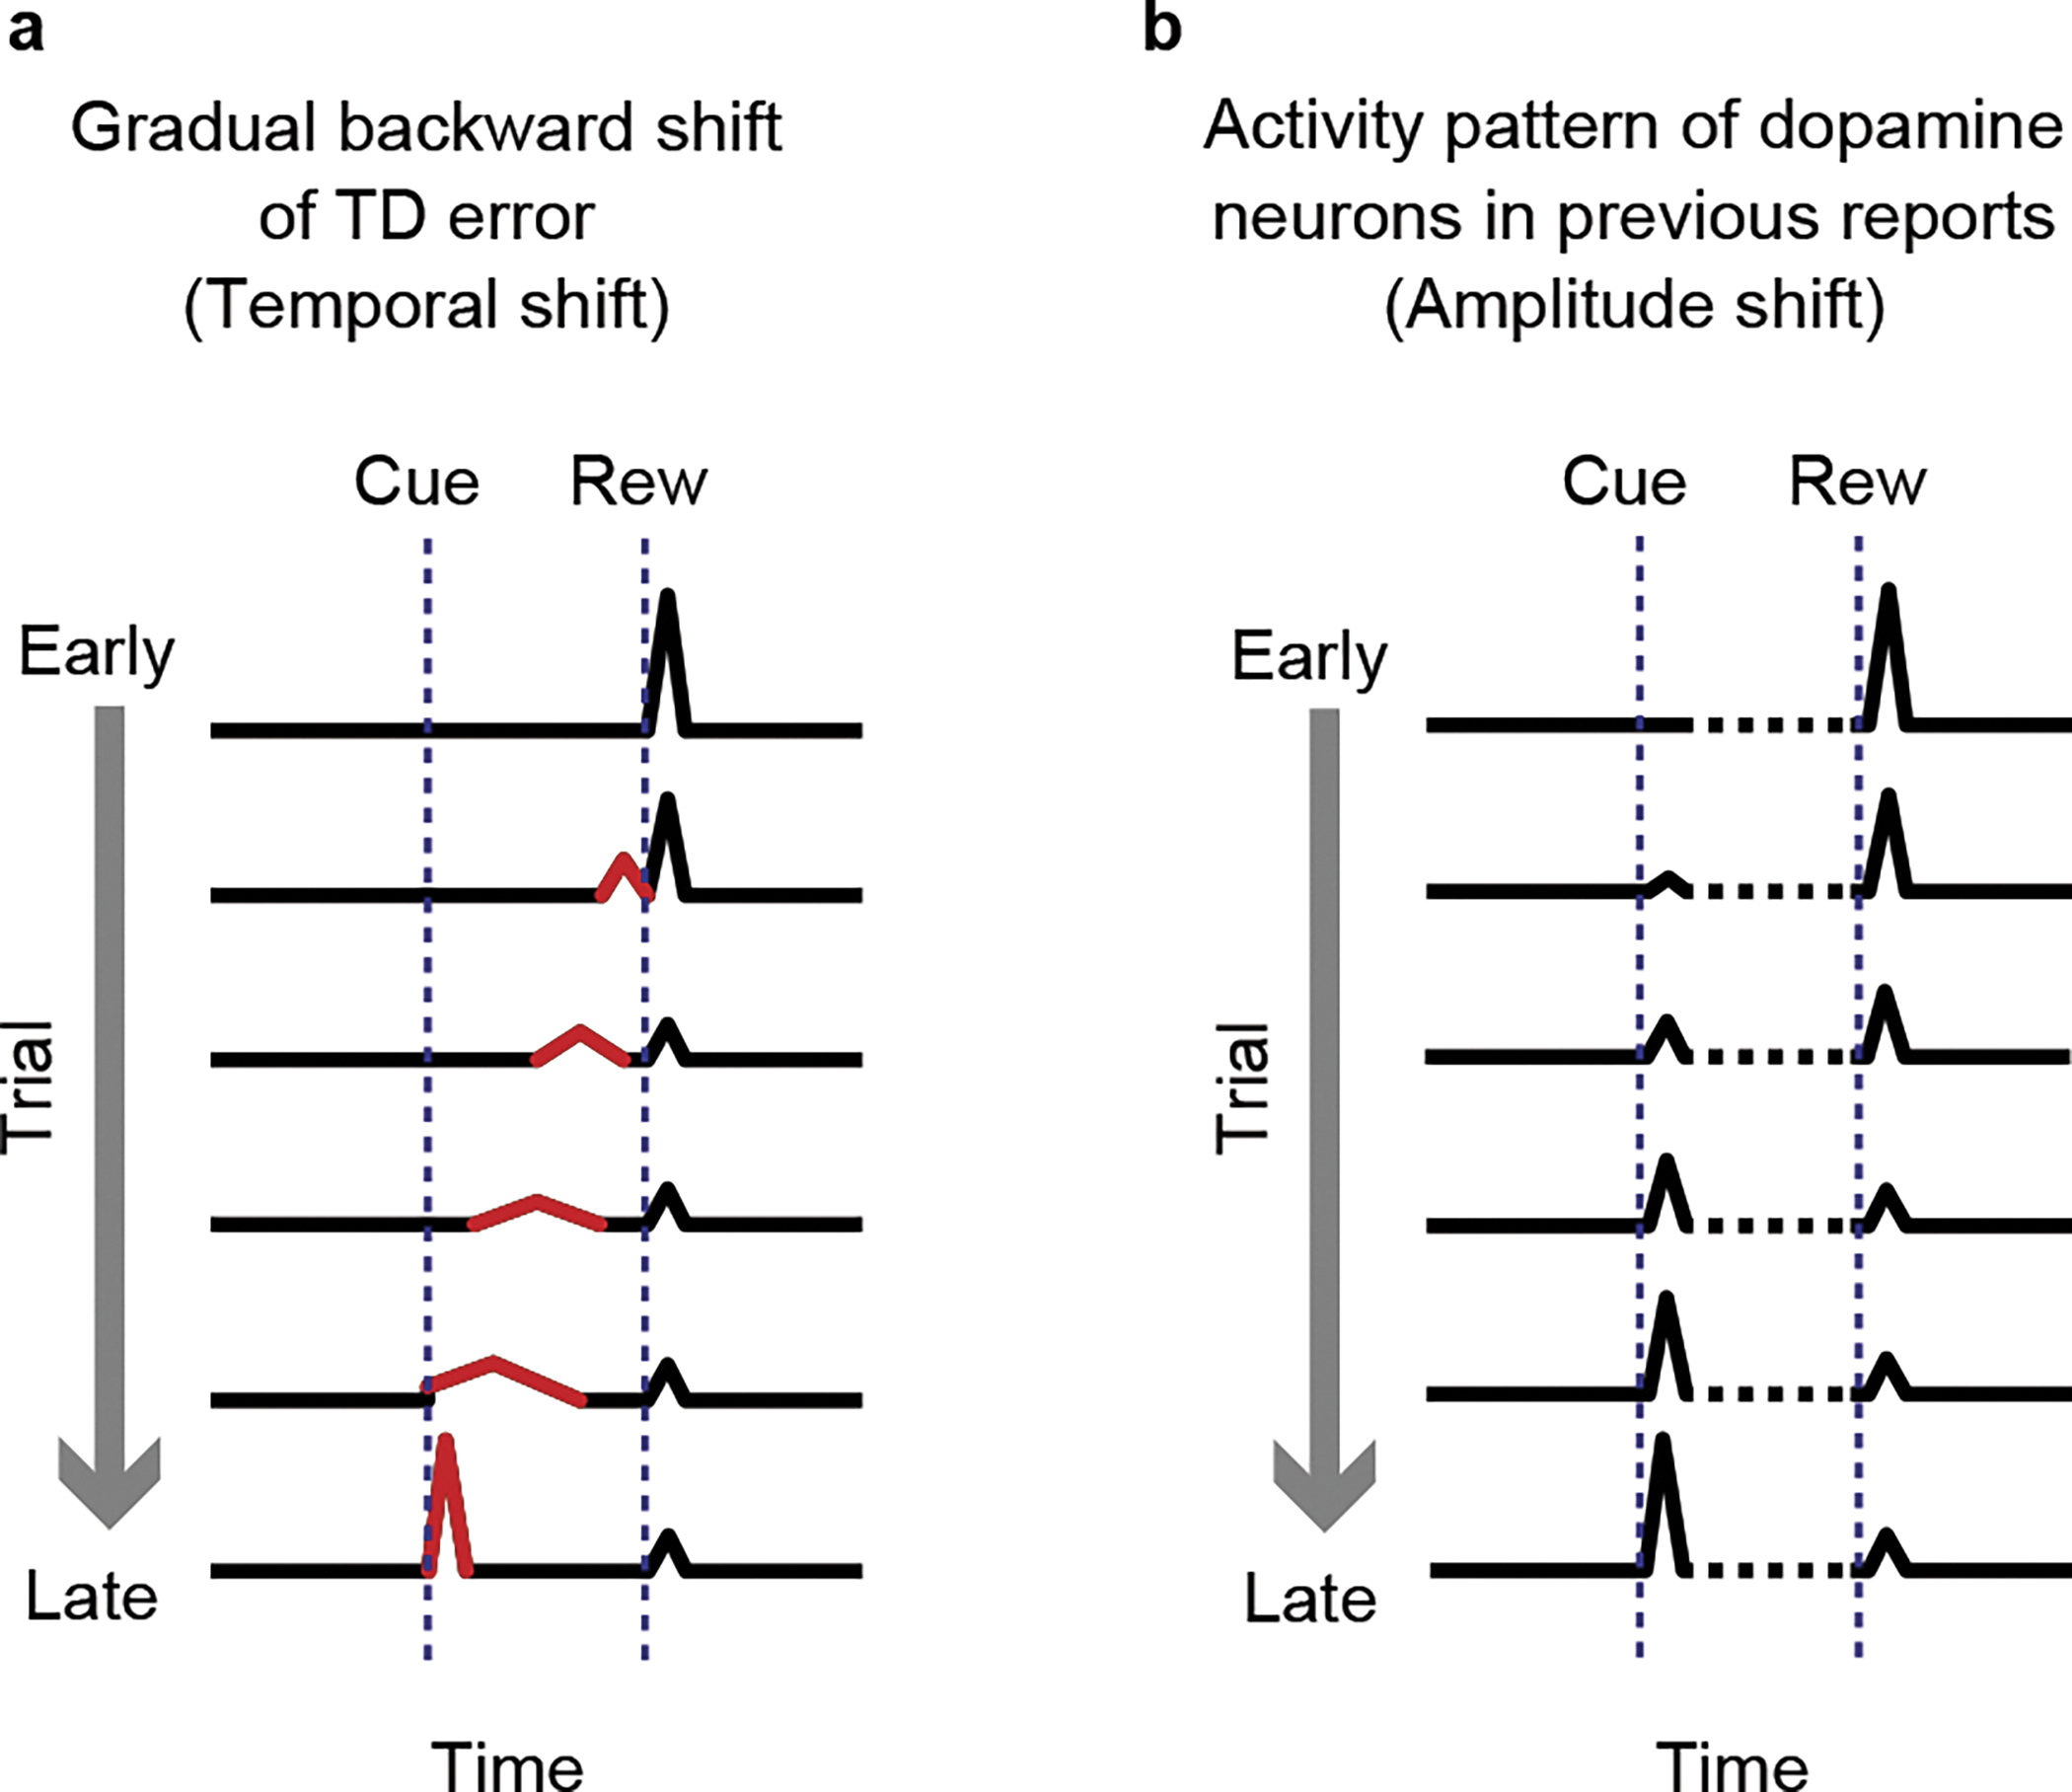
(a) Gradual temporal shift of TD error signal. (b) Gradual decrease of dopamine responses to reward and gradual increase of dopamine responses to the reward-predicting cue during associative learning in previous studies. The activity between cue and reward was not clear (dotted line).
There are multiple possible implementations of TD models, some of which predict that TD errors show gradual temporal shifts and some of which do not require this to happen, depending on the learning strategy used22–24. In other words, TD errors show a gradual temporal shift when an agent takes a specific learning strategy. Thus, depending on the task design, a gradual temporal shift in dopamine activity might be observed, or might be totally absent. Here, we employed different task conditions and examined temporal dynamics of dopamine cue responses that allowed us to observe this long-sought gradual shift. We also modelled and explored the conditions necessary for small shifting signals to be enhanced, and thus easily detected using specific experimental approaches.
Results
Dopamine dynamics during first cue-reward association
The activity of dopamine neurons during associative learning has typically been studied using well-trained animals, and observations of dopamine activity during the learning phase where the temporal shift is predicted to occur have been limited1,6,11,25,26. We previously recorded population activity of dopamine axons in the ventral striatum (VS), a major target area of dopamine projections, using fiber-fluorometry (photometry) while naive animals learned, for the first time, to associate odor cues and water reward (classical conditioning) in a head-fixed preparation8. During learning in naive animals, dopamine axons showed an activity change characteristic of RPE, i.e. increase of cue responses and decrease of reward responses, although we could not observe a clear gradual shift of the timing of dopamine response (Figure 1). This was potentially caused by insufficient temporal resolution due to the slow kinetics of GCaMP6m27, the Ca2+ indicator used in the previous study8. In the present study, we simply increased the delay duration between the cue and the reward (Figure 2). To detect dopamine dynamics, we injected adeno associated virus (AAV) in the VS to express the dopamine sensor GRABDA2m (DA2m)28 and measured fluorescence changes with fiber-fluorometry (Figure 2a, Extended Data Figure 1). When naive mice were trained to associate a single odor with water reward over multiple sessions, they gradually acquired anticipatory licking (Figure 2b). At the same time, as expected, dopamine responses to the reward-predicting cue gradually developed, whereas responses to reward gradually decreased (Figure 2c left and middle, 2d, Extended Data Figure 2a left). In contrast, responses to an unexpected reward (free reward) stayed high throughout these sessions (Figure 2c right, Extended Data Figure 2a right).
Figure 2. Dopamine release in the ventral striatum during first-time classical conditioning.
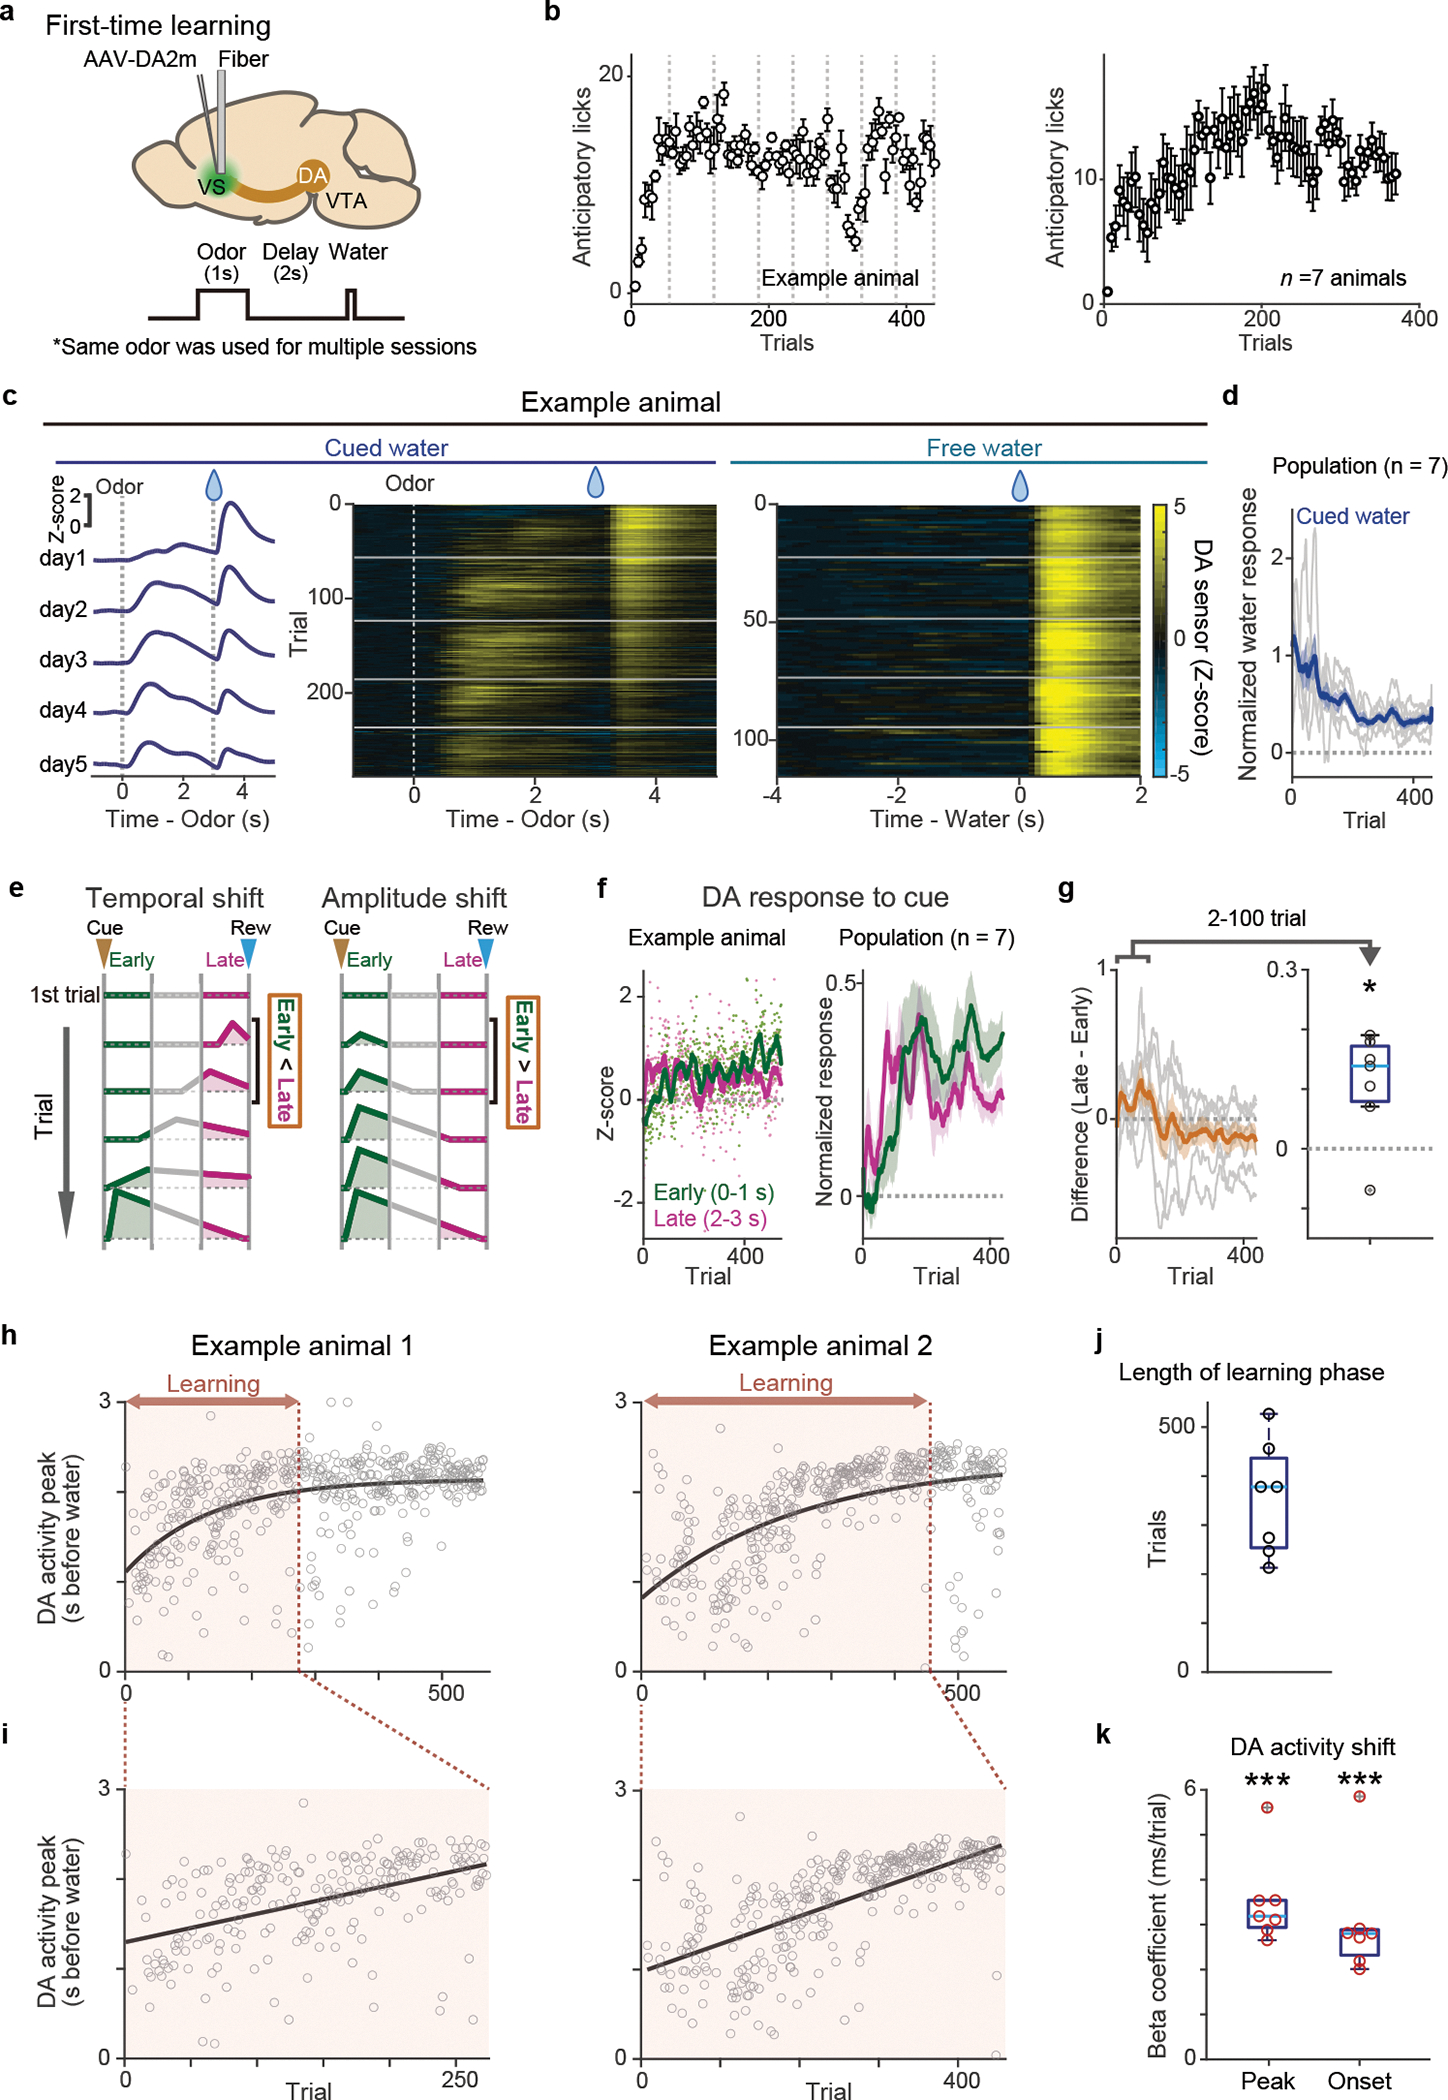
(a) Both dopamine sensor (DA2m) and optical fiber for fluorometry were targeted to VS. (b) Lick counts (5 trials mean ± sem) during the delay period (0–3 s after odor onset). Dotted lines (left, gray) indicate boundaries of sessions. (c) Dopamine signals for cued water trials (left and middle, mean ± sem) and for free water trials (right) in an example mouse. Horizontal lines (white, middle and right) indicate boundaries of sessions. (d) Dopamine responses (normalized with free water responses) to cued water in all animals (gray: each animal; blue: mean ± sem). (e) The temporal dynamics of cue responses in temporal shift (left) and amplitude shift (right). In temporal shift (left), immediate cue response (“Early”, green) develops slower than late phase cue response (“Late”, magenta). In amplitude shift (right), the immediate cue response (green) develops without prior development of responses in late phase (magenta). (f) Responses to a reward-predicting odor in an example animal (left) and in all animals (right, mean ± sem). early: 0–1 s from odor onset (green); late: 2–3 s from odor onset (magenta). (g) Difference between early and late odor responses (grey: each animal; orange: mean ± sem). Dopamine activity in the late phase was significantly higher than activity in the early phase during the first 2–100 trials (t = 3.3, p = 0.017; two-sided t-test). (h) Peak timing of dopamine sensor signal during the delay period (gray circles) was fitted with exponential curve (black) in 2 example animals. The learning phase was determined by trials with more than 1ms/trial of the temporal shift of the peak (red). (i) Linear regression of peak timing of dopamine sensor signal during learning phase (circles) with trial number. (j) Length of the learning phase in all animals. (k) Regression coefficients for peak timing and onset timing of dopamine sensor signal with trial number. Regression coefficients for both peak and onset were significantly positive (t = 9.4, p = 0.80 × 10⁻⁵ for peak, t = 6.2, p = 0.77 × 10⁻³ for onset; two-sided t-test). Red circle, significant slopes (p-value ≤ 0.05; F-test, no adjustment for multiple comparison). n=7 animals. Center of boxplot showing median, edges are 25th and 75th percentile, and whiskers are most extreme data points not considered as outlier. *p<0.05, ***p<0.001.
Looking at patterns of dopamine activity in each animal closely, we noticed some dynamical changes (Figure 2c–g, Extended Data Figure 2b): over learning, activity during the delay period (after cue onset to water delivery) was systematically altered. We observed that dopamine excitation was more prominent in the later phase of the delay period (Figure 2c, 2f Late) early on training, whereas after learning cue responses were typically observed immediately following the cue onset (Figure 2c, 2f, Early). In order to examine the temporal dynamics of dopamine activity in greater detail, we first tested how the peak of activity during the delay period changed over learning. We plotted the time point when the dopamine signal reached its maximum before water delivery in each trial (Extended Data Figure 2c). Next, we fitted an exponential function to the peak timing plotted as a function of trial number because the timing of the peak plateaued after a certain number of trials. In each animal, we observed a consistent shift of the peak timing (Figure 2h). In Figure 2i, we zoomed in on the learning phase, by excluding the later phase where the peak timing had plateaued (did not change any more than 1 ms/trial based on the exponential fit). The length of the learning phase was variable across animals (Figure 2j). However, we found that the temporal shift of the response peak was reliably observed in all animals, with the average shift of about 3.5 ms/trial during the learning phase (Figure 2i, 2k). This temporal shift was also detected when we analyzed the timing of the excitation onset instead of the peak (Figure 2k, Extended Data Figure 2d–e). To exclude the possibility that the shift is artificially generated from the analysis, we performed the same analysis using the data with trials shuffled (see Methods). Compared to the shuffled data, the correlation coefficient for the original data was significantly larger (p<0.05, repeated 500 times) in 6 out of 7 animals (Extended Data Figure 2f). Together, we detected a significant gradual shift of the timing of dopamine response in all the animals we examined both in terms of the peak and the excitation onset before reward.
To further confirm the temporal shift of responses, we next tested monotonic relationship of activity peak location over trials because linear regression analyses does not distinguish a gradual shift and one step development of cue responses (Figure 2h–k). Monotonic shift of activity peak location in >2 trials is only predicted in the temporal shift, but not in the amplitude shift (Figure 1). When 3 trials are randomly picked from the beginning of learning (2 trials) and post learning phase (1 trial), we found that the peak location exhibited monotonic shift with a higher probability than chance level in 6 out of 7 animals (Extended Data Figure 3a, b, see Methods), supporting the temporal shift.
Of note, the amplitude shift (Figure 1b and 2e, right) does not predict dynamical changes of the temporal pattern of cue responses, while the temporal shift may exhibit the dynamical shift of relative activity during the delay periods (Figures 1a and 2e, left). Consistent with the temporal shift, during early learning, activity during the late phase of the delay period was significantly higher than activity during the early phase of the delay period (Figure 2f, magenta versus green, Figure 2g, and Extended Data Figure 2b). We also examined the center of mass of activity during the delay period (see Methods). Similar to the relative magnitude between the early and late phase of the delay period (Figure 2e–g), the center of mass can be biased toward the later time window at the beginning of learning in temporal shift (Extended Data Figure 3c), while that is not the case in the amplitude shift. Indeed, we found that the center of mass of activity was significantly biased toward the later time period in early learning phase (Extended Data Figure 3c, d). Thus, these results supported the gradual temporal shift of dopamine responses, instead of the amplitude shift model.
Cue responses in dopamine axons during reversal tasks
The above experiment showed that there is a gradual shift of the timing of dopamine response while naive mice learned an association between an odor and reward. However, it remains unknown whether a shift occurs in other conditions, in particular, in well-trained animals with which previous experiments did not report a temporal shift6,8,24. We therefore next examined dopamine dynamics in well-trained animals learning new associations. Specifically, we used a reversal learning task: mice were first trained in a classical conditioning task for more than 12 days, and the odor-outcome contingency was reversed. Once the contingency was reversed, the same contingency was kept over multiple days, and we monitored how dopamine axon activity or dopamine concentration in VS develop throughout this period after reversal (Figure 3). Here we focus our analysis on the odor that was previously associated with no outcome before reversal and became associated with reward following it (Figure 3a). Importantly, in all sessions following the reversal we kept the same odor-outcome pairs, so that learning about the reversed contingencies was well consolidated over days, and we continued to measure dopamine activity during this process. We specifically avoided the use of novel cue, as it could cause a small excitation in some dopamine neurons29,30. The well-trained mice developed anticipatory licking within the first session of reversal (Figure 3b), faster than the aforementioned initial learning (Figure 2b). When we examined dopamine axon activity in each animal, the dopamine signal showed the temporal shift during the delay period (Figure 3c–e), similar to the initial learning but at a faster speed. We quantified the timing of the peak activity for three consecutive days after a reversal session, and found that the peak timing of both dopamine axon activity and dopamine concentration in VS showed a positive correlation with the trial number (Figure 3e, Extended Data Figure 4a–b, and Supplementary Figure 1), and monotonic shift at a higher probability than chance level in 6/7 animals (Extended Data Figure 4c). We also observed that dopamine excitation was more prominent in the late phase than early phase of the delay period immediately following reversal (Figure 3f) and the center of mass localized to the latter half of the delay period in the same phase of reversal learning (Extended Data Figure 5a). The temporal shift of dopamine axon activity was also observed in the reversal task when we switched an outcome from aversive air puff to water (Figure 3d–e, Extended Data Figures 4c and 5).
Figure 3. Dopamine axon activity in reversal learning.
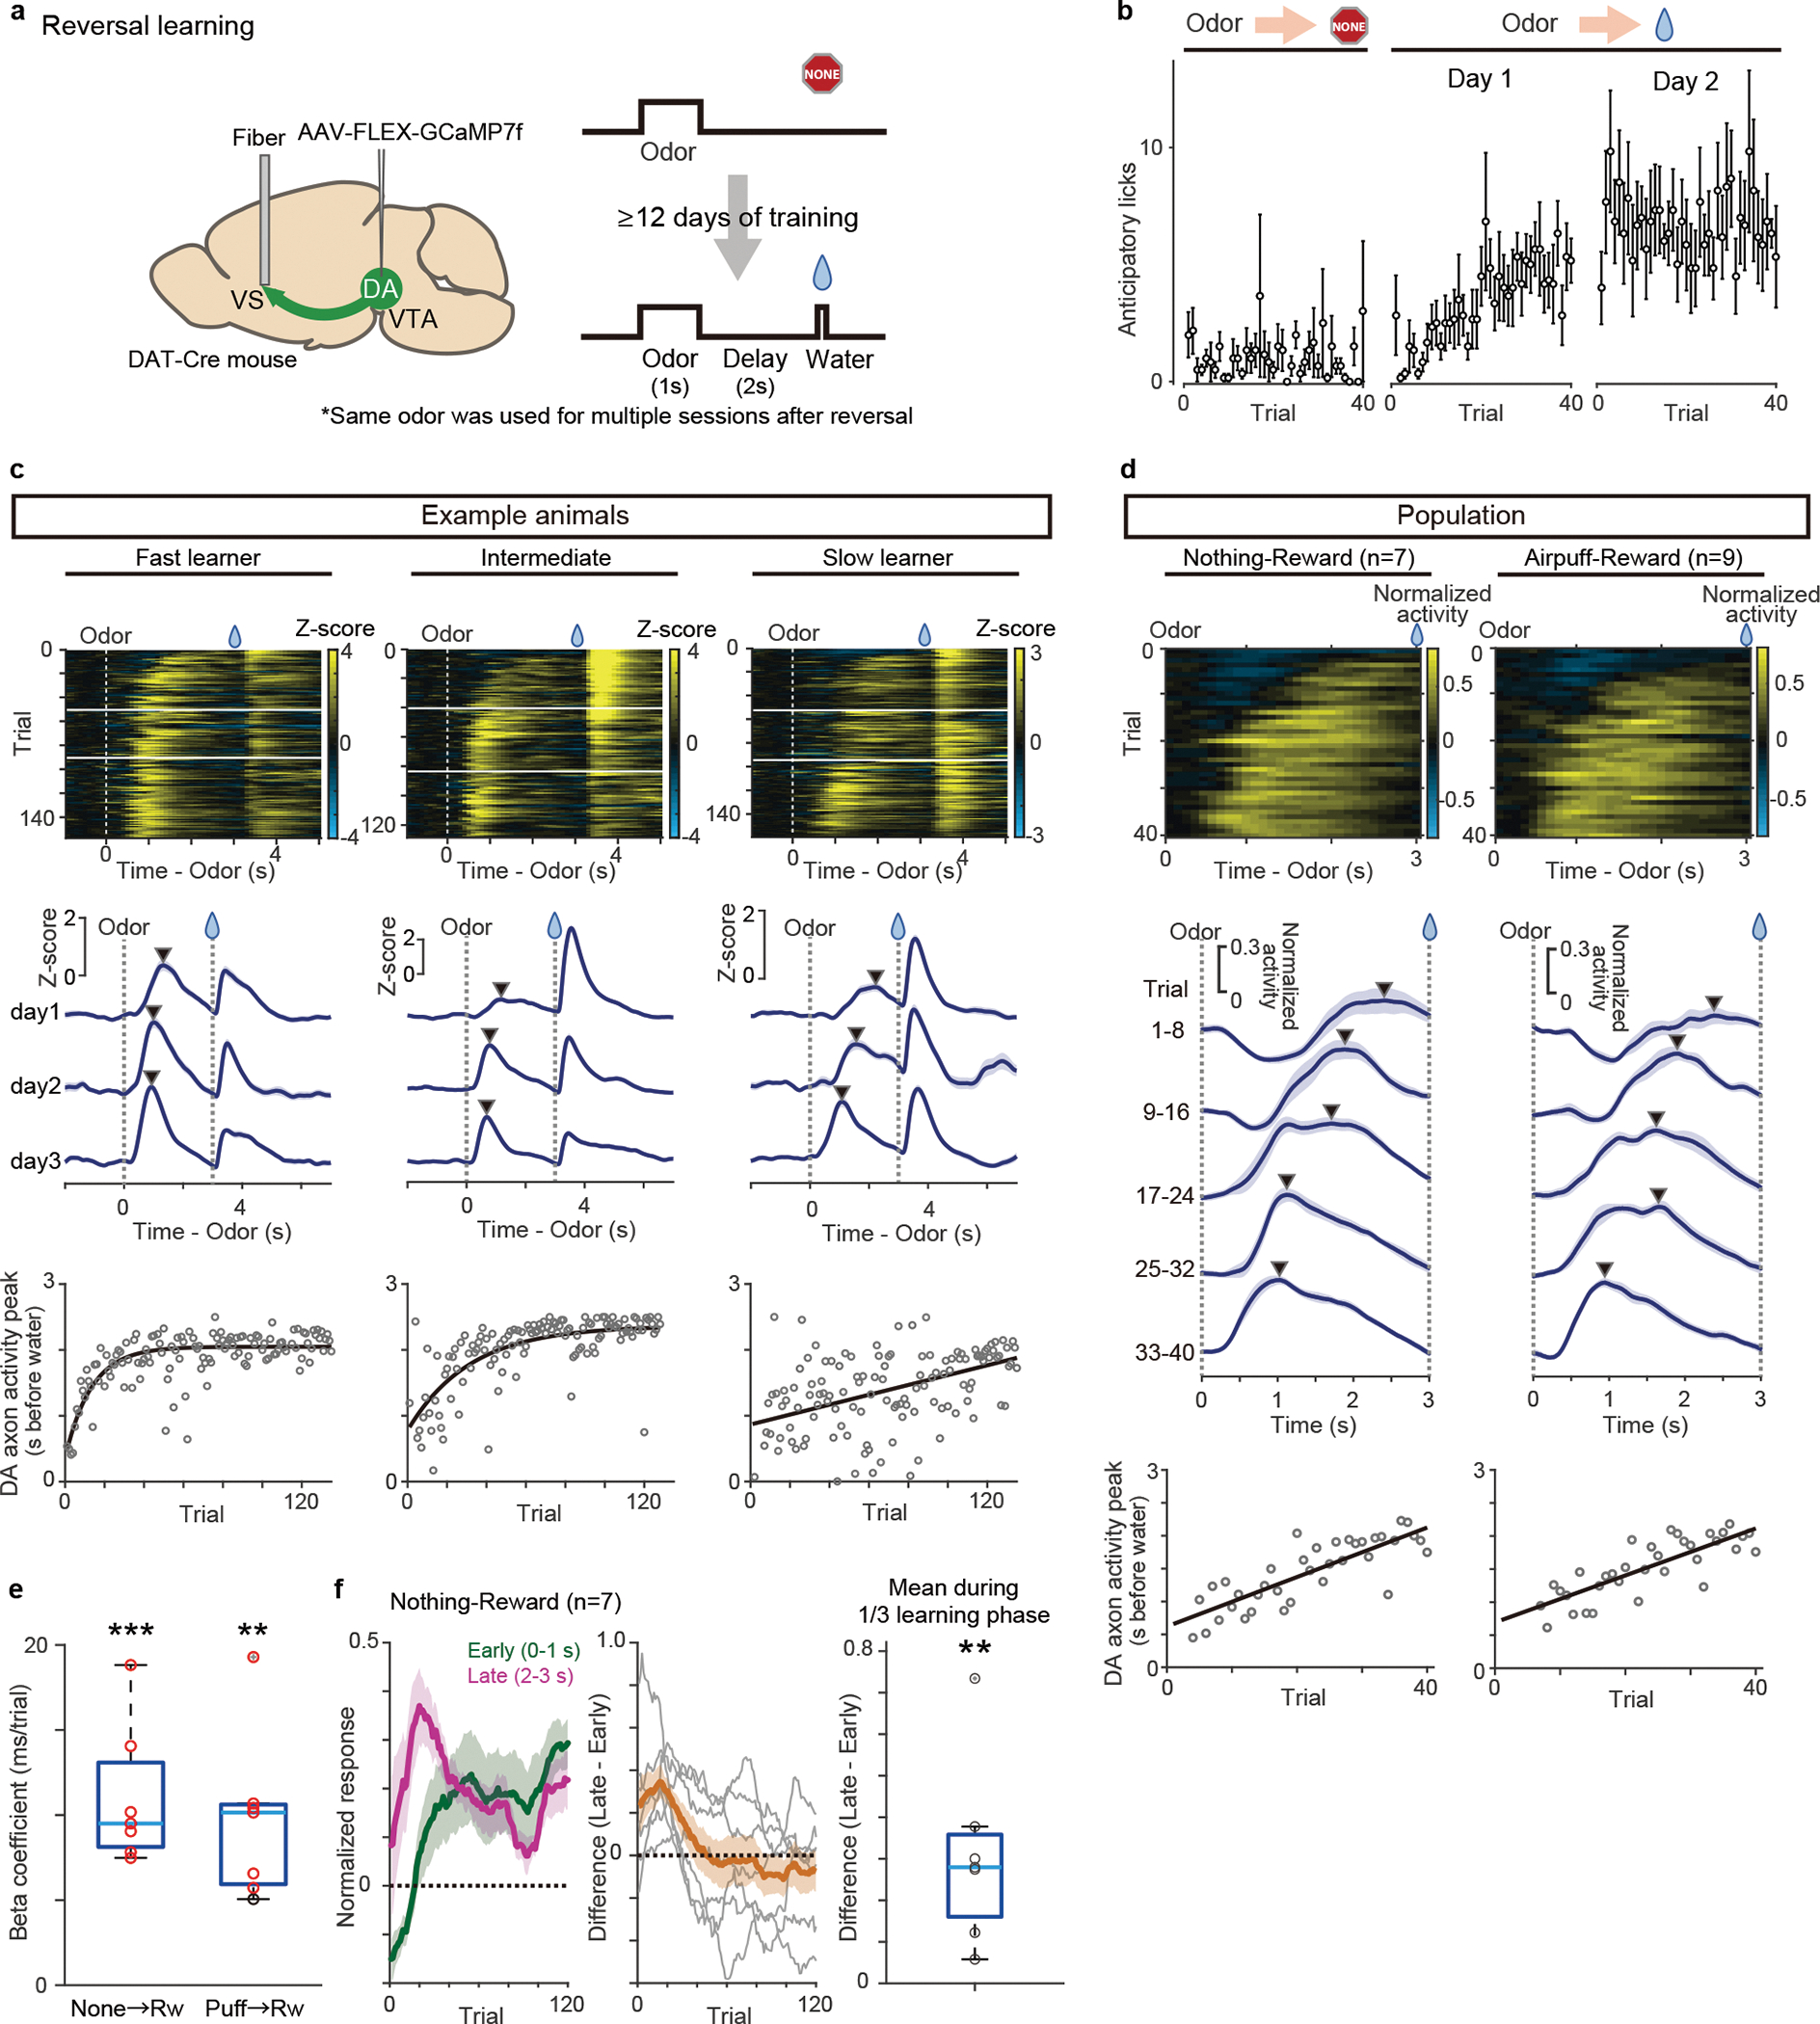
(a) AAV-GCaMP was injected into the VTA, and an optical fiber for fiber-fluorometry was targeted to VS. (b) Lick counts during the delay period (0–3 s after odor onset) with reversal training from nothing to reward (n = 6 animals, 3 animals with GCaMP and 3 animals with DA sensor were pooled). Mean ± sem for each trial. (c) Dopamine axon activity in 3 sessions after reversal from nothing to reward in 3 example animals. Horizontal white lines (top) indicate boundaries of sessions. Middle, mean ± sem for each day. Arrowhead indicates peak of the delay period. Bottom, dopamine axon activity peak (gray circles) and exponential curve fitted to peak across trials (black). (d) Average dopamine axon activity (normalized with free water response) in the first day of reversal from nothing to reward (left, n = 7 animals) and from airpuff to reward (n = 9 animals). Middle, each line shows population neural activity of 8 trials across the session (mean ± sem). Bottom, Linear regression of peak timing of average activity with trial number during reversal from nothing to reward (regression coefficient 37.5 ms/trial, F = 70, p = 6.4 × 10⁻¹⁰), and from airpuff to reward (regression coefficient 35.5 ms/trial, F =57, p = 1.2 × 10⁻⁸). (e) Regression coefficients for peak timing of GCaMP signals with trial number. Regression coefficients for peak was significantly positive (t = 7.1, p = 0.38 × 10⁻³ for nothing to reward reversal, t = 5.2, p = 0.18 × 10⁻² for airpuff to reward reversal; two-sided t-test). Red circle, significant slopes (p-value ≤ 0.05; F-test, no adjustment for multiple comparison). n=7 animals for each condition. (f) Responses to a reward-predicting odor in all animals (mean ± sem). early: 0–1 s from odor onset (green); late: 2–3 s from odor onset (magenta). Middle, difference between early and late odor responses (grey: each animal; orange: mean ± sem). Dopamine activity in the late phase was significantly higher than activity in the early phase during the first 1/3 of learning phase (t =3.7, p = 0.98 × 10⁻²; two-sided t-test). n=7 animals. Center of boxplot showing median, edges are 25th and 75th percentile, and whiskers are most extreme data points not considered as outlier. **p<0.01, ***p<0.001.
We next simultaneously recorded activity of dopamine axons in the VS and dopamine cell bodies in the VTA using fiber-fluorometry with GCaMP (Extended Data Figure 6). A gradual shift in the timing of dopamine response was observed both in dopamine axons in the VS and cell bodies in the VTA (Extended Data Figure 6b, c), although the degree of correlation between the peak timing and trial number was higher in dopamine axons in the VS than in dopamine cell bodies in the VTA (Extended Data Figure 6d), suggesting potential diversity of dopamine neurons in the VTA.
Dopamine neurons decrease their activity below baseline (‘dip’) in response to aversive events such as air puff and omission of expected reward2,31,32. TD model predicts that gradual temporal shift of the error signal could occur also for negative TD error1,33. To test whether negative responses also exhibit a temporal shift, we next examined activity dynamics during reversal from reward to air puff or no outcome (Extended Data Figure 7). We found that at reversal from reward to negative outcomes, negative responses were first observed during late phases of cue periods (2–3s after cue onset), and then gradually observed during early phases (0.75–1.75s after cue onset, to exclude remaining excitation at cue onset)(Extended Data Figure 7b–e). Here we detected the timing of a trough (negative peak) of activity instead of a peak (Extended Data Figure 7c, c’, f). The timing of dopamine activity trough was gradually shifted, and positively correlated with trial number (t = 2.6, p = 0.021, t-test, Extended Data Figure 7f). Thus, a gradual temporal shift was observed in both positive and negative responses in dopamine activity.
Signals recorded using fiber-fluorometry are inevitably contaminated by artifacts caused by movement. To exclude possible contributions of motion artifacts in our results, we examined the relationship between dopamine signals and licking behavior, which is a major source of movement artifacts in recording in head-fixed animals (Extended Data Figure 8). We first examined the peak timing of anticipatory licking in each trial. The results showed that anticipatory licks during learning peaked later than dopamine activity peaks (877 ± 180 ms slower than dopamine activity peak). Next, we analyzed the timing of the initiation of anticipatory licking. The first lick also appeared later than dopamine responses in many trials (427 ± 241 ms slower than dopamine activity peak, and 989 ± 154 ms slower than dopamine excitation onset) (Extended Data Figure 8e, g). With learning, animals tended to increase the vigor of anticipatory licking (total number of licks per trial) (Extended Data Figure 8b, c). On the other hand, we did not observe consistent temporal changes of the lick timing (Extended Data Figure 8d, f). As a result, we did not see a trial-to-trial correlation between the timing of the dopamine activity peak and the timing of initiation or peak of anticipatory licking (Extended Data Figure 8e, h). Thus, licking behaviors cannot explain the observed dynamics of dopamine signals in our recording. To control for any other potential recording artifacts, we also measured fluctuation of signals of the control fluorescence (red fluorescent protein, tdTomato) simultaneously with recording of GCaMP signals in some animals (Extended Data Figure 8a, f). tdTomato signals showed a different pattern of fluctuation compared to the GCaMP signals, and were not consistent across animals, suggesting that the recording artifacts cannot explain the dopamine activity pattern observed in this experiment. Importantly, while a significant temporal shift was observed in the dopamine activity peak, neither tdTomato signal peaks nor the peaks or initiation of anticipatory licks showed a significant shift in time (Extended Data Figure 8f).
Dopamine dynamics during repeated associative learning
Our observation indicates that not only initial learning in naïve animals, but also reward learning with a familiar odor in well-trained animals exhibit a backward temporal shift of dopamine activity. What about learning from a novel cue, which has traditionally been used in previous studies6,34? We examined dopamine axon activity during learning of a novel odor-water association in well-trained animals (Figure 4). As we mentioned above, multiple studies found that some dopamine neurons respond to a novel stimulus with excitation, especially when using a cue with the same modality as a previously learned rewarding cue, likely due to generalization29,35,36. We also observed small excitation to a novel odor in dopamine axon activity in well-trained animals, which presumably corresponds to generalization of initial value (Figure 4a, Supplementary Figure 2). In addition to the transient excitation at the onset of a cue, we found that there was another excitation during the later phase of the delay period (Figure 4a). If we focused only on the later phase of dopamine activity, the excitation appeared to be shifting backward in time. Hence, we quantified the peak timing. Because there were two peaks in some trials, in this case, we detected up to two peaks instead of detecting only the maximum (see Methods) (Figure 4b). When we examined the timing of the later peak (the first peak in case of one peak or the second peak in case of two peaks) during the delay period, we observed a significant correlation between the peak timing and the trial number (Figure 4c), indicating a temporal shift over time. The existence of two peaks hampered further analyses of the temporal shifts. The later peaks tend to show monotonic shift at a higher probability than chance level in 3 out of 5 animals, while analyses of relative activity and the center of mass may not be applied (Expected Data Figure 9). These observations indicated that detection of temporal shift is not straightforward in repeated learning in well-trained animals. However, the temporal shift is still detectable if we carefully consider excitation with a novel odor which likely reflects novelty and/or generalized value.
Figure 4. Dopamine axon activity in repeated associative learning.
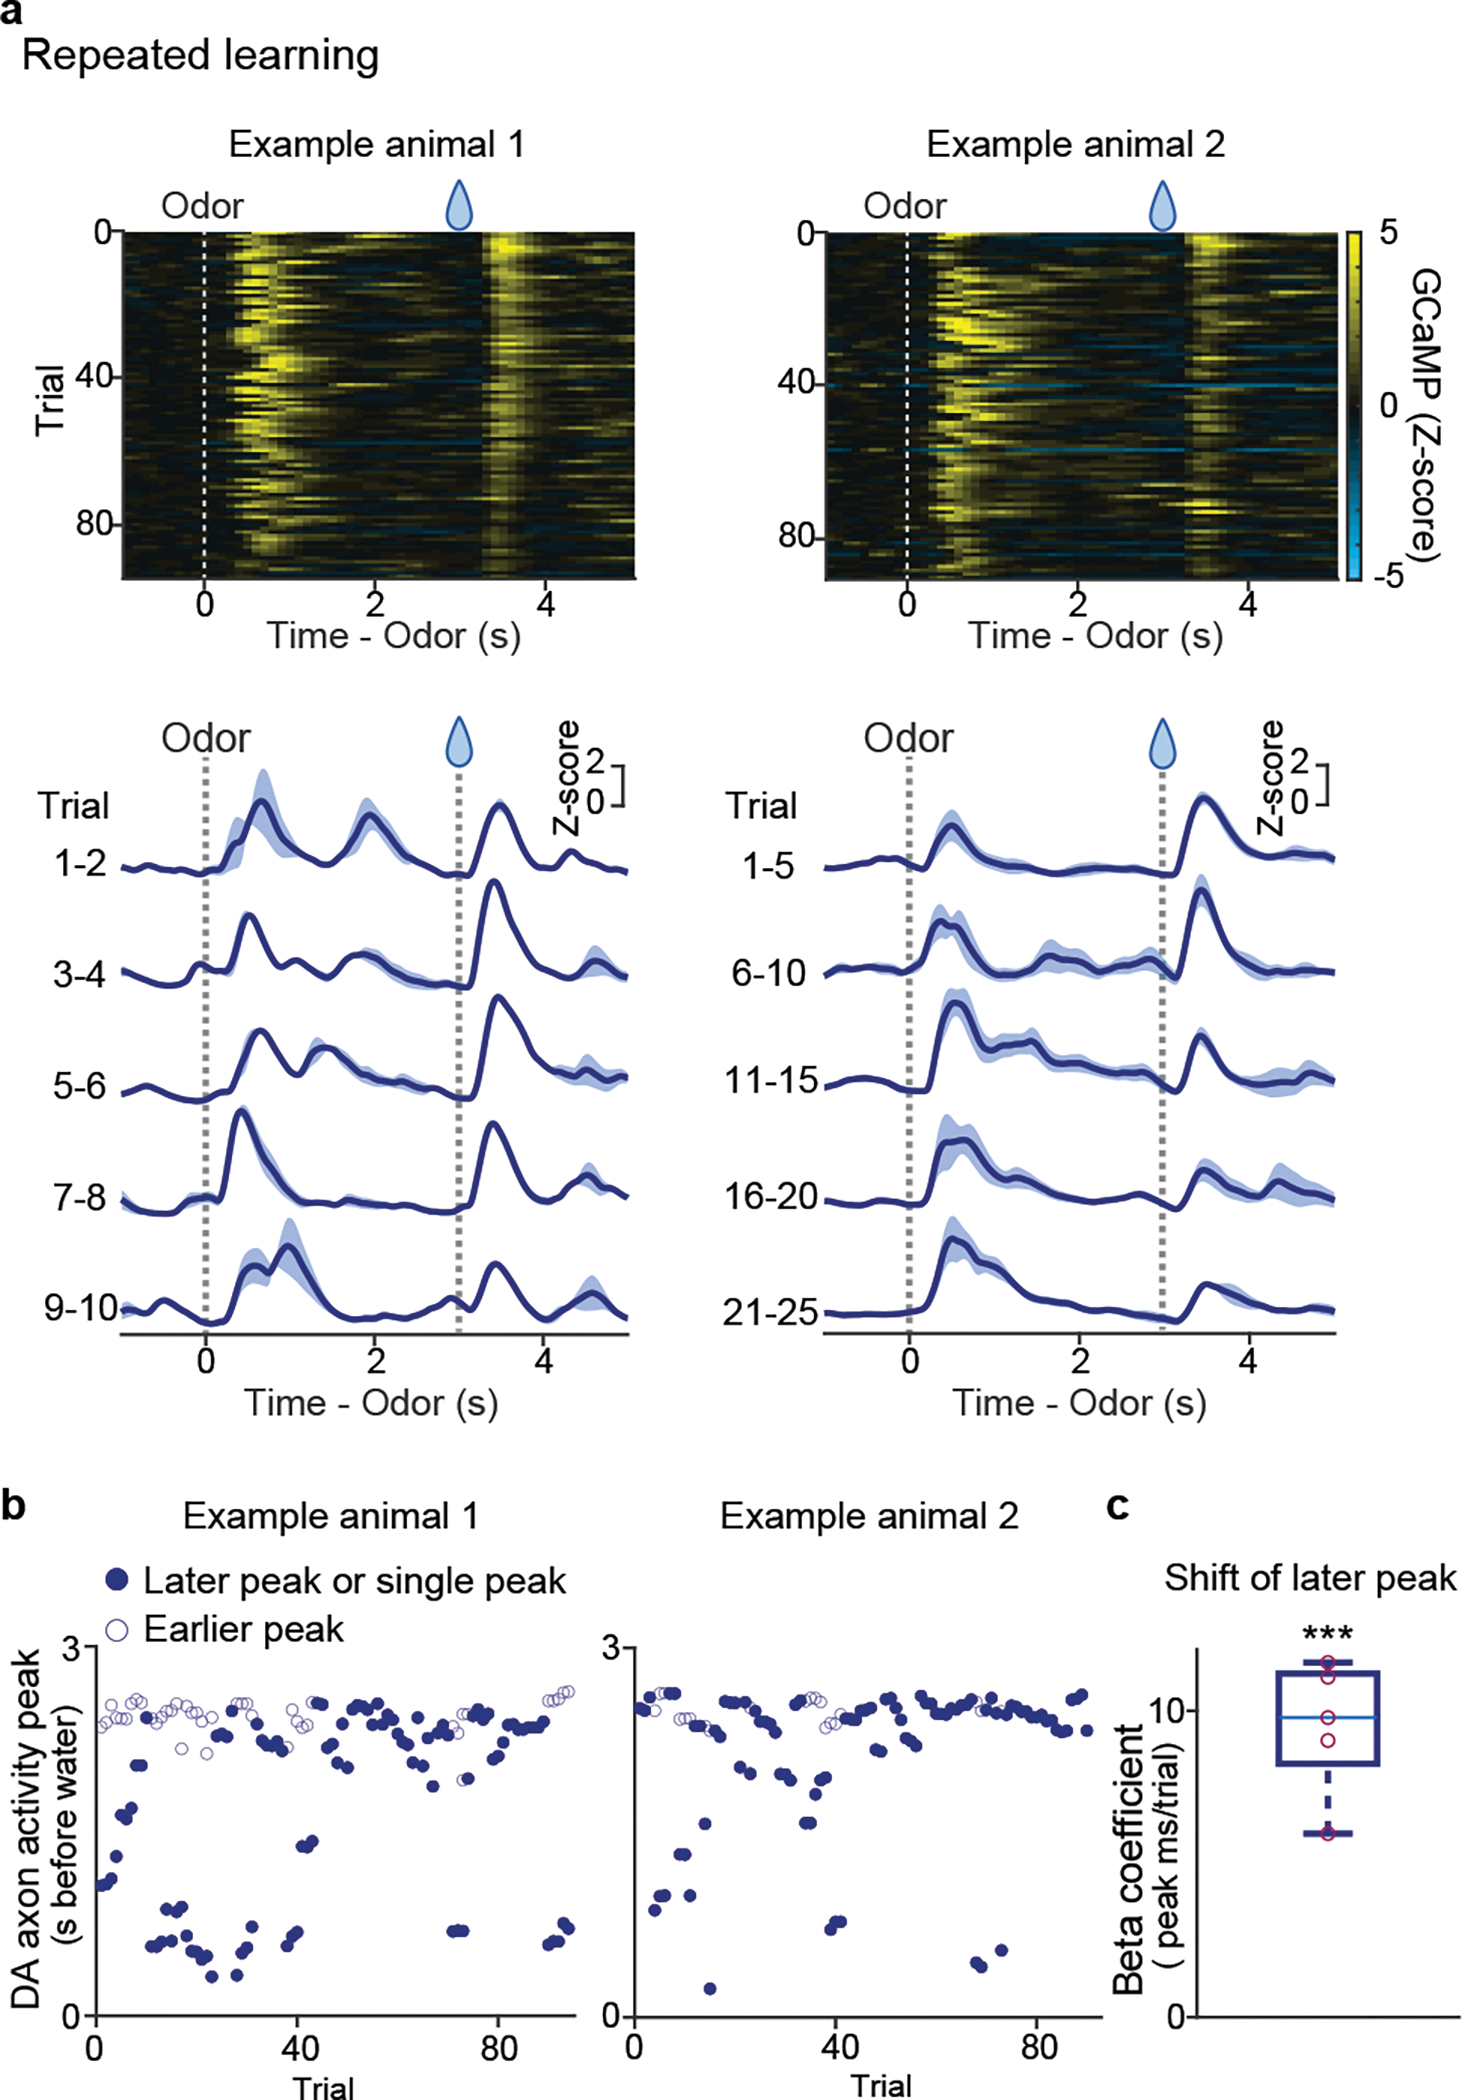
(a) GCaMP activity in odor-reward association trials in 2 example animals. Bottom, mean ± sem. (b) GCaMP activity peaks (up to 2 for each trial) in the same animals. Filled circles represent the 2nd peak (or peak in trials with only one). (c) Linear regression coefficients for 2nd peak timing with trial number (n = 5 animals; t = 9.6, p = 0.65 × 10⁻³; two-sided t-test). Red circles, significant (p-value ≤ 0.05, F-test). Center of boxplot showing median, edges are 25th and 75th percentile, and whiskers are most extreme data points. ***p<0.001
Activity of single dopamine neurons during reversal learning
So far, we reliably observed a gradual temporal shift of dopamine activity at a population level, either in axons in VS or in cell bodies in VTA during associative learning. These temporal shifts could be generated in each dopamine neuron. Alternatively, these shifts could be apparent only at the population level, for example, with each dopamine neuron responding at a specific delay from the cue. To distinguish these possibilities, we imaged VTA dopamine neurons expressing GCaMP with 2-photon microscopy through a Gradient Refractive Index (GRIN) lens37 (Figure 5, Extended Data Figure 10a, b) while animals performed a reversal learning task. We first analyzed the population activity in a whole field of view that includes all dopamine neurons and neuropils in the imaging window (Figure 5d–h). Similar to population activity recorded with fluorometry, we observed a gradual backward shift of population activity while the outcome associated with a particular odor was reversed from nothing to reward (Figure 5d–g). A significant temporal shift of activity peak was observed in an example animal (Figure 5d–e) as well as in the average activity over all animals (Figure 5f–g; n=4 animals). The timing of activity peak was positively correlated with trial number in most of recordings (7 out of 8 sessions; reversal sessions from nothing to reward and from air puff to reward from 4 animals are pooled) (Figure 5h). Next, we analyzed single neuron activity (Figure 5i–l). We found that some neurons showed gradually shifting activity (Figure 5i, j). Quantification of peak timing revealed that the majority of neurons showed a positive correlation with trial number (26/35 neurons in nothing to reward reversal and 26/36 neurons in air puff to reward reversal) (Figure 5k, l). Moreover, the peak location exhibited monotonic shift at a significantly higher probability than chance level in 14/21 neurons for nothing-reward and 11/16 neurons for airpuff-reward reversal (Extended Data Figure 10c). Consistent with temporal shift, the neural activity was more prominent in the late phase of cue responses relative to the early phase during early learning (Extended Data Figure 10d, e), and the center of mass was localized at the late half of cue/delay period in 23 out of 35 neurons for nothing to reward and 22 out of 36 airpuff to reward (Extended Data Figure 10f). Together, the majority of dopamine neurons in the VTA showed a temporal shift of activity during associative learning, even if the extent and speed of the temporal shift varied across neurons.
Figure 5. 2-photon imaging of dopamine activity in reversal learning.
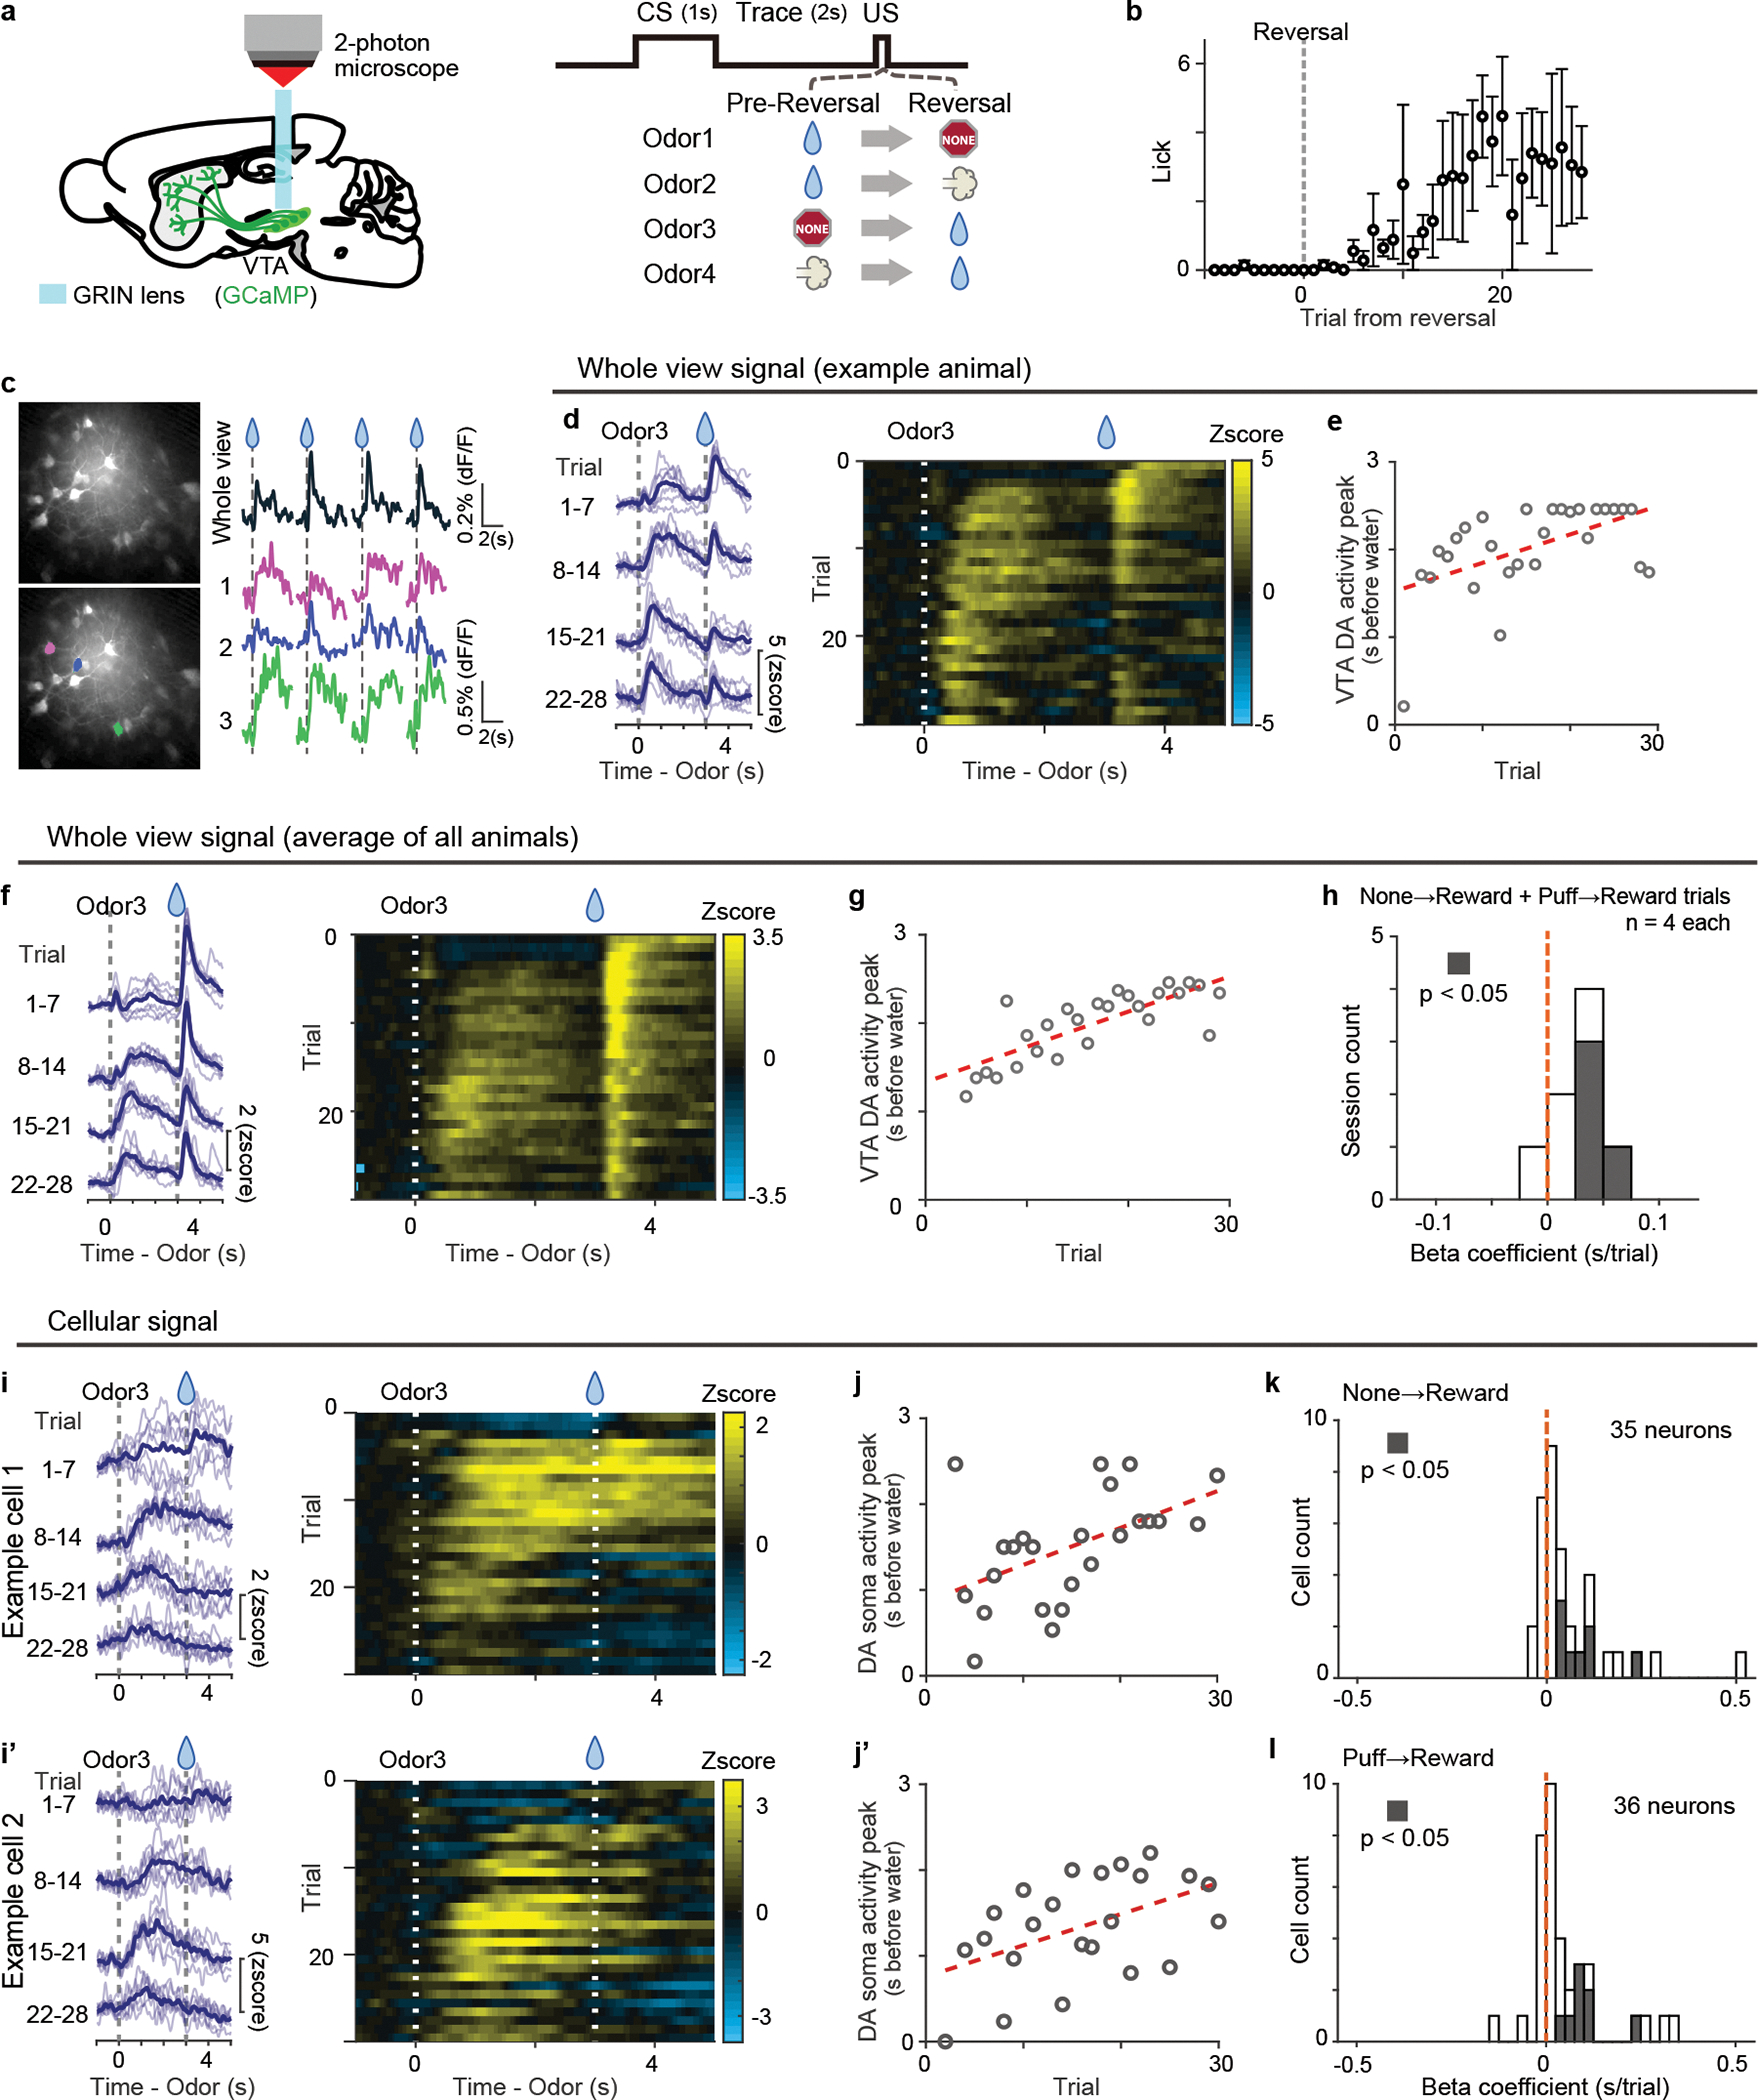
(a) Either GCaMP6f or GCaMP7s was expressed in the VTA dopamine neurons, and GRIN lens was targeted to the VTA. (b) Lick counts during the delay period (0–3 s after odor onset) with reversal training from nothing to reward (n = 4 animals). Mean ± sem for each trial. (c) Example GCaMP responses to unexpected water (every 3 trials) in a whole field of view (right top) and in 3 example cells (right bottom 3), marked with color (left bottom). (d) GCaMP signals in reversal trials in a whole field of view in an example animal. Left, each blue line shows 7 trials mean activity (light blue: each trial). (e) Dopamine activity peak (gray circle) and linear regression with trial number (regression coefficient 32 ms/trial, p = 4.2 × 10⁻³; F-test). (f) Average GCaMP signals in reversal trials in a whole field of view (n = 4 animals). Left, each blue line shows 7 trials mean activity (light blue: each trial). (g) Dopamine activity peak (gray circle) and linear regression with trial number (regression coefficient 39 ms/trial, p = 2.1 × 10⁻⁸; F-test). (h) Histogram for linear regression coefficients. Both reversals (from nothing to reward and from airpuff to reward) are pooled (n = 4 animals each). Gray bars show significant (p-value ≤ 0.05; F-test, no adjustment for multiple comparison) correlation. (i and i’) GCaMP signals in cell bodies of example neurons in VTA. Left, each blue line shows 7 trials mean activity (light blue: each trial). Right, heatmap for a session. (j and j’) Dopamine activity peak (gray circle) and linear regression with trial number ((j) regression coefficient 45 ms/trial, p = 6.5 × 10⁻³: (j’); regression coefficient 38 ms/trial, p = 1.3 × 10⁻²; F-test). (k and l) Histogram for regression coefficients for reversal from nothing to reward (k, n = 35 neurons from 4 animals) and for reversal from airpuff to reward (l, n = 36 neurons from 4 animals). Gray bars, significant slopes (p-value ≤ 0.05; F-test, no adjustment for multiple comparison).
Discussion
Our results demonstrate that a gradual backward shift of the timing of dopamine activity can be detected in various simple learning paradigms. These shifts were observed not only in the population dopamine activity (axons in VS, cell bodies in VTA, and dopamine release in the VS) but also at the single neuron level. Although such a shift has been regarded as one of the hallmarks of TD error signals, it has not been reported in previous studies involving recording of dopaminergic activity. The shifts observed in the present study, thus, provide a strong piece of evidence supporting a TD error account of dopamine signals in the VS, and constrain the mechanisms by which these signals are computed.
Dopamine responses during learning have been investigated in a number of studies. Hollerman and Schultz6 demonstrated a gradual decrease in reward response, and many other studies showed a gradual shift in the relative amplitude of cue- and reward-evoked responses7–10 (but see25). While the concurrent increase and decrease of the amplitudes of cue and reward responses (amplitude shift) is consistent with TD models, this can be explained by many alternative models12–15 or even much simpler learning models such as the Rescorla-Wagner model that does not have the notion of time within a trial. One critical feature that is unique to TD learning models is a gradual shift in the timing of TD error. In these models, there can be multiple “states” that tile the time between salient events (e.g. cue and reward). As an agent traverses (or as the time elapses) from one state to the next (St to St+1), TD error (δ) is computed over the adjacent two states,
where rt+1 is the reward the animal has just received, V(St) is the value of the state at time t, γ is a temporal discount factor (0 ≤ γ ≤ 1). Based on TD error, the value of the previous state V(St) is updated using a local learning rule defined by
Where α is a learning rate (0 ≤ α ≤ 1). Because of the local nature of value updating in simple TD learning models such as TD(0)5, learning is incremental: the value of reward must gradually propagate over multiple states backward in time over multiple trials until it reaches the time of cue onset. As the “frontline” of value moves backward in time, TD error also moves backward in time as TD error reflects a “change” in value that occurs at the frontline of value. In short, the timing of TD error gradually shifts backwards because of incremental learning over multiple states. Thus, our observation of gradual shift of timing of dopamine responses indicates multiple states between cue and reward and is consistent with the basic principle upon which TD learning algorithms operate.
It should be noted that the present data does not allow us to determine how many states exist between the cue and reward. The presence of shift depends on the existence of intermediate state(s) rather than the number (or size) of states. For example, Schultz et al. (1997) used 50 states but similar models that contain at least 1 or 2 states, or more, between cue and reward would all produce a “gradual” temporal shift between cue and reward (Supplementary Figure 3). The state representation in the brain could be also more continuous (e.g. using recurrent dynamics) rather than discrete states assumed in many of these models, and also contain some trial-by-trial stochasticity which would make the estimation of the number of states difficult. Importantly, our analysis did not assume a particular number of states. Thus, our conclusions do not depend on how many states are there. Our results support a continuous gradual shift, at least in some cases, but cannot resolve exactly how many states are present. We hope that future studies can address the exact nature of state representation.
Although many forms of TD learning models predict a temporal shift of the TD error signal, previous studies have failed to detect such a shift in dopamine activity during learning. What could prevent the detection of a temporal shift? First, we consider various differences in recording methods. Fluorometry signals using Ca2+ indicator and dopamine sensor show slower kinetics than spike data, and can be approximated by a slowly convolved version of the underlying spiking activity20. To qualitatively examine whether this slower kinetics contribute to detection of temporal shift, we simulated TD errors with different parameters and then convolved the TD errors with GCaMP’s response to mimic the slow sensor signals (see Methods). Our simulation analysis indicated that the mere convolution of TD errors with a filter mimicking fluorometry signals20 exaggerates small signals during the temporal shift (Figure 6a–d). Of note, the temporal shift is not observed by convolution when the original model does not exhibit a temporal shift, such as a learning model involving a Monte-Carlo update (Figure 6e, f). In contrast, TD model (TD(0) and TD-λ in this example; see Methods) show a clear (TD(0)) or a very small (TD-λ) “bump” shifting backward in time in the original model (Figure 6a–d). Because these bumps, even if small, spread over some time windows, the convolution with a slow filter (kernel)20 accumulates these signals over time, and “amplifies” them, making a bump more visible (Figure 6 a–d, Convolved). The use of a slow measurement such as fluorometry can, thus, facilitate the detection of a temporal shift even when the amplitude of each bump is very small. To compensate for the slowness, it was also necessary for us to increase the delay between cue and reward compared to previous studies8. Moreover, fluorometry records population activity from a large number of neurons of a specific cell-type, which could make detection of common activity features across neurons easier by averaging. These two factors, slow signals and averaging across the population, can increase the likelihood of detecting a temporal shift.
Figure 6. Dynamics of prediction error signals in models with different update rules.
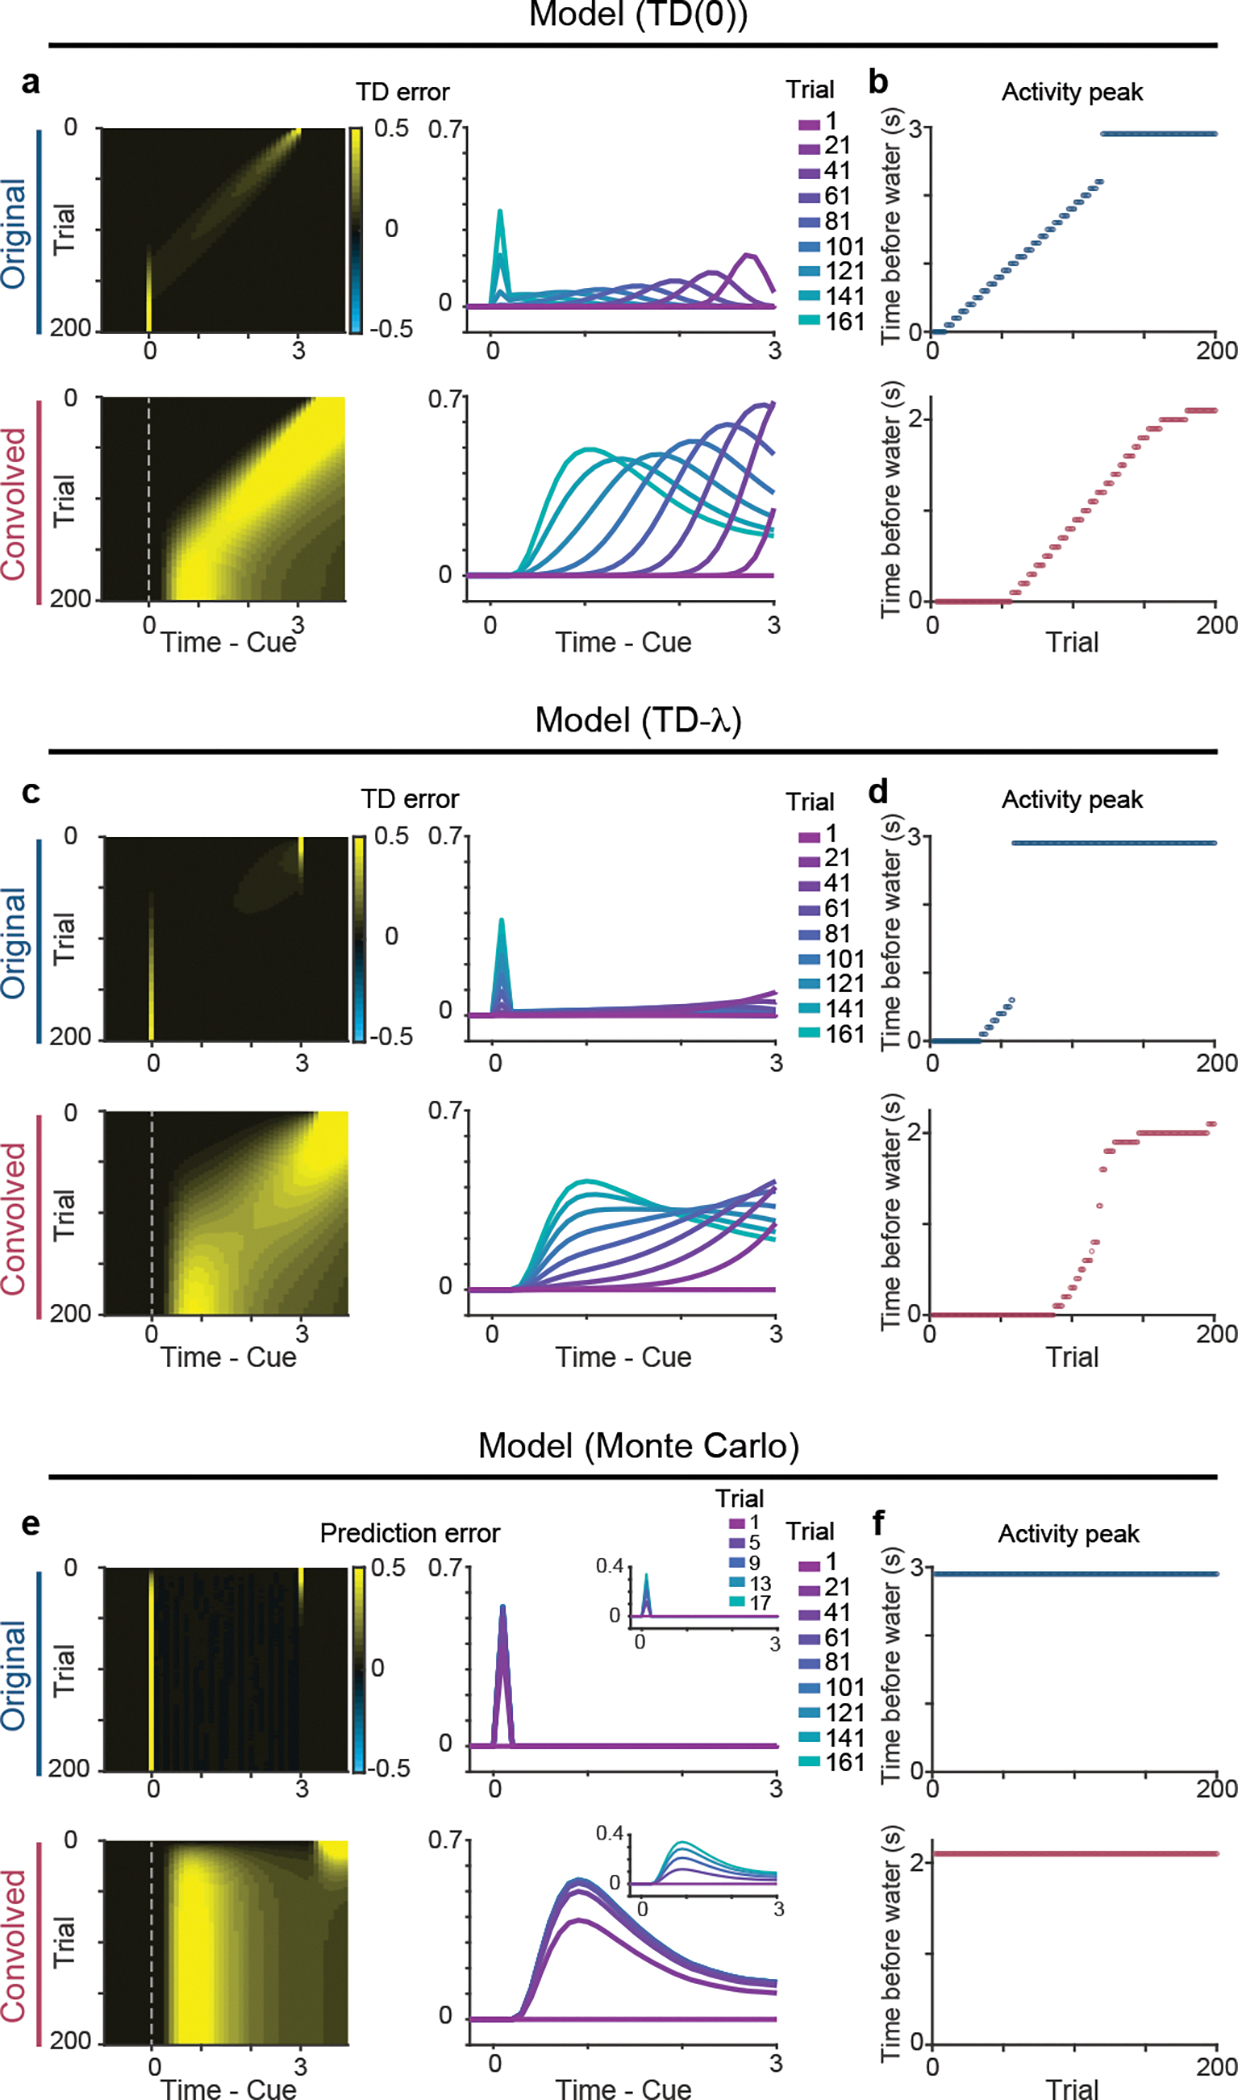
(a) Prediction error signals in TD(0) model (top) and signals convolved with GCaMP-like kernel to mimic fluorometry signals (bottom). (b) Peak timing of prediction error signals during a delay period. Convolution exaggerates a peak shift. (c) Prediction error signals in TD-λ model (top) and signals convolved with GCaMP-like kernel (bottom). (d) Peak timing of prediction error signals during a delay period. Convolution exaggerates a peak shift. (e) Prediction error signals during odor-reward associative learning with Monte Carlo updates (top) and signals convolved with GCaMP-like kernel (bottom). (f) Peak timing of prediction error signals during a delay period.
Second, it is important to consider heterogeneity of dopamine neurons. In the present study, we focused on the dopamine axon activity or dopamine concentration in VS, because dopamine signals in VS show canonical RPE signals in a relatively consistent manner8,38. Although we detected the shift in dopamine cell bodies in the VTA, the shift was clearer in the VS than in the VTA. Considering that dopamine neurons in VTA project to various projection targets including VS, subpopulations of dopamine neurons with different projection targets potentially use a slightly different learning strategy, which would result in different levels of temporal shift. Indeed, in our observation with 2-photon microscopy in the VTA, we found different levels and speeds of shift across single dopamine neurons. Notably, diversity of dopamine neuron activity could be also functional, such as population coding of value distribution39. It is important to examine in the future whether these differences correspond to different projection targets.
Third, training history affects dopamine dynamics. We found that detecting a shift in a novel odor-reward association (repeated associative learning) in well-trained animals was not straightforward partly due to excitation with a novel odor caused by generalization29,35. If animals are trained further, their strategy for learning can improve by changing a parameter in learning such as “λ” (lambda, a parameter for attention or eligibility trace11,40 in TD models), by suppressing behaviorally irrelevant distinctions between states (state abstraction22,23) during delay periods, and/or by inferring states from past learning experiences (belief state24,41). In the case of over-training, the predicted value may not slowly shift but shift immediately to the cue onset. Accordingly, dopamine neurons in animals with different training histories may show a varying extent of temporal shift. In the future, detection of a temporal shift in dopamine activity may be used to estimate the learning strategy of different animals, and of different brain areas.
Of note, in most cases, dopamine responses to water decreased gradually over learning, but did not totally disappear, similar to many previous studies, likely due to the temporal uncertainty because of the delay between cue and reward42. Although our findings support TD learning for dopamine RPE computation, multiple studies reported more complexity in dopamine activity than previously thought. Recent studies found that some complex dynamics in dopamine activity are also explained by TD errors20,21, even if not all activity is explained by TD errors21,43. Future studies should address how TD learning and these modulations interact.
The fact that these characteristics of TD error, including the temporal shift, are observed in single dopamine neurons indicates that the computation of TD error is likely performed in dopamine neurons and/or inherited from upstream neurons, rather than being generated as the population activity or computed at their axon terminals1,2,44,45. Because a previous study found that RPE signals were distributed in the activity of neurons presynaptic to dopamine neurons across various brain areas, TD errors are likely computed at multiple nodes46. Compared to the RPE signals in dopamine neurons, signals in those presynaptic neurons are more diverse, complicated, and can often be considered “partially computed” RPEs46. Thus, TD error computation could be distributed over the network, rather than performed at one specific type of neuron. The experimental conditions used in this study can offer an interesting paradigm to examine circuit mechanisms for TD error computation.
The incremental temporal shift of value is the hallmark of TD learning algorithm which provides a solution to credit assignment problems through bootstrapping of value updates40. Despite the powerfulness of TD learning algorithms in machine learning47,48, the signature of the temporal shift had not been observed in the brain. This has often been taken as evidence against dopamine activity as a TD error signal, and has hampered our understanding of how dopamine regulates learning in the brain. Here, we observed temporal shifts of dopamine responses during learning both in naïve and well-trained animals. These observations provide a foundation for understanding how dopamine functions in the brain, and ultimately deeper understanding of computational algorithms underlying reinforcement learning in the brain.
Methods
Animal
20 both female and male mice, 2–14 months old were used in this study. We used heterozygote for DAT-Cre (Slc6a3tm1.1(cre)Bkmn; The Jackson Laboratory, 006660)49, DAT-tTA (Tg(Slc6a3-tTA)2Kftnk; this study), VGluT3-Cre (Slc17a8tm1.1(cre)Hze; The Jackson Laboratory, 028534)50, LSL-tdTomato (Gt(ROSA)26Sortm14(CAG-tdTomato)Hze; The Jackson Laboratory, 007914)51, and Ai148D (B6.Cg-Igs7tm148.1(tetO-GCaMP6f, CAG-tTA2)Hze/J; The Jackson Laboratory, 030328)52 transgenic lines. VGluT3-Cre lines crossed with LSL-tdTomato were used for experiments with DA sensor, without use of Cre recombinase. Seven mice (5 males and 2 females) were used for first-time learning, twelve mice (9 males and 3 females) were used for reversal learning, and five mice (4 males and 1 females) were used for repeated learning. Mice are housed on a 12 hr dark (7:00–19:00)/12 hr light (19:00–7:00) cycle. Experiments were performed in the dark period. Ambient temperature is kept at 75±5 F° and humidity is kept below 50%. All procedures were performed in accordance with the National Institutes of Health Guide for the Care and Use of Laboratory Animals and approved by the Harvard Animal Care and Use Committee
Generation of Slc6a3-tTA BAC transgenic mice
Mouse BAC DNA (clone RP24-158J12, containing the Slc6a3 gene, also known as dopamine transporter gene) was modified by BAC recombination. A cassette containing the mammalianized tTA-SV40 polyadenylation signal53 was inserted into the translation initiation site of the Slc6a3 gene. The modified BAC DNA was linearized by PI-SceI enzyme digestion (NEB, USA) and injected into fertilized eggs from CBA/C57BL6 mice. We obtained 3 founders (lines 2, 10 and 15) and selected line 2 for the Slc6a3-tTA mouse line due to higher transgene penetrance in the dopamine neurons.
Plasmid and virus
To make pAAV-TetO(3G)-GCaMP6f-WPRE, we first made pAAV-TetO(3G)-WPRE by inserting WPRE from pAAV-EF1a-DIO-hChR2(H134R)-EYFP-WPRE54 (gift from Karl Deisseroth; addgene, #20298) cleaved with ClaI and blunted, into pAAV-TetO(3G)-GCaMP655, cleaved with EcoRI and BglII and blunted to remove GCaMP6 site. Then GCaMP6f from pGP-CMV-GCaMP6f (gift from Douglas Kim & GENIE Project; addgene, #40755)56 cleaved with BglII and NotI and blunted was inserted into pAAV-TetO(3G)-WPRE cleaved with ApaI and SalI and blunted to remove extra loxP site. Plasmids of pAAV-TetO(3G)-GCaMP6f-WPRE and pGP-AAV-CAG-FLEX-jGCaMP7f-WPRE (gift from Douglas Kim & GENIE Project; addgene, #104496)57 were amplified and purified with endofree preparation kit (Qiagen) and packaged into AAV at UNC vector core.
Surgery for virus injection, head-plate installation, and fiber implantation.
The surgeries were performed under aseptic conditions. Mice were anesthetized with isoflurane (1–2% at 0.5–1 L/min) and local anesthetic (lidocaine (2%)/bupivacaine (0.5%) 1:1 mixture, S.C.) was applied at the incision site. Analgesia (ketoprofen for post-operative treatment, 5 mg/kg, I.P.; buprenorphine for pre-operative treatment, 0.1 mg/kg, I.P.) was administered for 3 days following surgery. A custom-made head-plate was placed on the well-cleaned and dried skull with adhesive cement (C&B Metabond, Parkell) containing a small amount of charcoal powder. To express GCaMP in the dopamine neurons, AAV5-CAG-FLEX-GCaMP7f (1.8 × 10¹³ particles/ml) and AAV5-TetO(3G)-GCaMP6f (8 × 10¹² particles/ml) were injected unilaterally in the VTA (500 nl, Bregma −3.1 mm AP, 0.5 mm ML, 4.35 mm DV from dura) in 3 DAT-Cre mice and 2 DAT-tTA mice, respectively. In experiments of reversal learning and repeated learning, AAV5-CAG-FLEX-tdTomato (7.8 × 10¹² particles/ml; UNC Vector Core) and AAV5-CAG-FLEX-GCaMP7f were co-injected (1:1) in 3 DAT-cre mice and, AAV5-CAG-tdTomato (4.3 × 10¹² particles/ml; UNC Vector Core) and AAV5-TetO(3G)-GCaMP6f were co-injected (1:1) in 2 DAT-tTA mice. For expression of dopamine sensor in the VS, AAV9-hSyn-DA2m (1.01 × 10¹³ particles/ml; ViGene bioscience)28 was injected unilaterally in the VS (300nl, Bregma +1.45 AP, 1.4 ML, 4.35 DV from dura) in 7 VGluT3-Cre/LDL-tdTomato mice. These mice with dopamine sensor were used for experiments of initial learning, and 3 of them were also used for reversal learning. A glass pipette containing AAV was slowly moved down to the target over the course of a few minutes and kept for 2 minutes to make it stable. AAV solution was slowly injected (~15 min) and the pipette was left for 10–20 min. Then the pipette was slowly removed over the course of several minutes to prevent the leak of virus and damage to the tissue. An optical fiber (400 μm core diameter, 0.48 NA; Doric) was implanted in the VS (Bregma +1.45 mm AP, 1.4 mm ML, 4.15 mm DV from dura) or the VTA (Bregma −3.05 mm AP, 0.55 mm ML, 4.15 mm DV from dura). The fiber was slowly lowered to the target and fixed with adhesive cement (C&B Metabond, Parkell) containing charcoal powder to prevent contamination of environmental light and leak of laser light. A small amount of rapid-curing epoxy (Devcon, A00254) was applied on the cement to glue the fiber better.
Fiber-fluorometry (photometry)
To effectively collect the fluorescence signal from the deep brain structure, we used custom-made fiber-fluorometry as described38. Blue light from 473 nm DPSS laser (Opto Engine LLC) and green light from 561 nm DPSS laser (Opto Engine LLC) were attenuated through neutral density filter (4.0 optical density, Thorlabs) and coupled into an optical fiber patch cord (400 μm, Doric) using 0.65 NA 20x objective lens (Olympus). This patch cord was connected to the implanted fiber to deliver excitation light to the brain and collect the fluorescence emission signals from the brain simultaneously. The green and red fluorescence signals from the brain were spectrally separated from the excitation lights using a dichroic mirror (FF01-493/574-Di01, Semrock). The fluorescence signals were separated into green and red signals using another dichroic mirror (T556lpxr, Chroma), passed through a band pass filter (ET500/40x for green, Chroma; FF01-661/20 for red, Semrock), focused onto a photodetector (FDS10X10, Thorlabs), and connected to a current amplifier (SR570, Stanford Research systems). The preamplifier outputs (voltage signals) were digitized through a NIDAQ board (PCI-e6321, National Instruments) and stored in computer using custom software written in LabVIEW (National Instruments). Light intensity at the tip of patch cord was adjusted to 200 μW and 50 μW for GCaMP and DA2m, respectively.
Histology
All mice used in the experiments were examined for histology to confirm the fiber position. The mice were deeply anesthetized by an overdose of ketamine/medetomidine, exsanguinated with phosphate buffered saline (PBS), and perfused with 4% paraformaldehyde (PFA) in PBS. The brain was dissected from the skull and immersed in the 4% PFA for 12–24 hours at 4 °C. The brain was rinsed with PBS and sectioned (100 μm) by vibrating microtome (VT1000S, Leica). Immunohistochemistry with TH antibody (AB152, Millipore Sigma; 1/750) was performed to identify dopamine neurons, with DsRed antibody (632496, Takara; 1/1000) to localize tdTomato-expressing areas when tdTomato raw signal were not strong enough, and with GFP antibody (GFP-1010, Aves Labs; 1/3000) to localize GCaMP-expressing areas when GCaMP raw signals were not strong enough. The sections were mounted on a slide-glass with a mounting medium containing 4’,6-diamidino-2-phenylindole (VECTASHIELD, Vector laboratories) and imaged with Axio Scan.Z1 (Zeiss) or LSM880 with FLIM (Zeiss).
Behavior
After 5 days of recovery from surgery, mice were water-restricted in their cages. All conditioning tasks were controlled by a NIDAQ board and LabVIEW. Mice were handled for 2 days, acclimated to the experimental setup for 1–2 days including consumption of water from the tube, and head-fixed with random interval water for 1–3 days until mice show reliable water consumption. For odor-based classical conditioning, all mice were head-fixed, and the volume of water reward was constant for all reward trials (predicted or unpredicted) in all conditions (6 μl). Some condition contains mild air puff to an eye and the intensity of air puff was constant for all air puff trials (predicted or unpredicted; 2.5 psi). Each association trial began with an odor cue (last for 1 s) followed by 2 s delay, and then an outcome (either water, nothing, or air puff) was delivered. Odors were delivered using a custom olfactometer58. Each odor was dissolved in mineral oil at 1:10 dilution and 30 μl of diluted odor solution was applied to the syringe filter (2.7μm pore, 13mm; Whatman, 6823-1327). Odorized air was further diluted with filtered air by 1:8 to produce a 900 ml/min total flow rate. Different sets of odors (Ethyl butyrate, p-Cymene, Isoamyl acetate, Isobutyl propionate, 1-Butanol, 4-Methylanisole, (S)-(+)-Carvone, Caproic acid, Eugenol, and 1-Hexanol) were selected for four groups: group 1 (4 animals for initial learning, 2 of which were used for reversal learning), group 2 (3 animal for initial learning, 1 of which was used for reversal learning), group 3 (2 animal for reversal learning (airpuff to reward) followed by repeated learning), and group 4 (7 animals for reversal learning (both nothing to reward and airpuff to reward), 3 of which were used for repeated learning). A variable inter-trial interval (ITI) of flat hazard function (minimum 10s, mean 13s, truncated at 20s) was placed between trials. Each session was composed of multiple blocks (17–24 trial/block) and all trial types were pseudorandomized in each block. Each day, the mice did about 120–350 trials over the course of 25–75 min, with constant excitation from the laser and continuous recording.
Training for initial learning (Figure 1) started with an exposure to an odor chemical for the first time, using 4 types of trials; odor cue predicting 100% water, odor cue predicting 40% water/60% no outcome (nothing), odor cue predicting nothing (29.4% of all trials for each odor), and water without cue (free water) (11.8%) from day 1 to day 8, and odor cue predicting 80% water/20% nothing, odor cue predicting 40% water/60% nothing, odor cue predicting nothing (29.4% each), and free water (11.8%) on days 9 and 10. Neural activity was recorded in all ten sessions.
For reversal learning (Figure 2), mice were trained with classical conditioning for 12–24 days, and then, a nothing-predicting odor and/or airpuff-predicting odor were switched with an odor predicting high probability (80–100%) of water reward. More specifically, for reversal from both nothing- and puff-predicting odors to reward-predicting odors, 7 mice with GCaMP7f were first trained with odors A and B predicting 100% water, odor C predicting nothing, odor D predicting 100% airpuff (21.7% each), and free water (13.0%), from day 1 to day 12. On reversal day, odors A and B were switched with odors C and D, respectively. For reversal from nothing to reward with dopamine sensor-based recording, 3 mice used in the initial learning with DA sensor were trained for 9–13 more days (total 19–23 days), and then an 80% reward-predicting odor and a nothing-predicting odor were switched. For reversal of airpuff to reward, 2 mice with GCaMP6f were first trained with odor A predicting 100% water, odor B predicting 40% water, odor C predicting nothing, odor D predicting 100% airpuff (20.8% each), free airpuff (8.3%), and free water (8.3%) from day 1 to day 8, and then with odor A predicting 80% water, odor B predicting 40% water, odor C predicting nothing, odor D predicting 80% airpuff (20.8% each), free airpuff (8.3%), and free water (8.3%) from day 9 to day 23. On a reversal session, odor A was switched with odor D.
After 3 sessions of reversal learning, 3 mice with GCaMP7f were trained with 5 sessions of original conditioning (re-reversal; switching odor A and odor C, odor B and odor D again), before repeated learning (Figure 3). For repeated learning, an odor associated with 100% reward on re-reversal sessions (odorA) was replaced to a new odor, and the rest of trial types were kept exactly the same as re-reversal sessions. 2 mice with GCaMP6f were trained with repeated learning after 1 session of reversal learning. For repeated learning, an odor associated with high probability reward during a reversal session (odor C) was replaced with a new odor, and airpuff and free water trials were removed; new odor predicting 100% reward, odor B predicting 40% reward, and odor C predicting nothing (33.3% each).
Two-photon imaging from deep brain structure
Stereotaxic viral injections and GRIN lens implantation
Surgery was performed under the same conditions as described above. A craniotomy was made over either side of the VTA and a headplate was fixed to the skull for head-fixation experiments. In DAT-Cre mice, a glass pipette was targeted to the VTA (bregma −3.0 AP, 0.5 ML, −4.6 DV from dura) and the viral solution, AAV5-CAG-FLEX-GCaMP7f was injected using a manual plunger injector (Narishige) at a rate of approximately 20 nl per minute for a total of 300–400 nl. For both DAT-Cre and DAT-Cre;Ai148 double transgenic mice, a GRIN lens (0.6 mm in diameter, 7.3 mm length, 1050-004597, Inscopix) was slowly inserted above the VTA after insertion and removal of a 25G needle. The implants were secured with C&B Metabond adhesive cement (Parkell) and dental acrylic (Lang Dental).
Behavioral training and testing protocol
Mice were water-deprived in their home cage 2–3 days before the start of behavioral training, 2 or more weeks after surgery. All mice used in the 2-photon imaging experiments had previous exposure to a different odor association task, using different odors. During water deprivation, each mouse’s weight was maintained above 85% of its original value. Mice were habituated to the head-fixed setup by receiving water every 4 s (6 μl drops) for three days, after which association between odors and outcomes started. A mouse lickometer (1020, Sanworks) was used to measure licking as IR beam breaks. To deliver 10 psi air puffs, a pulse of air was delivered through a tube to the left eye of the mouse. Water valves (LHDA1233115H, The Lee Company) were calibrated, and a custom-made olfactometer based on a valve driver module (1015, Sanworks) and valve mount manifold (LFMX0510528B, LHDA1221111H valves, The Lee Company) was used for odor delivery. All components were controlled through a Bpod state machine (1027, Sanworks). Odors were diluted in mineral oil (Sigma-Aldrich) at 1:10 and 30 μl of each diluted odor was placed inside a syringe filter (2.7 μm pore size, 6823-1327, GE Healthcare). Odorized air was further diluted at 1:2 and delivered at 1500 ml/min. Odors used were 1-Butanol, Caproic acid, Eugenol, and 1-Hexanol. Four odors were associated, respectively, with reward (6 μl water drop), nothing, and air puff to the eye before reversal, and with air puff, nothing, and rewards after the reversal of the cue–outcome associations. In each trial, a randomly selected odor was presented for 1 s. Following a 2 s trace period, the corresponding outcome was available. Non-cued rewards were also delivered throughout the sessions. Mice completed one session per day.
Two-photon imaging
Imaging was performed using a custom-built two-photon microscope. The microscope was equipped with a diode-pumped, mode-locked Ti:sapphire laser (Mai-Tai, Spectra-Physics). All imaging was done with the laser tuned to 920 nm. Scanning was achieved using a Galvanometer and an 8kHz resonant scanning mirror (adapted confocal microscopy head, Thorlabs). Laser power was controlled using a Pockels Cell (Conoptics 305 with M302RM driver). Average beam power used for imaging was 40–120 mW at the tip of the objective (Plan Fluorite 20x, 0.5 NA, Nikon). Fluorescence photons were reflected using two dichroic beamsplitters (FF757-Di01-55×60 and FF568-Di01-55×73, Semrock), were filtered using a bandpass filter (FF01-525/50-50, Semrock), and collected using GaAsP photomultiplier tubes (H7422PA-40, Hamamatsu), whose signal was amplified using transimpedance amplifiers (TIA60 Thorlabs). Microscope control and image acquisition was done using ScanImage 4.0 (Vidrio Technologies). Frames with 512 × 512 pixel were acquired at 15 Hz. Synchronization between behavioral and imaging acquisitions was achieved by triggering microscope acquisition in each trial to minimize photobleaching using a mechanical shutter (SC10, Thorlabs).
Data analysis
Fiber-fluorometry
The noise from the power line in the voltage signal was cleaned by removing 58–62Hz signals through a band stop filter. Z-score was calculated from signals in an entire session smoothed with moving average of 50 ms. To average data using different sessions, signals were normalized as follows. The global change of signals within a session was corrected by linear fitting of signals and time and subtracting the fitted line from signals. The baseline activity for each trial (F0each) was calculated by averaging activity between −1 to 0 sec before a trial start (odor onset for odor trials and water onset for free water trials), and the average baseline activity for a session was calculated by averaging F0each of all trials (F0average). dF/F was calculated as (F − F0each)/F0average. dF/F was then normalized by dividing by average responses to free water (0 to 1 sec from water onset).
The activity peak during a cue/delay period was detected by finding a maximum response in moving windows of 20 ms that exceeds 2 × standard deviation of baseline activity (moving windows of 20 ms during −2 to 0 sec from an odor onset). The activity trough during a cue/delay period was detected by finding a minimum response in moving windows of 20 ms that is below 1.5 × standard deviation of baseline activity. The excitation onset during a delay period was detected by finding the first time point that exceeds 2 × standard deviation of baseline activity.
To test the temporal shift of dopamine activity of single animals in first-time learning, we fitted the timing of activity peak (or trough) or excitation onset to a trial number using a generalized linear model with exponential link function (Figure 2h, Extended Data Figure 2). The learning phase was defined as the duration until the timing of the activity peak shifts no more than 1ms/trial in the fitted exponential curve (Figure 2j). Linear regression was performed using the timing of activity peak (or trough) or excitation onset in trials of the learning phase with the trial number, and regression coefficients (beta coefficients) and correlation coefficients were calculated (Figure 2i, k). As controls, we shuffled the order of all the trials of the entire initial learning sessions. The peaks were detected, and temporal shift was tested as described above. This process was repeated for 500 times for each animal and the temporal shifts were compared with original data (Extended Data Figure 2f). We used same process of analysis for reversal learning (Figure 3c, d), except that the first 40 trials in the first session were used for linear fitting to the peaks of average activity of different animals (Figure 3f, Extended Data Figure 4b). To detect activity peaks in the repeated learning, multiple local maximums of the activity with prominence of more than 2 × standard deviation of the baseline activity, more than 100 ms apart were detected. If the detected peaks were more than 2, the 2 peaks with the largest amplitude of activity were chosen. Then the last peak (or the detected peak if only one peak was detected) was used for the regression analysis to test for a temporal shift (Figure 4).
To test the monotonic shift of peak location, we sampled 100 sets of three trials from the data. For first-time learning and reversal learning, first two trials were randomly sampled from the first 1/3 of trials in the learning phase and the third trial was randomly sampled from learned phase. For the animals that we could not determine the learning phase (see above), first and last 1/3 of all trials were used. For the repeated conditioning, we used the first 10 trials and last 1/3 of trials in the session because of quick learning. Then, monotonic relationship between the peak location and the trial number was tested. This process was repeated for 500 times. Control was performed in a similar manner except that the peak location of the first trial was replaced with random value between 1 to 3000 (ms). We chose this control condition rather than a normal shuffling method because trial shuffling would cause less monotonicity than actual data in case of both temporal shift and amplitude shift, due to cue responses at the early time window in later trials for both cases.
The center of mass of activity (0–3s after cue onset) was obtained for each trial and the center of mass at the beginning of learning (the first 1/3 of trials in the learning phase for first time and reversal learning, first 10 trials for repeated learning) was compared with half time point (1.5s) which would be the center of mass if activity is random.
Licking
Licking from a water spout was detected by a photoelectric sensor that produces a change in voltage when the light path is broken. The timing of each lick was detected at the peak of the voltage signal above a threshold. To plot the time course of licking patterns, the lick rate was calculated by a moving average of 300 ms window. The peak of anticipatory licking was detected at the maximum of lick rate during 0–3 s after odor onset. To detect anticipatory lick onset, the first and second licks were detected from 500 ms after odor onset because the onset of anticipatory licking is later than this period in well-trained animals. To binary score trials with or without anticipatory licking, trials with more than 4 licks during delay periods were defined as trials with anticipatory licking.
2-photon imaging
Acquired images were preprocessed in the following manner: 1) movement correction was performed using phase correlation image registration implemented in Suite2P59; 2) region-of-interest (ROI) selection was performed manually from the mean and standard deviation projections of a subset of frames from the entire acquisition, as well as a movie of the frames used to build those projections; 3) Neuropil decontamination was performed with FISSA60 using four regions around each ROI. The decontaminated signal extracted from these regions was then flattened (to correct for drifts caused by photobleaching), and z-scored across the entire session. The preprocessed and z-scored fluorescence were resampled to 30 Hz and used for further analysis. The first one was used to calculate ΔF/F0 in which F0 was the mean fluorescence before odor delivery. When the z-scored fluorescence was used for analysis, the mean z-score value before odor delivery was subtracted.
The activity peak during a cue/delay period was detected by finding a maximum response in moving windows of 200 ms that exceeds 2 × standard deviation of baseline activity (calculated by averaging a moving windows of 200 ms during −2 to 0 sec from an odor onset) for whole view data, and 3.5 × standard deviation of baseline activity for each cell to compensate for noise. To test the temporal shift of dopamine activity, we fitted the timing of activity peak to a trial number using a generalized linear model. Learning phase was determined as described above. The first 30 trials after reversal were used for fitting when learning phase could not be determined. A neuron that did not have multiple significant peaks in cue/delay period was removed from the analysis (1/36 for nothing to reward, 0/36 for airpuff to reward). Tests for center of mass were performed with each neuron with the same procedure as photometry data. Monotonic shift was tested with each neuron with the similar procedure as photometry data if the learning phase was able to be determined and if there are sufficient number of peaks detected for the analysis (>2 peaks for beginning of learning, >1 peak for learned phase). Otherwise, first 1/3 and last 1/3 of trials in a session was used for the analysis if there are sufficient number of peaks (>2 peaks for the first 1/3, >1 peak for last 1/3). If the peak number was not sufficient, we excluded those neurons from the analysis (15/36 for nothing to reward, 20/36 for airpuff to reward). We sampled 100 sets of three trials from the period defined as above if the number of peaks is sufficient, or sampled the maximum number of trial combinations if it is below 100.
Estimation of TD errors using simulations
To examine how the value and RPE may change within a trial and across trials, we employed a “complete serial compounds” approach to simulate animal’s learning2. We used eligibility traces to apply a TD(λ) learning method to learn state values (predicted reward value)40.
We considered three learning models, a TD(λ) model where 0< λ <1 and eligibility traces are used, TD(0) model (or a TD(λ) model where λ =0), and a model with Monte Carlo updates (or a TD(λ) model where λ =1). These models tiled a trial with 100 ms of serial different states. Each state from cue onset at time 0 to reward delivery at time 3 s has a weight to learn state value. Weights for all the states were initialized with 0.
In each trial, eligibility traces for all the states were initialized with 0. At each time step, state value was calculated by
where v is a state value, w is a weight, x is a square matrix with a size of time steps, indicating states from cue to reward as 1, and otherwise 0. TD error was calculated by
where d is TD error, r is reward, v is state value. Next, eligibility traces were updated by
where et is eligibility traces for all the states, γ is a discounting factor from 0 to 1, λ is a constant to determine an updating rule and α is a learning rate. Then, weights are updated by
We used γ =0.98, λ =0.75, α=0.06, or λ =0, α=0.2, or λ =1, α =0.06 in Figure 6.
To mimic GCaMP signals recorded by fluorometry, obtained models were convolved with a filter of average GCaMP responses to water in dopamine axons20.
Statistics & Reproducibility
All analyses were performed using custom software written in Matlab (MathWorks). All statistical tests were two-sided. A boxplot indicates 25th and 75th percentiles as the bottom and top edges, respectively. The center line indicates the median. The whiskers extend to the most extreme data that is not considered outlier. In other graphs, an error bar shows standard error. To test significance of the model fitting, p-value for the F-test on the model was calculated. One-sample t-test was performed to test if the mean of a data set is not equal to zero. To compare difference of the mean between two groups, two-sample t-test was performed. p-value less than or equal to 0.05 was regarded as significant for all tests. Data distribution was assumed to be normal, but this was not formally tested.
No formal statistical analysis was carried out to predetermine sample sizes but our samples sizes are similar to those reported in previous publications8,20,21. Order of trial types in conditioning tasks are pseudo-randomized and odor set was randomized between batch of experiments. Data collection and analysis were not performed in a manner blinded to the condition of the experiment. No animals were excluded from the study: all analysis includes data from all animals except for one session in the Extended Data Figure 7f where we could not detect enough number of troughs for analysis. Similarly, the neurons that do not have enough number of peaks for the analysis were excluded from analysis in 2-photon imaging (Figure 5 and Extended Data Figure 10).
Material availability
Original vectors, pAAV-TetO(3G)-WPRE and pAAV-TetO(3G)-GCaMP6f-WPRE is deposit at Addgene (#186205 and #186206). A mouse line Tg(Slc6a3-tTA)2Kftnk was deposit at RIKEN BioResource Center (BRC) and will be deposit in more sources.
Data availability
The fluorometry and 2-photon imaging data have been shared at a public deposit source (doi:10.5061/dryad.hhmgqnkjw). Source data are provided with this paper.
Code availability
The model code is attached as a Supplemetary Data. All other conventional codes used to obtain the result are available from a public deposit source (https://github.com/VTA-SNc/Amo2022).
Extended Data
Extended Data Fig. 1. Recording sites for fiber-fluorometry and example of fiber-fluorometry signals.
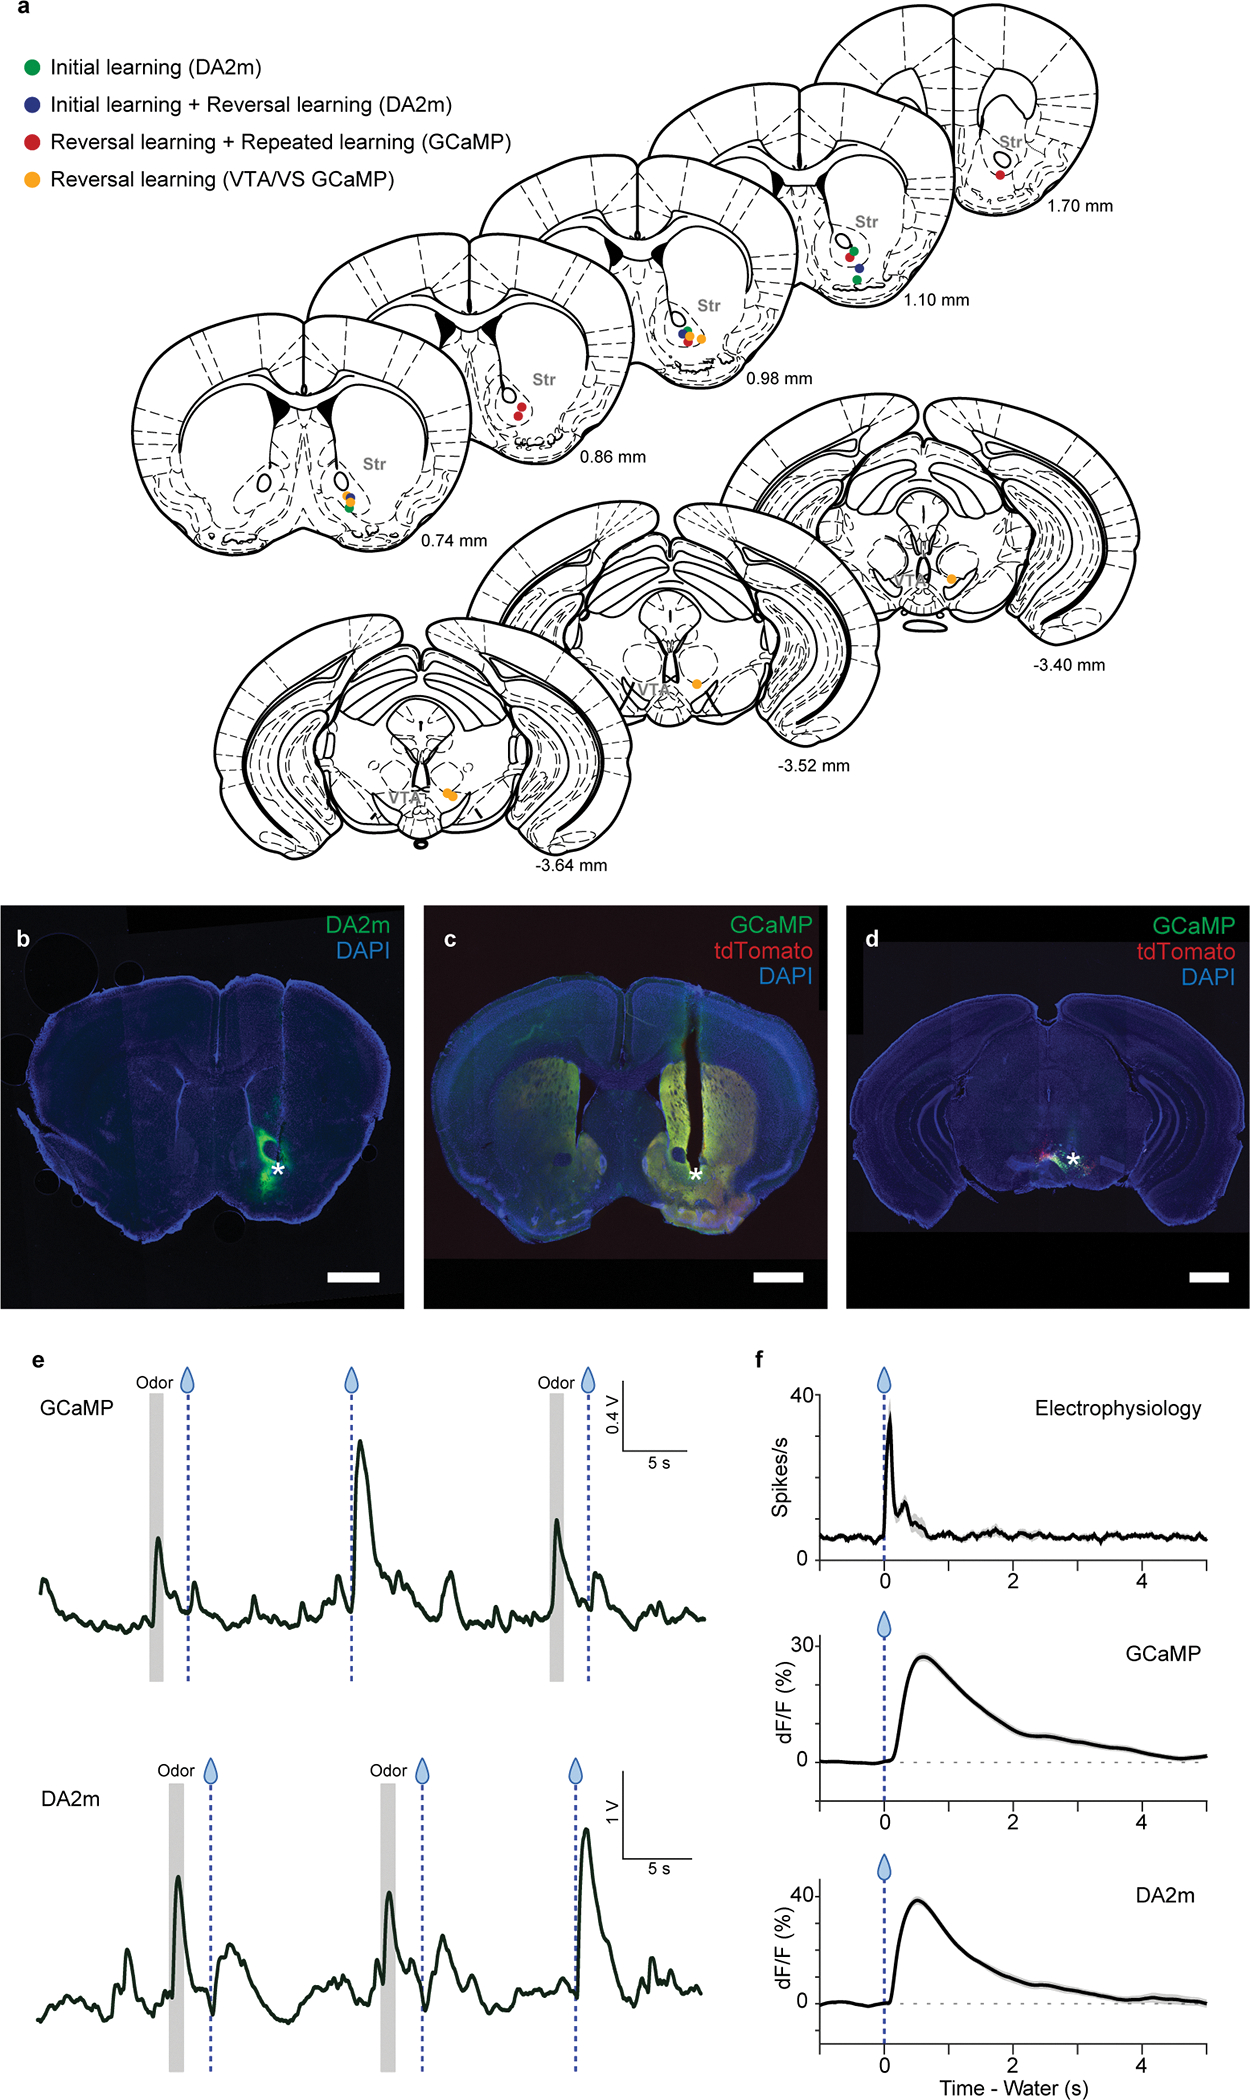
(a) Recording site for each animal is shown in coronal views (Paxinos and Franklin61). (b) Example coronal section of a recording site and DA2m (green) expression in the VS. (c) Example coronal section of a recording site and GCaMP7f (green) and tdTomato (red) expression in the VS. (d) Example coronal section of a recording site and GCaMP7f (green) and tdTomato (red) expression in the VTA. Asterisks indicate fiber tip locations. Other animals (n = 7 for DA2m, n = 9 for GCaMP in VS, and n = 4 for GCaMP in VTA) showed similar result as summarized in (a). Scale bars, 1 mm. (e) Raw GCaMP7f (upper panel) and DA2m (GrabDA; lower panel) signals in VS. (f) Comparison of free reward response between electrophysiology and fiber-fluorometry. Electrophysiology of opto-tagged dopamine neurons (upper; data from Matsumoto et al., 2016), fiber-fluorometry of GCaMP signals in dopamine axons in the VS (middle), fiber-fluorometry of DA2m signals in the VS (bottom).
Extended Data Fig. 2. Dopamine release in the ventral striatum during first-time classical conditioning.
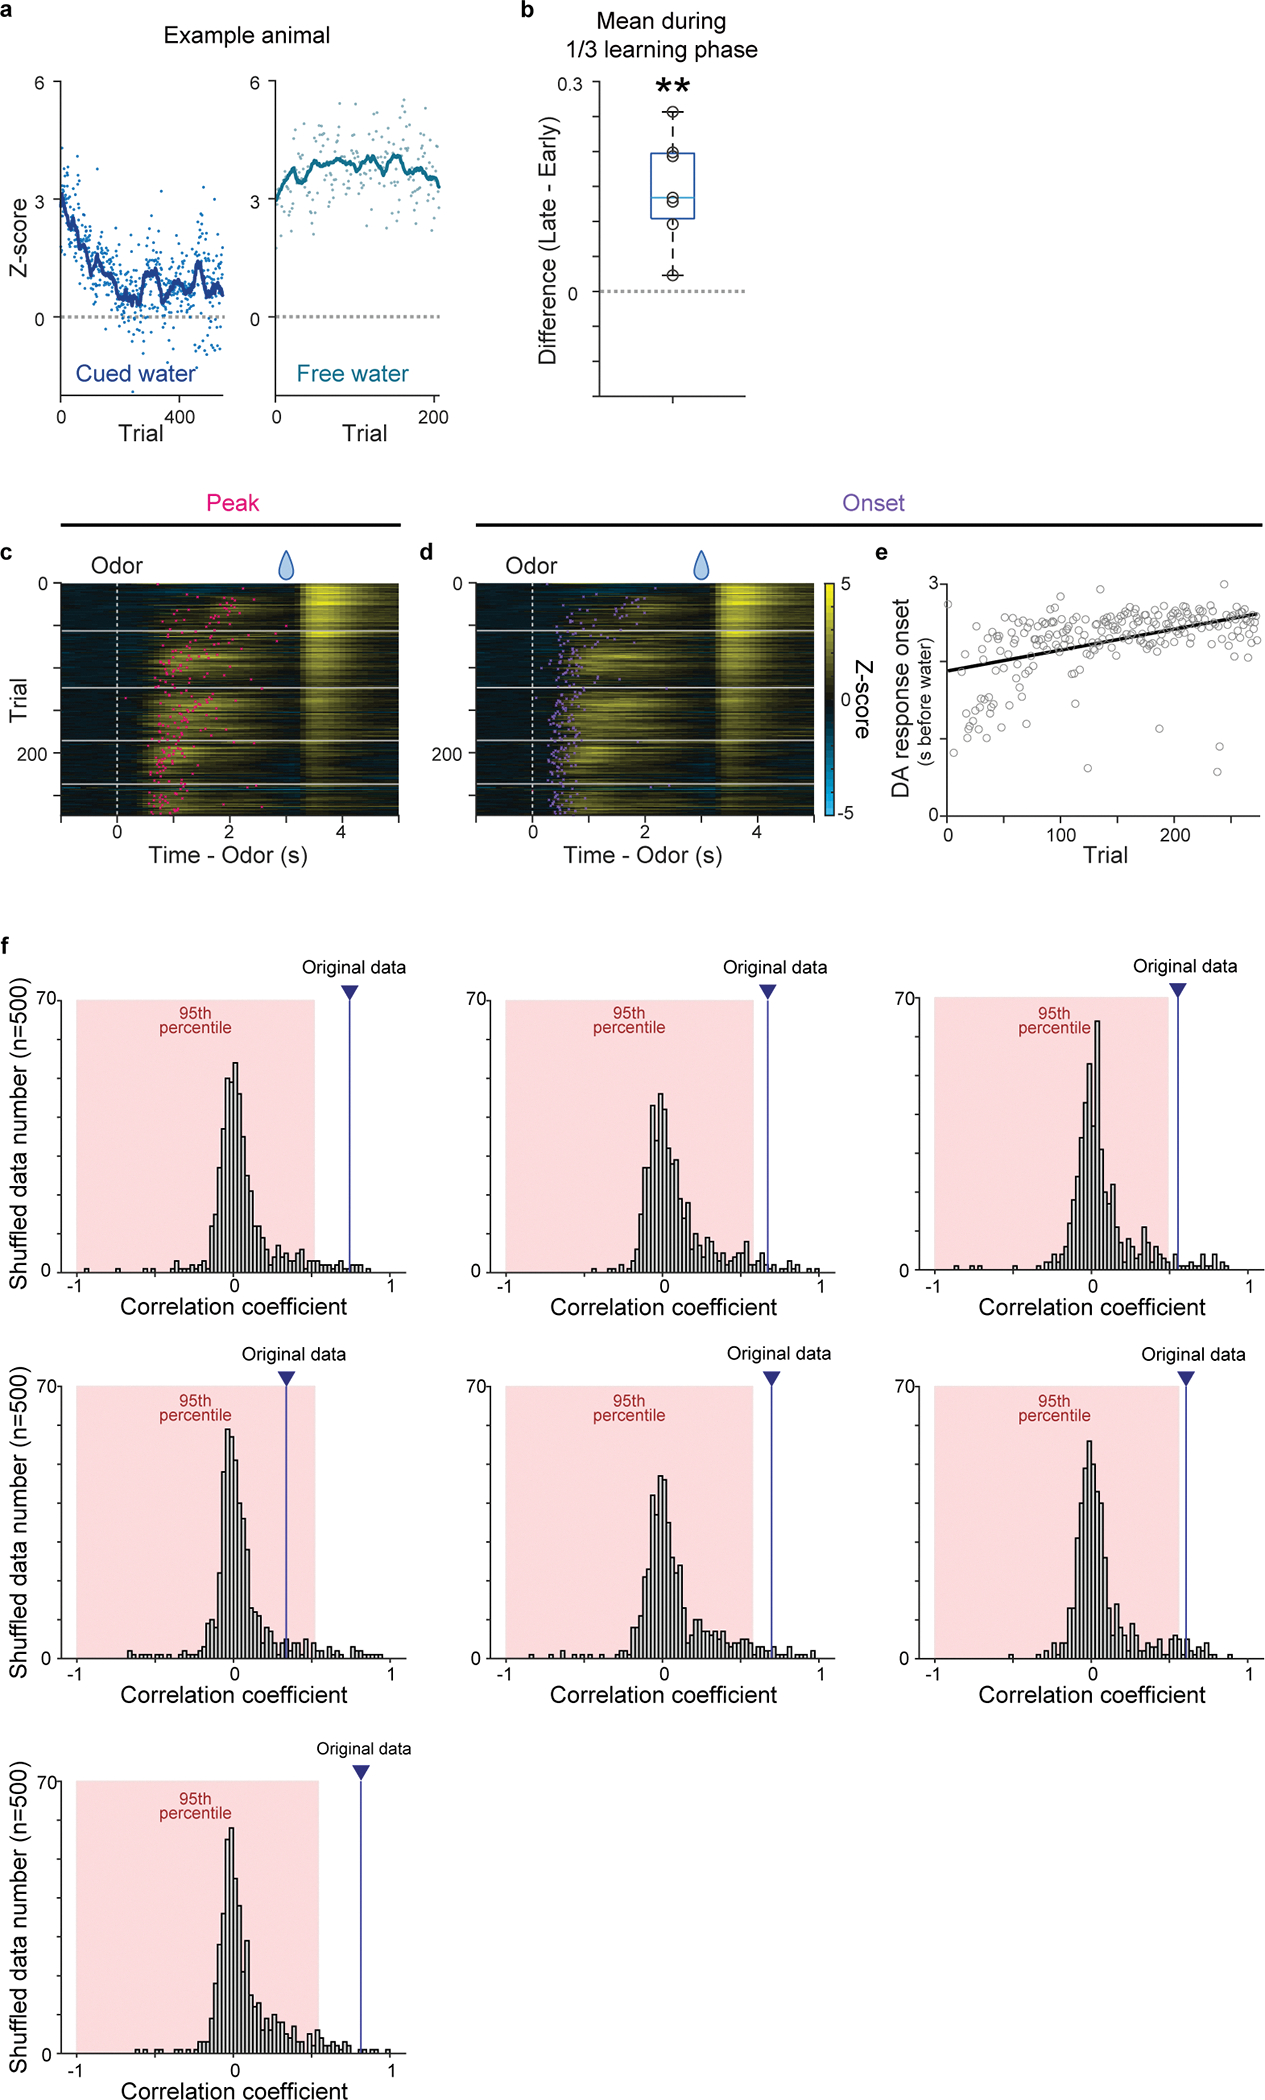
(a) The time-course of dopamine sensor responses to cued water (left) and to free water (right) in an example mouse. Each dot represents responses in each trial, and a line shows moving averages of 20 trials. (b) Dopamine response to reward-associated cue in the late phase (2–3s after cue onset) was significantly higher than activity in the early phase (0–1s after cue onset) during the first 1/3 of learning phase (t =5.0, p = 0.22 × 10⁻²; two-sided t-test). (c) Dopamine sensor signal peaks during delay periods (red) overlaid on a heatmap of dopamine sensor signals in cued water trials. n=7 animals. (d) Dopamine sensor response onset (purple) overlaid on a heatmap of dopamine sensor signals. (e) Linear regression of dopamine excitation onset with trial number. (f) Each panel shows correlation coefficients between activity peak and trial number for trial order shuffled data (n=500) in each animal (7 animals). 95 percentile area is marked with red and the correlation coefficient of original data is shown as blue line. Center of boxplot showing median, edges are 25th and 75th percentile, and whiskers are most extreme data points. **p<0.01.
Extended Data Fig. 3. Test for monotonic shift of dopamine activity and activity center of mass during first-time learning.
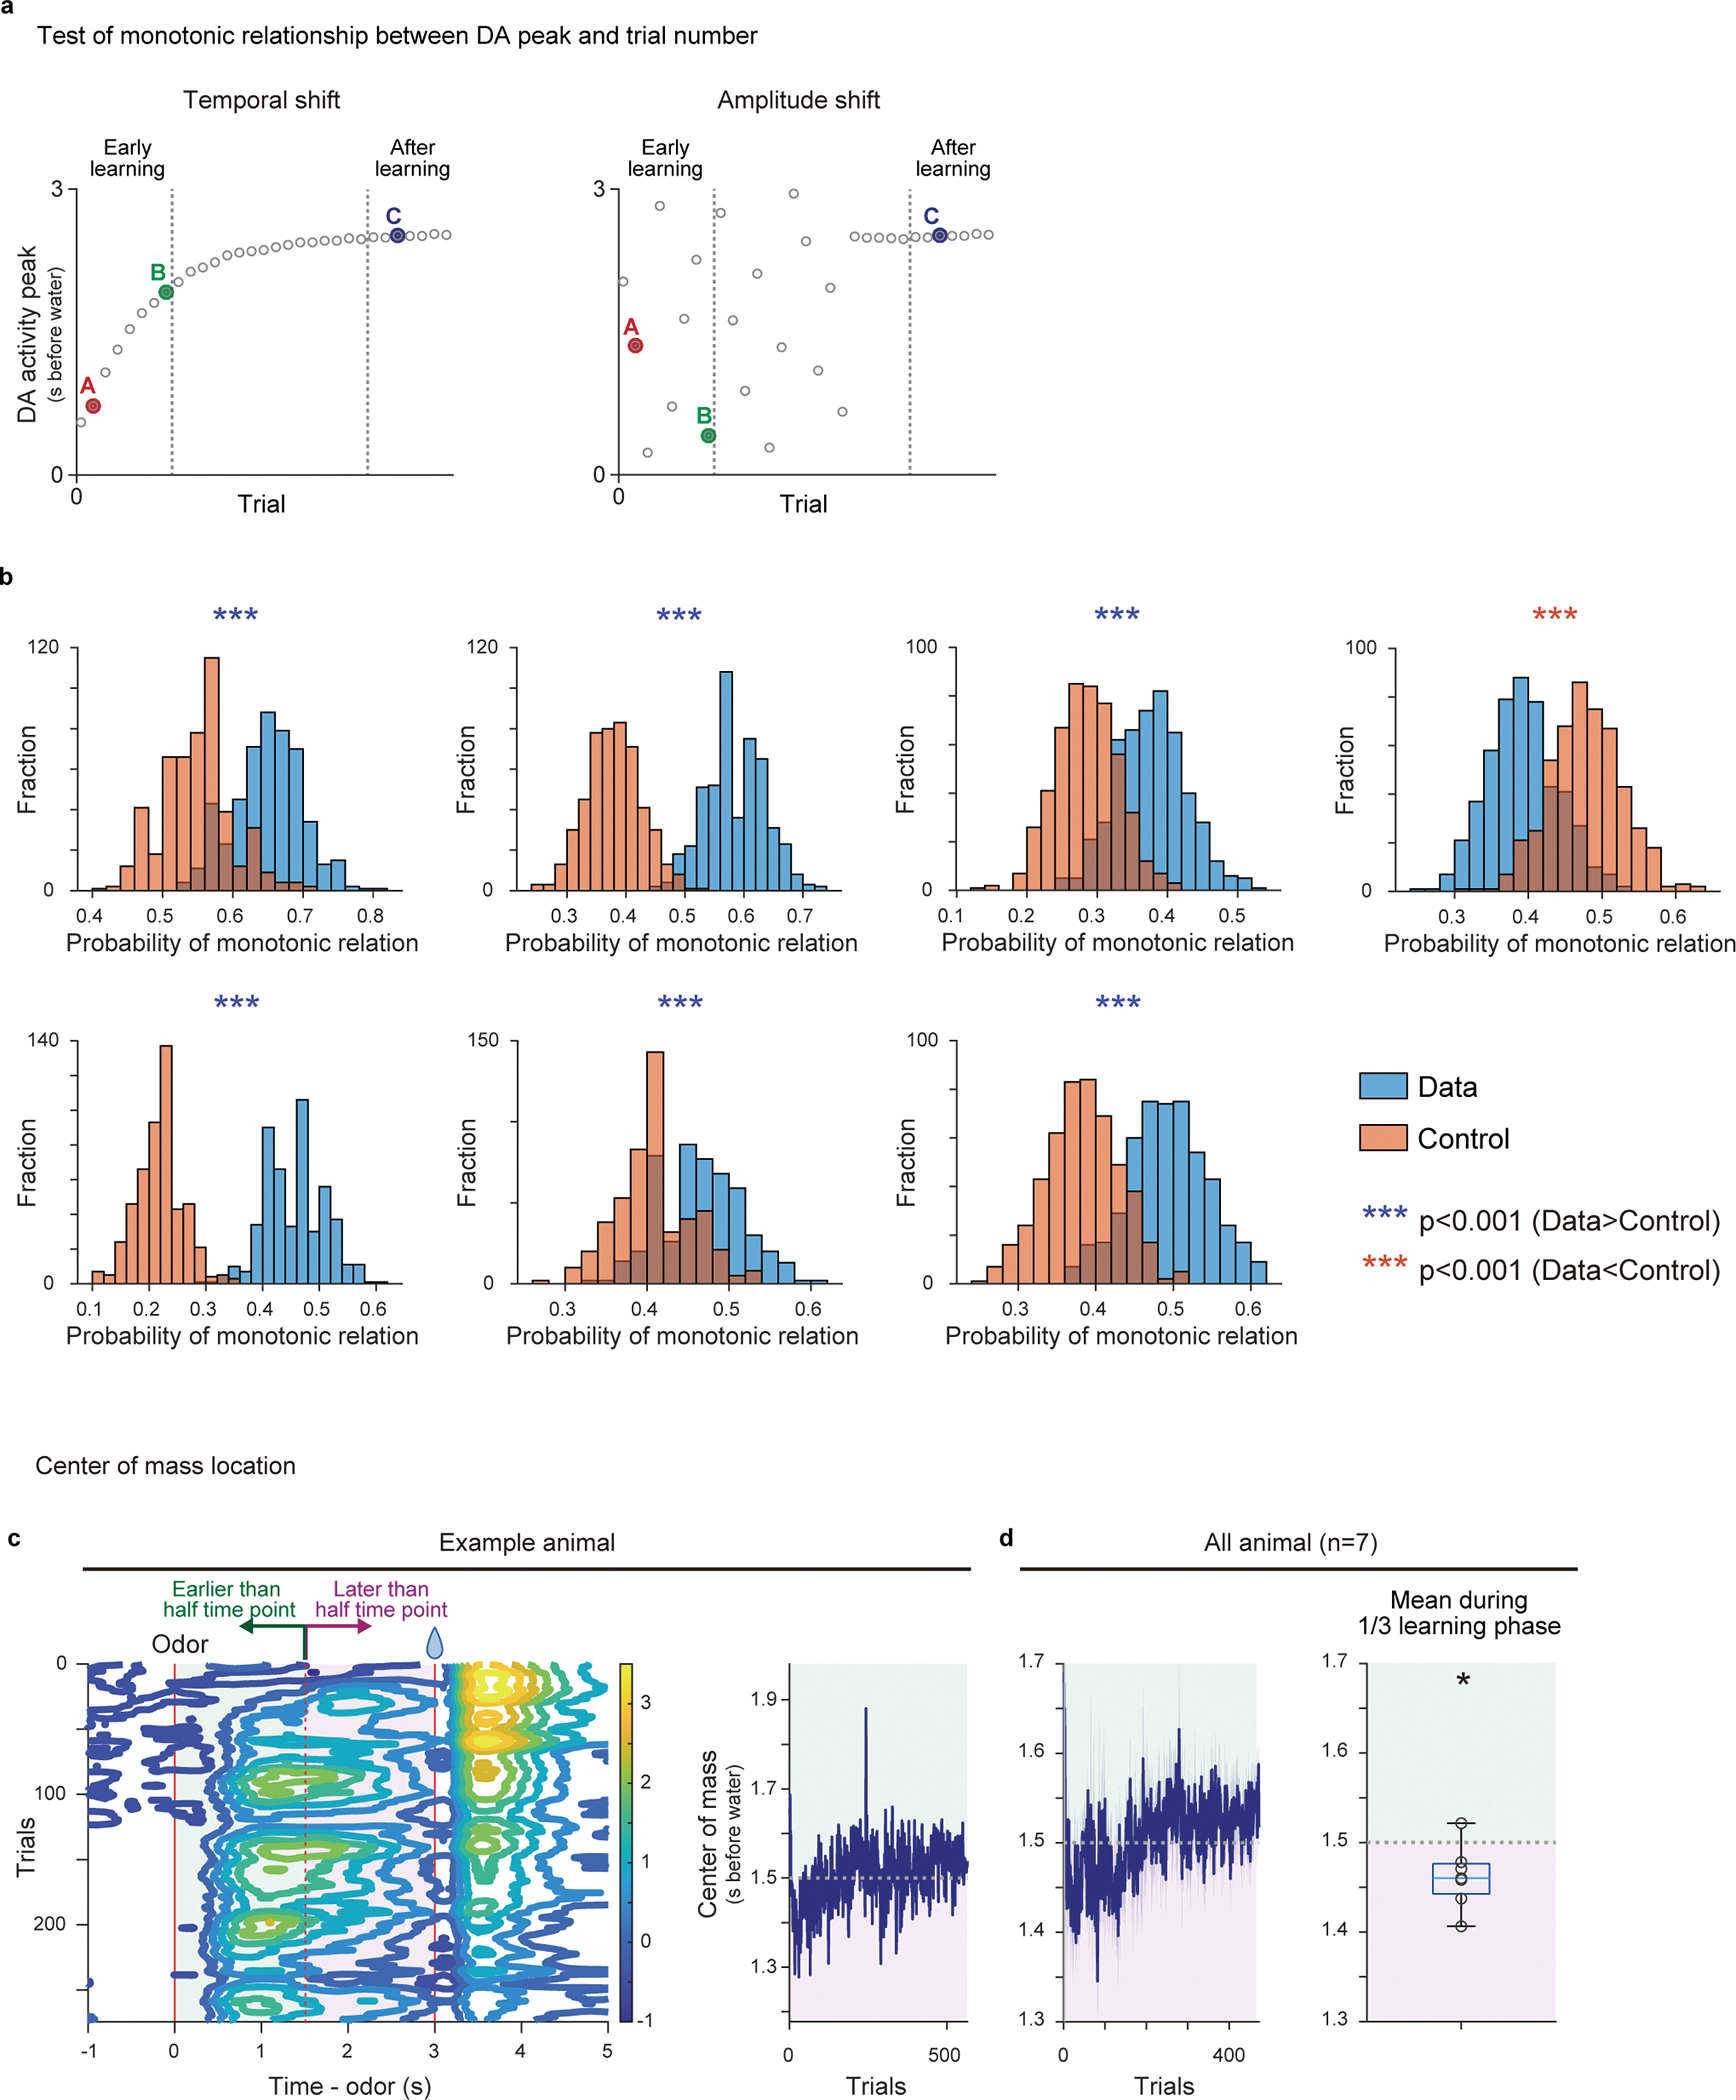
(a) Schematic drawing of dopamine activity peaks of randomly sampled 3 trials (see Methods). In temporal shift (left), the probability of monotonic relationship is higher than chance level, while that is not the case in amplitude shift (right). (b) Probability of having monotonic shift in randomly sampled 3 activity peaks. 100 sets of sampling were repeated for 500 times for each animal (see Methods). Each panel shows the result from a single animal (7 animals). Blue, actual data; red, control. The data showed significantly higher probability (p<0.05; two-sided t-test, no adjustment for multiple comparison) of monotonic shift in 6 out of 7 animals, which is significantly higher than chance level (p = 0.78 × 10⁻²; binomial cumulative function). (c) Contour plot of activity pattern (left) and the time-course of the center of mass (0–3s after cue onset) over training (right) in an example animal. (d) Left, Time-course of the center of mass over training. Right, average centers of mass during the first 1/3 of learning period in all animals were significantly later than half time point (1.5s) (t = −2.8, p = 0.029; two-sided t-test). n=7 animals. Center of boxplot showing median, edges are 25th and 75th percentile, and whiskers are most extreme data points. *p<0.05, ***p<0.001
Extended Data Fig. 4. Temporal shift of activity during reversal learning.
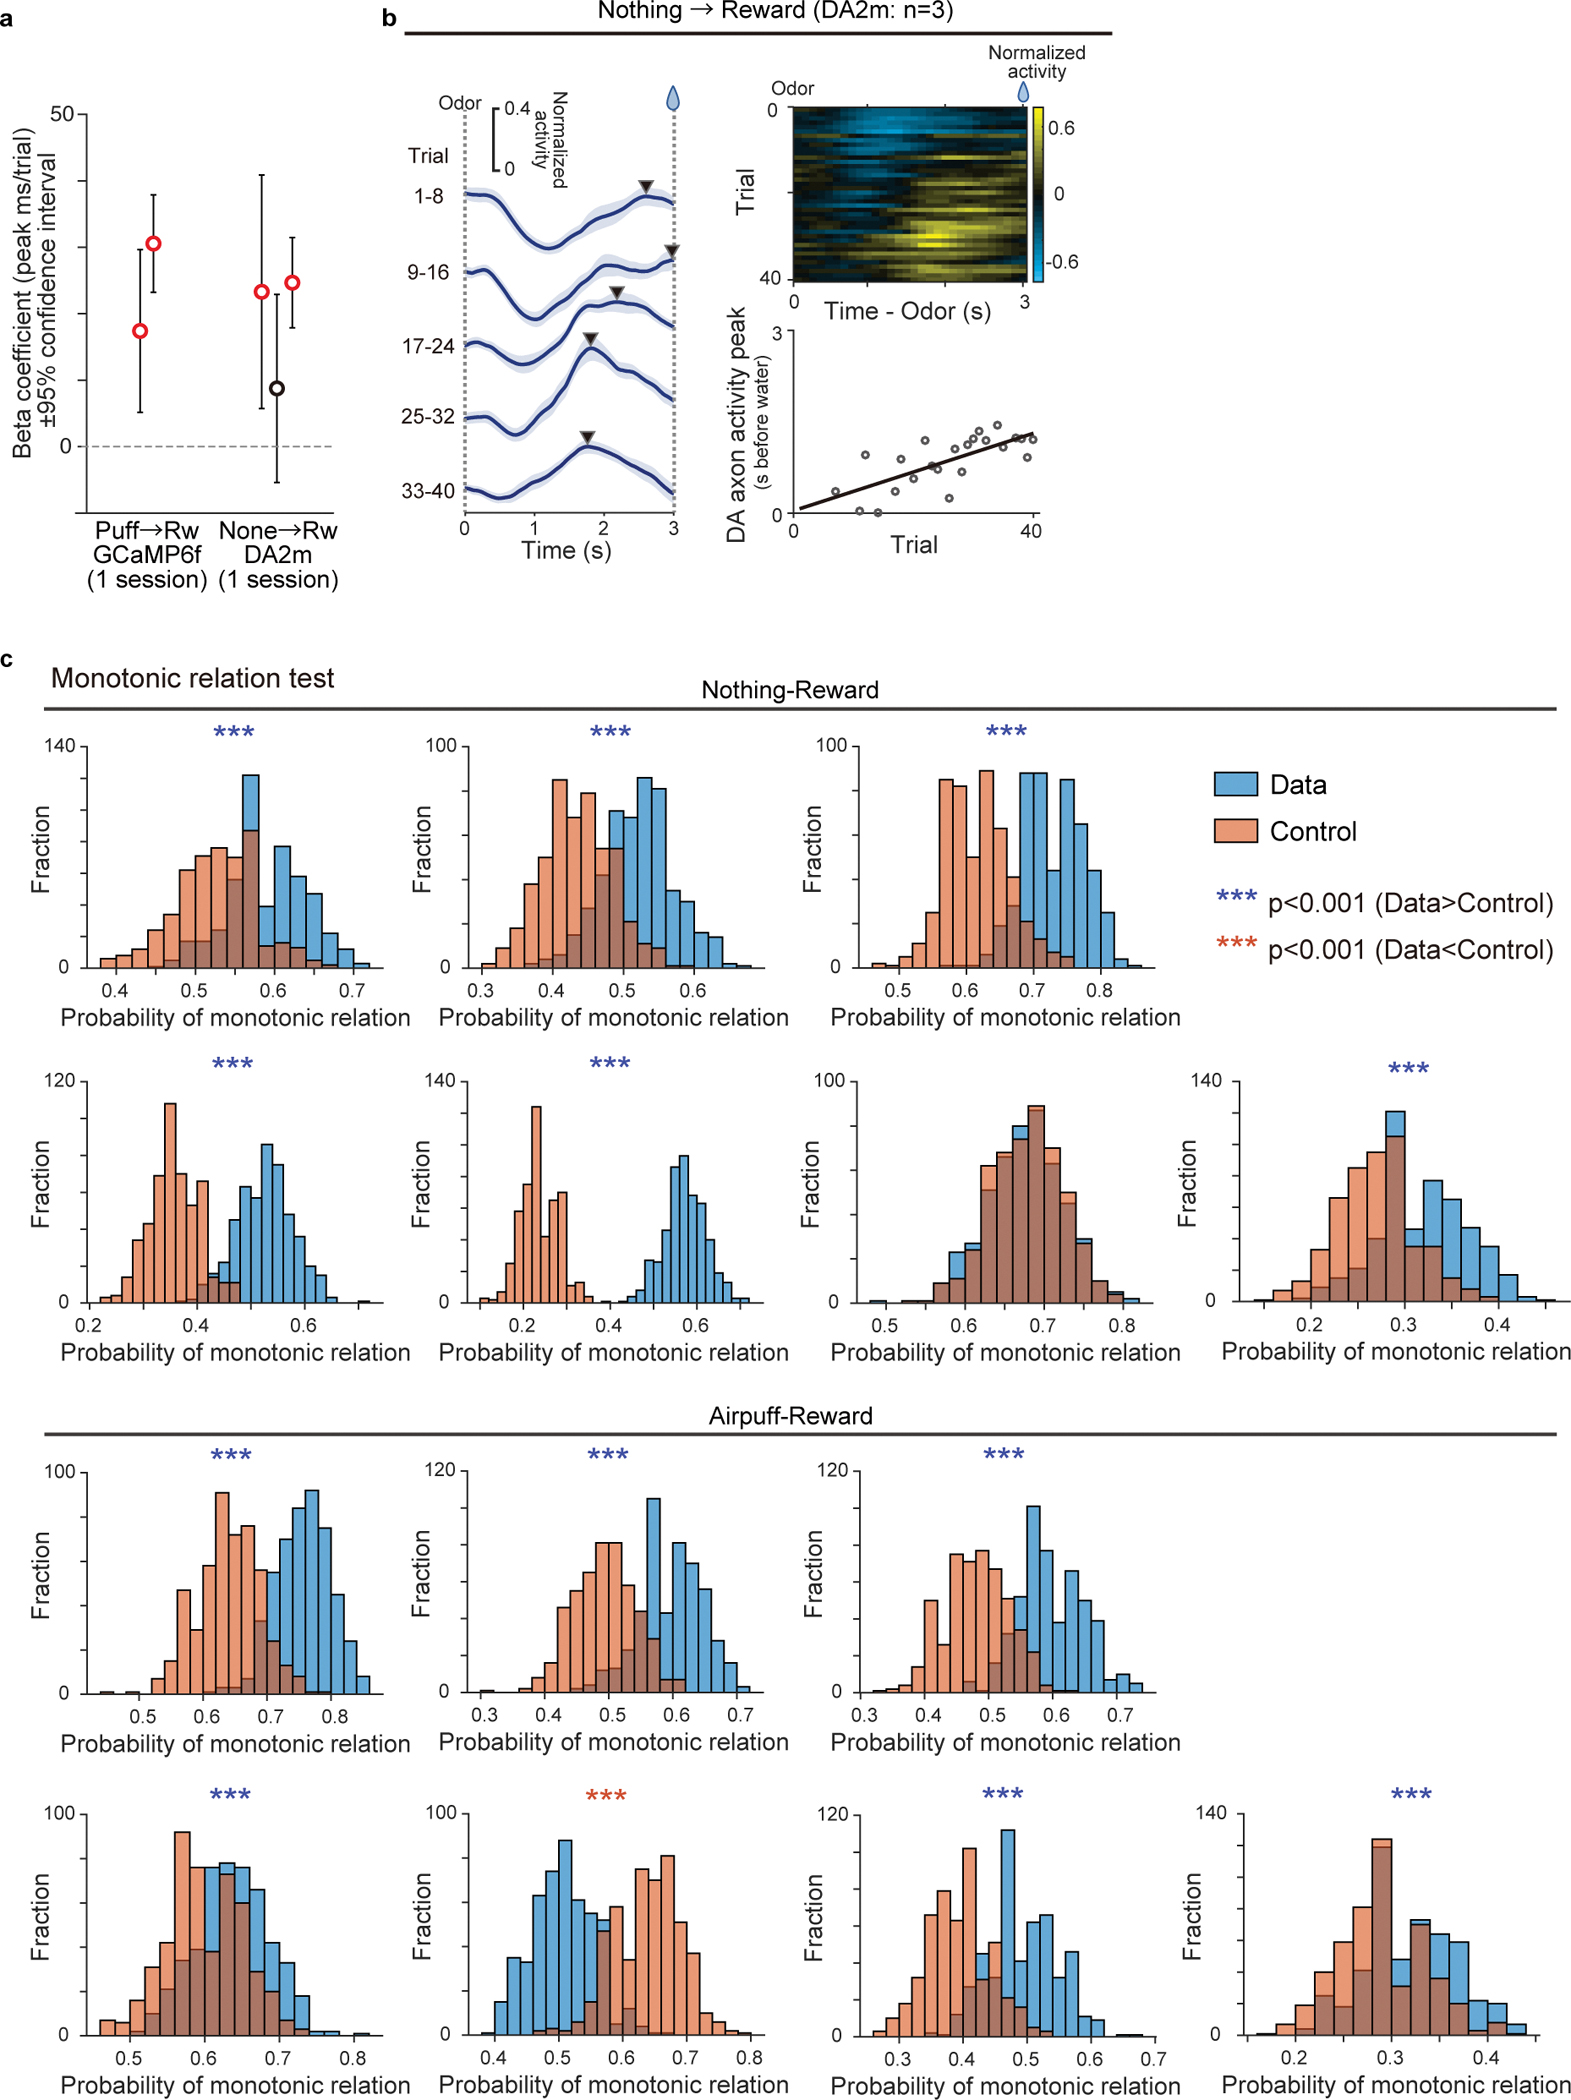
(a) The regression coefficients ±95% confidence intervals between activity peak timing and trial number in each animal under different experimental conditions (n=2 animals for GCaMP6f, n=3 animals for DA2m; mean ± 95% confidence intervals). Red circles, significant (p-value ≤ 0.05; two-sided F-test, no adjustment for multiple comparison) slopes. (b) Average dopamine activity (normalized to free water response) in response to a reward-predicting cue in the first session of reversal from nothing to reward (left and right top; n = 3 animals with DA sensor). Each line shows 8 trials mean of population neural activity across the session (mean ± sem). Right bottom, linear regression of peak timing of average activity with trial number during reversal from nothing to reward with dopamine sensor (right; n = 3 animals; regression coefficient 31.8 ms/trial, F = 22, p = 1.3 × 10⁻⁴). (c) Probability of having monotonic shift in randomly sampled 3 activity peaks in actual data (blue) and control (red) (7 animals, see Methods). The data showed significantly higher probability (p<0.05; two-sided t-test, no adjustment for multiple comparison) of monotonic shift in 6 out of 7 animals in nothing to reward reversal (p = 0.78 × 10⁻²; binomial cumulative function) and 6 out of 7 animals in airpuff to reward reversal (p = 0.78 × 10⁻²; binomial cumulative function). ***p<0.001.
Extended Data Fig. 5. Center of mass and time-course of cue responses during reversal learning.
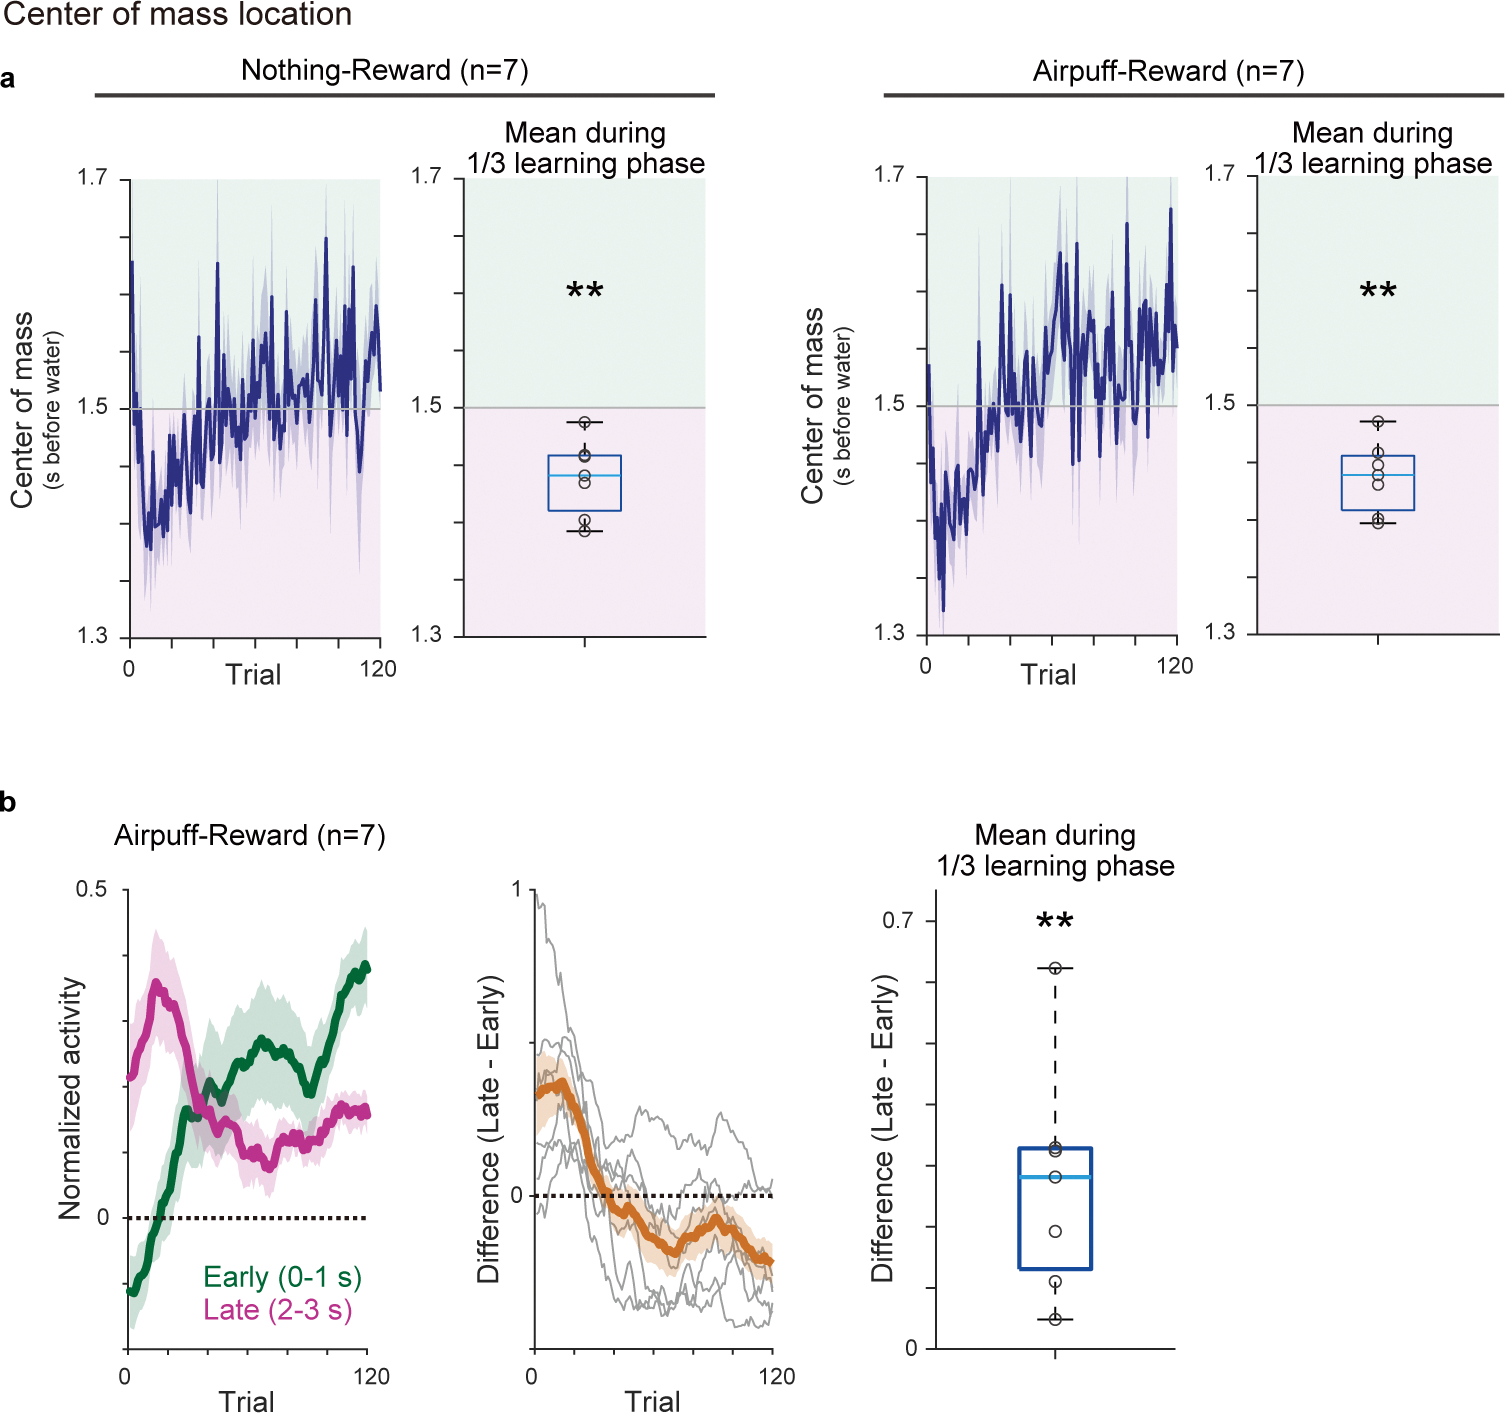
(a) Time-course of center of mass of activity (0–3s after cue onset) over training, and average center of mass during the first 1/3 of learning period in all animals. The average centers of mass were significantly later than half time point (1.5s) (left, nothing to reward, t = −4.8, p = 0.28 × 10⁻²; right, airpuff to reward, t = −5.2, p = 0.18 × 10⁻²; two-sided t-test). (b) Responses to a reward-predicting odor in all animals (mean ± sem). early: 0–1 s from odor onset (green); late: 2–3 s from odor onset (magenta). Middle, difference between early and late odor responses (grey: each animal; orange: mean ± sem). Dopamine activity in the late phase was significantly higher than activity in the early phase during the first 1/3 of learning phase (t =3.8, p = 0.85 × 10⁻²; two-sided t-test). Center of boxplot showing median, edges are 25th and 75th percentile, and whiskers are most extreme data points. **p<0.01.
Extended Data Fig. 6. Simultaneous fiber fluorometry recording of dopamine neuron activity in the VTA and VS.
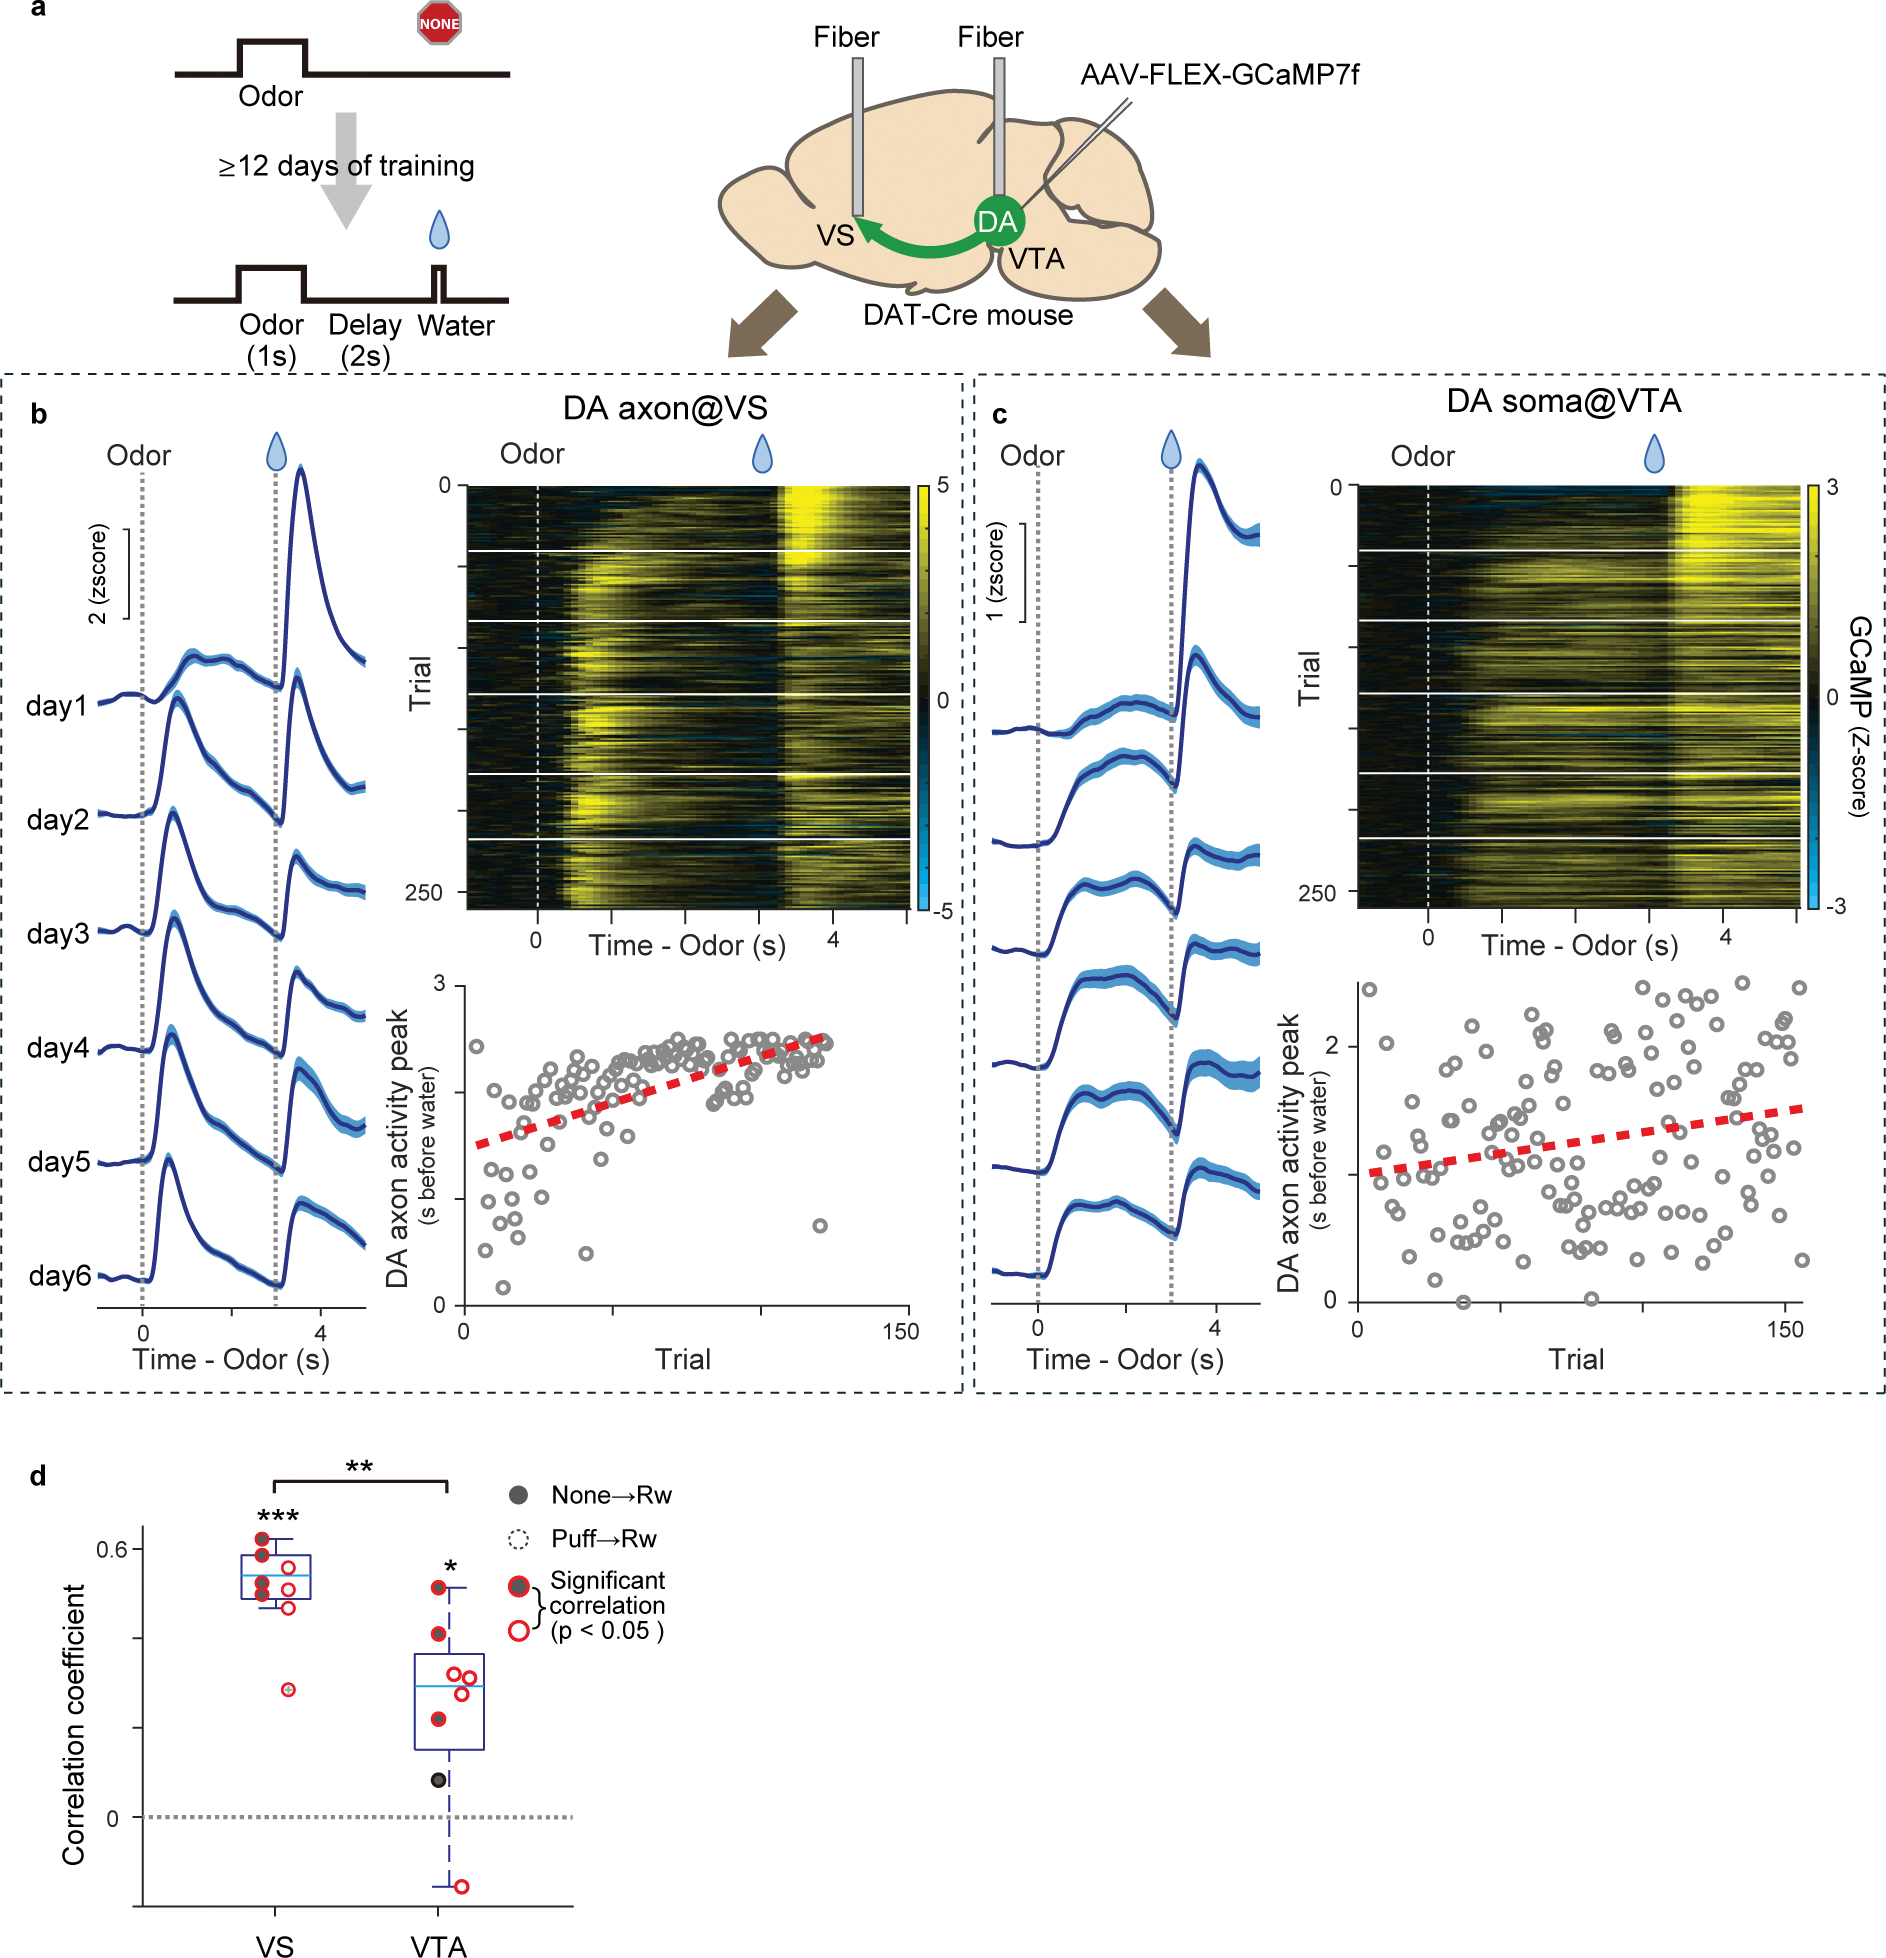
(a) GCaMP7f was expressed in VTA dopamine neurons and fibers were targeted at both VTA and VS. (b) GCaMP signal of dopamine axons in the VS of an example animal (left; mean ± sem, and right top), and activity peak for each trial (right bottom; gray circle). Activity peaks were fitted with linear regression with trial number and the fitted line was shown with red line. (c) GCaMP activity of dopamine neurons in the VTA in an example animal simultaneously recorded with (b) (left; mean ± sem, and right top). Activity peaks (right bottom; gray circle) were fitted with linear regression with trial number and the fitted line was shown with red line. (d) Comparison of Pearson’s correlation coefficients of activity peaks and trial number between VS recording (p = 8.6 × 10⁻⁶, two-sided t-test) and VTA recording (p = 1.2 × 10⁻², two-sided t-test) (p = 5.2 × 10⁻³, two-sided t-test after Fisher’s Z-transformation). Filled circles, reversal from nothing to reward. Open circle, reversal from airpuff to reward. Red circles, significant (p-value ≤ 0.05, F-test, no adjustment for multiple comparison). n=8 sessions (airpuff-reward sessions and nothing-reward sessions from 4 animals). Center of boxplot showing median, edges are 25th and 75th percentile, and whiskers are most extreme data points. *p<0.05, **p<0.01, ***p<0.001.
Extended Data Fig. 7. Temporal shift of dopamine inhibitory activity in reversal learning.
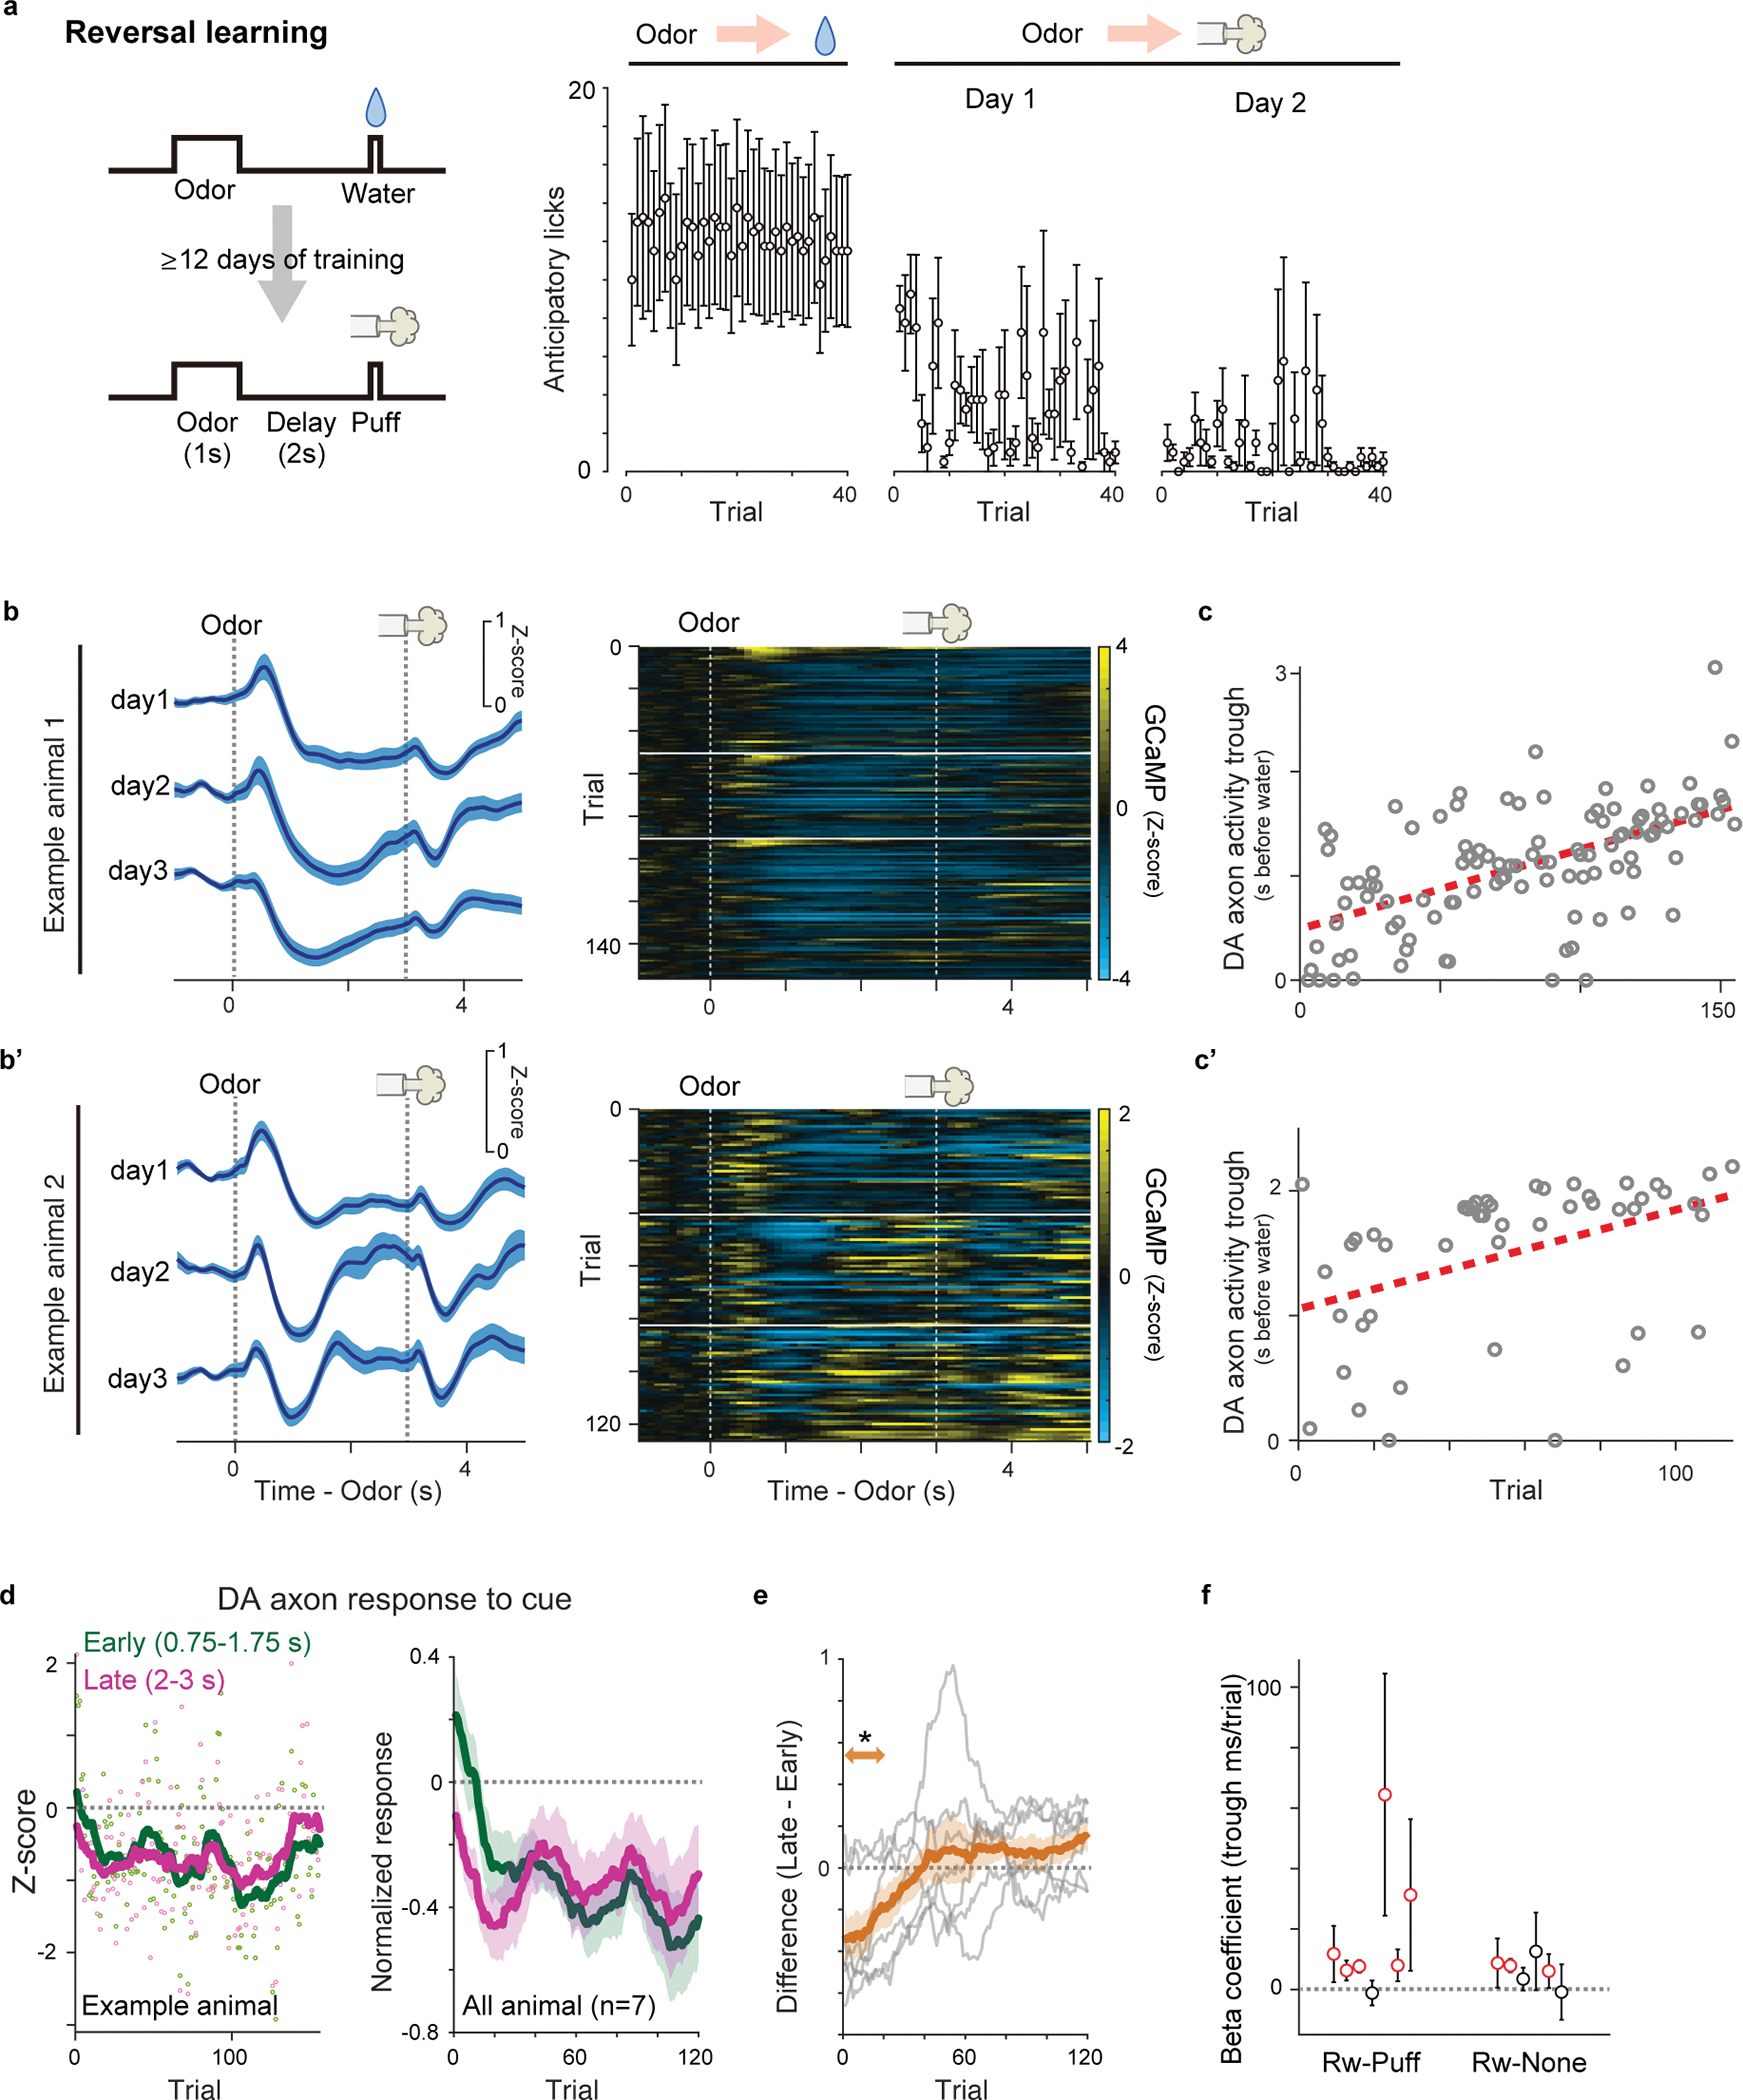
(a) Lick counts during the delay period (0–3 s after odor onset) in reversal training from reward to airpuff (n = 7 animals). Mean ± sem for each trial. (b and b’) GCaMP signals from example animals during reversal. Left, session mean ± sem. The white horizontal lines (top) show session boundaries. (c and c’) Dopamine activity trough (gray circle) and linear regression with trial number ((c) regression coefficient 7.6 ms/trial, p = 5.9 × 10⁻¹³: (c’) regression coefficient 7.9 ms/trial, p = 3.8 × 10⁻³). (d) Responses to the airpuff-predicting odor in an example animal (left) and in all animals (right, mean ± sem). Early: 0.75–1.75 s from odor onset (green). First 0.75 s was excluded to minimize contamination of remaining positive cue response. Late: 2–3 s from odor onset (magenta). (e) Difference between early and late odor responses (grey: each animal; orange: mean ± sem). Dopamine activity in the late phase was significantly higher than activity in the early phase during the first 2–20 trials (t = −3.0, p = 2.3 × 10⁻³; two-sided t-test). (f) Regression coefficient ±95% confidence intervals between activity peak and trial number in each animal in different experimental conditions (mean ± 95% confidence intervals). Red circles, significant (p ≤ 0.05; F-test, no adjustment for multiple comparison) slopes. n = 7 animals for each condition. Data of one animal in reversal from reward to nothing was removed because of insufficient number of trials with detected troughs. *p<0.05.
Extended Data Fig. 8. Comparison of dopamine axon GCaMP signal, control fluorescence signal, and licking.
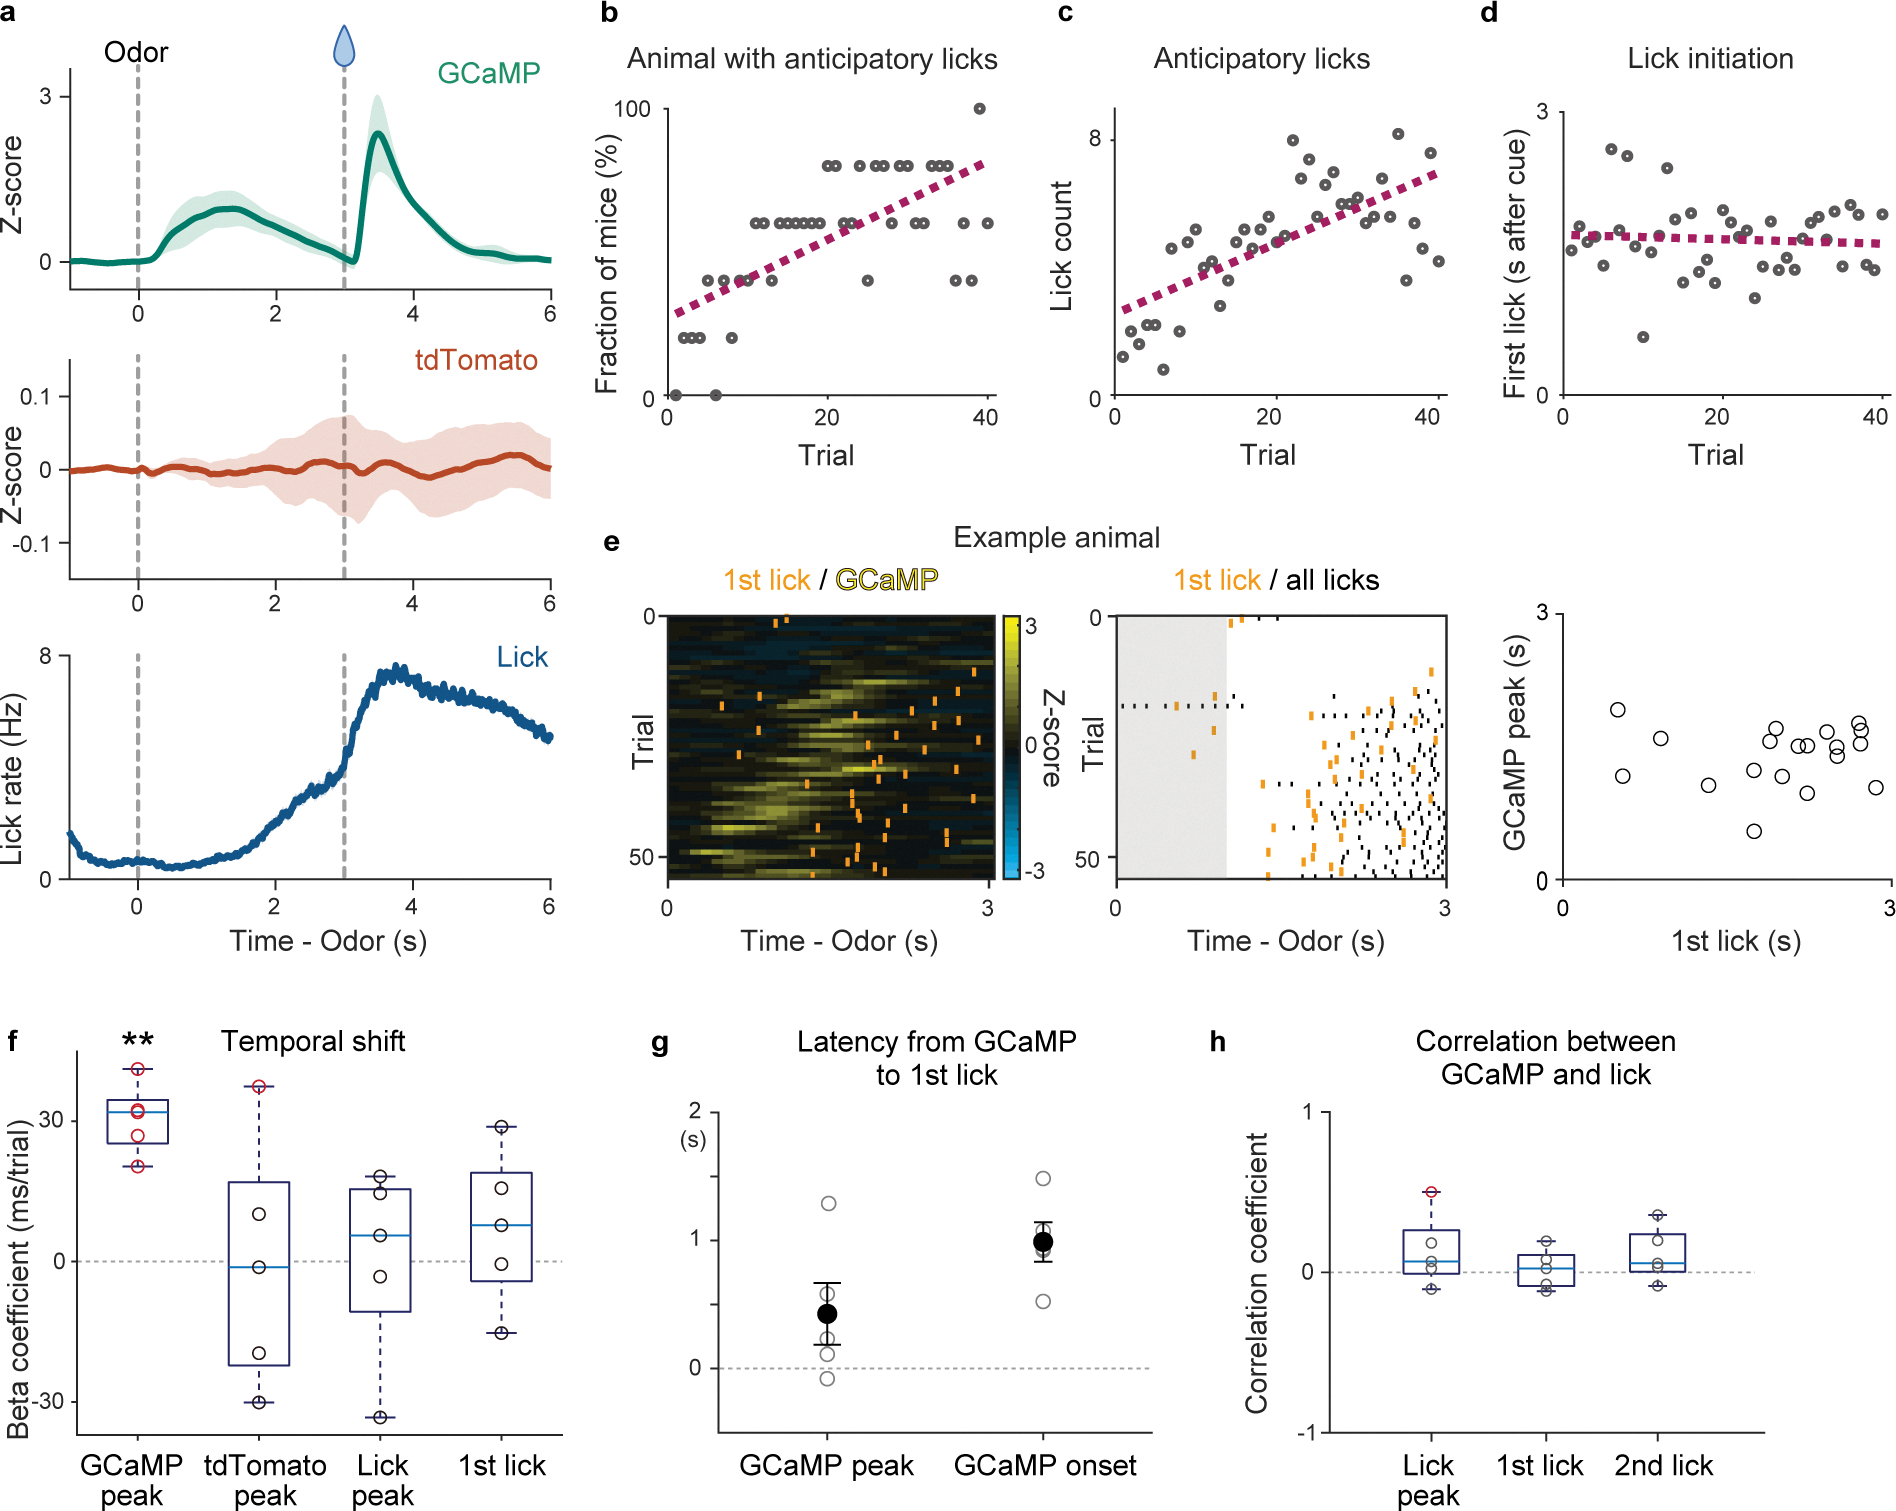
(a) GCaMP signals (top; green), tdTomato signals (middle; red), and lick counts (bottom; blue) recorded simultaneously in the first reversal session from airpuff to reward (mean ± sem). (b) Percentage of animals that show anticipatory licking during delay periods vs trial number. Regression coefficient 1.3 %/trial, F = 33, p = 1.2 × 10⁻⁶, F-test. (c) Average lick counts during delay periods vs trial number. Regression coefficient 0.11 lick/trial, F = 35, p = 7.8 × 10⁻⁷, F-test. (d) First lick timings vs trial number. Regression coefficient −2.3 ms/trial, F = 0.19, p = 0.66, F-test. (e) Relation between the first lick and GCaMP signals during the delay period in an example animal. Right, comparison between timing of GCaMP peak and timing of the first lick. (f) Linear regression coefficients for timing of GCaMP peak, tdTomato peak, lick peak and first lick with trial number (t = 8.9, p = 8.8 × 10⁻⁴ for GCaMP peak; t = −0.058, p = 0.96 for tdTomato peak; t = 0.038, p = 0.97 for lick peak; and t = 0.98, p = 0.38 for first lick, two-sided t-test). Red circles, significant (p-value ≤ 0.05, F-test, no adjustment for multiple comparison). (g) Latency of GCaMP response and first lick (GCaMP peak to first lick, 427 ± 241 ms; and GCaMP response onset to first lick, 989 ± 154 ms, mean ± sem). (h) Correlation coefficients between timing of GCaMP response peak and lick peak (t = 1.3, p = 0.27, two-sided t-test) and lick onset (first lick, t = 0.53, p = 0.62, two-sided t-test, and second lick, t = 1.6, p = 0.19, two-sided t-test). Red circles, significant (p-value ≤ 0.05, F-test, no adjustment for multiple comparison). n=5 animals. Center of boxplot showing median, edges are 25th and 75th percentile, and whiskers are most extreme data points. **p<0.01.
Extended Data Fig. 9. Dopamine cue responses during repeated learning in well-trained animals.
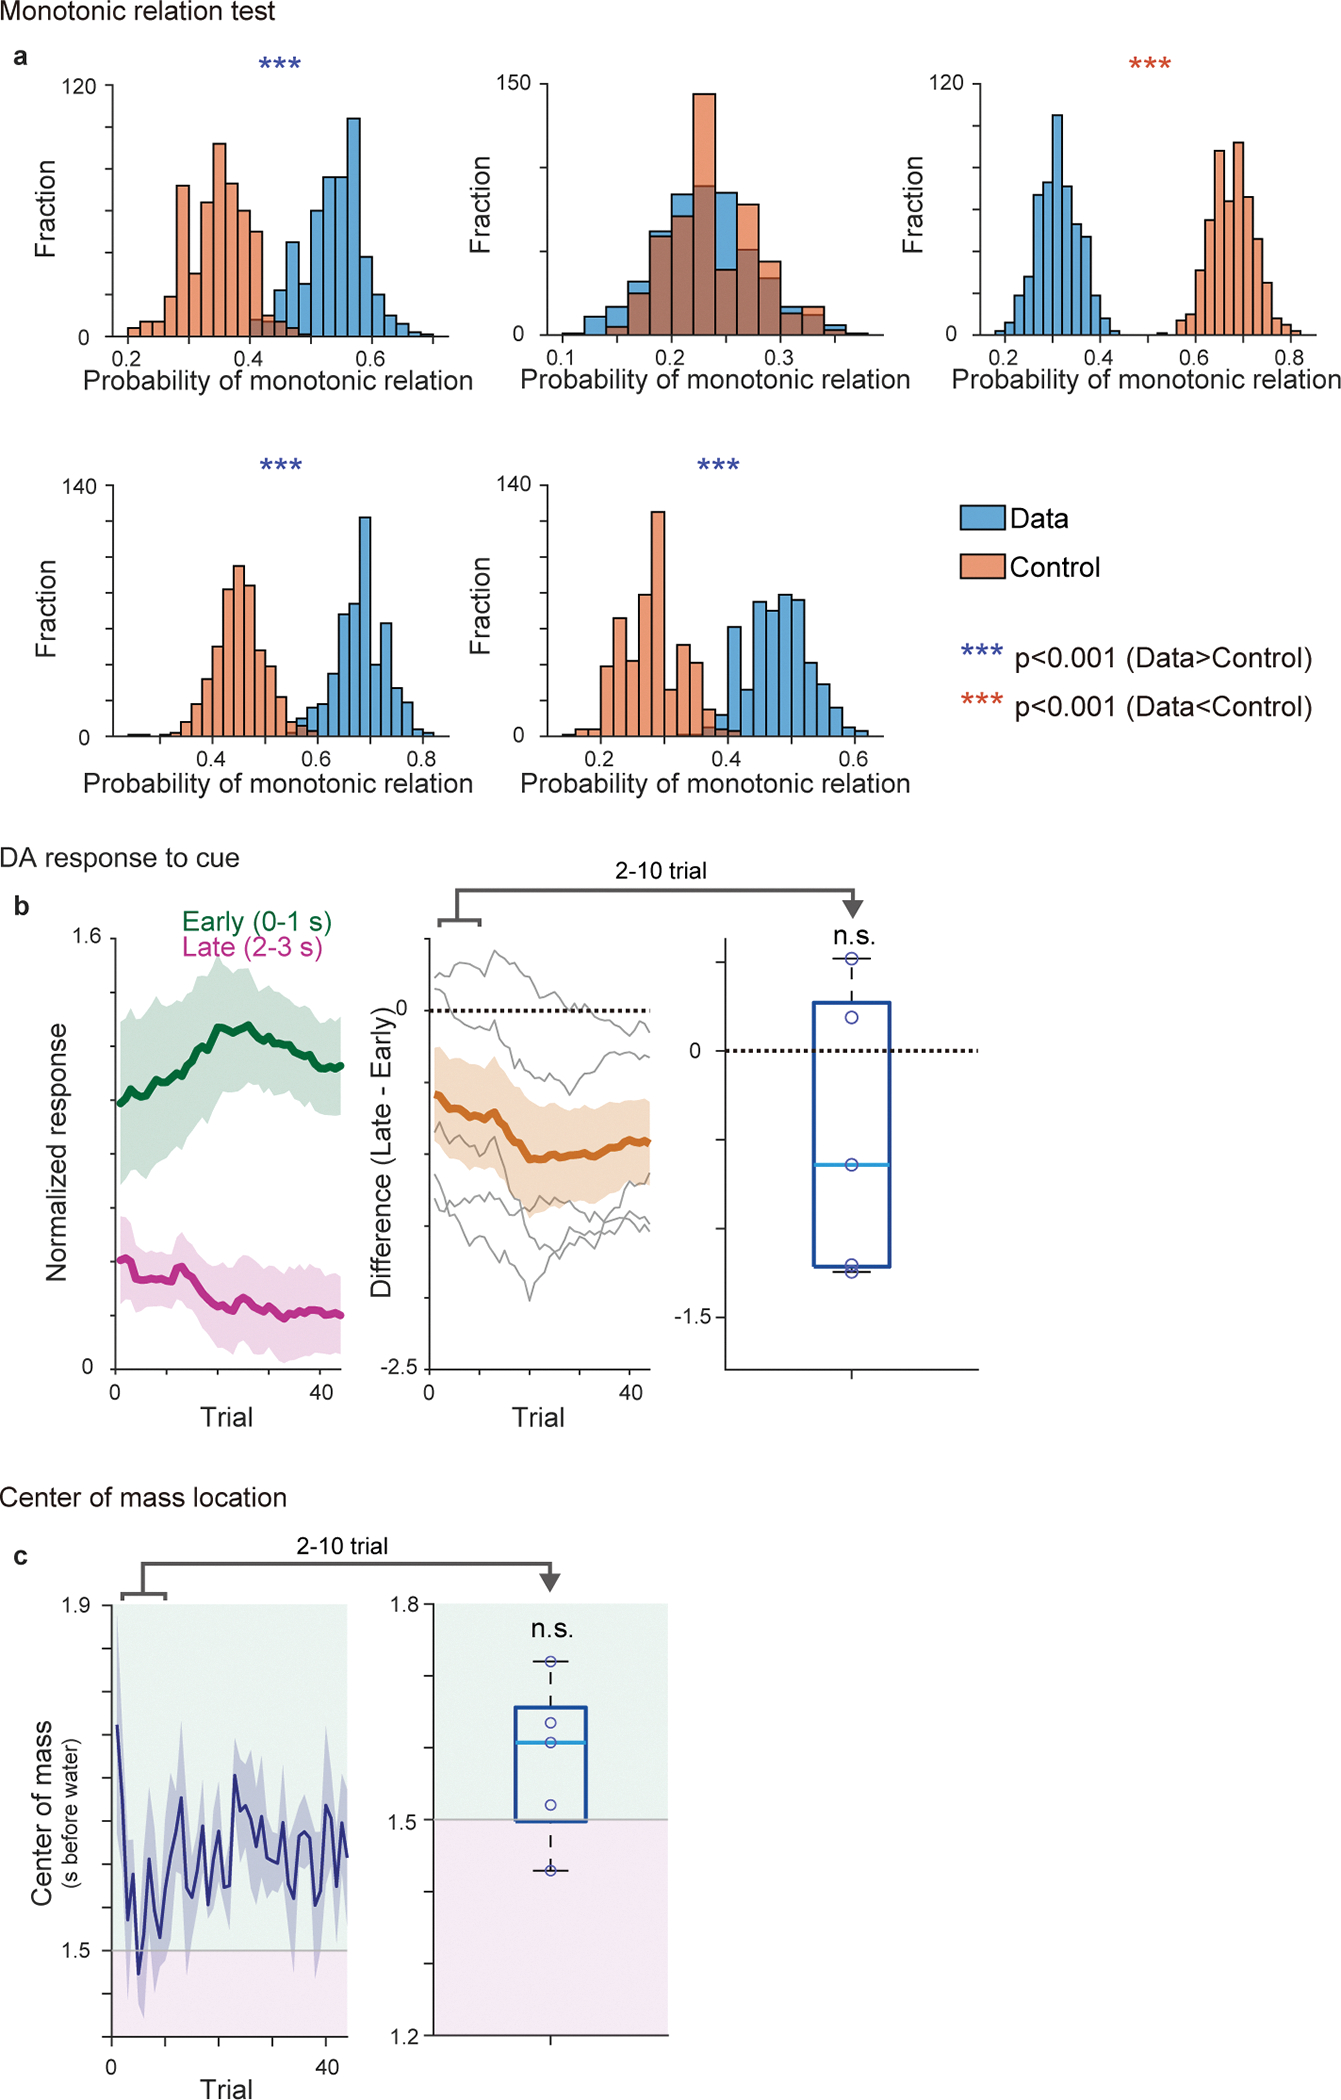
(a) Probability of having monotonic shift in randomly sampled 3 activity peaks in the actual data (blue) and control (red) (5 animals). The data showed significantly higher probability (p<0.05; two-sided t-test, no adjustment for multiple comparison) of monotonic shift in 3 out of 5 animals (p = 0.18; binomial cumulative function). (b) Responses to a reward-predicting odor in all animals (center, mean ± sem). early: 0–1 s from odor onset (green); late: 2–3 s from odor onset (magenta). Middle, difference between early and late odor responses (grey: each animal; orange: mean ± sem). Right, dopamine activity in the late phase was not significantly higher than activity in the early phase during the first 2–10 trials (t = −1.3, p = 0.25; two-sided t-test). n=5 animals. (c) Left, time-course of center of mass during delay periods (0–3s after cue onset) over training. Right, average centers of mass during 2–10 trial in all animals were not significantly later than half time point (1.5s) (left, nothing to reward, t = 1.6, p = 0.17; two-sided t-test). n=5 animals. Center of boxplot showing median, edges are 25th and 75th percentile, and whiskers are most extreme data points. ***p<0.001.
Extended Data Fig. 10. Recording sites and dopamine cue responses in deep 2-photon imaging.
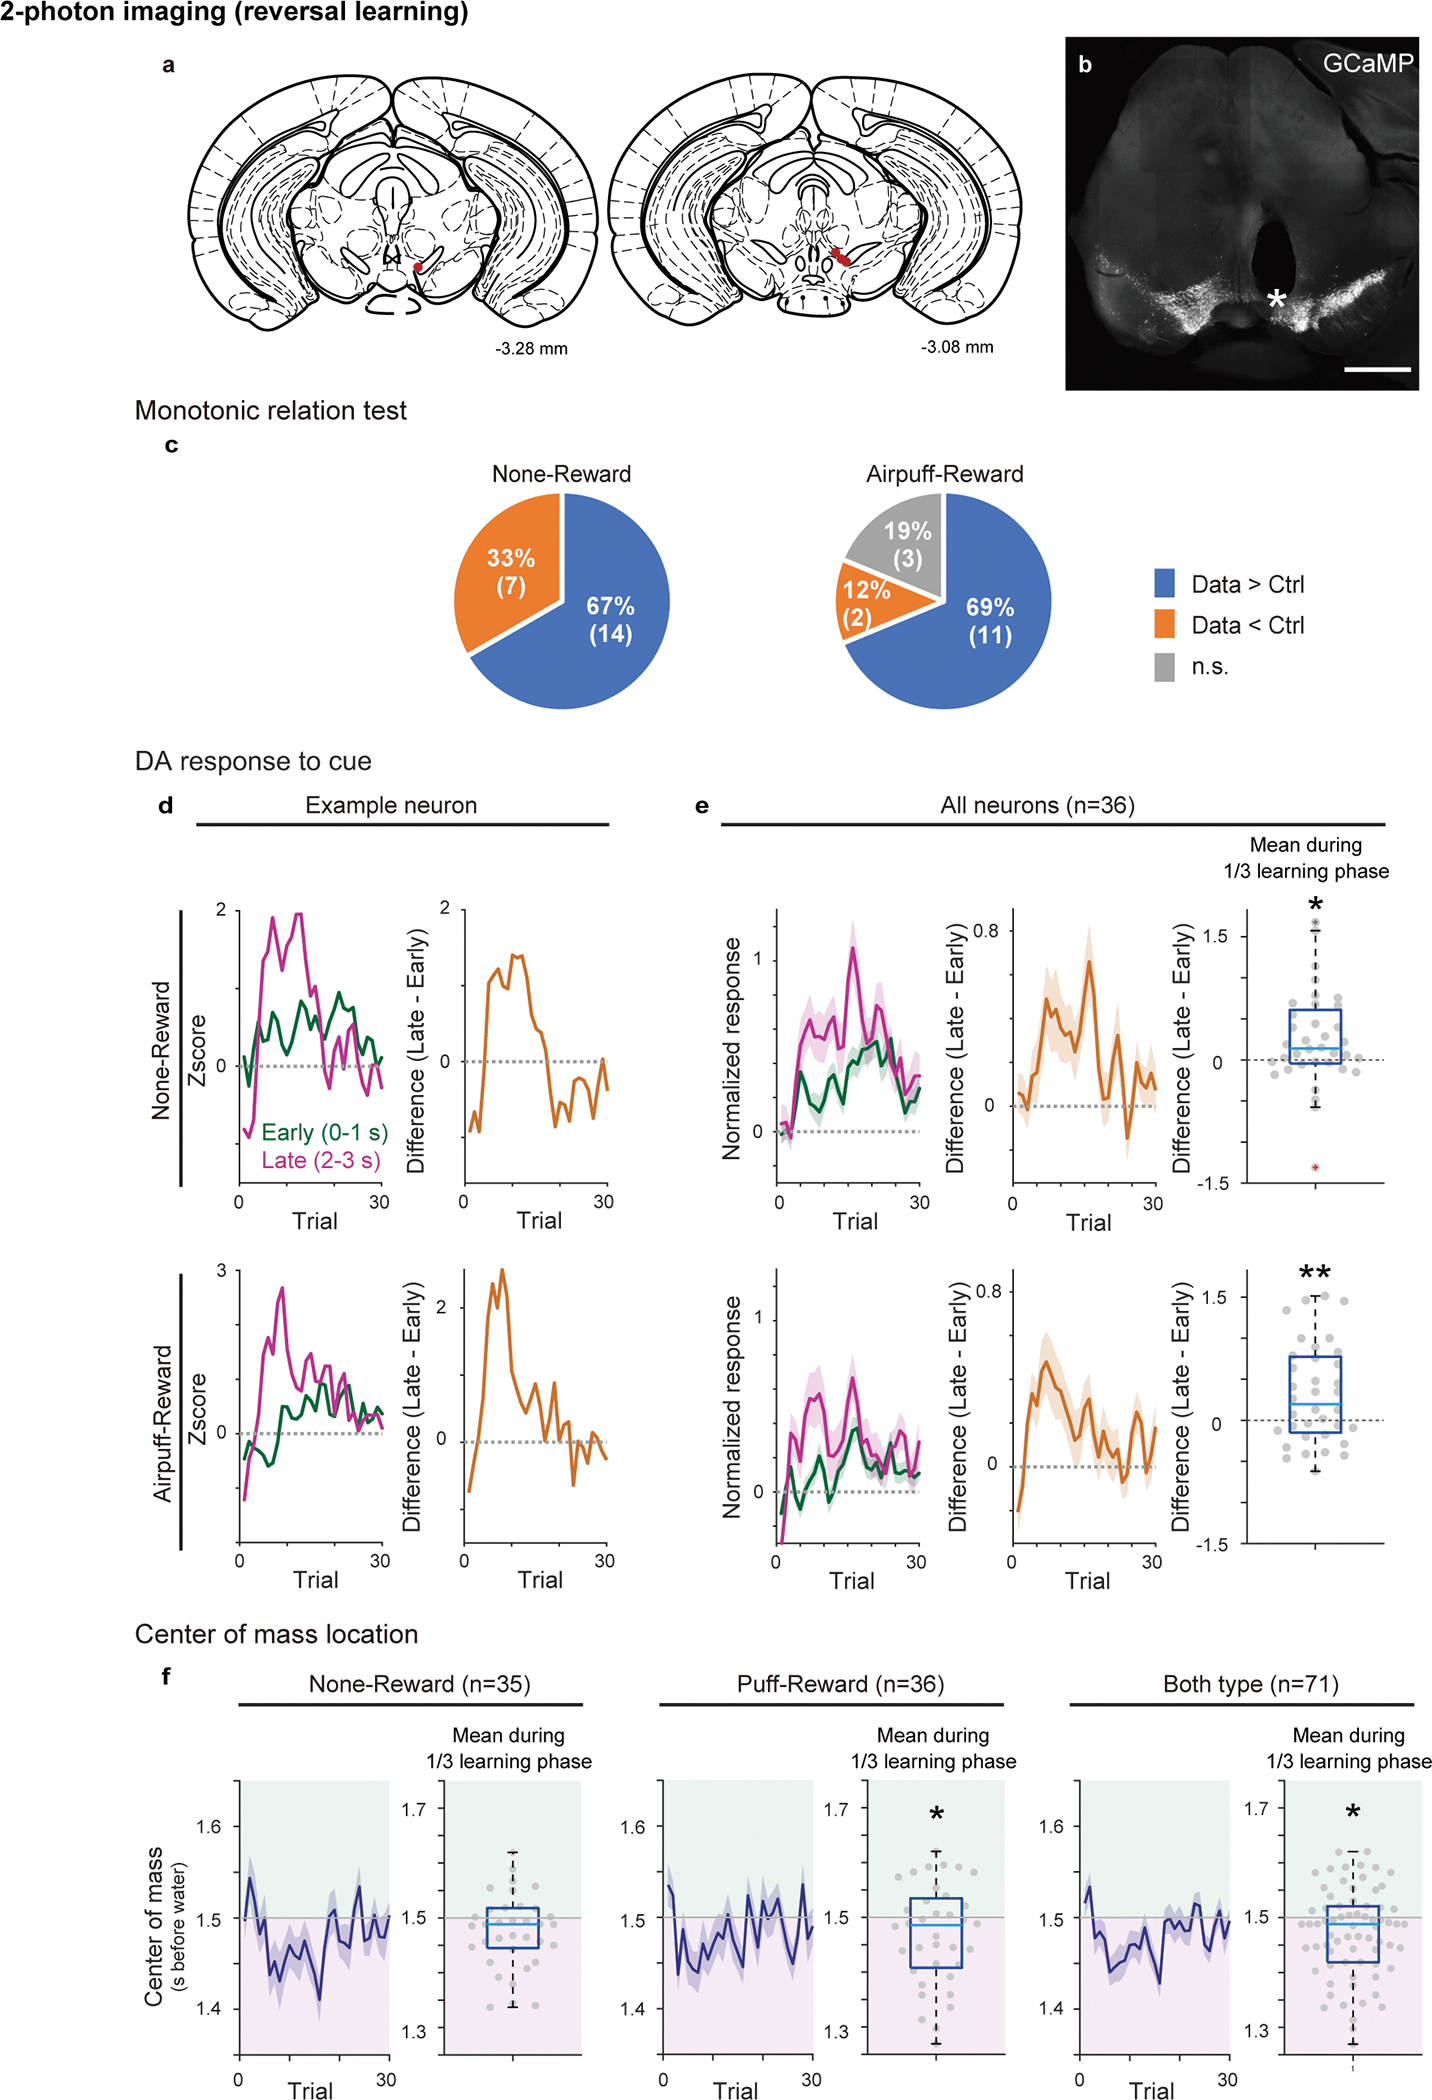
(a) Recording site for each animal is shown in coronal views (Paxinos and Franklin61). (b) Example coronal section of a recording site and GCaMP expression in the VTA. An asterisk indicates fiber tip location. Other 4 animal also showed similar result as shown in (a). Scale bar, 1 mm. (c) Probability of monotonic shift in randomly sampled 3 activity peaks in actual data (blue) and control (red). The neurons with sufficient detected peaks were used (21/36 neurons for nothing to reward, 16/36 neurons for airpuff to reward, see Methods). Sampling was repeated for 500 times for each neuron. The pi-chart summarizes the number of neurons with significantly higher probability of monotonic shift (p<0.05; two-sided t-test, no adjustment for multiple comparison, Data > Ctrl; blue), significantly lower probability of monotonic shift (p<0.05; two-sided t-test, no adjustment for multiple comparison, Data < Ctrl; orange), and not significantly different (n.s.; two-sided t-test, no adjustment for multiple comparison; gray) compared to control (left, nothing to reward, p = 0.039; right, airpuff to reward, p = 0.038, binomial cumulative function). (d and e) Responses to a reward-predicting odor in an example neuron (left column of b) and all neurons (left column of c, n=36, mean ± sem). early: 0–1 s from odor onset (green); late: 2–3 s from odor onset (magenta). Right column of b and middle column of c, difference between early and late odor responses (mean ± sem for c). Right column of c, dopamine activity in the late phase was significantly higher than activity in the early phase during the first 1/3 of learning phase for nothing to reward (t = 2.5, p = 0.015; two-sided t-test), and airpuff to reward (t = 3.1, p = 0.35× 10⁻²; two-sided t-test). (f) Time-course of center of mass (0–3s after cue onset) over training and average centers of mass during the first 1/3 learning phase in all neurons used for linear fitting analysis (left, nothing to reward, n = 35, t = −1.0, p = 0.30; middle, airpuff to reward, n = 36, t = −2.0, p = 0.048; right, both types are pooled, t = −2.2, p = 0.030; two-sided t-test). Center of boxplot showing median, edges are 25th and 75th percentile, and whiskers are most extreme data points not considered as outlier. *p<0.05, **p<0.01.
Supplementary Material
Acknowledgements
We thank Iku Tsutsui-Kimura, HyungGoo Kim, and Benedicte Babayan for technical assistance, Vanessa Roser and Sakura Ikeda for assistance in animal training, Hideyuki Matsumoto for sharing the data, and Michael Bukwich and all lab members for discussion. We thank Mackenzie Mathis, Edward Soucy, Venkatesh Murthy, Mark Andermann and members of their laboratories for advice on establishing 2-photon imaging of deep structures. We thank Catherine Dulac for sharing reagents and equipment. We thank Douglas Kim and GENIE Project, Janelia Farm Research Campus, Howard Hughes Medical Institute for pGP-CMV-GCaMP6f and pGP-AAV-CAG-FLEX-jGCaMP7f-WPRE plasmids, Edward Boyden, Media Lab, Massachusetts Institute of Technology for AAV5-CAG-FLEX-tdTomato and AAV5-CAG-tdTomato, Karl Deisseroth, Stanford University for pAAV-EF1a-DIO-hChR2(H134R)-EYFP-WPRE, and Yulong Li, State Key Laboratory of Membrane Biology, Peking University for AAV9-hSyn-DA2m. This work was supported by grants from National Institute of Mental Health (R01MH125162, MW-U), National Institute of Health (U19 NS113201, NS 108740, NU), the Simons Collaboration on Global Brain (NU), Japan Society for the Promotion of Science, Japan Science and Technology Agency (RA), Human Frontier Science Program (LT000801/2018, SM), The Harvard Brain Science Initiative (HBI Young Scientist Transitions Award, SM) and Brain Mapping by Integrated Neurotechnologies for Disease Studies (Brain/MINDS) by AMED (JP20dm0207069, KFT).
Footnotes
Competing Interests
The authors declare no competing interests.
Reference
- 1.Montague PR, Dayan P & Sejnowski TJ A framework for mesencephalic dopamine systems based on predictive Hebbian learning. J. Neurosci. 16, 1936–1947 (1996). [DOI] [PMC free article] [PubMed] [Google Scholar]
- 2.Schultz W, Dayan P & Montague PR A neural substrate of prediction and reward. Science 275, 1593–1599 (1997). [DOI] [PubMed] [Google Scholar]
- 3.Rescorla RA & Wagner AR A theory of Pavlovian conditioning: Variations in the effectiveness of reinforcement and nonreinforcement. Class. Cond. II Curr. Res. Theory 2, 64–99 (1972). [Google Scholar]
- 4.Sutton RS & Barto AG A temporal-difference model of classical conditioning. in Proceedings of the ninth annual conference of the cognitive science society 355–378 (Seattle, WA, 1987). [Google Scholar]
- 5.Sutton Richard S. & Barto Andrew G. Reinforcement Learning : An Introduction. (A Bradford Book, 1998). [Google Scholar]
- 6.Hollerman JR & Schultz W Dopamine neurons report an error in the temporal prediction of reward during learning. Nat. Neurosci. 1, 304–309 (1998). [DOI] [PubMed] [Google Scholar]
- 7.Flagel SB et al. A selective role for dopamine in stimulus–reward learning. Nature 469, 53–57 (2011). [DOI] [PMC free article] [PubMed] [Google Scholar]
- 8.Menegas W, Babayan BM, Uchida N & Watabe-Uchida M Opposite initialization to novel cues in dopamine signaling in ventral and posterior striatum in mice. eLife 6, (2017). [DOI] [PMC free article] [PubMed] [Google Scholar]
- 9.Day JJ, Roitman MF, Wightman RM & Carelli RM Associative learning mediates dynamic shifts in dopamine signaling in the nucleus accumbens. Nat. Neurosci. 10, 1020–1028 (2007). [DOI] [PubMed] [Google Scholar]
- 10.Clark JJ, Collins AL, Sanford CA & Phillips PEM Dopamine Encoding of Pavlovian Incentive Stimuli Diminishes with Extended Training. J. Neurosci. 33, 3526–3532 (2013). [DOI] [PMC free article] [PubMed] [Google Scholar]
- 11.Pan W-X, Schmidt R, Wickens JR & Hyland BI Dopamine Cells Respond to Predicted Events during Classical Conditioning: Evidence for Eligibility Traces in the Reward-Learning Network. J. Neurosci. 25, 6235–6242 (2005). [DOI] [PMC free article] [PubMed] [Google Scholar]
- 12.Brown J, Bullock D & Grossberg S How the Basal Ganglia Use Parallel Excitatory and Inhibitory Learning Pathways to Selectively Respond to Unexpected Rewarding Cues. J. Neurosci. 19, 10502–10511 (1999). [DOI] [PMC free article] [PubMed] [Google Scholar]
- 13.Mollick JA et al. A systems-neuroscience model of phasic dopamine. Psychol. Rev. 127, 972–1021 (2020). [DOI] [PMC free article] [PubMed] [Google Scholar]
- 14.O’Reilly RC, Frank MJ, Hazy TE & Watz B PVLV: the primary value and learned value Pavlovian learning algorithm. Behav. Neurosci. 121, 31–49 (2007). [DOI] [PubMed] [Google Scholar]
- 15.Tan CO & Bullock D A Local Circuit Model of Learned Striatal and Dopamine Cell Responses under Probabilistic Schedules of Reward. J. Neurosci. 28, 10062–10074 (2008). [DOI] [PMC free article] [PubMed] [Google Scholar]
- 16.Maes EJP et al. Causal evidence supporting the proposal that dopamine transients function as temporal difference prediction errors. Nat. Neurosci. 23, 176–178 (2020). [DOI] [PMC free article] [PubMed] [Google Scholar]
- 17.Roesch MR, Calu DJ & Schoenbaum G Dopamine neurons encode the better option in rats deciding between differently delayed or sized rewards. Nat. Neurosci. 10, 1615–1624 (2007). [DOI] [PMC free article] [PubMed] [Google Scholar]
- 18.Sutton RS, Precup D & Singh S Between MDPs and semi-MDPs: A framework for temporal abstraction in reinforcement learning. Artif. Intell. 112, 181–211 (1999). [Google Scholar]
- 19.Mohebi A et al. Dissociable dopamine dynamics for learning and motivation. Nature 570, 65–70 (2019). [DOI] [PMC free article] [PubMed] [Google Scholar]
- 20.Kim HR et al. A Unified Framework for Dopamine Signals across Timescales. Cell 183, 1600–1616.e25 (2020). [DOI] [PMC free article] [PubMed] [Google Scholar]
- 21.Tsutsui-Kimura I et al. Distinct temporal difference error signals in dopamine axons in three regions of the striatum in a decision-making task. eLife 9, e62390 (2020). [DOI] [PMC free article] [PubMed] [Google Scholar]
- 22.Li L, Walsh TJ & Littman ML Towards a Unified Theory of State Abstraction for MDPs. Internaltional Symp. Artif. Intell. Math. 9, 10. [Google Scholar]
- 23.Botvinick MM, Niv Y & Barto AG Hierarchically organized behavior and its neural foundations: A reinforcement learning perspective. Cognition 113, 262–280 (2009). [DOI] [PMC free article] [PubMed] [Google Scholar]
- 24.Bromberg-Martin ES, Matsumoto M, Hong S & Hikosaka O A Pallidus-Habenula-Dopamine Pathway Signals Inferred Stimulus Values. J. Neurophysiol. 104, 1068–1076 (2010). [DOI] [PMC free article] [PubMed] [Google Scholar]
- 25.Coddington LT & Dudman JT The timing of action determines reward prediction signals in identified midbrain dopamine neurons. Nat. Neurosci. 21, 1563–1573 (2018). [DOI] [PMC free article] [PubMed] [Google Scholar]
- 26.Zhong W, Li Y, Feng Q & Luo M Learning and Stress Shape the Reward Response Patterns of Serotonin Neurons. J. Neurosci. 37, 8863–8875 (2017). [DOI] [PMC free article] [PubMed] [Google Scholar]
- 27.Chen T-W et al. Ultrasensitive fluorescent proteins for imaging neuronal activity. Nature 499, 295–300 (2013). [DOI] [PMC free article] [PubMed] [Google Scholar]
- 28.Sun F et al. Next-generation GRAB sensors for monitoring dopaminergic activity in vivo. Nat. Methods 17, 1156–1166 (2020). [DOI] [PMC free article] [PubMed] [Google Scholar]
- 29.Kakade S & Dayan P Dopamine: generalization and bonuses. Neural Netw. 15, 549–559 (2002). [DOI] [PubMed] [Google Scholar]
- 30.Morrens J, Aydin Ç, Janse van Rensburg A, Esquivelzeta Rabell J & Haesler S Cue-Evoked Dopamine Promotes Conditioned Responding during Learning. Neuron 106, 142–153.e7 (2020). [DOI] [PubMed] [Google Scholar]
- 31.Cohen JY, Haesler S, Vong L, Lowell BB & Uchida N Neuron-type-specific signals for reward and punishment in the ventral tegmental area. Nature 482, 85–88 (2012). [DOI] [PMC free article] [PubMed] [Google Scholar]
- 32.Tian J & Uchida N Habenula lesions reveal that multiple mechanisms underlie dopamine prediction errors. Neuron 87, 1304–1316 (2015). [DOI] [PMC free article] [PubMed] [Google Scholar]
- 33.Niv Y, Duff MO & Dayan P Dopamine, uncertainty and TD learning. Behav. Brain Funct. 1, 6 (2005). [DOI] [PMC free article] [PubMed] [Google Scholar]
- 34.Schultz W, Apicella P & Ljungberg T Responses of monkey dopamine neurons to reward and conditioned stimuli during successive steps of learning a delayed response task. J. Neurosci. 13, 900–913 (1993). [DOI] [PMC free article] [PubMed] [Google Scholar]
- 35.Kobayashi S & Schultz W Reward Contexts Extend Dopamine Signals to Unrewarded Stimuli. Curr. Biol. 24, 56–62 (2014). [DOI] [PMC free article] [PubMed] [Google Scholar]
- 36.Matsumoto H, Tian J, Uchida N & Watabe-Uchida M Midbrain dopamine neurons signal aversion in a reward-context-dependent manner. eLife 5, (2016). [DOI] [PMC free article] [PubMed] [Google Scholar]
- 37.Engelhard B et al. Specialized coding of sensory, motor and cognitive variables in VTA dopamine neurons. Nature 570, 509–513 (2019). [DOI] [PMC free article] [PubMed] [Google Scholar]
- 38.Menegas W et al. Dopamine neurons projecting to the posterior striatum form an anatomically distinct subclass. eLife 4, e10032 (2015). [DOI] [PMC free article] [PubMed] [Google Scholar]
- 39.Dabney W et al. A distributional code for value in dopamine-based reinforcement learning. Nature 577, 671–675 (2020). [DOI] [PMC free article] [PubMed] [Google Scholar]
- 40.Sutton RS & Barto AG Reinforcement Learning, second edition: An Introduction. (MIT Press, 2018). [Google Scholar]
- 41.Babayan BM, Uchida N & Gershman SJ Belief state representation in the dopamine system. Nat. Commun. 9, 1–10 (2018). [DOI] [PMC free article] [PubMed] [Google Scholar]
- 42.Kobayashi S & Schultz W Influence of Reward Delays on Responses of Dopamine Neurons. J. Neurosci. 28, 7837–7846 (2008). [DOI] [PMC free article] [PubMed] [Google Scholar]
- 43.Lee RS, Mattar MG, Parker NF, Witten IB & Daw ND Reward prediction error does not explain movement selectivity in DMS-projecting dopamine neurons. Elife 8, e42992 (2019). [DOI] [PMC free article] [PubMed] [Google Scholar]
- 44.Watabe-Uchida M, Eshel N & Uchida N Neural Circuitry of Reward Prediction Error. Annu. Rev. Neurosci. 40, 373–394 (2017). [DOI] [PMC free article] [PubMed] [Google Scholar]
- 45.Kawato M & Samejima K Efficient reinforcement learning: computational theories, neuroscience and robotics. Curr. Opin. Neurobiol. 17, 205–212 (2007). [DOI] [PubMed] [Google Scholar]
- 46.Tian J et al. Distributed and Mixed Information in Monosynaptic Inputs to Dopamine Neurons. Neuron 91, 1374–1389 (2016). [DOI] [PMC free article] [PubMed] [Google Scholar]
- 47.Mnih V et al. Human-level control through deep reinforcement learning. Nature 518, 529–533 (2015). [DOI] [PubMed] [Google Scholar]
- 48.Botvinick M, Wang JX, Dabney W, Miller KJ & Kurth-Nelson Z Deep Reinforcement Learning and Its Neuroscientific Implications. Neuron 107, 603–616 (2020). [DOI] [PubMed] [Google Scholar]
- 49.Bäckman CM et al. Characterization of a mouse strain expressing Cre recombinase from the 3’ untranslated region of the dopamine transporter locus. Genes. N. Y. N 2000 44, 383–390 (2006). [DOI] [PubMed] [Google Scholar]
- 50.Tong Q et al. Synaptic glutamate release by ventromedial hypothalamic neurons is part of the neurocircuitry that prevents hypoglycemia. Cell Metab. 5, 383–393 (2007). [DOI] [PMC free article] [PubMed] [Google Scholar]
- 51.Madisen L et al. A robust and high-throughput Cre reporting and characterization system for the whole mouse brain. Nat. Neurosci. 13, 133–140 (2010). [DOI] [PMC free article] [PubMed] [Google Scholar]
- 52.Daigle TL et al. A Suite of Transgenic Driver and Reporter Mouse Lines with Enhanced Brain-Cell-Type Targeting and Functionality. Cell 174, 465–480.e22 (2018). [DOI] [PMC free article] [PubMed] [Google Scholar]
- 53.Tsutsui-Kimura I et al. Dysfunction of ventrolateral striatal dopamine receptor type 2-expressing medium spiny neurons impairs instrumental motivation. Nat. Commun. 8, 14304 (2017). [DOI] [PMC free article] [PubMed] [Google Scholar]
- 54.Zhang F et al. Optogenetic interrogation of neural circuits: technology for probing mammalian brain structures. Nat. Protoc. 5, 439–456 (2010). [DOI] [PMC free article] [PubMed] [Google Scholar]
- 55.Inutsuka A et al. The integrative role of orexin/hypocretin neurons in nociceptive perception and analgesic regulation. Sci. Rep. 6, 29480 (2016). [DOI] [PMC free article] [PubMed] [Google Scholar]
- 56.Chen T-W et al. Ultrasensitive fluorescent proteins for imaging neuronal activity. Nature 499, 295–300 (2013). [DOI] [PMC free article] [PubMed] [Google Scholar]
- 57.Dana H et al. High-performance calcium sensors for imaging activity in neuronal populations and microcompartments. Nat. Methods 16, 649–657 (2019). [DOI] [PubMed] [Google Scholar]
- 58.Uchida N & Mainen ZF Speed and accuracy of olfactory discrimination in the rat. Nat. Neurosci. 6, 1224–1229 (2003). [DOI] [PubMed] [Google Scholar]
- 59.Pachitariu M et al. Suite2p: beyond 10,000 neurons with standard two-photon microscopy. bioRxiv 061507 (2017) doi: 10.1101/061507. [DOI] [Google Scholar]
- 60.Keemink SW et al. FISSA: A neuropil decontamination toolbox for calcium imaging signals. Sci. Rep. 8, 3493 (2018). [DOI] [PMC free article] [PubMed] [Google Scholar]
- 61.Paxinos G & Franklin KBJ Paxinos and Franklin’s the Mouse Brain in Stereotaxic Coordinates. (Academic Press, 2019). [Google Scholar]
Associated Data
This section collects any data citations, data availability statements, or supplementary materials included in this article.
Supplementary Materials
Data Availability Statement
The fluorometry and 2-photon imaging data have been shared at a public deposit source (doi:10.5061/dryad.hhmgqnkjw). Source data are provided with this paper.


