

Abstract
This systematic review and meta-analysis aim to provide the best evidence on the association between metabolic syndrome (MetS) and uric acid (UA) by determining the size of the effect of this biomarker on MetS. The review protocol is registered with PROSPERO (CRD42021231124). The search covered the PubMed and Scopus databases. Methodological quality was assessed with the STROBE tool, overall risk of bias with RevMan (Cochrane Collaboration) and quality of evidence with Grade Pro. Initially, 1582 articles were identified. Then, after excluding duplicates and reviewing titles and abstracts, 1529 articles were excluded from applying the eligibility criteria. We included 43 papers (56 groups) comparing UA concentrations between subjects 91,845 with MetS and 259,931 controls. Subjects with MetS had a higher mean UA of 0.57 mg/dl (95% CI 0.54–0.61) (p < 0.00001). Given the heterogeneity of the included studies, the researchers decided to perform subgroups analysis. Men with MetS have a higher UA concentration mg/dl 0.53 (95% CI 0.45–0.62, p < 0.00001) and women with MetS 0.57 (95% CI 0.48–0.66, p < 0.00001) compared to subjects without MetS. Assessment of UA concentration could provide a new avenue for early diagnosis of MetS, as a new biomarker and the possibility of new therapeutic targets.
Subject terms: Endocrine system and metabolic diseases, Predictive markers
Introduction
Metabolic syndrome (MetS) is defined as a set of metabolic abnormalities, including dysglycaemia, central obesity, dyslipidaemia (elevated triglycerides and decreased HDL-cholesterol) and hypertension. These alterations increase the risk of type 2 diabetes mellitus and cardiovascular disease1. The pathogenesis of Mets is not well understood but involves complex interactions between genetic background, hormones, and environmental factors such as air pollution, toxins and nutrients2. Previous evidence supports that insulin resistance (IR), oxidative stress and low-grade inflammation play a central role3.
Chronic low-grade systemic inflammation appears to be a central mechanism underlying the pathophysiology of MetS3,4. This inflammation is characterised by an increase in pro-inflammatory mediators and the activation of several inflammatory pathways that are significantly associated with cardiovascular events5. In addition, the increased concentration of pro-inflammatory substances is primarily related to obesity, especially central obesity, resulting in altered endocrine function of visceral adipose tissue6.
Due to the increasing prevalence of obesity, the prevalence of MetS has grown worldwide, and it is expected to continue increasing in the coming years7. In this respect, the adult population with MetS is estimated between 20 and 30% in most countries8.Due to the complexity of MetS, with diverse influences and implications for other diseases, it is not easy to make a clear-cut distinction of the diagnostic ability of the various biomarker groups. Moreover, the subdivision has limitations: the complexity of the syndrome, interactions of various biochemical pathways and the overlap of markers9.
Nevertheless, some studies have shown an association between MetS and the following variables indicative of inflammatory processes: uric acid (UA), C-reactive protein (CRP), liver transaminases (ALT), erythrocyte sedimentation rate (ESR), leukocytes, among others10–12. Likewise, through magnetic resonance spectroscopy, different metabolites have been identified in urine, highlighting glucose, lipids, aromatic amino acids, salicylic acid, maltitol, trimethylamine N-oxide and p-cresol sulphate, which have been associated with the progression of MetS13.
UA is an enzymatic end product of purine metabolism in humans14. Hyperuricaemia is a metabolic disease caused by increased formation or reduced serum uric acid (SUA) excretion. Alterations in SUA homeostasis have been correlated with several diseases such as gout, MetS, cardiovascular disease, diabetes, hypertension and kidney disease15.
Although SUA levels are often associated with MetS16,17, hyperuricaemia is not included among the diagnostic criteria that have been proposed internationally for the definition of this pathology. However, the pro-oxidant action of hyperuricaemia may induce inflammation and endothelial dysfunction by decreasing the availability of nitric oxide, thus promoting the development of the pathologies discussed above18–21.
Given that the prevalence of MetS increases worldwide and raises the risk of morbidity and mortality, identifying biomarkers for the early detection of this pathology is of great importance22. Therefore, the main Aim is to provide the best evidence on the association between MetS and UA by determining the effect size of this biomarker.
Methods
Literature search and selection
A systematic review and meta-analysis were carried out, following the criteria established by the PRISMA statement23. The search covered the PubMed and Scopus databases. The search strategy was developed by combining the following Medical Subject Headings (MeSH) descriptors: "metabolic syndrome", "uric acid", using the Boolean operator AND. The review was carried out from 2015 to May 2021. In addition, hand searching the reference lists of included studies supplemented the tracking of the available literature. The systematic review was registered in PROSPERO with ID CRD42021231124.
Eligibility criteria
We included longitudinal, cross-sectional, case–control and cohort studies, which investigated the association between MetS and UA. In addition, their results had to include the mean and standard deviation of the study parameters. Furthermore, only papers in English and Spanish and those articles collected data in subjects older than 18 years were considered. Finally, abstracts and unpublished studies comparing subjects with and without MetS were excluded.
Data collection
Two authors (E.R.C. and M.R.S.) separately screened all articles obtained in the search to eliminate duplicates. Then, two other authors (D.P.J. and R.M.L.) independently read the title and abstract and applied the eligibility criteria to select the articles that were finally included in the review. Finally, a fifth authors (M.V.A.) acted as a judge in case of discrepancy. One researcher (E.R.C.) oversaw extracting the data, verified by a second researcher (G.M.R.). A third researcher (M.R.S.) resolved the disagreement in case of a tie.
The extracted articles were drawn up with a table with the main characteristics (author, year, country, study design, reporting guidelines, age of participants, MetS, Aims, conclusions).
The following data were extracted from each study: citation, details of the study population (including age and sex), study design, sample size, study, aims, the mean and standard deviation of UA in those subjects with and without MetS.
Evaluation of the qualitative synthesis
Four authors (R.M.L., D.P.J., G.M.R. and E.R.C.) were responsible for the evaluation of the qualitative synthesis through a triple analysis:
Assessment of methodological quality. The STROBE (Strengthening the Reporting of Observational Studies in Epidemiology) statement24 was used for observational studies.
Risk of bias assessment. Researchers were using the Cochrane Collaboration25 tool included in the REVMAN 5.4.2. software, the risks of selection, conduct, detection, attrition, and reporting were analysed.
- Assessment of the quality of evidence. With the help of the Grade Protool, the evidence profile table was developed, establishing the following levels26:
- High: high confidence in the match between the actual and estimated effect.
- Moderate: moderate confidence in the effect estimate. There is a possibility that the actual effect is far from the estimated effect.
- Low: limited confidence in the estimate of the effect. The actual effect may be far from the estimated effect.
- Very low: low confidence in the estimated effect. The actual effect is very likely to be different from the estimated effect.
Statistical analysis (evaluation of the quantitative synthesis or meta-analysis)
For the meta-analysis, the Cochrane Review Manager software (RevMan 5.4.2) was used to perform the statistical calculations and create the forest plots and funnel plots. Due to the difference in effect size of the included studies, a meta-analysis was performed using the Mantel–Haenszel random-effects method according to the DerSimonian and Laird model. The difference between arithmetic means with a 95% confidence interval was used to measure effect size. The risk of publication bias was assessed using the funnel plot. Heterogeneity was analysed using the Chi-square test and the inconsistency index (I2). According to the Cochrane Collaboration tool, heterogeneity was classified as: unimportant (0–40%), moderate (30–60%), substantial (50–90%) and considerable (75–100%).
Results
Characteristics of the studies
Initially, 1582 articles were identified. Then, after excluding duplicates and reviewing titles and abstracts, 1529 articles were excluded from applying the eligibility criteria. Finally, a total of 43 articles were selected for systematic review and meta-analysis (Fig. 1).Given the large number of articles found in the search, it was divided into three subgroups: (i) articles providing UA data globally without distinction of sex (n = 24); (ii) articles with disaggregated data for men (n = 17) and (iii) women (n = 15). The detailed characteristics of the selected studies are shown in Table 1. Regarding research design, all studies were observational. Twenty-seven studies27–53 defined MetS according to the third report of the National Cholesterol Education Program (NCEP-Adult Treatment Panel (ATP III)54. Seven studies55–61 assessed metabolic syndrome using the International Diabetes Federation (IDF) criteria62. Four studies63–66 used the harmonised criteria67. Three studies68–70 used Chinese Medical Association criteria71; Sumiyoshi et al.72 used the Japanese criteria73 and, finally, Osadnik74 used the criteria defined in the study by Buscemi et al.75.
Figure 1.

PRISMA flowchart. MetS: metabolic syndrome; SD: standard deviation.
Table 1.
Characteristics of included studies (n = 43).
| Author, year, country | Study design | STROBE reporting guidelines24 | Age of participants | No. of subjects MetS+/MetS− | MetS criteria | Aims/conclusions |
|---|---|---|---|---|---|---|
| Ahmadnezhad et al., 2018, Iran55 | Cohort study | 19 |
49.5 ± 8.1 MetS+ 47.1 ± 8.1 MetS− |
2481/4727 Total 7208 |
IDF |
Aim: association between serum prooxidant antioxidant balance (PAB), AU and hs-CRP in 7208 participants in the MASHAD study cohort Conclusion: PAB, UA and hs-CRP are independently associated with the presence of MetS |
| Akboga et al., 2016, Turkey27 | Cross-sectional study | 19 |
57.2 ± 8.7 MetS+ 55.2 ± 8.9 MetS− |
114/63 Total 177 |
NCEP ATP III |
Aim: The aim of the study was to assess the association of serum YKL-40 levels with the presence and severity of MetS Conclusion: Serum levels of YKL-40 are significantly associated with the presence of MetS |
| Ali et al., 2020, Bangladesh28 | Cross-sectional study | 20 |
39.5 ± 14.1 MetS+ 27.8 ± 10.4 MetS− |
93/327 Total 420 |
NCEP ATP III |
Aim: To assess the relationship of SUA with MetS and its components in Bangladeshi adults Conclusion: Elevated SUA is significantly associated with the prevalence of MetS and its components |
| Chang et al., 2019, Taiwan29 | Longitudinal cohort study | 20 | ≥ 30 years |
409/2959 Total 3368 |
NCEP ATP III |
Aim: to examine whether the inclusion of additional metabolic components to the current five markers can improve the discriminative validity for MetSdiagnosis Conclusion: The five current metabolic markers used for MetSdiagnosis represent the best combination with the highest discriminative validity |
| Chen Y et al., 2017,Taiwan30 | Cross-sectional study | 20 |
33.8 ± 4.8 MetS+ 30.1 ± 5.6 MetS− |
2225/20,982 Total 23,207 |
NCEP ATP III |
Aim: to investigate the relationship between UA and the presence of T2DM in the young adult population, and to determine cut-off values for UA to predict the incidence of T2DM, DM and HTN Conclusion: UA is an important predictor of the risk of developing T2DM, HT in adults, especially in the male population |
| Cheng et al., 2017, Italy31 | Cross-sectional study | 18 |
56.5 ± 16.2 Men+ 47.8 ± 18.4 Men− 56.6 ± 17.5 Women+ 44.5 ± 18.3 Women− |
969/2595 Men Total 3564 1130/2676 Women Total 3806 |
NCEP ATP III |
Aim: To explore gender differences between leukocyte telomere length (LTL) and MetS, 1999–2002 Conclusion: the more MetS components, the greater the shortening of the LTL, especially in women |
| Ding et al., 2018, Japan32 | Retrospective cohort study | 20 |
46.9 ± 9.4 MetS+ 43.5 ± 8.5 MetS− |
7835/55,845 Total 63,680 |
NCEP ATP III |
Aim: to estimate future risks of long-term health outcomes related to MetS and its components Conclusion: MetS can help identify individuals with metabolic profiles that confer substantial risk for multiple diseases, providing ancillary value in disease prediction and prevention |
| Fawzy et al., 2020, Saudi Arabia33 | Cross-sectional study | 20 |
43.1 ± 12 MetS+ 37.3 ± 16 MetS− |
90/90 Total 180 |
NCEP ATP III |
Aim: To investigate possible relationships between UA and MetS and its components in a sample of Saudi adult population Conclusion: Serum UA levels in the Saudi population may be associated with the risk of MetS and its components |
| He et al., 2021, China34 | Retrospective cohort study | 21 |
58.3 ± 7.4 Men+ 57.5 ± 7.3 Men− 57.2 ± 7.6 Women+ 53.3 ± 7.9 Women− |
1339/1895 Men Total 3234 3032/3694 Women Total 6726 |
NCEP ATP III |
Aim: association between haemoglobin levels and MetS Conclusion: haemoglobin may play an important role in the development of MetS in both men and women |
| Jeong et al., 2019, Korea35 | Cross-sectional study | 20 |
49.8 ± 0.5Men+ 43.8 ± 0.4 Men− 58.9 ± 0.6 Women+ 44.4 ± 0.4 Women− |
790/1712 Men Total 2502 809/2447 Women Total 3256 |
NCEP ATP III |
Aim: to identify optimal AU level limits for MetS prediction Conclusion: Among Korean adults, SUA levels were found to be strongly associated with the presence of MetS |
| Kawada et al., 2015, Japan36 | Cross-sectional study | 18 |
43.7 ± 7.2 MetS+ 42.4 ± 6.8 MetS− |
862/4240 Total 5102 |
NCEP ATP III |
Aim: To examine the association between MetS and biomarkers, including CRP, UA and plasma fibrinogen levels, in combination with lifestyle factors Conclusion: CRP, UA, no regular exercise and current smoking are associated with MetS |
| Klongthlay et al., 2020, Thailand63 | Cross-sectional study | 20 |
56.2 ± 10.4 MetS+ 51.7 ± 14.2 MetS− |
66/136 Total 202 |
Harmonised criteria |
Aim: to assess the prevalence of T2DM and to investigate the relationship between T2DM and risk factors Conclusion: Decreasing SUA, promoting physical activity and smoking cessation may decrease the risk of developing MetS among Thais |
| Lee et al., 2016, Korea37 | Retrospective study | 21 |
52.1 ± 8.1 Men+ 52 ± 8.5 Men− 52.6 ± 7.7 Women+ 48.8 ± 7.2 Women− |
1695/5195 Men Total 6890 744/3979 Women Total 4723 |
NCEP-ATP III |
Aim: to determine the effect of change in bilirubin concentration on the risk of incident MetS in Korean adults Conclusion: elevated bilirubin values increase the risk of MetS |
| Li et al., 2016, China38 | Cross-sectional study | 20 | 18–79 years |
691/1452 Men Total 2143 1223/2207 Women Total 3430 |
NCEP ATP III |
Aim: to assess the relationship between SUA and MetS Conclusion: normal SUA level is a contributing clinical predictor of MetS, especially in women |
| Liang et al., 2020, China39 | Prospective cohort study | 16 |
40 ± 8.9 Men+ 37 ± 9.9 Men− 45.1 ± 9.5 Women+ 36.2 ± 10 Women− |
576/1949 Male Total 2525 289/1935 Women Total 2224 |
NCEP ATP III |
Aim: to investigate the association of MetS with the incidence of thyroid nodules in Chinese adults Conclusion: nodular thyroid disease is more common in MetS cases |
| Liu et al., 2018, China64 | Cross-sectional study | 19 |
69.5 ± 7.0 MetS+ 70.0 ± 7.6 MetS− |
524/920 Total 1444 |
Harmonised criteria |
Aim: to explore the associations between liver enzymes and the risk of MetS in older populations Conclusion: elevated liver enzyme levels are positively associated with the prevalence of MetS |
| Martins et al., 2021, Brazil56 | Case–control study | 17 | 35–65 years |
30/30 Total 60 |
IDF |
Aim: to understand the pathophysiology by assessing the oxidative status associated with inflammatory processes in patients with MetS in comparison to controls Conclusion: AChE, CRP and AU markers can be used as a focus for MetS treatment |
| Mukhopadhyay et al., 2019, India40 | Cross-sectional study | 18 | 18–60 years old |
113/292 Total 405 |
NCEP ATP III |
Aim: to find out the prevalence of UA problems and their correlation with various anthropometric and metabolic parameters Conclusion: Elevated UA in subjects with MetS |
| Nardin et al., 2018, Italy57 | Cross-sectional study | 19 |
68.4 ± 10.4 MetS+ 67 ± 11.9 MetS− |
2167/2563 Total 4730 |
IDF |
Aim: to evaluate the relationship between MetS and mean platelet volume in a large cohort of patients undergoing coronary angiography Conclusion: MetS is not an independent predictor of higher mean platelet volume |
| Nejatinamini et al., 2015, Iran41 | Case–control study | 20 |
40.6 ± 6 MetS+ 37 ± 5.5 MetS− |
41/60 Total 101 |
NCEP ATP III |
Aim: to examine the association of SUA concentrations with MetS components Conclusion: people with MetS have higher levels of UA, the association of UA and MetS components supports that it could be an additional component of MetS |
| Ni et al., 2020, China42 | Cross-sectional study | 21 |
45.4 ± 11.7 MetS+ 37.9 ± 10.8 MetS− |
100/3049 Total 3149 |
NCEP ATP III |
Aim: to examine the association between SUA and the prevalence of MetS Conclusion: UA levels were associated with MetS and its components |
| Onat et al., 2016, Turkey43 | Prospective cohort study | 18 |
48 ± 12 Men+ 48.5 ± 12 Men− 49 ± 12 Women+ 45.8 ± 11.6 Women− |
253/615 Men Total 868 293/541 Women Total 834 |
NCEP ATP III |
Aim: to investigate different variables with respect to the independent predictive value of MetS risk Conclusion: elevated UA levels are a strong predictor of MetS in women |
| Osadnik et al., 2020, Poland74 | Cross-sectional study | 19 |
28 ± 4.4 MetS+ 26.8 ± 4.4 MetS− |
70/390 Total 460 |
Buscemi et al. study criteria75 |
Aim: to evaluate the association between calcium, phosphorus and MetS in normal weight individuals Conclusion: calcium and phosphorus levels are significantly associated with MetS |
| Porchia et al., 2017, Mexico65 | Cross-sectional study | 21 |
47.2 ± 12.5 MetS+ 37.1 ± 12.8 MetS− |
269/164 Total 433 |
Harmonised criteria |
Aim: to determine the interaction of hyperinsulinaemia and hyperuricaemia on the prevalence of MetS Conclusion: UA and insulin increase the prevalence of MetS |
| Pugliese et al., 2021, Italy44 | Prospective cohort study | 20 |
62 ± 13 MetS+ 52 ± 16 MetS− |
5100/4489 Total 9589 |
NCEP ATP III |
Aim: to evaluate the prognostic role of SUA in patients with MetS Conclusion: SUA levels are associated with an increased risk of cardiovascular mortality independently of the presence of MetS.A threshold of cardiovascular SUA may improve risk stratification |
| Rhee et al., 2015, Korea45 | Cross-sectional study | 18 | 24–50 years |
90/821 Total 911 |
NCEP ATP III |
Aim: to identify the prevalence of METS and assess the association with clinical markers among male aviators Conclusion: low prevalence of MetS among aviators. Aviators with high ALT, AU, white blood cell counts should be screened for MetS |
| Sreckovic et al., 2020, Serbia46 | Cross-sectional study | 18 |
46.7 ± 15 Men+ 47.7 ± 16.7 Men− |
21/15 Total 36 |
ATP III |
Aim: to correlate the risk factors for METS and associated factors (HOMA-IR, CRP, AU, ALT, GGT) in patients with and without METS Conclusion: MetS patients had higher values of associated factors HOMA-IR, CRP, AU, ALT, GGT |
| Sumiyoshi et al., 2019, Japan72 | Retrospective observational study | 20 |
50.8 ± 9.5 MetS+ 48.8 ± 9.6 MetS− |
899/7963 Men Total 8862 132/5799 Women Total 5931 |
Japan Diagnostic Criteria |
Aim: to examine the association between the level of SUA and incident MetS in a Japanese population Conclusion: UA levels were independently associated with MetS |
| Tabak et al., 2017, Turkey47 | Case–control study | 17 | 30–65 years |
130/50 Total 180 |
ATP III |
Aim: to investigate whether there is a relationship between circulating irisin, RBP-4, PTX-3, IL-33 and adiponectin together with anthropomorphic and biochemical variables involved in the development of insulin resistance in MetS Conclusion: irisin, RBP-4, adiponectin and PTX-3 are characteristic of MetS, which is related to low-grade inflammation |
| Tao et al., 2020, China48 | Case–control study | 19 |
62.7 ± 7 MetS+ 62 ± 7.8 MetS− |
455/457 Women Total 912 |
NCEP ATP III |
Aim: to investigate the association between UA and creatine ratio and MetS in postmenopausal women Conclusion: the UA/creatinine ratio was significantly higher in patients with MetS than in controls |
| Tayefi et al., 2017, Iran58 | Cross-sectional study | 20 |
50.05 ± 7.9 MetS+ 46.74 ± 8.0 MetS− |
3211/3367 Total 6578 |
IDF |
Aim: to determine which of the IDF criteria is suitable for the Iranian population to identify patients with and without MetS Conclusion: suggest that the IDF criteria are adequate to identify individuals within the Iranian population into those with or without MetS |
| Vigna et al., 2017, Italy49 | Cohort study | 19 | 16–84 years |
154/80 Men Total 234 300/291 Women Total 591 |
NCEP ATP III |
Aim: to assess gender differences in UA, homocysteine and inflammatory biomarkers as determinants of MetS Conclusion: UA is positively related to MetS in both sexes |
| Wang et al. 2019, China68 | Cohort study | 21 |
68.9 ± 7.3 MetS+ 69.5 ± 8.3 MetS− |
258/999 Total 1257 |
Chinese Medical Association |
Aim: to assess the prevalence of MetS and its association with subclinical carotid atherosclerosis and cardiovascular morbidity and mortality in a Chinese population Conclusion: older adults with Mets have a significantly higher risk of subclinical carotid atherosclerosis, myocardial infarction, stroke and cardiovascular disease (CVD) death than those without MetS |
| Wang et al.,2020, China50 | Cross-sectional study | 19 |
68.7 ± 6.5 MetS+ 68.3 ± 6.5MetS− |
2207/1791 Total 3998 |
NCEP ATP III |
Aim: to investigate the association between SUA and ALT levels and the risk of MetS Conclusion: a combined increase in SUA and ALT is significantly more associated with MetS than an increase in SUA or ALT alone |
| Wang et al., 2021, China69 | Case–control study | 20 |
76.4 ± 6.9 MetS+ 75.3 ± 7.5 MetS− |
100/102 Total 202 |
Chinese Medical Association |
Aim: to elucidate the relationships between MetS, Apolipoprotein E (ApoE) and cognitive dysfunction in an elderly Chinese population Conclusion: MetS diagnosis and ApoE are independently associated with cognitive dysfunction |
| Wang, et al., 2018, China66 | Cross-sectional study | 19 |
69.34 ± 7.1 MetS+ 70.6 ± 6.7 MetS− |
161/307 Total 468 |
Harmonised criteria |
Aim: to investigate the relationship between UA and MetS in elderly women Conclusion: high UA is positively associated with the prevalence of MetS in elderly women |
| Wu et al., 2018, Taiwan51 | Cohort study | 20 |
35.7 ± 5.7 Men+ 32.7 ± 5.8 Men− 36.9 ± 5.9 Women+ 32.9 ± 6.4 Women− |
2225/20,982 Men Total 23,207 115/3964 Women Total 4079 |
NCEP ATP III |
Aim: to explore the prediction of aerobic exercise and resistance training in MetS and diabetes Conclusion: poor performance in aerobic and endurance exercise tests may be predictive of MetS and diabetes |
| Yang et al., 2021, China70 | Case–control study | 19 |
54.8 ± 12.5 MetS+ 45.6 ± 12.7 MetS− |
538/5164 Total 5702 |
Chinese Society of Diabetes |
Aim: to explore the association between MetS and biochemical profiles Conclusion: cystatin C levels were significantly associated with the incidence of MetS |
| Yen et al., 2015, Taiwan52 | Cohort study | 20 |
76.4 ± 6.7 MetS+ 75.8 ± 7.0 MetS− |
31,307/42,240 Total 73,547 |
ATP III |
Aim: to assess the effects of MetS and its components on mortality Conclusion: individual components of MetS are better predictors of all-cause and cause-specific mortality than MetS as a whole |
| Yu et al., 2015, Korea59 | Retrospective longitudinal study | 20 |
51.9 ± 8.2 Men+ 51.6 ± 8.3 Men− 52.9 ± 7.6 Women+ 48.6 ± 7.2 Women− |
2974/5741 Male Total 8715 1241/4486 Women Total 5727 |
IDF |
Aim: to investigate whether longitudinal effects of baseline SUA levels influence incident MetS while including body composition as a confounder in a large number of subjects Conclusion: elevated SUA levels are strong and independent predictors of MetS |
| Yu et al., 2018, Korea60 | Longitudinal study | 20 |
51.8 ± 7.9 Men+ 51.7 ± 8.4 Men− 52.4 ± 7.5 Women+ 48.6 ± 7.2 Women− |
2012/5682 Men Total 7694 901/4462 Women Total 5363 |
IDF |
Aim: to investigate the relationship between changes in SUA level and the development of MetS Conclusion: increased SUA independently protects against the development of MetS, suggesting a possible antioxidant role in the pathogenesis of incident MetS |
| Zhang et al., 2018, China61 | Cross-sectional study | 19 |
55.1 ± 9.9 Men+ 57.6 ± 9.8 Men− 57.4 ± 8.8 Women+ 54.4 ± 9.9 Women− |
1390/4964 Men Total 6354 3998/6225 Women Total 10,223 |
IDF |
Aim: to explore the association between SUA and MetS in rural Chinese adults Conclusion: positive association between SUA and prevalence of MetS in rural Chinese population |
| Zomorrodian et al., 2015, Iran53 | Cross-sectional study | 20 |
50.4 ± 7.9 MetS+ 46.8 ± 8.1 MetS− |
2175/4317 Total 6492 |
NCEP ATP III |
Aim: to explore the association between Mets and the risk of developing CKD in 6492 participants with and without Mets Conclusion: we demonstrate a significant association between some components of METS and increased prevalence of chronic CKD in the Iranian population |
STROBE Strengthening the Reporting of Observational Studies in Epidemiology, MetS metabolic syndrome, Dx diagnosis, IDF International Diabetes Federation, UA uric acid, hs-CRP high-sensitivity C-reactive protein, NCEP ATP III National Cholesterol Education Program Adult Treatment Panel III, SUA serum uric acid, DM diabetes mellitus, T2DM type 2 diabetes mellitus, HOMA-IR Homeostatic Model Assessment of Insulin Resistance, HT hypertension, ALT alanine aminotransferase, GGT gamma glutamyl transferase, CKD chronic kidney disease.
Concerning the articles' origin, twelve (27.9%) were conducted in China34,38,39,42,48,50,61,64,66,68–70. In total, the 43 selected papers compared UA concentrations between 91,845 subjects with MetS and 259931controls. The age of study participants ranged from 18 to 90 years.
Methodological quality assessment
All papers scored 16 points or more out of the 22 items included (highest tercile). No article was excluded for insufficient methodological quality. Table 1 shows a column with the score for each of the reports.
Bias risk analysis
Overall (Fig. 2), the main biases were: random sequential generation, allocation and participant and staff concealment, and blinding of outcome assessment, affecting 72% of the reports. Figure 3 represents the individual assessment of the included studies.
Figure 2.

Overall risk of bias of the studies.
Figure 3.

Summary of risk of bias by study.
Quantitative analysis. Meta-analysis
Meta-analysis 1
This analysis comprises 43 papers, including men and women, together or separately, resulting in 56 groups (Fig. 4). Subjects with MetS had a mean UA 8.2% higher than those without this syndrome (5.89 mg/dl vs. 5.44 mg/dl; p < 0.00001). The funnel plot (Fig. 5) shows a low risk of publication bias. The sensitivity analysis performed to assess the pooled estimate's stability concerning each meta-analysis study did not show that any study significantly affected the heterogeneity of the meta-analysis; therefore, none was excluded. Given the heterogeneity of the included studies, it was decided to perform subgroup analysis.
Figure 4.

Results and summary statistics of studies analysing uric acid levels in the total population with and without metabolic syndrome (MetS) (meta-analysis 1).
Figure 5.
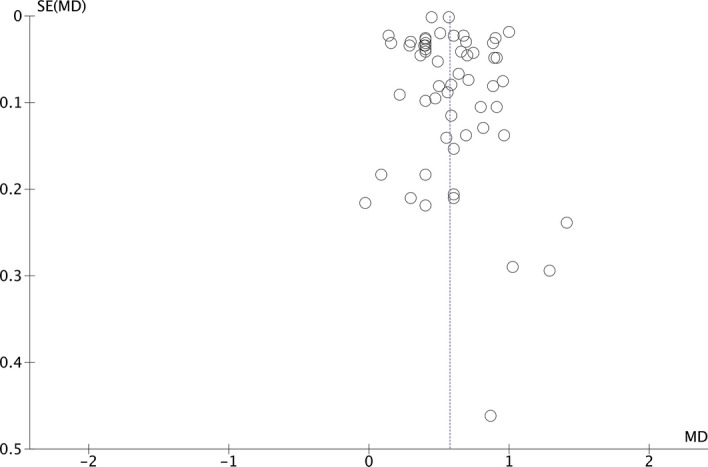
Funnel plot (meta-analysis 1).
Meta-analysis 2
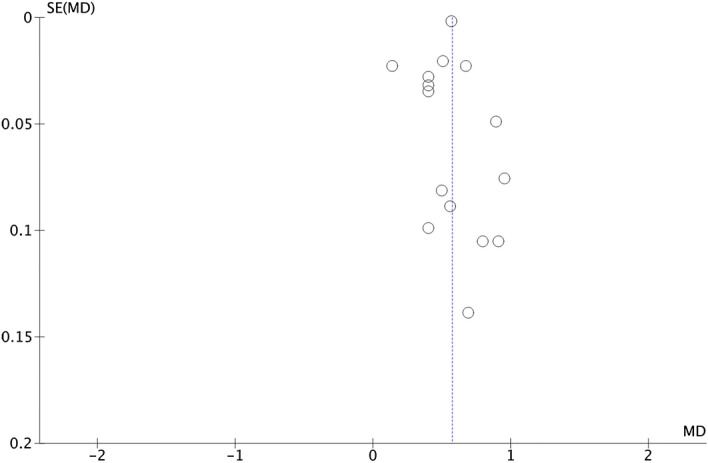
Figure 6, which includes 17 studies, represents the results obtained when analysing the presence of UA in men with and without MetS. In this case, men with MetS showed a higher mean UA, (0.53 mg/dl; 95% CI 0.45 − 0.62; p < 0.00001; I2 = 97%). Figure 7 shows that there is a low risk of publication bias.
Figure 6.

Results and summary statistics of studies analysing uric acid levels in men with and without metabolic syndrome (MetS) (meta-analysis 2).
Figure 7.

Funnet plot (meta-analysis 2).
Meta-analysis 3
Figure 8 compiles the results of 15 studies that examined the association between UA in women and the presence of MetS. The results show that UA level was associated with the diagnosis of METS (0.57 mg/dl; 95% CI 0.48–0.66; p < 0.00001; I2 = 97%). This meta-analysis also observed a low risk of publication bias (Fig. 9).
Figure 8.

Results and summary statistics of studies analysing uric acid levels in women with and without metabolic syndrome (MetS) (meta-analysis 3).
Figure 9.
Funnet plot (meta-analysis 3).
Quality of evidence
Table 2 shows the evidence profile of the three meta-analyses, providing specific information regarding the overall certainty of the evidence of the studies included in the comparison, the magnitude of the studies examined and the sum of the data available for the outcomes assessed.
Table 2.
Evidence profile with GRADE pro for the three meta-analyses.
| Certainty assessment | No. of subjects | Size of the effect | Quality of evidence | |||||||
|---|---|---|---|---|---|---|---|---|---|---|
| N of studies | Study design | Risk of bias | Inconsistency | Indirect evidence | Imprecision | Other considerations | MetS+ | MetS− | Difference of averages (95% CI) | |
| Meta-analysis 1 | ||||||||||
| n = 56 | Observational studies | Very serious | It is not serious | It is not serious | Dose–response gradient | 91,845 | 259,931 | 0,57 (0.54–0.61) |
⨁◯◯◯ Very low |
|
| Meta-analysis 2 | ||||||||||
| n = 17 | Observational studies | Very serious | It is not serious | It is not serious | Dose–response gradient | 19,165 | 86,883 | 0.53 (0.45–0.62) |
⨁◯◯◯ Very low |
|
| Meta-analysis 3 | ||||||||||
| n = 15 | Observational studies | Very serious | It is not serious | It is not serious | Dose–response gradient | 14,823 | 43,471 | 0.57 (0.48–0.66) |
⨁◯◯◯ Very low |
|
MetS metabolic syndrome, CI confidence interval.
Discussion
A systematic review and meta-analysis were conducted to analyse the most recent evidence on the relationship between MetS and UA. Forty-three studies were selected, the effect size and the limitations that have conditioned the results of the different studies were quantified.
Of the included papers, 26 directly associated UA with MetS28–30,33,35,36,38,40–46,48–50,56,57,59–61,63,65,66,72, and 17 reports collected data indirectly27,31,32,34,37,39,47,51–53,57,58,64,68–70,74, i.e. they study parameters related to MetS and collect data associated with UA. These studies had limitations, but overall, all demonstrated a sufficient degree of methodological reliability and quality in terms of the association of UA and MetS.
This meta-analysis provides evidence of a relationship between UA level and MetS. The concentration of UA in subjects with MetS was significantly higher than in the control group. The meta-analysis is notable for its large sample size, with 91,845 subjects in the MetS group and 259,931 in the control group. Given the heterogeneity of the included studies, it was decided to perform subgroup analysis. The results obtained show that men with MetS have a higher UA concentration than those without MetS (mean difference (MD): mg/dl 0.53; 95% CI 0.45–0.62; p < 0.00001). This was also observed in women (MD 0.57 mg/dl; 95% CI 0.48–0.66, p < 0.00001).
Changes in the UA concentrations in human fluids can reflect the metabolic state, immunity, and other human body functions. If the concentration of UA in the blood exceeds normal, the human body fluid becomes acidic, which affects the normal function of human cells, leading to long-term metabolic disease76. UA correlates with obesity, diabetes mellitus76, hypertension77, cardiovascular disease78 and chronic kidney disease79, where UA acts as an oxidant, inducing oxidative stress and endothelial dysfunction80.
Previous studies have reported significant associations between hyperuricaemia and individual elements of the metabolic syndrome81,82. The study by Norvik et al.83 showed that elevated UA levels are associated with components of the MetS, such as hypertriglyceridaemia, insulin resistance, elevated blood pressure and low high-density lipoprotein cholesterol. Xu et al.84 concluded that the relationship between SUA and elevated body mass index, hypertension and hyperglycaemia varies by sex. Reducing SUA levels by adopting a healthier lifestyle may be a valuable strategy to reduce the burden of MetS84.
Overall, the results have shown that people with MetS have 8.2% more UA, so reducing UA could positively impact the development of this syndrome. The results found by several authors85–87 support this. Yuan et al.85, in a meta-analysis based on prospective studies of various populations, suggest that for every 1 mg/dl increase in SUA level, the risk of MetS increases by 30% with a linear dose–response relationship. Liu et al.86 observed a consistent and linear causality of increased UA on the incidence of MetS, concluding that SUA could be an individualised predictor in detecting systemic/hepatic metabolic abnormalities. It is estimated that people with high UA are 1.6 times more likely to develop MetS87. Therefore, reducing SUA levels could be a potential treatment to prevent comprehensive metabolic disorders.
At the methodological level, the assessment of risks of bias in studies is a major issue in this type of research, in line with PRISMA recommendations. Studies with similar methodologies but with discrepancies in quality may have biased results. Among all the papers included in this review, only ten studies29,35,38,41,42,50,56,63,65,68 had performed this step correctly. The quality of the evidence obtained is "very low" since observational studies have been analysed where there is a high risk of bias and, in addition, they present a very high inconsistency (heterogeneity).
One of the main strengths of this review is the comprehensive search that covered a wide geographical area. In addition, a large sample size of subjects with and without MetS was included, which strengthened the study's statistical power.
The interpretation of the findings in this systematic review and meta-analysis must be made considering some limitations. First, most of the studies are from China, making it difficult to generalise the results to other countries. Author bias should also be a limitation since the same research team wrote several studies. Finally, it should be noted that there is still a lack of uniformly accepted diagnostic criteria for the diagnosis of MetS.
Conclusions
Current diagnostic criteria for MetS vary, although there is a consensus on the main components of the syndrome. None of these criteria includes UA levels in the definition of MetS.
The results have shown that UA levels are associated with the presence of MetS. In particular, subjects with MetS have been found to have higher plasma UA. The assessment of UA concentration could provide a new avenue for early diagnosis, identifying new biomarkers, and discovering new therapeutic targets.
A detailed understanding of the components of MetS is essential for the development of effective prevention strategies and appropriate intervention tools, which could curb its increasing prevalence and limit its comorbidity.
However, well-designed, high-quality randomised controlled trials are needed to confirm these findings.
Supplementary Information
Author contributions
Two authors (E.R.C. and M.R.S.) separately screened all articles obtained in the search to eliminate duplicates. Then, two other authors (D.P.J. and R.M.L.) independently read the title and abstract and applied the eligibility criteria to select the articles that were finally included in the review. Finally, a fifth authors (M.V.A.) acted as a judge in case of discrepancy. One researcher (E.R.C.) oversaw extracting the data, verified by a second researcher (G.M.R.). A third researcher (M.R.S.) resolved the disagreement in case of a tie. All authors have participated in search of the literature, analysis and evaluation of quality, results and writing. Finally, the authors have approved the final version of the manuscript.
Data availability
All data generated or analysed during this study are included in this published article [and its supplementary information files].
Competing interests
The authors declare no competing interests.
Footnotes
Publisher's note
Springer Nature remains neutral with regard to jurisdictional claims in published maps and institutional affiliations.
Supplementary Information
The online version contains supplementary material available at 10.1038/s41598-022-22025-2.
References
- 1.Meng G, Zhu Q, Shao J, Zhang Q, Liu L, Wu H, et al. Comparing the diagnostic ability of inflammatory markers in metabolic syndrome. Clin. Chim. Acta. 2017;475:1–6. doi: 10.1016/j.cca.2017.09.023. [DOI] [PubMed] [Google Scholar]
- 2.Zapulla D. Environmental stress, erythrocyte dysfunctions, inflammation and the metabolic syndrome: Adaptations to CO2 increases. J. Cardiometab. Syndr. 2008;3(1):30–34. doi: 10.1111/j.1559-4572.2008.07263.x. [DOI] [PubMed] [Google Scholar]
- 3.Ranasinghe P, Mathangasinghe Y, Jayawardena R, Hills AP, Misra A. Prevalence and trends of metabolic syndrome among adults in the Asia-Pacific region: A systematic review. BMC Public Health. 2017;17(1):101. doi: 10.1186/s12889-017-4041-1. [DOI] [PMC free article] [PubMed] [Google Scholar]
- 4.Welty FK, Alfaddagh A, Elajami TK. Targeting inflammation in metabolic syndrome. Transl. Res. 2016;167(1):257–280. doi: 10.1016/j.trsl.2015.06.017. [DOI] [PMC free article] [PubMed] [Google Scholar]
- 5.Akboga MK, Canpolat U, Yuksel M, Yayla C, Yilmaz S, Turak O, Ozeke O, et al. Platelet to lymphocyte ratio as a novel indicator of inflammation is correlated with the severity of metabolic syndrome: A single center large-scale study. Platelets. 2016;27(2):178–183. doi: 10.3109/09537104.2015.1064518. [DOI] [PubMed] [Google Scholar]
- 6.Liang Y, Hou D, Zhao X, Wang L, Hu Y, Liu J, et al. Childhood obesity affects adult metabolic syndrome and diabetes. Endocrine. 2015;50(1):87–92. doi: 10.1007/s12020-015-0560-7. [DOI] [PubMed] [Google Scholar]
- 7.Gao HG, Chen P, Xia Y, Ke Y, Shao X, et al. High-sensitivity C-reactive protein leads to increased incident metabolic syndrome in women but not in men: A five-year follow-up study in a Chinese population. Diabetes Metab. Syndr. Obes. 2020;13:581–590. doi: 10.2147/dmso.s241774. [DOI] [PMC free article] [PubMed] [Google Scholar]
- 8.Grundy SM. Metabolic syndrome pandemic. Arterioscler. Thromb. Vasc. Biol. 2008;28(4):629–636. doi: 10.1161/ATVBAHA.107.151092. [DOI] [PubMed] [Google Scholar]
- 9.Robberecht H, Hermans N. Biomarkers of metabolic syndrome: Biochemical background and clinical significance. Metab. Syndr. Relat. Disord. 2016;14(2):47–93. doi: 10.1089/met.2015.0113. [DOI] [PubMed] [Google Scholar]
- 10.Sun H, Liu Q, Wang X, Li M, Fan Y, Song G, Liu Y. The longitudinal increments of serum alanine aminotransferase increased the incidence risk of metabolic syndrome: A large cohort population in China. Clin. Chim. Acta. 2019;488:241–247. doi: 10.1016/j.cca.2018.10.033. [DOI] [PubMed] [Google Scholar]
- 11.Zaha CD, Vesa C, Uivarosan D, Bratu O, Fratila O, Mirela D, et al. Influence of inflammation and adipocyte biochemical markers on the components of metabolic syndrome. Exp. Ther. Med. 2020;20(1):121–128. doi: 10.3892/etm.2020.8663. [DOI] [PMC free article] [PubMed] [Google Scholar]
- 12.Vahit D, Mehmet K, Samet Y, Hüseyin E. Assessment of monocyte to high density lipoprotein cholesterol ratio and lymphocyte-to-monocyte ratio in patients with metabolic syndrome. Biomark. Med. 2017;11(7):535–540. doi: 10.2217/bmm-2016-0380. [DOI] [PubMed] [Google Scholar]
- 13.Bruzzone C, Gil Redondo R, Seco M, Barragan R, De la Cruz R, Cannet C, et al. A molecular signature for the metabolic syndrome by urine metabolomics. Cardiovasc. Diabetol. 2021;20(1):155. doi: 10.1186/s12933-021-01349-9. [DOI] [PMC free article] [PubMed] [Google Scholar]
- 14.Chiou WK, Wang MH, Huang DH, Chiu HT, Lee YJ, Lin JD. The relationship between serum uric acid level and metabolic syndrome: Differences by sex and age in Taiwanese. J. Epidemiol. 2010;20:219–224. doi: 10.2188/jea.JE20090078. [DOI] [PMC free article] [PubMed] [Google Scholar]
- 15.Liu N, Xu H, Sun Q, Yu X, Chen W, Wei H, et al. The role of oxidative stress in hyperuricemia and xanthine oxidoreductase (XOR) inhibitors. Oxid. Med. Cell Longev. 2021 doi: 10.1155/2021/1470380. [DOI] [PMC free article] [PubMed] [Google Scholar]
- 16.Nejatinamini S, Ataie Jafari A, Qorbani M, Nikoohemat S, Kelishadi R, Asayesh H, et al. Association between serum uric acid level and metabolic syndrome components. J. Diabetes Metab. Disord. 2015;14(1):70. doi: 10.1186/s40200-015-0200-z. [DOI] [PMC free article] [PubMed] [Google Scholar]
- 17.Gonçalves JP, Oliveira A, Severo M, Santos AC, Lopes C. Cross-sectional and longitudinal associations between serum uric acid and metabolic syndrome. Endocrine. 2012;41:450–457. doi: 10.1007/s12020-012-9629-8. [DOI] [PubMed] [Google Scholar]
- 18.Grassi D, Desideri G, Ferri C. New insight into urate-related mechanism of cardiovascular damage. Curr. Pharm. Des. 2014;20:6089–6095. doi: 10.2174/1381612820666140417095730. [DOI] [PubMed] [Google Scholar]
- 19.Battelli MG, Bortolotti M, Polito L, Bolognesi A. The role of xanthine oxidoreductase and uric acid in metabolic syndrome. Biochim. Biophys. Acta Mol. Basis Dis. 2018;1864(8):2557–2565. doi: 10.1016/j.bbadis.2018.05.003. [DOI] [PubMed] [Google Scholar]
- 20.Arrigo Francesco GC, Federica F, Marina G, Grandi E, Rosticci M, Addato S, et al. Serum uric acid predicts incident metabolic syndrome in the elderly in an analysis of the Brisighella Heart Study. Sci. Rep. 2018;8:11529. doi: 10.1038/s41598-018-29955-. [DOI] [PMC free article] [PubMed] [Google Scholar]
- 21.Foster C, Smith L, Alemzadeh R. Excess serum uric acid is associated with metabolic syndrome in obese adolescent patients. J. Diabetes Metab. Disord. 2020;19(1):535–543. doi: 10.1007/s40200-020-00507-2. [DOI] [PMC free article] [PubMed] [Google Scholar]
- 22.Abdel-Moneim A, Mahmoud B, Sultan EA, Mahmoud R. Relationship of leukocytes, platelet indices and adipocytokines in metabolic syndrome patients. Diabetes Metab. Syndr. 2019;13(1):874–880. doi: 10.1016/j.dsx.2018.12.016. [DOI] [PubMed] [Google Scholar]
- 23.Urrutia G, Bonfill X. Declaración PRISMA: Una propuesta para mejorar la publicación de revisiones sistemáticas y metaanálisis. Med. Clin. 2010;135(11):507–511. doi: 10.1016/j.medcli.2010.01.015. [DOI] [PubMed] [Google Scholar]
- 24.Von EE, Altman DG, Egger M, Pocock Stuart J, Gøtzsche C, Vandenbroucke P. Declaración de la Iniciativa STROBE (Strengthening the Reporting of Observational studies in Epidemiology): Directrices para la comunicación de estudios observacionales. Gac. Sanit. 2008;22:144–150. doi: 10.1157/13119325. [DOI] [PubMed] [Google Scholar]
- 25.Higgins JPT, Altman DG, Gotzsche PC, Juni P, Moher D, Oxman A, et al. The Cochrane collaboration's tool for assessing risk of bias in randomised trials. BMJ. 2011;343:d5928. doi: 10.1136/bmj.d5928. [DOI] [PMC free article] [PubMed] [Google Scholar]
- 26.Guyatt G, Oxman AD, Akl EA, Kunz R, Vist G, Brozek J, et al. GRADE guidelines: 1. Introduction—GRADE evidence profiles and summary of findings tables. J. Clin. Epidemiol. 2011;64:383–394. doi: 10.1016/j.jclinepi.2010.04.026. [DOI] [PubMed] [Google Scholar]
- 27.Akboğa MK, Yalçın R, Şahinarslan A, Yılmaz Demirtaş C, Paşaoğlu H, Abacı A. Increased serum YKL-40 level is associated with the presence and severity of metabolic syndrome. Anatol. J. Cardiol. 2016;16(12):953–958. doi: 10.14744/AnatolJCardiol.2016.6933. [DOI] [PMC free article] [PubMed] [Google Scholar]
- 28.Ali N, Miah R, Hasan M, Barman Z, Mou AD, Hafsa J, et al. Association between serum uric acid and metabolic syndrome: A cross-sectional study in Bangladeshi adults. Sci. Rep. 2020;10(1):7841. doi: 10.1038/s41598-020-64884-7. [DOI] [PMC free article] [PubMed] [Google Scholar]
- 29.Chang HC, Chen SP, Yang HJ. Including selective metabolic components in current diagnostic criteria does not improve discriminative validity for metabolic syndrome: A risk score approach. J. Int. Med. Res. 2019;47(3):1298–1311. doi: 10.1177/0300060518822919. [DOI] [PMC free article] [PubMed] [Google Scholar]
- 30.Chen Y, Kao T, Yang H, Chou C, Wu C, Lai C, et al. The association of uric acid with the risk of metabolic syndrome, arterial hypertension or diabetes in Young subjects: An observational study. Clin. Chim. Acta. 2018;478:68–73. doi: 10.1016/j.cca.2017.12.038. [DOI] [PubMed] [Google Scholar]
- 31.Cheng YY, Kao TW, Chang YW, Wu CJ, Peng TC, Wu L, et al. Examining the gender difference in the association between metabolic syndrome and the mean leukocyte telomere length. PLoS One. 2017;12(7):e0180687. doi: 10.1371/journal.pone.0180687. [DOI] [PMC free article] [PubMed] [Google Scholar]
- 32.Ding C, Yang Z, Wang S, Sun F, Zhan S. The associations of metabolic syndrome with incident hypertension, type 2 diabetes mellitus and chronic kidney disease: A cohort study. Endocrine. 2018;60(2):282–291. doi: 10.1007/s12020-018-1552-1. [DOI] [PubMed] [Google Scholar]
- 33.Fawzy M, Alsel B. Association of serum uric acid levels components of metabolic syndrome: A cross-sectional analysis in a Saudi adult population. Int. J. Biomed. 2020;10:457–466. doi: 10.21103/Article10(4)_OA25. [DOI] [Google Scholar]
- 34.He S, Gu H, Yang J, et al. Hemoglobin concentration is associated with the incidence of metabolic syndrome. BMC Endocr. Disord. 2021;21:53. doi: 10.1186/s12902-021-00719-4. [DOI] [PMC free article] [PubMed] [Google Scholar]
- 35.Jeong J, Suh YJ. Association between serum uric acid and metabolic syndrome in Koreans. J Korean Med. Sci. 2019;34(48):e307. doi: 10.3346/jkms.2019.34.e307. [DOI] [PMC free article] [PubMed] [Google Scholar]
- 36.Kawada T, Otsuka T, Inagaki H, Wakayama Y, Katsumata M. Biological markers, lifestyles and metabolic syndrome in workers. Diabetes Metab. Syndr. Clin. Res. Rev. 2015;9(2):71–73. doi: 10.1016/j.dsx.2015.02.009. [DOI] [PubMed] [Google Scholar]
- 37.Lee Y-B, Lee S-E, Jun JE, Jee JH, Bae JC, Jin S-M, et al. Change in serum bilirubin level as a predictor of incident metabolic syndrome. PLoS One. 2016;11(12):e0168253. doi: 10.1371/journal.pone.0168253. [DOI] [PMC free article] [PubMed] [Google Scholar]
- 38.Li Q, Lu J, Cao X, Shi T, Feng J, Yang J. An increase in normal SUA level within the normal range predicts risk of metabolic syndrome, especially in women: A cross-sectional study. Endocr. Care. 2016 doi: 10.1055/s-0042-117010. [DOI] [PubMed] [Google Scholar]
- 39.Liang Q, Yu S, Chen S, Yang Y, Li S, Hu C, et al. Association of changes in metabolic syndrome status with the incidence of thyroid nodules: A prospective study in Chinese adults. Front. Endocrinol. 2020;11:582. doi: 10.3389/fendo.2020.00582. [DOI] [PMC free article] [PubMed] [Google Scholar]
- 40.Mukhopadhyay P, Ghosh S, Pandit K, Chatterjee P, Majhi B, Chowdhury S. Uric acid and its correlation with various metabolic parameters: A population-based study. Indian J. Endocrinol. Metab. 2019;23(1):134–139. doi: 10.4103/ijem.IJEM_18_19. [DOI] [PMC free article] [PubMed] [Google Scholar]
- 41.Nejatinamini S, Ataie-Jafari A, Qorbani M, Nikoohemat S, Kelishad R, Asayesh H, Hosseini S. Association between serum uric acid level and metabolic syndrome components. J. Diabetes Metab. Disord. 2020;14(1):70. doi: 10.1186/s40200-015-0200-z. [DOI] [PMC free article] [PubMed] [Google Scholar]
- 42.Ni W, Wang R, Liu Z, Yuan X, Chi H, Lv D, et al. Association of serum uric acid with metabolic syndrome and its components: A cross-sectional study in Chinese coastal population. Metab. Syndr. Relat. Disord. 2020;18(2):103–109. doi: 10.1089/met.2019.0043. [DOI] [PubMed] [Google Scholar]
- 43.Onat A, Can G, Çakr H, Özpamuk-Karadeniz F, Karadeniz Y, Yüksel H, et al. Sex-specific predictors of metabolic syndrome independent of its components. J. Investig. Med. 2015;63(6):796–801. doi: 10.1097/JIM.0000000000000203. [DOI] [PubMed] [Google Scholar]
- 44.Pugliese NR, Mengozzi A, Virdis A, Casiglia E, Tikhonoff V, Cicero AFG, et al. The importance of including uric acid in the definition of metabolic syndrome when assessing the mortality risk. Clin. Res. Cardiol. 2021 doi: 10.1007/s00392-021-01815-0. [DOI] [PMC free article] [PubMed] [Google Scholar]
- 45.Rhee C, Kim J, Kim J, Chang E, Park S, Lee W, Kang H. Clinical markers associated with metabolic syndrome among military aviators. Aerosp. Med. Hum. Perform. 2015;86(11):970–975. doi: 10.3357/amhp.4362.2015. [DOI] [PubMed] [Google Scholar]
- 46.Sreckovic B, Mrdovic I, Soldatovic I, Resan M, Janeski N, Colak E, et al. The correlation between metabolic syndrome quantification scores and numerous laboratory parameters related to this syndrome. Vojnosanit. Pregl. 2020;77(8):189–795. doi: 10.2298/vsp180626132S. [DOI] [Google Scholar]
- 47.Tabak O, Simsek G, Erdenen F, Sozer V, Hasoglu T, Gelisgen R, et al. The relationship between circulating irisin, retinol binding protein-4, adiponectin and inflammatory mediators in patients with metabolic syndrome. Arch. Endocrinol. Metab. 2017;61(6):515–523. doi: 10.1590/2359-3997000000289. [DOI] [PMC free article] [PubMed] [Google Scholar]
- 48.Tao J, Shen X, Li J, Cha E, Gu P, Liu J, Zhu W, et al. Serum uric acid to creatinine ratio and metabolic syndrome in postmenopausal Chinese women. Medicine. 2020;99(17):e19959. doi: 10.1097/MD.0000000000019959. [DOI] [PMC free article] [PubMed] [Google Scholar]
- 49.Vigna L, Vassalle C, Tirelli A, Gori F, Tomaino L, Sabatino L, et al. Gender-related association between uric acid, homocysteine, γ-glutamyltransferase, inflammatory biomarkers and metabolic syndrome in subjects affected by obesity. Biomark. Med. 2017;11(10):857–865. doi: 10.2217/bmm-2017-0072. [DOI] [PubMed] [Google Scholar]
- 50.Wang J, Wang Y, Chen F, Ma G, Wang D. Measurement of the combined levels of serum uric acid and alanine aminotransferase and the risk of metabolic syndrome in a population aged 60 years or more in Northeastern China. Med. Sci. Monit. 2020;20(26):e916459. doi: 10.12659/MSM.916459. [DOI] [PMC free article] [PubMed] [Google Scholar]
- 51.Wu C, Kao TW, Yang HF, Sun YS, Chen Y, Wang C, et al. Predictability of cardiorespiratory fitness on the risk of developing metabolic syndrome and diabetes mellitus in Taiwan adults: Preliminary analysis of a cohort study. Obes. Res. Clin. Pract. 2018;12:541–546. doi: 10.1016/j.orcp.2018.07.006. [DOI] [PubMed] [Google Scholar]
- 52.Yen Y, Hu H, Lin I, Lai Y, Su Vincent Y, Pan S, et al. Associations of metabolic syndrome and its components with mortality in the elderly. Medicine. 2015;94(23):e956. doi: 10.1097/MD.0000000000000956. [DOI] [PMC free article] [PubMed] [Google Scholar]
- 53.Zomorrodian D, Khajavi-Rad A, Avan A, Ebrahimi M, Nematy M, Azarpazhooh M, et al. Metabolic syndrome components as markers to prognosticate the risk of developing chronic kidney disease: Evidence-based study with 6492 individuals. J. Epidemiol. Community Health. 2015;69(6):594–598. doi: 10.1136/jech-2014-205160. [DOI] [PubMed] [Google Scholar]
- 54.Expert Panel on Detection, Evaluation, and Treatment of High Blood Cholesterol in Adults Executive Summary of The Third Report of The National Cholesterol Education Program (NCEP) Expert Panel on Detection, Evaluation, And Treatment of High Blood Cholesterol In Adults (Adult Treatment Panel III) JAMA. 2001;285(19):2486–2497. doi: 10.1001/jama.285.19.2486. [DOI] [PubMed] [Google Scholar]
- 55.Ahmadnezhad M, Arefhosseini SR, Parizadeh M, Tavallaie S, Tayefi M, Darroudi S, et al. Association between serum uric acid, high sensitive C-reactive protein and pro-oxidant-antioxidant balance in patients with metabolic syndrome. BioFactors. 2018;44(3):263–271. doi: 10.1002/biof.1424. [DOI] [PubMed] [Google Scholar]
- 56.Martins CC, Bagatini MD, Simões JLB, Cardoso A, Baldissarelli J, Dalenogare D, et al. Increased oxidative stress and inflammatory markers contrasting with the activation of the cholinergic anti-inflammatory pathway in patients with metabolic syndrome. Clin. Biochem. 2021;89:63–69. doi: 10.1016/j.clinbiochem.2020.12.007. [DOI] [PubMed] [Google Scholar]
- 57.Nardin M, Verdoia M, Barbieri L, De Luca G. Impact of metabolic syndrome on mean platelet volume and its relationship with coronary artery disease. Platelets. 2019;30:615–623. doi: 10.1080/09537104.2018.1499885. [DOI] [PubMed] [Google Scholar]
- 58.Tayefi M, Saberi-Karimian M, Esmaeili H, Zadeh A, Ebrahimi M, Mohebati M, et al. Evaluating of associated risk factors of metabolic syndrome by using decision tree. Comp. Clin. Pathol. 2017 doi: 10.1007/s00580-017-2580-6. [DOI] [Google Scholar]
- 59.Yu TY, Jee J, Bae J, Jin S, Baek J, Lee M, et al. Serum uric acid: A strong and independent predictor of metabolic syndrome after adjusting for body composition. Metabolism. 2015 doi: 10.1016/j.metabol.2015.11.003. [DOI] [PubMed] [Google Scholar]
- 60.Yu T-Y, Jin S-M, Jee J, Bae JC, Lee MK, Kim JH. The protective effects of increasing serum uric acid level on development of metabolic syndrome. Diabetes Metab. 2018;43(4):504. doi: 10.4093/dmj.2018.0079. [DOI] [PMC free article] [PubMed] [Google Scholar]
- 61.Zhang H, Li Y, Mao Z, Liu X, Zhang X, Yang K, et al. Sex-specific associations of serum uric acid with metabolic syndrome in Chinese rural population: The RuralDiab study. Clin. Chim. Acta. 2018;480:119–125. doi: 10.1016/j.cca.2018.02.003. [DOI] [PubMed] [Google Scholar]
- 62.Alberti G, Zimmet P, Shaw J. The metabolic syndrome a new worldwide definition. IDF epidemiology task force consensus group. Lancet. 2005;366:1059e62. doi: 10.1016/S0140-6736(05)67402-8. [DOI] [PubMed] [Google Scholar]
- 63.Klongthalay K-S. Increased uric acid and life style factors associated with metabolic syndrome in Thais. Ethiop. J. Health Sci. 2020;30(2):199. doi: 10.4314/ejhs.v30i2.7. [DOI] [PMC free article] [PubMed] [Google Scholar]
- 64.Liu C-F, Zhou W-N, Lu Z, Wang X-T, Qiu Z. The associations between liver enzymes and the risk of metabolic syndrome in the elderly. Exp. Gerontol. 2018;106:132–136. doi: 10.1016/j.exger.2018.02.026. [DOI] [PubMed] [Google Scholar]
- 65.Porchia LM, Gonzalez M, Torres E, Ruiz-Vivanco G, Pérez R. Low serum uric acid concentration augments insulin effects on the prevalence of metabolic syndrome. Diabetes Metab. Syndr. 2018;12(3):325–331. doi: 10.1016/j.dsx.2017.12.012. [DOI] [PubMed] [Google Scholar]
- 66.Wang H, Shi L, Liu C, Liu S, Shi S. Association between uric acid and metabolic syndrome in elderly women. Open Med. 2018;13(1):172–177. doi: 10.1515/med-2018-0027. [DOI] [PMC free article] [PubMed] [Google Scholar]
- 67.Alberti KGMM, Eckel RH, Grundy SM, Zimmet PZ, Cleeman JI, Donato KA, et al. Harmonizing the metabolic syndrome: A joint Interim statement of the International Diabetes Federation Task Force on Epidemiology and Prevention; National Heart, Lung, and Blood Institute; American Heart Association; World Heart Federation; International Atherosclerosis Society; and International Association for the Study of Obesity. Circulation. 2009;120(16):1640–1645. doi: 10.1161/circulationaha.109.192644. [DOI] [PubMed] [Google Scholar]
- 68.Wang C, Fang X, Wu X, Hua Y, Zhang Z, Gu X, et al. Metabolic syndrome and risks of carotid atherosclerosis and cardiovascular events in community-based older adults in China. Asia Pac. J. Clin. Nutr. 2019;28(4):870–878. doi: 10.6133/apjcn.201912_28(4).0024. [DOI] [PubMed] [Google Scholar]
- 69.Wang JY, Zhang L, Liu J, Yang W, Ma LN. Metabolic syndrome, ApoE genotype, and cognitive dysfunction in an elderly population: A single-center, case-control study. World J. Clin. Cases. 2021;9(5):1005–1015. doi: 10.12998/wjcc.v9.i5.1005. [DOI] [PMC free article] [PubMed] [Google Scholar]
- 70.Yang T, Pei D. Association of cystatin C levels with metabolic syndrome incidence: A nested case-control study with propensity score matching. J. Int. Med. Res. 2021;49(1):300060520986311. doi: 10.1177/0300060520986311. [DOI] [PMC free article] [PubMed] [Google Scholar]
- 71.Chinese Medical Association . The Suggestion on Chinese Metabolic Syndrome. Chinese Medical Association; 2004. [Google Scholar]
- 72.Sumiyoshi H, Ohyama Y, Imai K, Kurabayashi M, Saito Y, Nakamura T. Association of uric acid with incident metabolic syndrome in a Japanese general population. Int. Heart J. 2019;60:830–835. doi: 10.1536/ihj.18-444. [DOI] [PubMed] [Google Scholar]
- 73.Matsuzawa Y. Definition and the diagnostic standard for metabolic syndrome. Committee to Evaluate Diagnostic Standards for Metabolic Syndrome. J. Jpn. Soc. Intern. Med. 2005;94:794–809. [PubMed] [Google Scholar]
- 74.Osadnik K, Osadnik T, Delijewski M, Lejawa M, Fronczek M, Reguła R, et al. Calcium and phosphate levels are among other factors associated with metabolic syndrome in patients with normal weight. Diabetes Metab. Syndr. Obes. 2020;13:1281–1288. doi: 10.2147/DMSO.S232497. [DOI] [PMC free article] [PubMed] [Google Scholar]
- 75.Buscemi S, Chiarello P, Buscemi C, Corleo D, Massenti MF, Barile AM, et al. Characterization of metabolically healthy obese people and metabolically unhealthy normal-weight people in a general population cohort of the ABCD study. J. Diabetes Res. 2017;2017:9294038. doi: 10.1155/2017/9294038. [DOI] [PMC free article] [PubMed] [Google Scholar]
- 76.Xiong Q, Liu J, Xu Y. Effects of uric acid on diabetes mellitus and its chronic complications. Int. J. Endocrinol. 2019;2019:9691345. doi: 10.1155/2019/9691345. [DOI] [PMC free article] [PubMed] [Google Scholar]
- 77.Kuwabara M, Niwa K, Nishi Y, Mizuno A, Asano T, Masuda K, et al. Relationship between serum uric acid levels and hypertension among Japanese individuals not treated for hyperuricemia and hypertension. Hypertens. Res. 2014;37(8):785–789. doi: 10.1038/hr.2014.75. [DOI] [PubMed] [Google Scholar]
- 78.Shahin L, Patel KM, Heydari MK, Kesselman MM. Hyperuricemia and cardiovascular risk. Cureus. 2021;13(5):e14855. doi: 10.7759/cureus.14855. [DOI] [PMC free article] [PubMed] [Google Scholar]
- 79.Viazzi F, Piscitelli P, Giorda C, Ceriello A, Genovese S, Russo G, et al. Metabolic syndrome, serum uric acid and renal risk in patients with T2D. PLoS One. 2017;12(4):e0176058. doi: 10.1371/journal.pone.0176058. [DOI] [PMC free article] [PubMed] [Google Scholar]
- 80.Yan D, Tu Y, Jiang F, Wang J, Zhang R, Sun X, et al. Uric acid is independently associated with diabetic kidney disease: A cross sectional study in a Chinese population. PLoS One. 2015;10(6):e0129797. doi: 10.1371/journal.pone.0129797. [DOI] [PMC free article] [PubMed] [Google Scholar]
- 81.Thottam GE, Krasnokutsky S, Pillinger MH. Gout and metabolic syndrome: A tangled web. Curr. Rheumatol. Rep. 2017;19(10):60. doi: 10.1007/s11926-017-0688-y. [DOI] [PubMed] [Google Scholar]
- 82.Billiet L, Doaty S, Katz JD, Velasquez MT. Review of hyperuricemia as new marker for metabolic syndrome. ISRN Rheumatol. 2014;2014:852954. doi: 10.1155/2014/852954. [DOI] [PMC free article] [PubMed] [Google Scholar]
- 83.Norvik JV, Storhaug HM, Ytrehus K, Jenssen TG, Zykova SN, Eriksen BO, et al. Overweight modifies the longitudinal association between uric acid and some components of the metabolic syndrome: The Tromsø Study. BMC Cardiovasc. Disord. 2016;16:85. doi: 10.1186/s12872-016-0265-8. [DOI] [PMC free article] [PubMed] [Google Scholar]
- 84.Xu J, Liu C, Fu L, Li L, Wang T. The association of serum uric acid with metabolic syndrome and its components—From a single-clinical centre in China. Int. J. Clin. Pract. 2021;75(4):e13845. doi: 10.1111/ijcp.13845. [DOI] [PubMed] [Google Scholar]
- 85.Yuan H, Yu C, Li X, Sun L, Zhu X, Zhao C, et al. Serum uric acid levels and risk of metabolic syndrome: A dose–response meta-analysis of prospective studies. J. Clin. Endocrinol. Metab. 2015;100:4198–4207. doi: 10.1210/jc.2015-2527. [DOI] [PubMed] [Google Scholar]
- 86.Liu Z, Que S, Zhou L, Zheng S. Dose–response relationship of serum uric acid with metabolic syndrome and non-alcoholic fatty liver disease incidence: A meta-analysis of prospective studies. Sci. Rep. 2015;5:14325. doi: 10.1038/srep14325. [DOI] [PMC free article] [PubMed] [Google Scholar]
- 87.Chen LY, Zhu WH, Chen ZW, Dai HL, Ren JJ, Chen JH, et al. Relationship between hyperuricemia and metabolic syndrome. J. Zhejiang Univ. Sci. B. 2007;8(8):593–598. doi: 10.1631/jzus.2007.B0593. [DOI] [PMC free article] [PubMed] [Google Scholar]
Associated Data
This section collects any data citations, data availability statements, or supplementary materials included in this article.
Supplementary Materials
Data Availability Statement
All data generated or analysed during this study are included in this published article [and its supplementary information files].