

Abstract
Objective
C‐reactive protein (CRP), erythrocyte sedimentation rate (ESR), plasma fibrinogen and D‐Dimer are used as diagnostic biomarkers of prosthetic joint infection (PJI) after total joint arthroplasty (TJA). The purpose of the study was to investigate the normal trajectory of CRP, ESR, plasma fibrinogen and D‐Dimer at different time points after two‐stage exchange arthroplasty for PJI.
Methods
We studied 53 patients undergoing two‐stage exchange for PJI at five time points: preoperatively (T0), duration of hospital stays (T1), 30 days (T2), 30–90 days (T3), and 90–180 days (T4) after surgery. The medical records of all patients were well documented and carefully reviewed. The Shapiro–Wilk test was utilized to compare the normal distribution for continuous variables, and the nonnormally distributed data were used for Friedmann's one‐way repeat measures analysis of variances. Post hoc Dunnett's test was used to compare each pair of data to find differences from baseline.
Results
Compare with T0 point, the levels of CRP and ESR increased significantly and reached peak values at T1 point (all P < 0.001), with median values of 56.40 mg/L (range, 5.54–161.0 mg/L) and 49.00 mm/h (range, 13.00–113.0 mm/h), respectively. In addition, the levels of plasma fibrinogen and D‐Dimer increased significantly and reached peak values at T1 point (all P < 0.001), with median values of 4.13g/L (range, 2.27–6.80 mg/L) and 4.00 mg/L (range, 0.19–14.01 mg/L), respectively. CRP and ESR rapidly declined at the T2 point with significantly compared with T0 point (P = 0.001 and P < 0.001). The levels of CRP, ESR, plasma fibrinogen and D‐Dimer returned to preoperative levels of 5.23 mg/L (range, 1.01–21.70 mg/L), 19.00 mm/h (range, 6.00–60.00 mm/h), 3.38g/L (range, 1.71–5.10 g/L) and 2.33 mm/h (range, 0.19–6.87 mg/L) at T4 point, and there was no significant difference compared with T0 point (all P > 0.05).
Conclusions
The study demonstrated the normal trajectory of CRP, ESR, plasma fibrinogen and D‐Dimer at five time points in patients who underwent two‐stage exchange for PJI. Thus, the results have the possibility of providing signs of infection after the patient receives two‐stage exchange arthroplasty for PJI, which can benefit from early treatment.
Keywords: C‐reactive protein, D‐Dimer, Erythrocyte sedimentation rate, Plasma fibrinogen, Prosthetic joint infection, Total joint arthroplasty
A flow chart was shown for the included studies. Abbreviations: PJI: periprosthetic joint infection; THA, total hip arthroplasty; TKA, total knee arthroplasty.

Introduction
Prosthetic joint infection (PJI) is one of the most serious complications after total joint arthroplasty (TJA). 1 It was reported to account for 25% of total knee arthroplasty (TKA) failures and 15% of total hip arthroplasty (THA) failures. 2 , 3 PJI treatment is generally limited to three strategies, including irrigation and debridement, 4 one‐stage exchange arthroplasty, 5 and two‐stage exchange arthroplasty with subsequent reimplantation. 6
Currently, many orthopaedic surgeons have adopted two‐stage exchange arthroplasty as the standard for patients with chronic TJA infection, although there are some studies supporting that one‐stage exchange is a reasonable option for the management of acute postoperative infections. 7 , 8 However, the two‐stage exchange of PJI still continues to face the challenge of reinfection. The main reasons may be as follows: (i) it is related to the internal factors that reduce the immune capacity of patients, such as immunosuppression, diabetes, nephropathy and malnutrition; 9 , 10 and (ii) the generation of antibiotic‐resistant microorganisms may lead to a high failure rate. 11 Therefore, as previously reported, the risk of reinfection of the two‐stage exchange for PJI is still as high as 19%. 12
It is difficult to diagnose infection in advance after TJA because there are no optimal tests to show persistent infection. 13 , 14 , 15 , 16 Clinically, serologic tests of C‐reactive protein (CRP) and erythrocyte sedimentation rate (ESR) are used as first‐line strategies for the diagnosis of PJI. 13 , 14 However, CRP and ESR could be normal in patients with PJI who are infected by slow‐growing organisms such as Propionibacterium acnes. 15 Most importantly, the levels of these two serum markers remain elevated for a long time after arthroplasty, making them less valuable for the early diagnosis of PJI. 16 Plasma fibrinogen and serum D‐Dimer, which are widely available biomarkers known for their diagnostic utility in thromboembolic events, 17 can also result in fibrinolytic activity due to systemic and local infections. 18 Recent studies have focused on the diagnostic value of plasma fibrinogen and serum D‐Dimer for PJI and have also shown good sensitivity and specificity. 19 , 20 For example, in a prospective study consisting of 245 patients, Shahi et al. 19 confirmed that the median D‐Dimer level in patients with PJI was significantly higher than that in patients with aseptic failure and determined the optimal threshold for serum D‐Dimer diagnosis of PJI by using the Youden index to be 850 ng/mL. In another multicenter retrospective study of 565 patients undergoing revision total hip and knee arthroplasty, Li et al. 20 found that the under the curve (AUC) of plasma fibrinogen was higher than the two classic indicators, CRP level and ESR, exhibiting promising performance for diagnosing PJI. Therefore, these findings provide a new possible method for the diagnosis of PJI. 17 , 18 , 19 , 20 Unfortunately, until now, little has been known about the normal curve of inflammatory markers after surgery; therefore, exploring the trajectory of CRP, ESR, plasma fibrinogen and D‐Dimer biomarkers at different time points after two‐stage exchange arthroplasty for PJI will be useful for the diagnosis of PJI.
In this study, we conducted a retrospective study in 53 patients treated after two‐stage exchange for PJI at the following time points: preoperative, duration of hospital stays, 30 days, 30–90 days, and 90–180 days after surgery. The purpose of this study was to investigate the following: (i) what is the normal trajectory of CRP and ESR at different time points?; and (ii) what is the normal trajectory of plasma fibrinogen and D‐Dimer at different time points? In this study, we hope to obtain the normal trajectory of these inflammatory markers, providing potential clinical application value for inflammatory markers after two‐stage exchange for PJI.
Materials and Methods
Inclusion and Exclusion Criteria
The single‐center, retrospective study was approved by the Institutional Review Board of West China Hospital, Sichuan University (No: 201302007). From January 2011 to January 2021, we retrospectively identified a database of patients who underwent two‐stage exchange for PJI. The inclusion criteria were as follows: (i) patients with PJI for two‐stage exchange of THA; (ii) patients with PJI for two‐stage exchange of TKA; (iii) patients diagnosed with PJI by the Musculoskeletal Infection Society criteria21, 22 and (iv) adult patients (≥18 years of age). The exclusion criteria were as follows: (i) patients with incomplete clinical data; (ii) patients with immune diseases that affect serum inflammatory factors; (iii) patients with a history of cancer; and (iv) patients who had been taking steroids for 6 months before surgery.
Surgical Strategy and Perioperative Management
All patients were treated strictly with current revision techniques for PJI. Generally, in the one‐stage exchange arthroplasty of PJI, the surgeon collects synovial fluid for aerobic and anaerobic culture. In addition, two or more periprosthetic tissues were selected for biopsy in each patient. Subsequently, all foreign materials and inflammatory tissue were completely removed, osteomyelitis bone was removed if necessary, and repeated rinsing with normal saline was performed. For reimplantation surgery, the choice of temporary implants is based on the principles of bone mass and defect size, as well as the use of specific antibiotic bone cement. All patients with one‐stage exchange arthroplasty underwent at least 6 weeks of tailored intravenous or oral antibiotic therapy. Then, CRP and ESR trends were monitored periodically to determine the timing for two‐stage exchange arthroplasty. In the two‐stage exchange arthroplasty, the temporary prosthesis was removed, and the surgeon collected at least three tissue samples for microbial culture and then completely removed the surrounding tissue. Finally, the revision THA and TKA implants were chosen according to the degree of bone defect. All patients received general anesthesia and were given low‐molecular‐weight heparin, rivaroxaban, and ankle‐foot pump exercises to prevent deep vein thrombosis. Perioperative pain management in all patients was performed with nonsteroidal anti‐inflammatory drugs, analgesic rods, or opioids according to the patient's individual strategy.
Medical Data Collection
The medical records of all patients with two‐stage exchange arthroplasty, including age, sex, body mass index (BMI), type of joint, American Society of Anesthesiologists (ASA) class, type of joint comorbidities, laboratory test results and length of stay, are well documented and carefully reviewed. Venous blood samples of fasting patients were collected by nurses, and the blood samples were tested in our hospital. Based on the retrospective analysis of medical database data, we divided the collection and testing of blood samples into five time points, including preoperative, duration of hospital stays, 30 days after surgery, 30–90 days after surgery, and 90–180 days after surgery, which were defined as T0, T1, T2, T3 and T4, respectively. Indicators of blood sample testing for CRP, ESR, plasma fibrinogen and D‐Dimer were collected and analyzed.
Statistical Analysis
The Statistical Package for Social Science (SPSS)software, version 22.0, for Windows (SPSS Inc., Chicago, IL, USA) was used for statistical analysis. Categorical variables are expressed as frequencies and percentages. The values of CRP, ESR, plasma fibrinogen and D‐Dimer are presented as scatter plots with 95% confidential intervals (CIs) as error bars using GraphPad Prism software, version 8.0, for Windows (GraphPad Software, Inc., San Diego, CA, USA).The Shapiro–Wilk test was first used to test the normal distribution for continuous variables, and the nonnormally distributed data were used for Friedmann's one‐way repeat measures analysis of variances. Post hoc Dunnett's test was used to compare each pair of data to find differences from baseline.
Results
A total of 126 patients were treated with two‐stage exchange arthroplasty for PJI. Fifty‐two patients who did have incomplete clinical data were excluded. In addition, 11 had autoimmune disease, two had cancer, and eight had a history of steroid use in the 6 months prior to surgery. Therefore, 53 patients were included in the study. The average age was 62.32 ± 10.32 years, BMI was 24.90 ± 3.37 kg/m2, preoperative hemoglobin was 133.1 ± 14.54 g/L, preoperative hematocrit was 0.39 ± 0.05 L/L, the ASA score was 2.24 ± 0.55, and the average length of stay was 15.53 ± 8.65 days. There were 30 females (56.6%) and 23 males (43.4%). There were 40 patients (75.5%) who underwent two‐stage THA and 13 patients (24.5%) who underwent TKA. The baseline characteristics of the included patients were summarized in Table 1.
TABLE 1.
Characteristics of the included patients
| Variable | Total (n = 53) |
|---|---|
| Age a (years) | 62.32 ± 10.32 |
| Sex | |
| Female b (n) | 30 (56.6%) |
| Male b (n) | 23 (43.4%) |
| BMI a (kg/m2) | 24.90 ± 3.37 |
| Type of joint | |
| Hip b (n) | 40 (75.5%) |
| Knee b (n) | 13 (24.5%) |
| Preoperative hemoglobin a (g/L) | 133.10 ± 14.54 |
| Preoperative hematocrit a (L/L) | 0.39 ± 0.05 |
| ASA a class (scores) | 2.24 ± 0.55 |
| Comorbidities | |
| Cerebrovascular diseases b (n) | 2 (3.8%) |
| Compensatory stage of renal function b (n) | 1 (1.9%) |
| Hypertension b (n) | 17 (32.1%) |
| Type 2 Diabetes b (n) | 8 (15.1%) |
| Length of stay a (days) | 15.53 ± 8.65 |
Abbreviation: ASA, American Society of Anesthesiologists; BMI, body mass index; min, minutes; n, number; y, years.
Notes: The values are given as the mean and standard deviation.
The values are given as the number of patients with the percentage
Trajectory of CRP and ESR in TJA
At the T0 point, the median levels of CRP and ESR in TJA were 4.12 mg/L (range, 1.00–19.80 mg/L) and 21.00 mm/h (range, 2.00–93.00 mm/h), respectively. At T1, the levels of CRP and ESR increased significantly and reached peak values, with median values of 56.40 mg/L (range, 5.54–161.0 mg/L) and 49.00 mm/h (range, 13.00–113.0 mm/h), respectively. At the T2 point, the levels of CRP and ESR rapidly declined, with median values of 12.80 mg/L (range, 2.21–77.70 mg/L) and 38.00 mm/h (range, 5.00–101.0 mm/h), respectively. At the T3 point, there was a further decline in CRP and ESR, with median levels of 7.42 mg/L (range, 1.00–49.30 mg/L) and 32.00 mm/h (range, 8.00–84.00 mm/h), respectively. AtT4, the levels of CRP and ESR returned to preoperative levels of 5.23 mg/L (range, 1.01–21.70 mg/L) and 19.00 mm/h (range, 6.00–60.00 mm/h), respectively. In addition, the CRP and ESR values at the T3 and T4 points were not significantly different from those before surgery (Fig. 1 and Table 2).
Fig. 1.
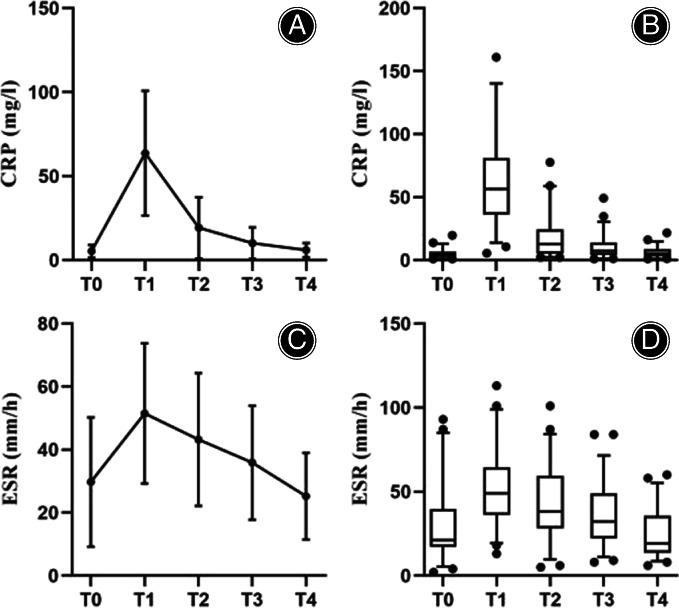
Analyses of the trajectory of CRP (A, B) and ESR (C, D) at different time points. Abbreviations: CRP: C‐reactive protein; ESR: erythrocyte sedimentation rate; T0: preoperative; T1: duration of hospital stays; T2: 30 days after surgery; T3: 30–90 days after surgery; T4: 90–180 days after surgery. The transverse lines represent the median, the bars represent the first to four quantiles, the whiskers represent ranges, and the dots represent outliers
TABLE 2.
Trajectory of CRP and ESR in two‐stage exchange for PJI of TJA
| Variable | Time | Mean ± SD | 95% CI | Median | Range | Multiple comparisons with T0 a |
|---|---|---|---|---|---|---|
| CRP (mg/L) | T0 | 5.39 ± 3.85 | 4.33–6.52 | 4.12 | 1.00–19.80 | ‐ |
| T1 | 63.73 ± 37.11 | 53.50–73.96 | 56.40 | 5.54–161.0 | <0.001 | |
| T2 | 19.26 ± 18.20 | 14.25–24.28 | 12.80 | 2.21–77.70 | 0.001 | |
| T3 | 10.20 ± 9.40 | 7.61–12.79 | 7.42 | 1.00–49.30 | 0.582 | |
| T4 | 6.01 ± 4.14 | 4.87–7.15 | 5.23 | 1.01–21.70 | 0.999 | |
| ESR (mm/h) | T0 | 29.74 ± 20.52 | 24.08–35.39 | 21.00 | 2.00–93.00 | ‐ |
| T1 | 51.49 ± 22.26 | 45.36–57.63 | 49.00 | 13.00–113.0 | <0.001 | |
| T2 | 43.23 ± 21.09 | 37.41–49.04 | 38.00 | 5.00–101.0 | 0.002 | |
| T3 | 35.87 ± 18.11 | 30.88–40.86 | 32.00 | 8.00–84.00 | 0.346 | |
| T4 | 25.25 ± 13.75 | 21.45–29.04 | 19.00 | 6.00–60.00 | 0.641 |
Abbreviation: CI, confidential interval; CRP, C‐reactive protein; ESR, Erythrocyte sedimentation rate; PJI, periprosthetic joint infection; SD, standard deviation; T0, preoperative; T1, duration of hospital stays; T2, 30 days after surgery; T3, 30–90 days after surgery; T4, 90–180 days after surgery; TJA, total joint arthroplasty.
Note: The values were used the post hoc Dunnett's test.
Trajectory of Plasma Fibrinogen and D‐Dimer in TJA
At the T0 point, the median levels of plasma fibrinogen and D‐Dimer in TJA were 3.09 g/L (range, 1.16–4.95 g/L) and 2.04 mg/L (range, 0.38–6.15 g/L), respectively. At the T1 point, the levels of plasma fibrinogen and D‐Dimer increased significantly and reached peak values, with median values of 4.13 g/L (range, 2.27–6.80 mg/L) and 4.00 mg/L (range, 0.19–14.01 mg/L), respectively. At the T4 point, the levels of plasma fibrinogen and D‐Dimer returned to preoperative levels of 3.38 g/L (range, 1.71–5.10 g/L) and 2.33 mm/h (range, 0.19–6.87 mg/L), respectively, which were not significantly different from those before surgery (Fig. 2 and Table 3).
Fig. 2.
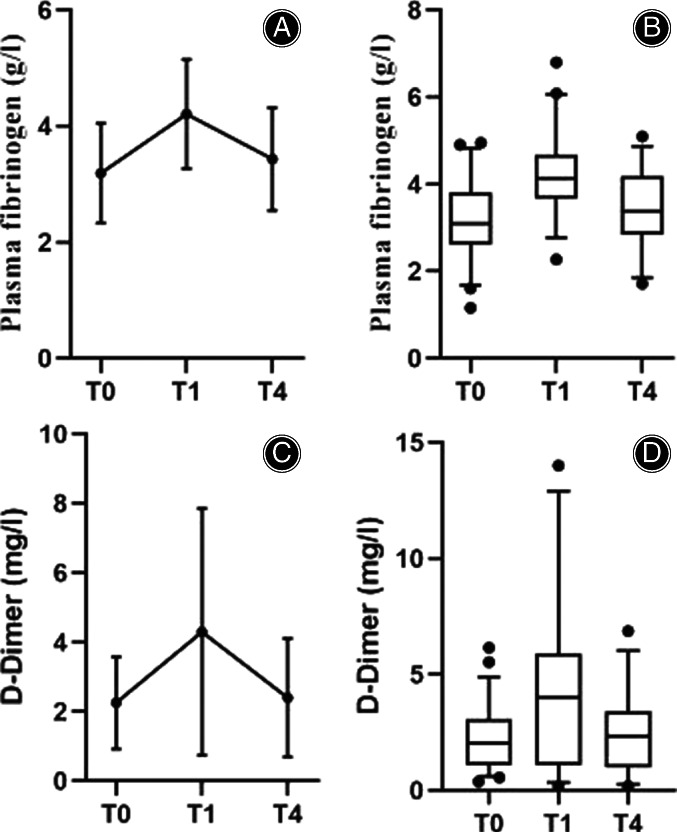
Analyses of the trajectory of plasma fibrinogen (A, B) and D‐Dimer (C, D) at different time points. Abbreviations: T0: preoperative; T1: duration of hospital stays; T4: 90–180 days after surgery. The transverse lines represent the median, the bars represent the first to four quantiles, the whiskers represent ranges, and the dots represent outliers
TABLE 3.
Trajectory of plasma fibrinogen and D‐Dimer in two‐stage exchange for PJI of TJA
| Variable | Time | Mean ± SD | 95% CI | Median | Range | Multiple comparisons with T0 a |
|---|---|---|---|---|---|---|
| Plasma fibrinogen (g/L) | T0 | 3.19 ± 0.86 | 2.95–3.43 | 3.09 | 1.16–4.95 | ‐ |
| T1 | 4.21 ± 0.94 | 3.91–4.51 | 4.13 | 2.27–6.80 | <0.001 | |
| T4 | 3.43 ± 0.89 | 3.14–3.72 | 3.38 | 1.71–5.10 | 0.380 | |
| D‐Dimer (mg/L) | T0 | 2.25 ± 1.33 | 1.88–2.62 | 2.04 | 0.38–6.15 | ‐ |
| T1 | 4.30 ± 3.56 | 3.11–5.48 | 4.00 | 0.19–14.01 | <0.001 | |
| T4 | 2.40 ± 1.71 | 1.77–3.02 | 2.33 | 0.19–6.87 | 0.989 |
Abbreviation: CI, confidential interval; PJI, periprosthetic joint infection; SD, standard deviation; T0, preoperative; T1, duration of hospital stays; T4, 90–180 days after surgery; TJA, total joint arthroplasty.
Note: The values were used the post hoc Dunnett's test.
Subgroup Analysis of Surgical Types
Subgroup analysis was performed by type of surgery: 40 patients in the revision group of THA and 13 patients in the revision group of TKA. Compared with T0, the CRP level at T2 in THA was significantly (P = 0.008) higher than that at TKA (Table 4), and the plasma fibrinogen (P = 0.008) and D‐Dimer (P = 0.006) levels at T1 in THA were significantly higher than those at TKA (Table 5). There was no difference in CRP, ESR, plasma fibrinogen or D‐Dimer at other time points.
TABLE 4.
Trajectory of CRP and ESR in two‐stage exchange of THA and TKA in subgroups
| Variable | Time | Mean ± SD | 95% CI | Median | Range | Multiple comparisons with T0 a |
|---|---|---|---|---|---|---|
| CRP (mg/L)‐THA | T0 | 5.37 ± 4.07 | 4.07–6.67 | 4.06 | 1.14–19.80 | ‐ |
| T1 | 65.95 ± 36.57 | 54.25–77.64 | 57.00 | 5.54–161.0 | <0.001 | |
| T2 | 19.14 ± 18.63 | 13.18–25.10 | 12.64 | 2.24–77.70 | 0.008 | |
| T3 | 10.53 ± 10.17 | 7.27–13.78 | 7.33 | 1.19–49.30 | 0.648 | |
| T4 | 5.778 ± 4.48 | 4.35–7.21 | 4.50 | 1.17–21.70 | 0.999 | |
| CRP (mg/L)‐TKA | T0 | 5.457 ± 3.214 | 3.52–7.40 | 5.35 | 1.00–11.20 | ‐ |
| T1 | 56.91 ± 39.42 | 33.09–80.73 | 36.70 | 10.70–140.0 | <0.001 | |
| T2 | 19.65 ± 17.55 | 9.04–30.25 | 18.30 | 2.21–58.90 | 0.213 | |
| T3 | 9.217 ± 6.73 | 5.15–13.28 | 7.90 | 1.00–23.60 | 0.982 | |
| T4 | 6.71 ± 2.91 | 4.95–8.48 | 5.85 | 1.01–11.70 | 0.999 | |
| ESR (mm/h) ‐THA | T0 | 32.02 ± 31.18 | 22.18–41.87 | 22.00 | 2.00–187.0 | ‐ |
| T1 | 50.66 ± 22.83 | 43.45–57.86 | 47.00 | 13.00–113.0 | <0.001 | |
| T2 | 41.93 ± 20.84 | 35.35–48.51 | 37.00 | 5.00–101.0 | 0.155 | |
| T3 | 34.05 ± 18.77 | 28.12–39.97 | 29.00 | 8.00–84.00 | 0.993 | |
| T4 | 24.05 ± 13.60 | 19.76–28.34 | 19.00 | 6.00–58.00 | 0.332 | |
| ESR (mm/h) ‐TKA | T0 | 30.25 ± 19.62 | 17.78–42.72 | 20.00 | 14.00–84.00 | ‐ |
| T1 | 54.33 ± 20.86 | 41.08–67.58 | 52.00 | 21.00–85.00 | 0.010 | |
| T2 | 47.67 ± 22.24 | 33.54–61.80 | 45.00 | 11.00–83.00 | 0.093 | |
| T3 | 42.08 ± 14.66 | 32.77–51.40 | 42.00 | 21.00–4.00 | 0.386 | |
| T4 | 29.33 ± 14.09 | 20.38–38.28 | 29.50 | 12.00–60.00 | 0.999 |
Abbreviation: CI, confidential interval; CRP, C‐reactive protein; ESR, Erythrocyte sedimentation rate; SD, standard deviation; T0, preoperative; T1, duration of hospital stays; T2, 30 days after surgery; T3, 30–90 days after surgery; T4, 90–180 days after surgery; THA, total hip arthroplasty; TKA, total knee arthroplasty.
Note: The values were used the post hoc Dunnett's test.
TABLE 5.
Trajectory of plasma fibrinogen and D‐Dimer in two‐stage exchange of THA and TKA in subgroups
| Variable | Time | Mean ± SD | 95% CI | Median | Range | Multiple comparisons with T0 a |
|---|---|---|---|---|---|---|
| Plasma fibrinogen (g/L)‐THA | T0 | 3.46 ± 1.76 | 2.90–4.02 | 3.15 | 1.16–12.90 | ‐ |
| T1 | 4.33 ± 0.93 | 3.99–4.67 | 4.16 | 2.77–6.80 | 0.008 | |
| T4 | 3.60 ± 0.88 | 3.25–3.95 | 3.68 | 1.71–5.10 | 0.943 | |
| Plasma fibrinogen (g/L)‐TKA | T0 | 3.04 ± 0.86 | 2.56–3.56 | 2.96 | 1.70–4.79 | ‐ |
| T1 | 3.78 ± 0.88 | 3.11–4.46 | 4.08 | 2.27–5.23 | 0.109 | |
| T4 | 3.02 ± 0.79 | 2.49–3.56 | 3.01 | 1.86–4.85 | 0.999 | |
| D‐Dimer(mg/L)‐THA | T0 | 2.06 ± 1.34 | 1.63–2.48 | 1.74 | 0.38–6.15 | ‐ |
| T1 | 3.65 ± 3.07 | 2.46–4.84 | 3.55 | 0.19–12.79 | 0.006 | |
| T4 | 2.40 ± 1.79 | 1.65–3.16 | 2.26 | 0.19–6.87 | 0.869 | |
| D‐Dimer (mg/L)‐TKA | T0 | 2.85 ± 1.17 | 2.14–3.56 | 3.09 | 1.05–4.42 | ‐ |
| T1 | 6.29 ± 4.40 | 2.90–9.67 | 5.50 | 1.05–14.01 | 0.074 | |
| T4 | 2.38 ± 1.53 | 0.97–3.80 | 2.67 | 0.72–5.06 | 0.986 |
Abbreviations: CI, confidential interval; SD, standard deviation; T0, preoperative; T1, duration of hospital stays; T4, 90–180 days after surgery; THA, total hip arthroplasty; TKA, total knee arthroplasty.
Note: The values were used the post hoc Dunnett's test.
Discussion
In this single‐center, retrospective study, we investigated the normal trajectory of CRP, ESR plasma fibrinogen and D‐Dimer at different time points after two‐stage exchange for PJI. The most important finding of this study was that CRP and ESR reached peak median values at the duration of hospital stay, rapidly declined at 30 days after surgery and returned to preoperative levels at 90–180 days after surgery. Similarly, plasma fibrinogen and D‐Dimer also reached peak median values at the duration of hospital stay and returned to preoperative values at 90–180 days after surgery. Based on the above results, we obtained the normal trajectories of these inflammatory markers, providing potential clinical application value for patients with early infection after two‐stage PJI exchange for PJI.
Purpose in this Study
PJI, also known as periprosthetic joint infection, can damage the prosthesis and the surrounding bone and soft tissue structure, thus significantly increasing the medical cost of patients and even causing death. 1 , 2 , 3 To standardize the definition of PJI, MSIS successively formulated the major and minor criteria for the diagnosis of PJI, which include culture of prosthetic peripheral joint fluid, laboratory testing, histological testing, and sinus access into the joint cavity. 21 , 22 As previously reported, most orthopedic surgeons typically administer PJI with two‐stage exchange arthroplasty due to its success in eradicating infection and its strong association with postoperative survival. 1 , 3 Unfortunately, the rate of recurrent infection is still high in two‐stage exchange arthroplasty, and patients still suffer from the risk of reoperation. 2 , 3 Therefore, it is still crucial to diagnose PJI as early as possible in two‐stage exchange arthroplasty. Clinically, CRP and ESR, as first‐line biomarkers of inflammation recommended by MSIS, are often generally simple serological tests for the diagnosis of PJI. 13 , 14 Although CRP and ESR have a useful role in assessing postoperative inflammation, previous studies have also demonstrated that they can remain at high levels for long periods of time even in the absence of infection due to trauma, and its low specificity in the diagnosis of PJI is a disadvantage. 23 Plasma fibrinogen and D‐Dimer, as coagulation‐related indicators activated by local or systemic infection, are expected to be new diagnostic methods for PJI with good sensitivity and specificity. 19 , 20 Until now, little has been known about its normal trajectory during two‐stage exchange arthroplasty at various points in time after surgery. Therefore, we conducted a retrospective study to investigate the normal trajectories of four biomarkers, aiming to explore how CRP, ESR, plasma fibrinogen and D‐Dimer coexist as biomarkers and rise and return to normal trajectories before surgery.
The Normal Trajectory of CRP and ESR in this Study
Although several studies have established trends in CRP and ESR after TKA and THA, there is a lack of data dealing with two‐stage exchange arthroplasty for PJI. 24 , 25 , 26 Battistelli et al. 24 investigated the dynamics of CRP in 51 patients with primary THA and found that CRP levels increased significantly at 3 days after surgery and then slowly decreased to approach baseline values 2 weeks after surgery. Maniar et al. 25 studied the normal trajectory of CRP after uncomplicated TKA in 50 patients, and the investigators showed that the CRP peaked 48 h after surgery, remained at high levels 4 days after surgery, and further confirmed that it remained higher than baseline 2 weeks after surgery. In a study involving 320 patients treated with primary TKA, Park et al. 26 also demonstrated a rapid increase in mean CRP and ESR levels, with CRP peaking at 48 h, returning to preoperative levels at 90 days after surgery, while ESR peaked at 5 days after surgery and returned to near preoperative levels at 90 days after surgery. Our results showed that the average length of stay was 15.53 days (approximately 2 weeks), and we found that postoperative levels of CRP and ESR were at the peak of the entire postoperative course but remained higher than preoperative baseline within 30 days. It then gradually decreased at 30–90 days after surgery and reached baseline values after a further decline at 90–180 days after surgery. We found that the results were similar to those of previous studies.
The Normal Trajectory of Plasma Fibrinogen and D‐Dimer in this Study
Plasma fibrinogen and D‐Dimer, as coagulation‐related indicators, have also been used in many recent studies on the diagnostic value of PJI. Pieters et al. 27 observed that inflammation can upregulate fibrinogen secretion, confirming that fibrinogen disorders can not only increase bleeding and thrombosis but also increase the risk of infection. Xu et al. 28 also confirmed in 439 patients who underwent revision arthroplasty that plasma fibrinogen showed good value in diagnosing PJI before revision arthroplasty, which is close to the value of traditional inflammation markers. Lee et al. 29 reported the natural course of D‐Dimer by measuring it on the day before surgery, on postoperative days 1, 2, 3, and 5 and at weeks 2 and 6 in 65 patients with primary TJA. They observed a rapid rise in D‐Dimer levels at day 1 after surgery and a decrease to baseline levels at day 2 after surgery. However, it slowly rose again approximately 2 weeks after surgery, thus reaching a second peak. In a prospective study enrolling 81 patients undergoing primary TJA, Azboy et al. 30 also found that the D‐Dimer level reached its peak on day 1 after surgery and quickly dropped to the baseline level on day 3 after surgery. Meanwhile, the second D‐Dimer peak appeared on day 15 after surgery. As a newly reported marker of diagnostic PJI, our findings also found that plasma fibrinogen and D‐Dimer peaked within 2 weeks after surgery and then gradually decreased and were at baseline similarly within 90–180 days after surgery.
Limitations and Strengths
The study has several limitations. First, this was a retrospective study. Although most cases in patients are well documented, there may still be inaccurate information recorded in medical databases and missing data from clinical blood tests. A secondary limitation may be related to the fact that the relatively small number of patients in this study may have affected the statistical analysis. For example, subgroup analysis of revision THA and TKA with different surgical types was performed, and we found that revision knee infections were relatively rare, making this study prone to type II errors and may not be sufficient to determine a PJI diagnostic threshold for TKA. Therefore, a multicenter, large‐scale study is needed to further confirm these results in the future, especially in two‐stage exchange arthroplasty of the TKA. Third, demographic factors such as age, sex, BMI and comorbidities were not qualitatively controlled. However, patients with diseases that may affect inflammation or coagulation‐related indicators, such as autoimmune diseases, a history of cancer and long‐term steroid use, were excluded from this study, which could potentially reduce risk bias from different factors. Last, all our patients were followed up for 180 days without complications, and the values of CRP, ESR, plasma fibrinogen and D‐Dimer were reported within 180 days, so we cannot evaluate the long‐term diagnostic value of these tests against infection. Additionally, the optimal threshold for the receiver operating characteristic curve in the diagnosis of infection has not been reported. However, it is reasonable for us to believe that these four indicators serve as simple and convenient clinical tests for infection. If their levels are elevated, they may be indicative of early infection and provide strategies for later treatment.
There are some strengths to the current study. First, this was the first study, to the best of our knowledge, that investigated the normal trajectory of CRP, ESR plasma fibrinogen and D‐Dimer at different time points after two‐stage exchange for PJI. Second, the study also found that the levels of CRP, ESR, fibrinogen, and D‐Dimer were influenced by demographic variables, such as the type of surgery. Our subgroup analysis study noted that the level of CRP was significantly different in THA than in TKA revision within 30 days after surgery compared to preoperative values. Additionally, plasma fibrinogen and D‐Dimer levels in patients with THA and TKA revision were also significantly different on the day of surgery and the length of stay compared to preoperative levels. However, the overall trajectory was consistent with previous results, 24 , 25 , 26 , 27 , 28 , 29 , 30 indicating elevated baseline CRP, ESR, fibrinogen, and D‐Dimer levels in patients after surgery. The main cause for this difference may be the small sample size, especially the two‐phase exchange arthroplasty of TKA. Third, although this is a single‐center retrospective study, we still obtained normal trajectories of these inflammatory markers, which has potential clinical application for early infection after two‐stage exchange for PJI.
Conclusions
Our study demonstrated the normal trajectories of CRP, ESR, plasma fibrinogen and D‐Dimer during two‐stage exchange arthroplasty for PJI at different points after surgery. However, we cannot clearly define their value in the diagnosis of PJI by considering these limitations, especially the sample size of the TKA revision. The study of the normal trajectories of these four biomarkers may also provide useful strategies for orthopedic surgeons. Because this change in the normal trajectory has the possibility to provide signs of infection after the patient receives two‐stage exchange arthroplasty, the patient can benefit from early treatment. A multicenter, large sample size study is needed to further confirm this conclusion in the future.
Authors Contributions
Bin Shen and Yuangang Wu conceived and performed the experiments. Jinhan Zhou, Ran Liu, Yi Zeng and Kaibo Sun contributed to data acquisition. Mingyang Li, Linbo Peng and Jiawen Xu analyzed and interpreted the data. Bin Shen, Yuangang Wu and Jinhan Zhou revised the manuscript. All authors read and approved the final manuscript.
Acknowledgments
We thank Sisi Wu and Jinkui Pi from the Core Facilities of West China Hospital, Sichuan University for technical assistance in data analysis. This study was funded by the China Postdoctoral Science Foundation (No. 2021M702351), Post‐Doctor Research Project, West China Hospital, Sichuan University (No. 2020HXBH081), Medical Science and Technology Project of Health Commission of Sichuan Provincial (No. 21PJ040) and Sichuan University Postdoctoral Interdisciplinary Innovation Fund.
References
- 1. Pulido L, Ghanem E, Joshi A, Purtill JJ, Parvizi J. Periprosthetic joint infection: the incidence, timing, and predisposing factors. Clin Orthop Relat Res. 2008;466:1710–5. [DOI] [PMC free article] [PubMed] [Google Scholar]
- 2. Bozic KJ, Kurtz SM, et al. The epidemiology of revision total knee arthroplasty in the United States. Clin Orthop Relat Res. 2010;468:45–51. [DOI] [PMC free article] [PubMed] [Google Scholar]
- 3. Bozic KJ, Kurtz SM, Lau E, Ong K, Vail TP, Berry DJ. The epidemiology of revision total hip arthroplasty in the United States. J Bone Jt Surg. 2009;91:128–33. [DOI] [PubMed] [Google Scholar]
- 4. Vahedi H, Aali‐Rezaie A, Shahi A, Conway JD. Irrigation, débridement, and implant retention for recurrence of periprosthetic joint infection following two‐stage revision total knee arthroplasty: a matched cohort study. J Arthroplasty. 2019;34:1772–5. [DOI] [PubMed] [Google Scholar]
- 5. van den Kieboom J, Tirumala V, Box H, Oganesyan R, Klemt C, Kwon YM. One‐stage revision is as effective as two‐stage revision for chronic culture‐negative periprosthetic joint infection after total hip and knee arthroplasty. Bone Joint J. 2021;103:515–21. [DOI] [PubMed] [Google Scholar]
- 6. Khan N, Parmar D, Ibrahim MS, Kayani B, Haddad FS. Outcomes of repeat two‐stage exchange hip arthroplasty for prosthetic joint infection. Bone Joint J. 2019;101:110–5. [DOI] [PubMed] [Google Scholar]
- 7. Xu C, Tan TL, Chen JY. Positive culture during reimplantation increases the risk of reinfection in two‐stage exchange arthroplasty despite administrating prolonged antibiotics: a retrospective cohort study and meta‐analysis. J Arthroplasty. 2019;34:1025–31. [DOI] [PubMed] [Google Scholar]
- 8. Bedair H, Ting N, Bozic KJ, Della Valle CJ, Sporer SM. Treatment of early postoperative infections after THA: a decision analysis. Clin Orthop Relat Res. 2011;469(12):3477–85. [DOI] [PMC free article] [PubMed] [Google Scholar]
- 9. Sabry FY, Buller L, Ahmed S, Klika AK, Barsoum WK. Preoperative prediction of failure following two‐stage revision for knee prosthetic joint infections. J Arthroplasty. 2014;29:115–21. [DOI] [PubMed] [Google Scholar]
- 10. Dwyer MK, Damsgaard C, Wadibia J, et al. Laboratory tests for diagnosis of chronic periprosthetic joint infection can help predict outcomes of two‐stage exchange. J Bone Joint Surg. 2018;100:1009–15. [DOI] [PubMed] [Google Scholar]
- 11. Ludwick L, Chisari E, Wang J, Clarkson S, Collins L, Parvizi J. Emergence of antibiotic resistance across two‐stage revision for periprosthetic joint infection. J Arthroplasty. 2021;36(8):2946–50. [DOI] [PubMed] [Google Scholar]
- 12. Cochran AR, Ong KL, Lau E, Mont MA, Malkani AL. Risk of reinfection after treatment of infected total knee arthroplasty. J Arthroplasty. 2016;31:156–61. [DOI] [PubMed] [Google Scholar]
- 13. Gomez‐Urena EO, Tande AJ, Osmon DR, Berbari EF. Diagnosis of prosthetic joint infection: cultures, biomarkers and criteria. Infect Dis Clin North Am. 2017;31:219–35. [DOI] [PubMed] [Google Scholar]
- 14. Sconfienza LM, Signore A, Cassar‐Pullicino V, et al. Diagnosis of peripheral bone and prosthetic joint infections: overview of the consensus documents by the EANM, EBJIS, and ESR (with ESCMID endorsement). Eur Radiol. 2019;29:6425–38. [DOI] [PubMed] [Google Scholar]
- 15. Kanafani ZA, Sexton DJ, Pien BC, Varkey J, Basmania C, Kaye KS. Postoperative joint infections due to Propionibacterium species: a case–control study. Clin Infect Dis. 2009;49:1083–5. [DOI] [PubMed] [Google Scholar]
- 16. White J, Kelly M, Dunsmuir R. C‐reactive protein level after total hip and total knee replacement. J Bone Jt Surg. 1998;80:909–11. [DOI] [PubMed] [Google Scholar]
- 17. Moresco RN, Júnior RH, Cláudio Rosa Vargas L, da Rocha M, Silla L. Association between plasma levels of D‐dimer and fibrinogen/fibrin degradation products (FDPs) for exclusion of thromboembolic disorders. J Thromb Thrombolysis. 2006;21:199–202. [DOI] [PubMed] [Google Scholar]
- 18. Ackmann T, Möllenbeck B, Gosheger G, et al. Comparing the diagnostic value of serum D‐dimer to CRP and IL‐6 in the diagnosis of chronic prosthetic joint infection. J Clin Med. 2020;9:2917. [DOI] [PMC free article] [PubMed] [Google Scholar]
- 19. Shahi A, Kheir MM, Tarabichi M, Hosseinzadeh HRS, Tan TL, Parvizi J. Serum D‐dimer test is promising for the diagnosis of Periprosthetic joint infection and timing of Reimplantation. J Bone Joint Surg. 2017;99:1419–27. [DOI] [PubMed] [Google Scholar]
- 20. Li R, Shao HY, Hao LB, et al. Plasma fibrinogen exhibits better performance than plasma D‐dimer in the diagnosis of periprosthetic joint infection: a multicenter retrospective study. J Bone Joint Surg. 2019;101:613–9. [DOI] [PubMed] [Google Scholar]
- 21. Parvizi J, Zmistowski B, Berbari EF, et al. New definition for periprosthetic joint infection: from the workgroup of the musculoskeletal infection society. Clin Orthop Relat Res. 2011;469:2992–4. [DOI] [PMC free article] [PubMed] [Google Scholar]
- 22. Parvizi J, Tan TL, Goswami K, et al. The 2018 definition of periprosthetic hip and knee infection: an evidence‐based and validated criteria. J Arthroplasty. 2018;33:1309–1314.e2. [DOI] [PubMed] [Google Scholar]
- 23. Bauer TW, Parvizi J, Kobayashi N, Krebs V. Diagnosis of periprosthetic infection. J Bone Joint Surg. 2006;88:869–82. [DOI] [PubMed] [Google Scholar]
- 24. Battistelli S, Fortina M, Carta S, Guerranti R, Nobile F, Ferrata P. Serum C‐reactive protein and procalcitonin kinetics in patients undergoing elective total hip arthroplasty. Biomed Res Int. 2014;2014:565080. [DOI] [PMC free article] [PubMed] [Google Scholar]
- 25. Maniar RN, Navaneedhan G, Ranvir S, Maniar AR, Dhiman A, Agrawal A. What is the normal trajectory of Interleukin‐6 and C‐reactive protein in the hours and days immediately after TKA? Clin Orthop Relat Res. 2019;477(1):41–6. [DOI] [PMC free article] [PubMed] [Google Scholar]
- 26. Park KK, Kim TK, Chang CB, Yoon SW, Park KU. Normative temporal values of CRP and ESR in unilateral and staged bilateral TKA. Clin Orthop Relat Res. 2008;466:179–88. [DOI] [PMC free article] [PubMed] [Google Scholar]
- 27. Pieters M, Wolberg AS. Fibrinogen and fibrin: an illustrated review. Res Pract Thromb Haemost. 2019;3:161–72. [DOI] [PMC free article] [PubMed] [Google Scholar]
- 28. Xu H, Xie J, Yang J, Chen G, Huang Q, Pei F. Plasma fibrinogen and platelet count are referable tools for diagnosing periprosthetic joint infection: a single‐center retrospective cohort study. J Arthroplasty. 2020;35:1361–7. [DOI] [PubMed] [Google Scholar]
- 29. Lee YS, Lee YK, Han SB, Nam CH, Parvizi J, Koo KH. Natural progress of D‐dimer following total joint arthroplasty: a baseline for the diagnosis of the early postoperative infection. J Orthop Surg Res. 2018;13:36. [DOI] [PMC free article] [PubMed] [Google Scholar]
- 30. Azboy I, Çatal B, Başarır K, Mutlu M, Bilgen ÖF, Parvizi J. The natural course of serum D‐dimer, C‐reactive protein, and erythrocyte sedimentation rate levels after uneventful primary total joint arthroplasty. J Arthroplasty. 2021;36:3118–22. [DOI] [PubMed] [Google Scholar]