Abstract
Proactive security plays a vital role in preventing the attack before entering active mode. In the modern information environment, it depends on the vulnerability management practitioners of an organization in which the critical factor is the prioritization of threats. The existing models and methodology follow the traditional approaches of a Common Vulnerability Scoring System (CVSS) to prioritize threats and vulnerabilities. The CVSS is not able to provide effectiveness to the security of the business of an organization. In contrast, the vulnerability analysis needs a model which can give significance to the prioritization policies. The model depends on the CVSS score of threats and compares various features of vulnerability like threat vectors, inputs, environments used by threat agent’s groups, and potential outputs of threat agents. Therefore, the research aims to design a semi-automatic model for vulnerability analysis of threats for the National Institute of Standards and Technology (NIST) database of cyber-crime. We have developed a semi-automatic model that simulates the CVE (Common Vulnerabilities and Exposures) list of the NIST database between 1999 and 2021, concerning the resources used by the threat agents, pre-requisites input, attack vectors, and dormant results. The semi-automatic approach of the model to perform the vulnerability analysis of threat agent groups identified in a network makes the model more efficient and effective to addresses the profiling of threat agents and evaluating the CTI (Critical Threat intelligence feed). Our experimental results imply that the semi-automatic model implements the vulnerability prioritization based on the CVSS score and uses the comparative analysis based on the threat agent’s vectors identified. It also provides potency and optimized complexity to an organization’s business to mitigate the vulnerability identified in a network.
Keywords: NIST database, CVSS, Security management, Threat agent vectors, Vulnerability
Introduction
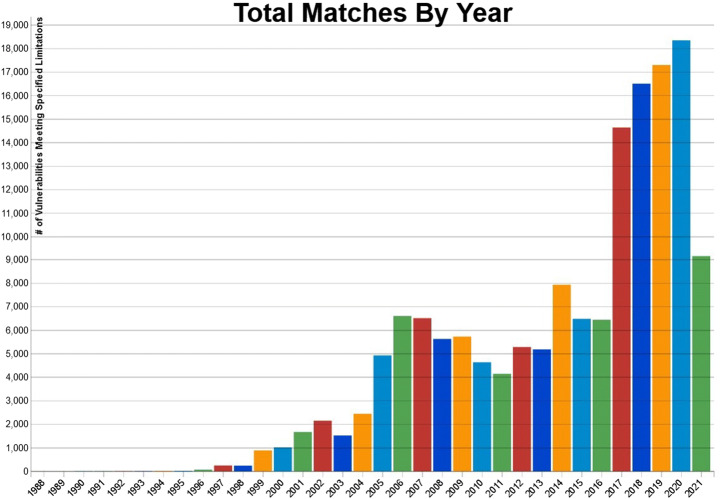
Analysis and implementation of vulnerabilities is a challenging snag faced by the organization and business of the society. However, in the modern information environment of the electronic era, there is an obvious need to design a semi-automatic model to analyze and implement the vulnerabilities of the NIST database. The risk management practitioners should develop the exposure implementations to provide security to their organization and business for the newly identified threats in situational awareness data collected in the future. In obedience to the national vulnerability database (NIST) [30], which is developed by the USA (United States of America) and maintains all acknowledged records of cybercrime and vulnerability registered with them by the various organization of the countries in the world. The vulnerability exploitation registered with the NIST database in 2020 is nearly 18,000, and approximately 50 CVE lists are being telerecording every day. It shows that attacking an organization is exponentially increasing every year [37]. Helsinki University press reported that each year nearly 43% increase in vulnerability registration from different sources of organizations in the world [17]. Since the reported vulnerability is very high in pattern, the organization of other countries is constantly facing threat agents’ snags in their environment. The various organizations spend lots of money on security practitioners to maintain their environment risk-free from the threat agents. Therefore, the National Infrastructure Advisory Council (NIAC) introduced the CVSS scoring system for vulnerability exploitation faced by various organizations. It can be proposed for drafting with NIST, which the security risk management team may use as a reference to address the new threat in an organization’s network. The research question for the “Analysis and Implementation of Semi-Automatic Model for Vulnerability Exploitations of Threat Agents in NIST Databases” is CTI (Cyber Threat Intelligence) data-driven threat agent profiling can be used for calculating the motivation and capabilities attributes of threat agents under the context of a continuous threat assessment. The research aims to introduce a novel approach that will enable us to take advantage of the vast amount of data collected by a large number of platforms designed to identify suspicious traffic, malicious intentions, and network attacks in an automated manner.
Cyber-crime and vulnerability exploitation exponentially increase every year, as seen in Fig. 1. Referencing the covid 19, the work from home trends are rising in most organizations. Due to this, essential files, documents, and meetings with clients or teams are going into an online mode with the help of applications or web browsers. Most of the work is accomplished via VPN (a virtual private network) connections, and work-related files share with clients and the other team members via VPN or online. Therefore, in 2020, the exploitation of vulnerability increases at a rate of 8.3%, which can be observed in histogram Fig. 1 [18].
Fig. 1.
Vulnerability exploitation of NIST database [15]
As the CVSS score is accepted widely by the vulnerability management tools but only with the CVSS score, we cannot effectively address vulnerability exploitation. To improve the prediction ability of risk management teams, they need more attributes about the vulnerability exploitations in detail [21]. Later they can use them as references to compare with characteristics and features of the newly identified threats in the network. To solve a problem, our research introduces a semi-automatic model for vulnerability analysis, which handles all the CVE lists of the vulnerability available in the database of NIST between the years 1999–2021. The semi-automatic model extracts all the information related to the CVE from the database based on the attributes shown in Tables 1 and 2 below.
Table 1.
Environments and attack vectors of threat agents
| Environments used by a threat agent to exploit the network | Attack vectors of threat agents |
|---|---|
| Windows 10. | Physical. |
| Windows 8. | Network. |
| Linux Kernel Version. | Adjacent. |
| MY SQL. | Local. |
| Post Gres. | |
| Apache. | |
| Apple (Xcode 1.5). | |
| Samba (2.18.13). |
Table 2.
Inputs and potential result of threat agents
| Pre-Requisites inputs of threat agents | Potential results of the threat agents |
|---|---|
| Credential. | Credential acquisitions. |
| Root privileges. | Privilege escalation. |
| Remote access. | Remote access. |
| Local access. | Denial of services. |
| Network access. | Run arbitrary commands. |
| Data access. | |
| Data manipulation. |
In the existing models and methodology for vulnerability exploitation analysis, there is no general solution for addressing the vulnerability exploitation of the CVE list of the NIST database. The need arises for all risk assessment management practitioners to provide a proper solution for vulnerability exploitation. All these models analyze the footprints of the threat agents and the approaches followed by the threat agent for exploiting the system’s vulnerability with the help of the vulnerability tools available. So, our work must provide a novel tincture to such a snag with optimized time complexity and effectiveness of the system. The existing model addresses vulnerability exploitation manually or uses traditional tools like NESSUS, Netsparker, OpenVAS, Arachni, NMAP, Acunetix, etc. Due to this, the time complexity of the system is very high [13]. To provide an effective solution for optimizing the time complexity, our model uses semi-automatic approaches to address the vulnerability list of the NIST database. The main contribution of this research work is as follows:
We are implementing a semi-automatic model for the analysis of vulnerability exploitation of the NIST database.
The traditional approaches to vulnerability prioritization depend on the CVSS score. In contrast, our work prioritizes the vulnerability with the help of the CVSS score. It includes the other attributes of threat agents like environment, attack vectors, Pre-requisites inputs, and potential outputs.
This work implements the groups of threat agents lists based on the vulnerability analysis achieved by the model between the years 1999–2021.
The rest of the manuscript is as follows. Section 2 presents the related work of the vulnerability analysis. Section 3 manifests the Implementation of Model and Evaluation of Vulnerability from the NIST database. Section 4 exhibit a discussion on the possible results of experiments. Finally, Section 5 concludes the paper and suggests future works.
Related work
A standard vulnerability scoring system (CVSS) is characterized based on numerous risk assessment models [5, 40], vendor-independent, and a universal scoring system that can in used for the quantitative measurement of the sternness of various software vulnerabilities [5]. The software vulnerabilities possess many risks, and CVSS neutralizes these effects depending upon the risk [15]. This vulnerability exploitation of software identification depends on several factors like the environment, the platform used by the threat agent’s groups, the number of inputs used to penetrate the network, the number of identified attack vectors of the threat agents, and the potential outputs of the threat agents. The scores in CVSS are premeditated based on three attributes and equations, namely Temporal, Environmental, and Base. The vulnerabilities alter over time, and the temporal attributes provide information about the same. The information environment of system owners of organizations, on the other hand, can provide circumstantial information on an environment, and this is delivered by Environmental attributes [15]. Unlike Temporal and Environmental attributes, the values and scores of base attributes are openly accessible in NVD and signify inherent vulnerability physiognomies [20].
CVSS has various weaknesses, and the Vulnerability Rating and Scoring System (VRSS), on the contrary, have a better assortment of scores [27, 32]. One of the many drawbacks of CVSS is that dissemination of base score is extremely bimodal, and numerous blends of attributes yield the matching concluding score. The accuracy of these calculated scores is also suspicious [3, 27]. Sometimes, the CVSS score found in the NIST database is not determined the same when risk management practitioners mapped with newly identified threat agents in the network. It might have happened because the environment and inputs used by the threat agents changed with time and the modernization in the informational settings. However, there is no indication that VRSS scores are further illustrative than CVSS scores [6].
Moreover, numerous categories of prejudice (bias) influence the data in vulnerability databases, which overpower detailed statistical investigation [31]. There are shreds of evidence in the literature that the CVSS base score, when tested unaided, is unsuitable for targeting vulnerability prioritization [10, 28]. Therefore, there is no likelihood of being vulnerability exploitation. This metric was not enough to elaborate on the information context in which risk management practitioners can deploy their approach to analyze the vulnerability. The probabilistic rate of attack or exploitation iteration is impossible to undaunted regarding conditions, or the environments used by the threat agent groups that may exist in the early stage of the design phase. It reckons on hypothesizing and theorizing, which does not help identify and incorporate appropriate security of mitigations. In [4], the authors claimed that using CVSS scores is practical as a random tactic. The cause of such assumptions is that many vulnerabilities that have high severity have not been exploited much [3].
Security experts in [3] articulated the requirement of temporal data. CVSS temporal data provides information that can avail oneself to make predictions about forthcoming exploitations in the black market [4]. Still unfortunately, this information is not available in NVD (National Vulnerability Database) [17]. The end users cannot find this information conveniently, as they exist in various forms and limited sizes on the vendor sites. In these above-stated circumstances, unconventional methods are indispensable to advance proactive security. It can be effectuated by predicting the vulnerable software components on the development side [4] or expecting how many vulnerabilities will be there in the future [24].
Moreover, the tricky part is the deployment, as it requires information on already existing vulnerabilities. The authors of CVSS try to advance its extensiveness by providing improved portrayals of vulnerabilities. Every new work of the CVSS standard has presented some chief additions and variations in the given set of attributes [12, 16]. However, many additional aspects sturdily influence the threat and are not counted with the prevailing methodologies. There is a human agent behind every attack with an incentive [23]. That is why we have presumed that considering the attacker’s characteristics in the vulnerability polarization may progress in the system security.
Implementation of model and evaluation of vulnerability
The model delineates collecting the DataStream or network traffic from the server’s name ESXi at the University of Hertfordshire in the cybersecurity laboratory. This data collection can be consummate with the help of several software tools available like SolarWinds Deep Packet Inspection and Analysis, Paessler Packet Capture, ManageEngine NetFlow Analyzer, Omnipeek Network Protocol Analyzer, Tcpdump, WinDump, Tshark, and Wireshark [7]. In this work, we have used the Wireshark tool to collect the data from the server. The impetus stipulates the Wireshark tool for collecting data because it provides the facility to save the collected data in a. CSV format file [26]. The uprooting of information about the vulnerability exploitation perpetrated by threat agents on the captured data from the little server utilitarian to be unsheathed from. CSV formatted files compared to the other tools available. To ascertain the vulnerability exploitation for the collected data from the server is achieved by several phases followed by the semi-automatic model.
Phase 1- Extraction of threat agent attributes from DataStream.
Phase 2- Extraction of threat agent source and destination IP address.
Phase 3- Extraction of CVE list based on source IP address of threat agent.
Phase 4- Implement the vulnerability analysis for the identified CVE list of threat agents.
Phase 5- Implement the vulnerability exploitation based on the CVE list of the NIST database.
In Fig. 2, the data collected from the server is uprooted based on the attributes like source IP address, destination IP address, protocols used, number of ports open, operating on which layer, and location of threat agents. When the model achieves identification of attributes, then concerning the characteristics identified for the threat agent groups, evaluation of the CVE list started with the help of various vulnerability scanning tools like NESSUS and OpenVAS, etc. Later, the cybersecurity practitioners mapped this CVE list with the NIST database and identified the vulnerable ports for the particular CVE number. These traditional approaches are followed by the existing models and methodology to address the vulnerability exploitation of the threat agents identified in their network [16]. Due to which, the complexity of vulnerability analysis is tremendously outrageous for the subsisting models. Our model provides the semi-automatic features for analysis of vulnerability exploitation for the identified threat in a network, which helps to revamp the system’s complexity.
Fig. 2.
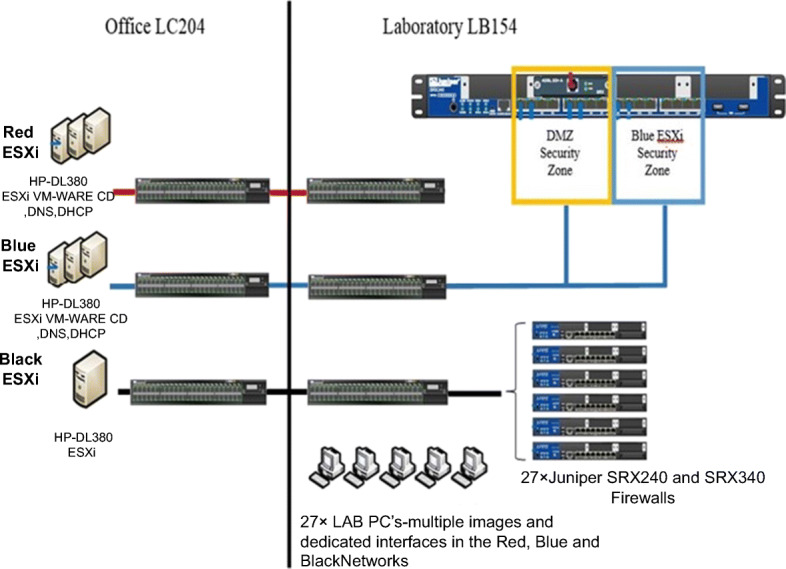
Inception of ESXi server
Proposed semi-automatic model
The deduced CVE list from the model’s collected data is delineating with the CVE list of the NIST database. After that, prioritization will be consummated based on the CVSS score available in the database and the attributes determined by the vulnerability tree analysis of the semi-automatic model. The model design spawns the characteristics for the CVE list of vulnerability exploitation available in the NIST database. To motif, such a list model uses approaches of machine learning library of python available on Jupyter notebook and designed the algorithm wherefore. The algorithm takes all the databases of the NIST between the years 1999–2021 as input. It produces the eviscerate data of all CVE lists excluding all the rejected files, corrupt files, and connection lost data files from it. The eviscerate data becomes the algorithm’s input and produces the attributes of the threat agents like Environments, Pre-requites input, attack vectors, and potentials outputs identified in the database as results. Similarly, the algorithm created an excel sheet of all the CVE lists of the NIST database based on the following information about threat agents:
The threat agent uses the environment or the system’s configuration to exploit the vulnerable ports of the network.
The inputs and the list of tools used to exploit the vulnerable ports of the network.
The attack vectors or the footprints used to exploit the network.
The potential aftermath of a threat agent group’s exploitation of a network of an informational environment.
The below algorithm is contriving for producing the Eviscerate data from the NIST database.
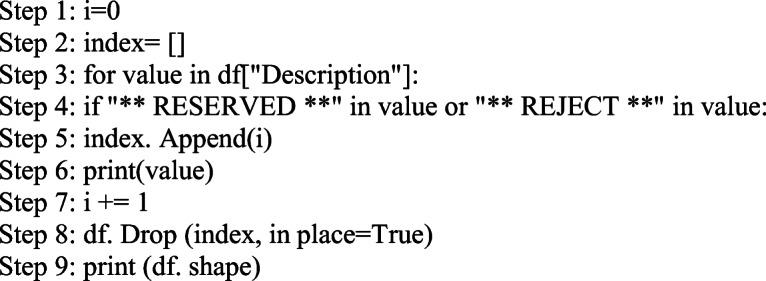
Algorithm 1:
Evaluation of vulnerability exploitation
The evaluation of vulnerability exploitation can be procuring by designing the vulnerability tree analysis for the NIST database by the model. In Fig. 3, the dataflow diagram of tree analysis from root to bottom is proclaiming. Here the core consists of all the NIST databases available on the NVD. This root consists of all the registered CVEs listed from various world organizations, including the corrupt, rejected, and no information open CVEs. A vulnerability assessment is a process of identifying, classifying, defining, and prioritizing vulnerabilities in computer systems, applications, and network underpinnings and providing the organization assessing with the necessary awareness, knowledge, and risk background to understand the threats to its environment and retaliate judiciously. The vulnerability tree analysis can be cast-off to evaluate exploitation of a particular CVE of the threat agent as:
| 1 |
Fig. 3.
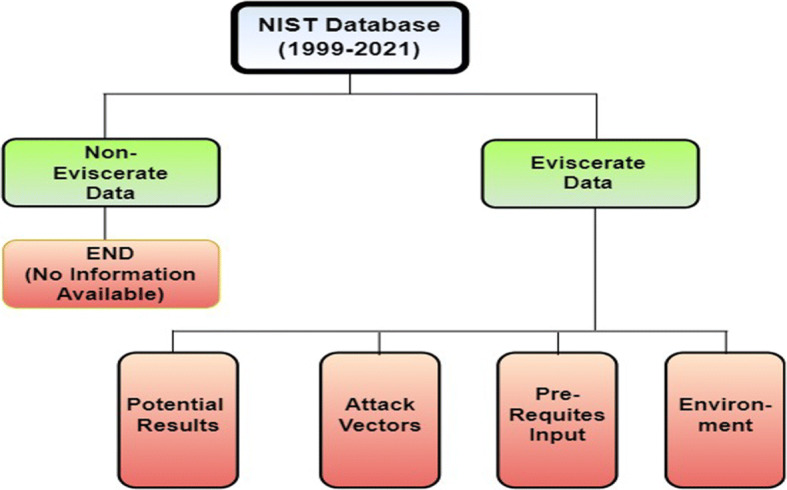
Vulnerability tree analysis
Here, in the above equation, the function f(x) typifies the vulnerability exploitation of CVE. Asset value stands for the value of an organization’s assets, and the summation function represents the threat agent’s attributes.
Vulnerability typifies for the vulnerable ports, and the impact stands for the threat agent group’s impact on the network. In the evaluation phase of the vulnerability exploitation for the NIST database, 205,773 vulnerabilities were cataloged from 1999 to 2021. Our model ascertains the attack vectors and the potential outputs for all these vulnerabilities in a semi-automatic manner, optimizing complexity compared to subsisting approaches.
The vulnerability tree analysis of exploitation for the CVE list of the NIST database traversing the threat agent group’s source and destination IP address from root to bottom leaves (Left and Right child) of the trees. Our model sways the capability and level of bits of knowledge for these threat agent’s groups concerning the CVE identified in the database, designs the Vulnerability trees, and provides the position to the various CVEs in the tree followed by top to a bottom approach of traversing. In Table 3, the model’s vulnerability levels can be assigned to the identified threat agents in the network, corroborating to CVEs hypothecated to those threat agents in the NIST database. Based on the information available for the CVE in the database, our model can extract the capability, opportunity, motivations, and level of knowledge acquired by threat agents to penetrate an organization’s network (Tables 4, 5 and 6).
Table 3.
Digital attacks history
| Country | No of Attacks |
|---|---|
| US | 28.519 |
| Brazil | 6.204 |
| UK | 5.099 |
| Germany | 4.736 |
| Italy | 2.738 |
| Canada | 2.345 |
| France | 2.022 |
| Denmark | 2.004 |
| Australia | 1.317 |
| South Korea | 1.259 |
Table 4.
Vulnerability exploitation flatten
| Vulnerability Level | Knowledge Level | Incognito |
|---|---|---|
| 1) | No knowledge of computer level 0 | None |
| 2) | Primary education level 1 | Not enough |
| 3) | Secondary education level 2 | Not enough |
| 4) | High school level 3 | Not enough |
| 5) | Intermediate school level 4 | Not enough |
| 6) | B-tech in computer science level 4 | Script |
| 7) | M-tech in computer science level 5 | Amateur |
| 8) | MPhil in computer level 6 | Amateur |
| 9) | Ph.D. in computers level 7 | Hacker |
| 10) | Postdoc in computer level 8 | Good hacker |
| A) | Ph.D. and post-doc level 9 | Better hacker |
| B) | High knowledge of computer level 10 | Best hacker |
| C) | Criminal record in cyberspace Level expert | Expert/Criminal hacker |
Table 5.
Comparison of methodology and model [35]
| Models/Methodology | Threat Agent Identification | Vulnerability Identification | Assets | Stakeholder Identification | ISO Standards & Control (17,799 &15,408 | Probabilistic approach | Hierarchical approach |
|---|---|---|---|---|---|---|---|
| CRAMM [11] | ✕ | ✓ | ✕ | ✓ & ✕ | ✓ | ✓ | |
| ARiES [9] | ✕ | ✕ | ✓ | ✕ | ✕ | ✓ | ✕ |
| Pfleeger [29] | ✕ | ✓ | ✓ | ✕ | ✕ | ✓ | ✕ |
| Caroll [45] | ✕ | ✓ | ✓ | ✕ | ✕ | ✓ | ✕ |
| Summers [38] | ✓ | ✓ | ✓ | ✕ | ✕ | ✓ | ✕ |
| COBRA [1] | ✕ | ✓ | ✓ | ✕ | ✓ & ✕ | Not Applicable. | Not Applicable. |
| FRAP [43] | ✕ | ✓ | ✓ | ✓ | ✕ | ✕ | ✕ |
| OCTAVE [2] | ✓ | ✓ | ✓ | ✓ | ✓ & ✕ | ✓ | ✓ |
| TAME [44] | ✓ | ✓ | ✓ | ✓ | ✕ | ✕ | ✓ |
| Jones [25] | ✓ | ✕ | ✕ | ✕ | ✕ | ✕ | ✓ |
| Amenza [22] | ✓ | ✕ | ✕ | ✓ | ✕ | ✓ | ✓ |
| VIM [41] | ✓ | ✕ | ✓ | ✕ | ✕ | ✕ | ✓ |
| SATAM [34] | ✓ | ✓ | ✓ | ✓ | ✕ | ✓ | ✓ |
Table 6.
Threats to IT security
| Threats | % of Respondents |
|---|---|
| Denial of Service | 52% |
| Web Site Defacement | 27% |
| Viruses | 59% |
| E-Mail Interception | 39% |
| Internal Fraud | 39% |
| Fraud affecting a third-party service such as a credit card | 23% |
| Theft of confidential information of electronic documents | 58% |
| Threats from disgruntled employees or contractors | 43% |
| Interception of wireless LAN communications | 45% |
According to “The Basics of Hacking and Penetration Testing by Dr. Patrick Engebreston” [14], threat agents are generally two types. One is enacting penetration testing with permission, known as white-hat hacking, and the second is performing unethical hacking, known as black-hat hacking. As in Table 3, Concerning hacker studies, our model provides the levels of indexing for particular threat agents according to their capability, motivation for the exploitation, and the level of knowledge they used against the vulnerable port of an organization. In general, for those hackers who are performing penetration testing as ethical hackers, our model provides them with a number and alphabet according to their level of knowledge. While on the other hand, for those who are performing unethical hacking, our model offers them an alphabet ‘C’ in obedience to the level of knowledge, which has a very high priority or main concern for any business of an organization.
Results and discussions
This section will discuss the aftermaths of the semi-automatic model for vulnerability exploitation analysis of the NIST database. We have described the environment used for the collection of data from the network in the previous section. Concerning the characteristics of DataStream, our model determined the CVE list for the identified threat agent in a network. Based on the CVE list analysis, risk management practitioners can suggest the priority lists for the vulnerable ports available in the information environment network of an organization. Similarly, our model used a machine learning library of python [39] available on the Jupyter notebook to optimize the process of determining the vulnerable ports manually from the CVE list available on the NIST database. To aid snags, our model designs an algorithm in such a way that reads all the registered CVE lists of the NIST database. These lists consist of all types of cybersecurity exudes registered with them from different world organizations.
These CVEs consist of a list of Vulnerable ports from the number of different platforms and environments targeted by the number of threat agent groups identified in an informational setting. To address the threat agent group’s specifications of the system used to penetrate an organization’s network, our model implements an algorithm that analyses all the data available on the NIST database between 1999 and 2021 [36]. The data analysis is carried out in several steps as follows:
Initially, the algorithm runs against the NIST database, determines all the data registered with NVD., and must consist of information regarding the minimum parameters assigned by the NVD for each CVE to be inscribing with them.
The list of cleaned CVEs is available as an output, consisting of only those CVEs that passed the minimum NVD requirement to be inscribed with them.
The algorithm of the semi-automatic model takes these Cleaned CVEs list as input and performs the analysis based on the characteristic features available to them.
The algorithm carried out the analysis for the CVE list concerning the environment or the platform used by the threat agent groups.
The subsequent analysis is carried out based on the input and the resources used by threat agent groups for penetrating the network.
The subsequent analysis carries through based on determining the attack vectors for the threat agent groups.
Finally, we got the potential outputs for the threat agent’s groups from the NIST database.
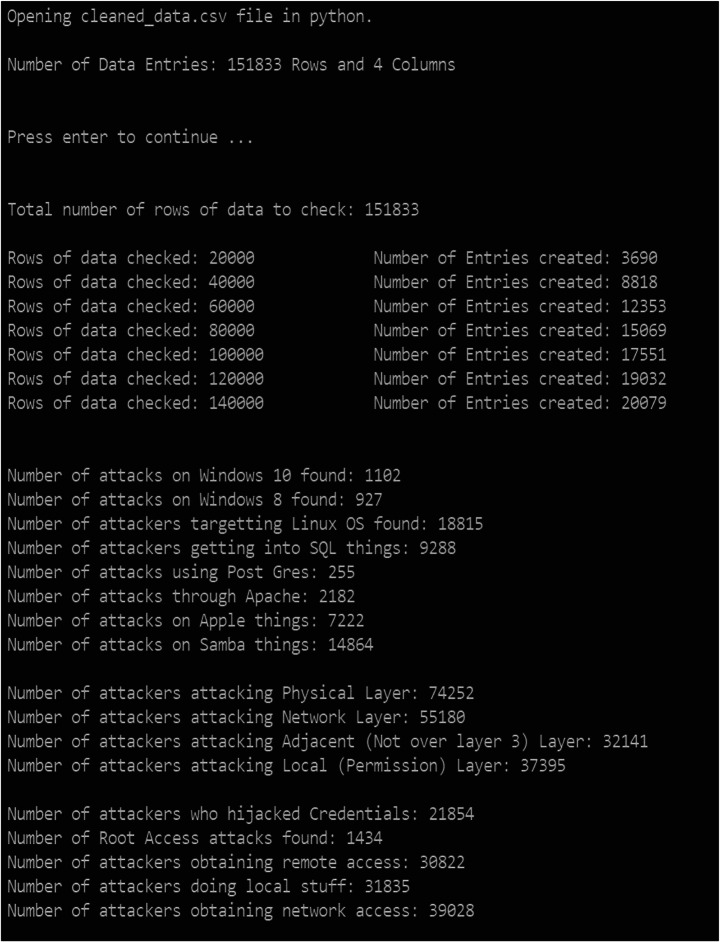
Figure 4 shows that when the model runs the first phase of an algorithm, we determine that there are 205,763 entities of CVE in the database. After that, the algorithm starts picking the CVE list of data, excluding the rejected, reserved, and corrupt files from it. The semi-automatic model determines that there are 151,833 entities of CVE available in the database between 1999 and 2021 [36], as shown in Fig. 4. Simultaneously, the next phase of the algorithm is guillotined and runs arbitrary commands on the CVE List excluding from the reject, reverse, and corrupting the file. Furthermore, the model starts implementing and analyzing the number of rows and the columns available in the cleaned data sets.
Fig. 4.
Analysis of eviscerate data of NIST
The first iteration of 2000 rows executed by the model identified 3690 entities in the attributes list available for the vulnerability exploitation of the ports. In the same way, the next 2000 rows placed 8819 entities, again the next 2000 rows found 12,353 entities, and the last iteration determined that 20,079 entities were in the outputs.
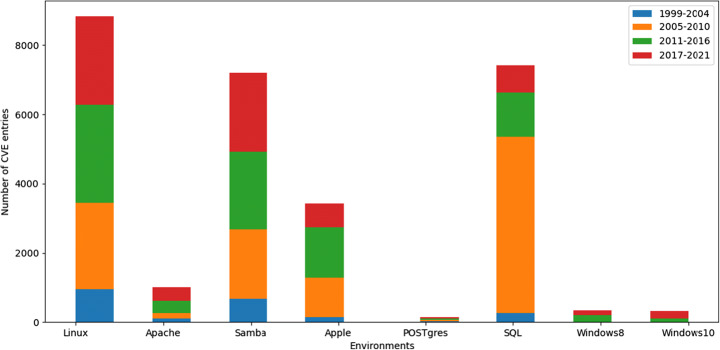
In the next phase, the semi-automatic model determines the number of attacks executed with the help of different environments or the platforms used by the threat agents. The number of attacks identified on Windows 10 is 1102, Windows 8 is 927, Linux is 18,815, SQL is 9288, postgres is 255, Apache is 2182, apple iOS is 7222, and samba is 14,864. The model’s input and resources in the database can be unyielding by the information (Input) and resources used by these threat agent groups in the database. The risk management team illustrates the loopholes or the vulnerable ports available in an organization’s network. In this way, the prioritization of vulnerable ports and the identification of open ports can be persistent. Later, which could be cast-off for referencing the opportunity available for the threat agents in a network of an informational environment.
The model determines the attack vectors inputs of threat agent groups like user credentials, root access, remote access, local access, network access, etc., based on the environment, the information (Input), and the resources or tools used by the threat agents to penetrate the network. The identification of attack vector inputs plays an essential role in prioritizing the vulnerability identified for a network. Suppose the attack vector input list of the NIST database is already available in a semi-automatic way. In that case, the potential outputs of the attack vectors can be handed down to reference the newly identified threat from the network. In this way, the time complexity of determining the vulnerable ports of a network would be low as compared to the conventional approaches followed by a model and methodologies [8, 33]. Finally, the last iteration of the algorithm is executed on the NIST database. The model uses identified environments, inputs, and attack vectors for all the CVE of a clean database as input and determines the embryonic consequences of outputs for the Vulnerability analysis. These potential outputs illustrated the Credential acquisitions, privilege escalation, remote access, denial of services, running arbitrary commands, data access, and data manipulation as the embryonic results of the threat agents determined from the CVE list of the NIST database.
Figure 5 indicates the identified threats vectors and the potential outputs of threat agent groups from the NIST database. The threat vectors analysis is attained through the database’s model by determining the threat agent group’s footprints information available in the CVE list. The threat agents used different layers like Physical, Network, Adjacent, and Local of the network to attack the particular network of an organization. Once the risk management practitioners list the layers used by the threat agent groups to penetrate the network, the identification of threat agent pigeonholes can be effectuated by the model. Attack vectors are the methods that antagonists use to breach the network level or pervade the particular network of an organization. Attack vectors range in many different forms, such as man-in-the-middle attacks, malware, ransomware attacks, compromised credentials, phishing, etc. There are mainly two categories of attack vectors [19, 42]; one is active, and the other is passive. The dynamic attack vectors exploit the alteration of the system by generating some system commands run against the organization, such as untrodden vulnerabilities, man-in-middle attacks, domain hacking, email spoofing, malware, and ransomware. On the other hand, the passive attack vectors exploit the system in such a way as to gain unauthorized access to the system, such as phishing, social engineering attacks, and Typos-squatting attacks.
Fig. 5.
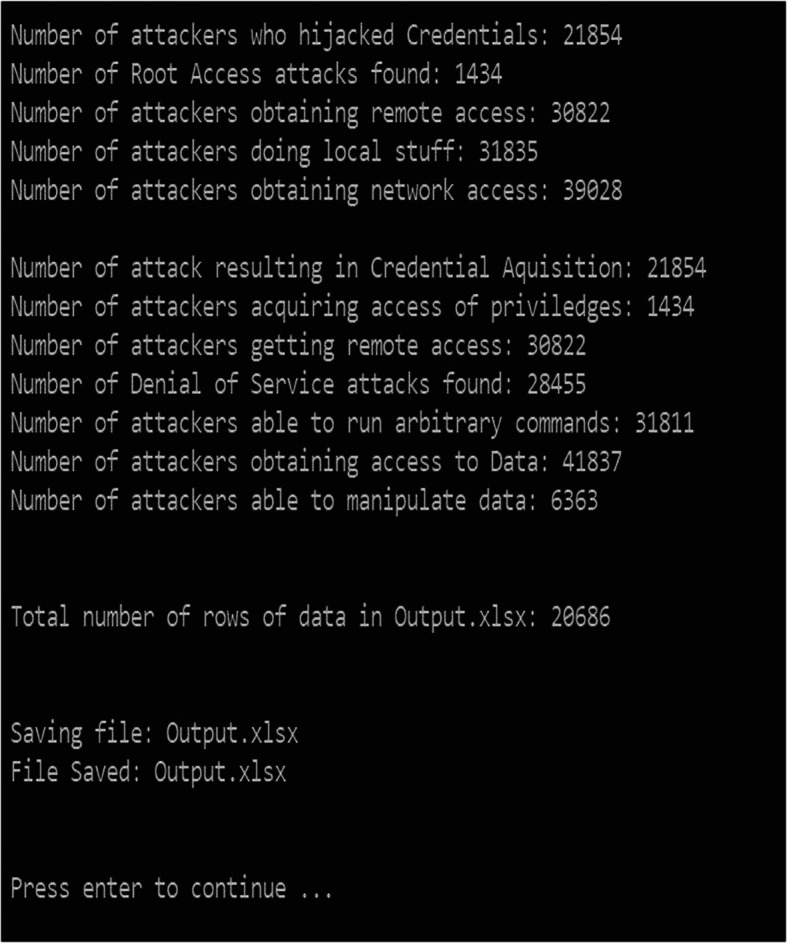
Analysis of eviscerate data of NIST
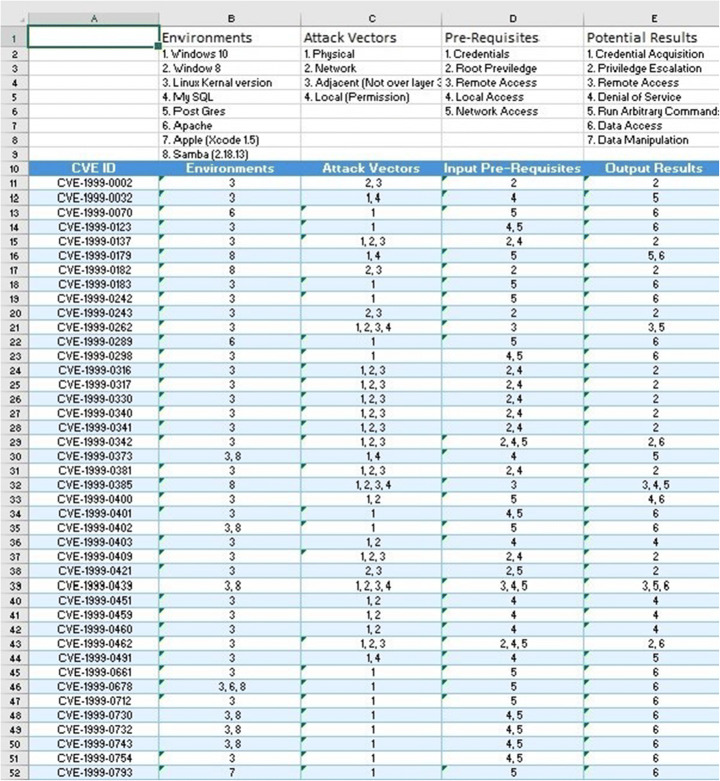
In Fig. 6, the sample of the excel sheet generated by our proposed model and consists of all the CVEs listed. The algorithm determines the attributes of the threat agent’s groups concerning the environments, Pre-requites input, attack vectors, and potential output. As the number of CVE lists is very prodigious in size, the outcome is also generated in prodigious size and can perceive at https:/github.com/Gauravsbin/Exploitation-of-Vulnerability-for-NIST-Database-1999-2021-. The semi-automatic model collects the DataStream or PCAP files from the ESXi server of the University of Hertfordshire. The PCAP files are captured by the number of virtual machines installed on the system to follow the activities performed by the threat agents in a network of the informational environment. In the first phase, a semi-automatic model extracts the valuable information of the threat agents from the PCAP files. Simultaneously, the extraction of critical intelligence feeds from the identified threat agent groups in a network and designing the profiles for the threat agent groups. The list of Ip addresses used by the threat agents to attack the target machine is devised. Concerning the Ip address of the threat agent, the associated list of CVEs can be indefatigable by mapping activities executed by the threat agent on a network with the NIST database.
Fig. 6.
Generation of excels sheets with attributes of threat agents
In Fig. 7, the semi-automatic threat assessment (platform) model groups the identified threat agent considering the environment cast off by hackers. The CVE list of the NIST database consists of practical information about the threat agents like a type of platform used to attack the network, script run by the threat agents, level of knowledge or skills acquired by the threat agents, and the capability of attackers, etc. The identification of attributes is accomplished by the model and mapping them with the associated CVE list of the NIST database. Based on the operating system used by the hackers to attack the network is evaluated by the model and with the help of the machine learning library of python available on the Jupyter notebook. Furthermore, the model plots a histogram between the number of CVE entities and the operating system used by the attackers to execute the attacks against a network of an organization.
Fig. 7.
Environments used by a threat agent to exploit the network
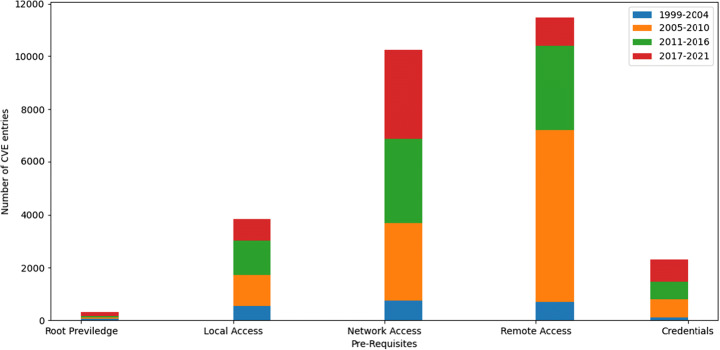
In Fig. 8, the model plots a histogram between the number of CVE entries and the pre-requisites inputs cast off by the threat agents groups. The semi-automatic model evaluates the pre-requisites inputs used by the threat agents to execute the codes, script, or malicious activities against an organization’s network. The model mapped the CVE list of source IP addresses from the captured packets of DataStream with the CVE list of the NIST database based on the identified inputs of the threat agents. The groups of threat agents associated with the particular type of input used during the execution attacks against the network are manifest in the histogram between the years 1999–2021.
Fig. 8.
Pre-requisites inputs of threat agents
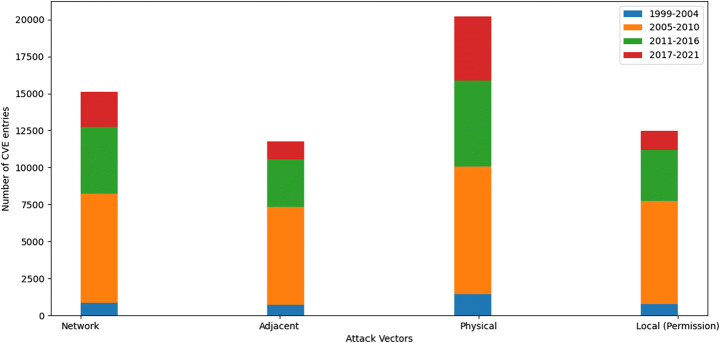
In Fig. 9, the semi-automatic threat assessment model plots a histogram between the groups of threat agent’s attack vectors cast-off to executes the attacks against the server of the University of Hertfordshire and the number of CVE list entries associated with the NIST database between 1999 and 2021. The above histogram shows the groups of threat agents operating on which layer and execution of the target machine achieved.
Fig. 9.
Attack vectors of threat agents
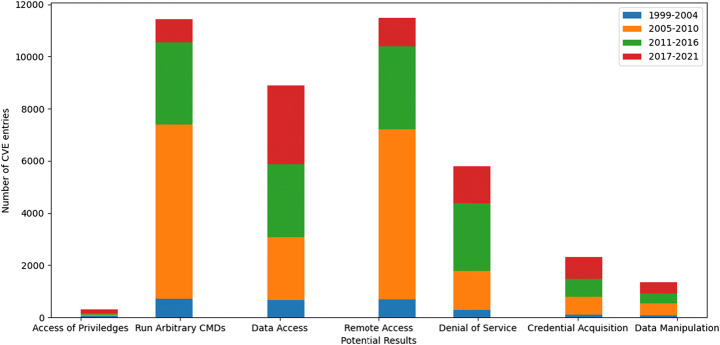
In Fig. 10, the histogram dreams up by the threat assessment model between the number of CVE list entries of the NIST database and the potential outputs of the threat agents groups. The activities performed by the group of CVE list associated with the threat agents groups determined in the PCAP files from the server are manifest in the histogram like access of privileges, running arbitrary commands, data access, data manipulation, credential acquisitions, etc. The existing model and methodology follow the evaluation process for the environments or platform, inputs of threat agents, attack vectors, and potential results manually used by the threat agents. Due to the manual process of identification of attributes for vulnerability exploitation. The time complexity increased, and simultaneously the performance of the existing model and methodology dwindled. While the semi-automatic model already evaluates the attributes of threat agents available in the CVE list of the NIST database. As the list of features generated by our model in the form of excel sheets. When identifying threat agents in a network and the associated list of CVEs with them is dextrous. The mapping of the identified CVEs to the excel sheet of results helps evaluate the organization’s vulnerable port. Due to the automation process of identifying attributes of threat agents, the process’s time complexity is reinforced. The results of the vulnerability exploitation of the NIST database would be used for commercial purposes by other existing models and methodology. When the exiting model identifies the associated list of CVEs, it can then check for the attributes from the excel sheet by clicking on Ctrl+F and placing the CVE number for the search. The associated results with the particular CVE can be tenacious.
Fig. 10.
Potential results of the threat agentstrun -1
Conclusion and future work
The main focus of the research is to provide proactive security to the networks. Similarly, the identified pivotal vulnerable ports need to prioritize or addressed first in an eloquent manner. Vulnerability exploitation risks materialize in the vulnerability analysis for the threat agent groups available in an organization’s network and the company’s business. The risk management team should apply the prioritization policy to the vulnerable ports in an eloquent manner and optimize time complexity. Moreover, this work lodges a semi-automatic evaluation model for exploiting vulnerability available in the NIST database in the form of a CVE list. The analysis and implementation of all the CVE lists effectuate the CVSS score and the attributes of the threat agent groups used while exploiting the vulnerable ports of a network. This approach helps potential results be more accurate, precise, practical, or eloquent. While analyzing an organization’s network in an informational environment, the time complexity is also optimized using the semi-automatic model approach. In the future, our research would suggest that the model work for both vulnerability analysis as well the threat agent attributes calculation (TAC) simultaneously with optimized time and area complexity.
Biographies
Gaurav Sharma
received his bachelor’s degree in computer science from Gautama Buddha University, Lucknow, India, in 2010, and his master’s degree in VLSI and CAD systems from Thapar University Punjab, India, in 2012. He worked as Research Assistant in a Modular threat assessment project by Innovative United Kingdom (IUK). He is currently working as Visiting Lecturer and pursuing a Ph.D. in the cybersecurity research group at the University of Hertfordshire Hatfield, UK- School of computer science. He focuses on the Real-Time Semi-Automated Threat Assessments in Informational Environment. His research areas include Cloud Computing, Internet of Things, Cybersecurity, Cryptography, and Security in Wireless Sensor Networks.

Dr. Stilianos Vidalis
’s involvement in the Information Operations arena began in 2001. He has participated in high-profile, high-value projects for large international organizations and Governments. He has collected and analyzed information for prestigious European financial institutions, applying international standards under the context of risk and threat assessment. He was training British Armed Forces personnel in penetration testing and digital forensics. He has developed and published his own threat assessment methodology in peer-reviewed scientific journals and other aspects of his work on threat agent classification, vulnerability assessment, early warning systems, deception in CNO, id theft, and computer criminal profiling. He is currently responsible for developing training courses in cybersecurity, cyber intelligence, and digital forensics at the University of Hertfordshire, England.

Dr. Catherine Menon
is a senior lecturer at the University of Hertfordshire. She has led the Soc-Cred project, supported by the Assuring Autonomy International Programme and Lloyd’s Register. She has been involved in several industry-funded projects, including the UK MOD SSEI consortium. She is a member of the BSI AMT/10 (Robotics) and AMT/10/1 (Ethics for Robots and Autonomous Systems) Committees, the IET Committee for the Safety and Security Code Practice, and the ISO SC7 working group. She is also a member of the IEEE P7000 Working Group, developing a standard for the fail-safe design of autonomous and semi-autonomous systems.

Dr. Niharika Anand
received a Ph.D. degree from the Indian Institute of Information Technology, Allahabad, India. She is currently working as an Assistant Professor with the Department of Information Technology Indian Institute of Information Technology, Lucknow, India. Her research areas include Cloud Computing, Internet of Things, Cyber Forensics 3-D Wireless Sensor Network, Wireless Sensor Network Localization, Wireless Sensor Network Topology Control and Maintenance.

Funding
This research received no external funding.
Data availability
The data presented in this study are available at https:/github.com/Gauravsbin/Exploitation-of-Vulnerability-for-NIST-Database-1999-2021-.
Declarations
Conflict of interest
The authors declare no conflict of interest.
Footnotes
Publisher’s note
Springer Nature remains neutral with regard to jurisdictional claims in published maps and institutional affiliations.
Contributor Information
Gaurav Sharma, Email: g.gaurav@herts.ac.uk.
Stilianos Vidalis, Email: s.vidalis@herts.ac.uk.
Catherine Menon, Email: c.menon@herts.ac.uk.
Niharika Anand, Email: niharika@iiitl.ac.in.
References
- 1.Addison S (2002) Introduction to security risk analysis and the cobra approach. C A Secure. Syst. Rep. (Online Ser. Availablewww.Secure.com
- 2.Alberts CJ, Dorofee AJ, Allen JH (2001) OCTAVE catalog of practices, version 2.0. Carnegie-Mellon Univ Pittsburgh Pa Software Engineering Inst
- 3.Alfadel M, Costa DE, Shihab E (2021) Empirical Analysis of Security Vulnerabilities in Python Packages. In: 2021 IEEE international conference on software analysis, Evolution and Reengineering (SANER), pp. 446–457
- 4.Allodi L (2017) Economic factors of vulnerability trade and exploitation. In: Proceedings of the 2017 ACM SIGSAC conference on computer and communications security, pp. 1483–1499
- 5.Allodi L, Biagioni S, Crispo B, Labunets K, Massacci F, Santos W (2017) Estimating the assessment difficulty of CVSS environmental metrics: an experiment. In: International Conference on Future Data and Security Engineering, pp. 23–39
- 6.Allodi L, Cremonini M, Massacci F, Shim W (2018) The effect of security education and expertise on security assessments: The case of software vulnerabilities. arXiv Prepr. arXiv1808.06547
- 7.Alomar N, Wijesekera P, Qiu E, Egelman S (2020) ‘You’ve Got Your Nice List of Bugs, Now What?’ Vulnerability Discovery and Management Processes in the Wild. In: Sixteenth Symposium on Usable Privacy and Security ({SOUPS} 2020), pp. 319–339
- 8.Aufner P. The IoT security gap: a look down into the valley between threat models and their implementation. Int J Inf Secur. 2020;19(1):3–14. doi: 10.1007/s10207-019-00445-y. [DOI] [Google Scholar]
- 9.Bagstad KJ, Villa F, Johnson GW, Voigt B (2011) ARIES–Artificial Intelligence for Ecosystem Services: a guide to models and data, version 1.0. ARIES Rep. Ser., vol. 1
- 10.Berhe S, Demurjian SA, Pavlich-Mariscal J, Saripalle RK, De la Rosa Algarín A (2021) Leveraging UML for Access Control Engineering in a Collaboration on Duty and Adaptive Workflow Model that Extends NIST RBAC. In: Research Anthology on Recent Trends, Tools, and Implications of Computer Programming, IGI Global, pp. 916–939
- 11.Boban M. Building eGovernment model on the principles of new economic trends and international standards considering protection of citizen privacy and personal data. E-Society J Res Appl. 2010;1(2):1–15. [Google Scholar]
- 12.Cisar P, Rajnai Z, Cisar SM, Pinter R. Scoring system as a method of improving IT vulnerability status. Ann Fac Eng Hunedoara. 2016;14(3):207. [Google Scholar]
- 13.de Ruiter MC, Ward PJ, Daniell JE, Aerts JCJH. A comparison of flood and earthquake vulnerability assessment indicators. Nat Hazards Earth Syst Sci. 2017;17(7):1231–1251. doi: 10.5194/nhess-17-1231-2017. [DOI] [Google Scholar]
- 14.Engebretson P. The basics of hacking and penetration testing. Waltham: Elsevier Hadnagy; 2013. [Google Scholar]
- 15.Feutrill A, Ranathunga D, Yarom Y, Roughan M (2018) The effect of common vulnerability scoring system metrics on vulnerability exploit delay. In: 2018 Sixth International Symposium on Computing and Networking (CANDAR), pp. 1–10
- 16.Franklin J, Wergin C, Booth H (2014) CVSS implementation guidance. Natl Inst Stand Technol NISTIR-7946
- 17.Geerts E (2020) Book Review: Vulnerable Futures, Transformative Pasts: On Vulnerability, Temporality, and Ethics by Miri Rozmarin, Peter Lang, 2017, 194 pages. ISBN 978–1–78707-392-0 (ePub)(also available in print, ePDF and mobi). Helsinki University Press
- 18.Grother PJ (1995) NIST special database 19. Handprinted forms characters database, Natl. Inst. Stand. Technol., p. 10
- 19.Haber MJ, Hibbert B. Asset attack vectors: building effective vulnerability management strategies to protect organizations. Apress; 2018. [Google Scholar]
- 20.Humayun M, Niazi M, Jhanjhi NZ, Alshayeb M, Mahmood S. Cyber security threats and vulnerabilities: a systematic mapping study. Arab J Sci Eng. 2020;45(4):3171–3189. doi: 10.1007/s13369-019-04319-2. [DOI] [Google Scholar]
- 21.Humayun M, Jhanjhi NZ, Almufareh MF, Khalil MI (n.d.) Security Threat and Vulnerability Assessment and Measurement in Secure Software Development
- 22.Ingoldsby TR (2010) Attack tree-based threat risk analysis. Amenaza Technol Ltd, pp. 3–9
- 23.Jing Y, Ahn G-J, Zhao Z, Hu H (2014) Riskmon: Continuous and automated risk assessment of mobile applications. In: Proceedings of the 4th ACM Conference on Data and Application Security and Privacy, pp. 99–110
- 24.Joh H, Malaiya YK. Modeling skewness in vulnerability discovery. Qual Reliab Eng Int. 2014;30(8):1445–1459. doi: 10.1002/qre.1567. [DOI] [Google Scholar]
- 25.Jones A (2002) Identification of a Method for the Calculation of the Capability of Threat Agents in an Information Environment. Sch. Comput. Pontypridd, Univ. Glamorgan 0–134
- 26.Mahmud SMH, Hossin MA, Jahan H, Noori SRH, Bhuiyan T (2018) CSV-ANNOTATE: Generate annotated tables from CSV file. In: 2018 International Conference on Artificial Intelligence and Big Data (ICAIBD), pp. 71–75
- 27.Munaiah N, Meneely A (2016) Vulnerability severity scoring and bounties: Why the disconnect?. In: Proceedings of the 2nd International Workshop on Software Analytics, pp. 8–14
- 28.Pendleton M, Garcia-Lebron R, Cho J-H, Xu S. A survey on systems security metrics. ACM Comput Surv. 2016;49(4):1–35. doi: 10.1145/3005714. [DOI] [Google Scholar]
- 29.Pfleeger CP. Security in computing. Pearson Education India; 2009. [Google Scholar]
- 30.Ralchenko Y, Kramida AE, Reader J (2008) NIST atomic spectra database. Natl. Inst. Stand. Technol. Gaithersburg, MD
- 31.Ruohonen J, Rauti S, Hyrynsalmi S, Leppänen V. A case study on software vulnerability coordination. Inf Softw Technol. 2018;103:239–257. doi: 10.1016/j.infsof.2018.06.005. [DOI] [Google Scholar]
- 32.Samuel J, Aalab K, Jaskolka J (2020) Evaluating the soundness of security metrics from vulnerability scoring frameworks. In: 2020 IEEE 19th International Conference on Trust, Security and Privacy in Computing and Communications (TrustCom), pp. 442–449
- 33.Sgandurra D, Lupu E. Evolution of attacks, threat models, and solutions for virtualized systems. ACM Comput Surv. 2016;48(3):1–38. doi: 10.1145/2856126. [DOI] [Google Scholar]
- 34.Sharma G, Vidalis S, Menon C, Anand N, Kumar S. Analysis and implementation of threat agents profiles in semi-automated manner for a network traffic in real-time information environment. Electronics. 2021;10(15):1849. doi: 10.3390/electronics10151849. [DOI] [Google Scholar]
- 35.Sharma G, Vidalis S, Menon C, Anand N, Pourmoafi S (2021) Study and Analysis of Threat Assessment Model and Methodology in Real-Time Informational Environment. In: 2021 IEEE Bombay Section Signature Conference (IBSSC), pp. 1–6
- 36.Smith RM, Martell AE, Motekaitis RJ (2004) NIST standard reference database 46. NIST Crit. Sel. Stab. Constants Met. Complexes Database Ver, vol. 2
- 37.Strom BE, Applebaum A, Miller DP, Nickels KC, Pennington AG, Thomas CB, (2018) Mitre att&ck: design and philosophy. Tech. Rep
- 38.Summers RC. Secure computing: threats and safeguards. McGraw-Hill, Inc.; 1997. [Google Scholar]
- 39.Tavenard R, et al. Tslearn, a machine learning toolkit for time series data. J Mach Learn Res. 2020;21(118):1–6. [Google Scholar]
- 40.Teixeira A, Sou KC, Sandberg H, Johansson KH. Secure control systems: A quantitative risk management approach. IEEE Control Syst Mag. 2015;35(1):24–45. doi: 10.1109/MCS.2014.2364709. [DOI] [Google Scholar]
- 41.Tevis J-EJ, Hamilton Jr JA (2006) Static analysis of anomalies and security vulnerabilities in executable files. In: Proceedings of the 44th annual Southeast regional conference, pp. 560–565
- 42.Ullah F, Edwards M, Ramdhany R, Chitchyan R, Babar MA, Rashid A. Data exfiltration: a review of external attack vectors and countermeasures. J Netw Comput Appl. 2018;101:18–54. doi: 10.1016/j.jnca.2017.10.016. [DOI] [Google Scholar]
- 43.van Royen ME, Farla P, Mattern KA, Geverts B, Trapman J, Houtsmuller AB (2008) Fluorescence recovery after photobleaching (FRAP) to study nuclear protein dynamics in living cells. In: The nucleus, Springer, pp. 363–385 [DOI] [PubMed]
- 44.Vidalis S, Jones A (2003) Using vulnerability trees for decision making in threat assessment. Univ. Glamorgan, Sch. Comput. Tech. Rep. CS-03-2
- 45.Xu H, Luo XR, Carroll JM, Rosson MB. The personalization privacy paradox: an exploratory study of the decision-making process for location-aware marketing. Decis Support Syst. 2011;51(1):42–52. doi: 10.1016/j.dss.2010.11.017. [DOI] [Google Scholar]
Associated Data
This section collects any data citations, data availability statements, or supplementary materials included in this article.
Data Availability Statement
The data presented in this study are available at https:/github.com/Gauravsbin/Exploitation-of-Vulnerability-for-NIST-Database-1999-2021-.


