Figure 2.

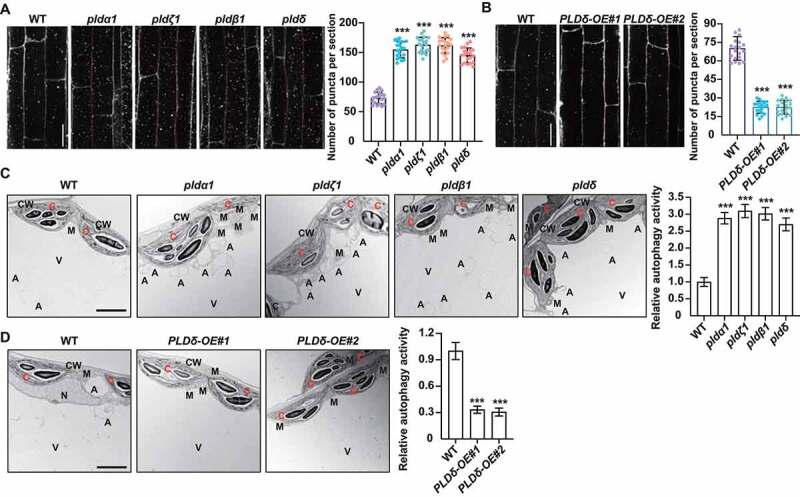
Deficiencies of PLDs result in promoted autophagy. (A and B) MDC staining (left) and quantification of puncta per root section (right) of WT, pldα1, pldζ1, pldβ1, pldδ (A) and PLDδ-OE (B). Five-day-old seedlings were treated with Con A (0.5 μM), followed by staining with MDC. The labeled autophagosomes of root cells were visualized by fluorescence confocal microscopy using a DAPI-specific filter and representative images were shown (bars: 50 μm). Numbers of puncta per root section were measured and data were shown as mean ± SD (n = 20). Statistical significance was determined by Student's t-test (***, P < 0.001, compared to WT). (C and D) TEM analyses (left, bars = 50 μm) and quantification of autophagic structures (right) in WT and pldα1, pldζ1, pldβ1, pldδ seedlings (C), and seedlings overexpressing PLDδ (D). Three-week-old seedlings were treated with Con A (0.5 μM) and mesophyll cells were observed. “A” indicates the autophagic structures. CW, cell wall; C, chloroplast; M, mitochondrion; V, vacuole. Experiments were biologically repeated for three times and data were shown as mean ± SD (n = 10). Statistical significance was determined by Student's t-test (***, P < 0.001, compared to WT).
