

Abstract
Background and Aims
Carpal tunnel syndrome (CTS) is the most common peripheral nerve entrapment syndrome with a high prevalence among workers. Insights on the physical work‐related risk factors is necessary to develop appropriate preventative methods. The objective of this systematic review, including meta‐analyses, is to assess which physical work‐related risk factors are associated with carpal tunnel syndrome.
Methods
Systematic literature searches were carried out using PubMed and Embase until September 6, 2021. Studies were included if: (1) CTS was clinically assessed, (2) the studies were prospective cohort studies, and (3) the exposure was reported using terms of exposed/less or nonexposed. Risk of bias was assessed using the Quality in Prognosis Studies (QUIPS) tool. Quality of evidence was assessed using the Grading of Recommendations, Assessment, Development, and Evaluation (GRADE).
Results
In total, 9270 patients with CTS from a population of 1,051,707 workers were included from 17 studies. Meta‐analyses revealed high‐quality evidence for associations between CTS and high exposures to repetition (hazard ratio [HR] 1.87, 95% CI 1.42–2.46), force intensity (HR 1.84, 95%CI 1.22–2.79), exposures above hand activity level of ACGIH (HR 1.75, 95%CI 1.40–2.17), and the Strain Index >10 (HR 1.58, 95% CI 1.09–2.30). No significant associations were found for pinch gripping, hand‐arm vibration or force duration. High computer‐use exposure was significantly associated with a decreased rate of work‐related CTS (HR 0.28, 95% CI 0.12–0.64).
Conclusion
This systematic review of prospective cohort studies found high certainty for an increased rate of CTS due to a high Strain Index, exposures exceeding the Activity Level of ACGIH, and high force intensity and high repetition. Workers performing tasks requiring both high force and high repetition even have a higher rate of developing CTS.
Keywords: carpal tunnel syndrome, occupational exposures, physical risk factors, prevention
1. INTRODUCTION
Carpal tunnel syndrome (CTS) is the most common peripheral nerve entrapment syndrome and is caused by pressure on or around the median nerve. The carpal tunnel is a narrow passageway located at the palm side of the hand and is defined by the carpal ligament at the volar side where some tendons of the fingers (flexor digitorum profundus, flexor digitorum superficialis, and flexor pollicis longus) and the median nerve run through. Compression of the median nerve causes tingling, weakness, and numbness in the thumb, index finger, middle finger, and on the radial side of the ring finger. 1 , 2
In de past two decades several studies have been performed to identify personal and psychosocial risk factors for CTS, but not often with a prospective study design to assess causal associations between risk factors and CTS. Examples of reported personal risk factors are sex, age, pregnancy, obesity, square wrists, and comorbid diseases such as rheumatoid arthritis, diabetes, and thyroid diseases. 3 , 4 , 5 Studies have also shown that CTS might affect postmenopausal women and women taking oral contraception. 6 , 7 More recently, studies have described an association between psychosocial factors and carpal tunnel syndrome such as job strain and dissatisfaction. 8 , 9
Although personal and psychosocial factors have been associated with CTS, CTS is still seen as a frequently occurring occupational disease probably caused by work/related. 10 Luckhaupt et al concluded that the overall lifetime prevalence of clinician‐diagnosed CTS among current workers was 6.7% and the 12‐month prevalence was 3.1%, representing approximately 4.8 million workers with current CTS. 11 This high prevalence also leads to high sickness absence rates after carpal tunnel release and the average return to work ranges from 21 days for nonmanual to 39 days for manual work. 12 We do know that the problem is not only a financial issue, as some workers can't fulfill their jobs anymore and may need to find another job, also employers may suffer indirect costs such as loss of productivity and time spent on hiring new employees. 13
Since CTS is associated with many risk factors, it is important to look into the work‐related population attributive fraction (PAF) of CTS. This indicates the proportion of incidents of CTS in the population that are attributable to work. Roquelaure et al., 14 a study regarding the attributable risk of CTS in the general population, showed a PAF of 50% for males performing manual work and 19% for females. This suggests that the incidence of CTS caused by work might decrease by introducing changes in the workplace. Given the association with manual work, it is important to determine the work‐related physical risk factors of CTS to lower the incidence. Therefore, we decided to include only work‐related physical risk factors in this review. Moreover, we presume that physical risk factors are likely to be explained by the pathophysiologic mechanisms in CTS. 15 , 16 Therefore, these physical risk factors are more likely to be causative for CTS and coherent preventive measures probably more effective to reduce the risk of manual work.
The American Academy of Orthopaedic Surgeon (AAOS) published a guideline in 2016 for the management of CTS, in which they described risk factors of CTS sorted into limited, moderate and strong evidence. They found an increased risk of CTS due to repetition with strong evidence. Moderate evidence was found for the following risk factors are: vibration, computer use and force. 17
Complementary to that, a number of reviews have been published over the past two decades, for example, van Rijn et al., 18 Barcenilla et al., 19 and Kozak et al. 20 These reviews assessed cross‐sectional, case‐control and cohort studies to determine the occupational risk factors concluded that repetition, force, vibration and wrist bending are risk factors for carpal tunnel syndrome. To properly infer causality between work‐related risk factors and CTS, it is preferred to use longitudinal studies preferably also adjusting for confounding factors.
Hence, we conducted a systematic review, including meta‐analyses with evidence synthesis using the Grading of Recommendations, Assessment, Development, and Evaluation (GRADE) framework, using only prospective cohort studies to determine the association between physical work‐related risk factors and clinically assessed CTS. The aim of this systematic review is to investigate which work‐related physical risk factors are associated with clinically diagnosed CTS.
2. METHODS
This systematic review, including a meta‐analysis, was conducted according to the criteria of the PRISMA statement. 21
2.1. Eligibility criteria
Only cohort studies published in peer‐reviewed journals fulfilling the following criteria were used: the study was written in English, German, French, Italian or Dutch; CTS was clinically assessed; the association between CTS and the work‐related physical risk factors was described using the effect measures, hazard ratio (HR), relative risk (RR) or could be calculated with the provided data; exposure data were provided for CTS and at least two levels of exposures were reported to retrieve a risk estimate. The clinical examination should report at least symptoms and signs as tingling, weakness, and numbness in the thumb, index finger, middle finger and on the radial side of the ring finger. Physical work‐related risk factors had to be described in terms of physical workload or specific occupational activities such as repetitive hand movements or postures. No studies were excluded on the basis of the year of publication.
2.2. Literature search
Systematic literature searches were carried out using PubMed and Embase from 1954 to December 2, 2021. We combined several CTS terminologies and work‐related physical risk factors to generate the search strategy. The search strategies used in both databases are shown in Appendix 1.
2.3. Study selection
After duplicates from PubMed and Embase had been removed, all studies were checked independently and blinded for each other by at least two of the authors. First, titles and abstracts were screened to identify relevant studies and to exclude studies that did not fulfill the inclusion criteria. Secondly, we obtained the full texts of the remaining studies and assessed those for eligibility. Disagreement was resolved by discussion between the two authors, and if needed a third author was asked. Endnote X9 and Rayyan were used to manage the screening and selection.
2.4. Data extraction
The following data were extracted from each article: author; year of publication; country; study design; case definition of CTS; length of follow‐up; definition of work‐related physical risk factors; method of assessment of work‐related risk factors; number and characteristics of participants such as sex and age; risk estimate and confidence interval; and adjustment for confounding.
2.5. Quality assessment
The methodological quality of the study was rated independently by two authors. Since we only included prospective cohort studies, we used the Quality in Prognosis Studies (QUIPS) tool. The checklist covers six domains: (1) study population (e.g., the study sample represents the population of interest), (2) study attrition (e.g., the response rate was >80%), (3) prognostic factor measurement (e.g., the exposure was assessed by professionals), (4) outcome measurement (e.g., CTS was clinically assessed), (5) study confounding (e.g., the risk‐estimate was adjusted for age, sex, BMI and diabetes mellitus), (6) statistical analysis and reporting (e.g., a risk‐estimate was calculated). Every domain was scored as having a low, moderate or high risk of bias. 22 The overall quality of the studies was classified as having a high risk of bias if one domain was scored as having a high risk of bias or two domains were scored as having a moderate risk of bias.
2.6. Data analysis
A meta‐analysis was performed if there were at least two studies to determine whether work‐related physical risk factors were associated with CTS. For each risk factor, we used the highest versus the lowest exposures as reported in the studies. If the exposure was trichotomized, we used the reported medium exposed group as exposed category and the reported low exposure as reference category. A pooled HR and 95% confidence interval (CI) were calculated for each risk factor using a random effects model in Cochrane's RevMan 5.4. Heterogeneity was assessed using the I2 test, which describes the dispersion of effect sizes and the relative heterogeneity in the studies as compared to random chance. Heterogeneity was considered high if I2 > 70%. Forest plots were made for each risk factor to visualize the pooled results.
2.7. GRADE
To assess the certainty of evidence for the association between physical work‐related risk factors and CTS of risk factors that were included in the meta‐analyses we used the Grading of Recommendations, Assessment, Development, and Evaluation (GRADE) framework. 23 GRADE uses four levels to judge the certainty of evidence: very low, low, moderate, and high. Since we included only prospective cohort studies that studied an association between specific risk factors and CTS, the starting qualification of certainty of evidence for each risk factor was high. The quality of evidence was downgraded on the basis of the following five factors: (1) study limitation (high risk of bias present in the majority of the studies), (2) inconsistency (I2 > 70%), (3) indirectness (CTS not clinically assessed), (4) imprecision (range of the 95% CI > 2.0), and (5) presence of publication bias. If the quality of evidence was not downgraded on the basis of these five criteria, it could be upgraded on the basis of two factors: (1) large effect size (the risk estimate of a risk factor >2.5), and (2) presence of a dose‐effect relationship in the reported study. Two authors independently assessed the quality criteria and the level of agreement was discussed in the whole author group.
3. RESULTS
3.1. Study selection
Our search strategy resulted in 3846 studies of which 1202 were duplicates. After our first screening of the titles and abstracts we excluded 2551 articles that did not meet our inclusion criteria's. The remaining 97 articles were assessed in our full‐text screening. In total, 17 studies 9 , 24 , 25 , 26 , 27 , 28 , 29 , 30 , 31 , 32 , 33 , 34 , 35 , 36 , 37 , 38 , 39 were included and 12 of these studies were enrolled in our meta‐analysis. Three studies 26 , 28 , 29 used the same pooled cohorts with the same participants and because of that we chose study 27 with the most participants in the meta‐analysis. The study selection process is shown in a PRISMA flowchart in Figure 1.
Figure 1.
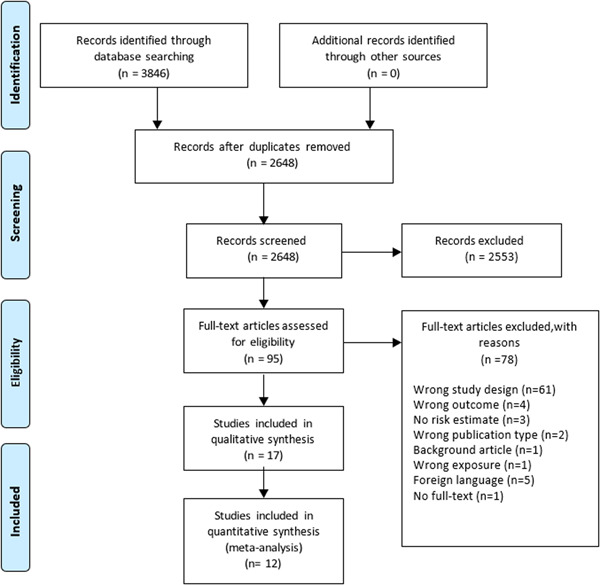
Flow chart of the included studies.
3.2. Study characteristics
All the studies are prospective cohort studies and were published between 2001 and 2021. The included studies were conducted worldwide with eight studies in the United States, 25 , 26 , 27 , 28 , 29 , 31 , 32 , 36 two in France, 9 , 33 three in Italy, 24 , 38 , 39 two in Finland, 30 , 37 one in Denmark, 34 and one in both the United States and France. 35 The total number of included workers was 1,051,707 and were all 18 years of age or older. In total, 9270 cases of CTS were clinically assessed but two studies did not mention the cases of CTS in their articles. CTS was clinically assessed in all the studies by symptoms with or without nerve conduction studies (NCS). Symptoms were tingling, numbness, pain and/or burning in two or more of the first four digits. Leclerc et al., 33 Lund et al. 34 and Roquelaure et al. 9 assessed CTS if these symptoms were present. Hulkkonen et al. 30 and Pourmemarie et al. 37 obtained data on hospitalizations due to CTS. The remaining studies assessed CTS by both the presence of the above‐mentioned symptoms and NCS. Six studies studied the association between the ACGIH Threshold Limit Values (TLV) and the incidence of CTS 24 , 25 , 27 , 32 , 38 , 39 ; four studies assessed the association between repetition and the incidence of CTS 26 , 28 , 29 , 39 ; Four studies studied the association between force duration and the incidence of CTS 25 , 26 , 28 , 29 ; Four studies assessed the association between vibration and the incidence of CTS 28 , 30 , 36 , 37 ; six studies assessed the association between force intensity and the incidence of CTS 26 , 28 , 29 , 33 , 34 , 39 ; two studies assessed the association between wrist bending posture and the incidence of CTS 9 , 28 ; three studies assessed the association between pinch gripping and the incidence of CTS 9 , 33 , 37 ; two studies assessed the association between computer/keyboard use and the incidence of CTS 35 , 36 and finally, two studies studied the association between a high Strain Index (SI) and the incidence of CTS. 27 , 31 The characteristics of the studies are described in Appendix 2.
3.3. Quality of the studies
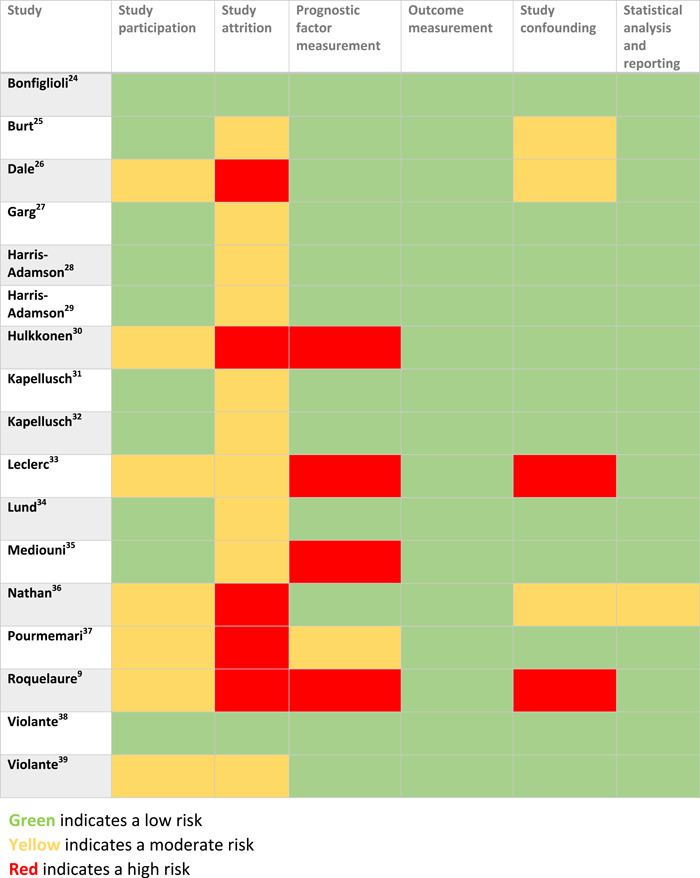
Bonfiglioli et al. 24 and Violante et al. 38 had the best quality and had a low risk of bias on all six domains. Seven studies 9 , 26 , 30 , 33 , 34 , 35 , 36 , 37 , 39 had a moderate risk of bias on the first domain because they did not provide a table with the baseline characteristics or did not have a sufficient number of participants in their study (<500 participants). All of our included studies, except two studies, 24 , 39 did not provide a table with the baseline characteristics of the participants lost to follow up and on top of those five studies also had a low response rate (<70%). Studies 9 , 30 , 33 , 35 that measured the exposure by a self‐administered questionnaire had a high risk of bias on the third domain and one study 37 that measured the exposure by interviews had a moderate risk of bias on the third domain. Lastly, five studies 9 , 25 , 26 , 33 , 36 did not measure all the confounders and had a moderate/high risk of bias on the fifth domain. The complete assessment of the studies is shown in Table 1.
Table 1.
Assessment of the risk of bias using the Quality in Prognostic Studies (QUIPS) tool
|
3.4. Risk factors and CTS
3.4.1. Meta‐analysis and GRADE
We performed a meta‐analysis for the following risk factors: repetition, force duration, force intensity, ACGIH Threshold Limit Values (TLV), vibration, pinch gripping computer use, the Strain Index (SI). We could not perform a meta‐analysis for the following risk factor: wrist bending posture because there were not enough studies to include in the meta‐analysis. Details of the assessment of the GRADE framework are presented in Table 2.
Table 2.
Grading of Recommendations Assessment Development and Evaluations (GRADE) framework for the work‐related physical risk factors for carpal tunnel syndrome
| Work‐related physical risk factor | Number of participants (number of Incident cases of CTS) | Prospective cohort studies | Phase of investigation, 1 = explorative: ↓2/3 = explanatory | Study limitations, majority of studies high risk of bias: ↓ | Inconsistency, (i2 > 50%)↓ | Indirectness Diagnosis (not clinically assessed)↓ | Imprecision CI effect size: (<1 and > 2), (range > 2) Yes: ↓ | Publication bias strongly suspected, Yes: ↓ | Effect size HR > 2.5 ↑ | Dose–response present:↑ | Overall quality (high, moderate, low, very low) |
|---|---|---|---|---|---|---|---|---|---|---|---|
| ACGIH TLV 27 , 32 , 38 , 39 | 6767 (324) | 4/4 | 2 | Low 0/4 | 0% | 0/4 | 1.40–2.17 | Not detected | 1.75 | No | High |
| Repetition 28 , 39 | 6345 (211) | 2/2 | 2 | Low 0/2 | 31% | 0/2 | 1.42–2.46 | Not detected | 1.87 | No | High |
| Forceful duration 25 , 28 | 3542 (133) | 2/2 | 2 | Low 1/2↓ | 45% | 0/2 | 0.98–3.31↓ | Not detected | 1.80 | No | Low |
| Vibration 28 , 30 , 37 | 17,717 (467) | 3/3 | 2 | High 2/3↓ | 90%↓ | 0/3 | 0.63–3.42↓ | Not detected | 1.47 | No | Very low |
| Force intensity 28 , 33 , 39 | 6503 (218) | 3/3 | 2 | Low 1/3 | 0% | 0/3 | 1.22–2.79 | Not detected | 1.84 | No | High |
| Pinch gripping 9 , 33 , 37 | 7702 (150) | 3/3 | 2 | High 3/3↓ | 55%↓ | 0/3 | 0.96–3.52↓ | Not detected | 1.84 | No | Very low |
| Computer use 36 | 2262 (56) | 2/2 | 2 | High 1/2 ↓ | 30% | 0/2 | 0.12–0.64 | Not detected | 0.28 | No | Moderate |
| Strain Index 27 , 31 | 1801 (192) | 2/2 | 2 | 0/2 | 17% | 0/2 | 1.09–2.30 | Not detected | 1.58 | No | High |
Note: ↓ indicates a downgrade.
Abbreviations: CI, confidence interval; CTS, carpal tunnel syndrome; HR, hazard ratio.
3.4.2. Repetition and CTS
Repetition was measured using the HAL‐scale, which is a 10‐point scale that rates the repetitiveness of hand use and also accounts for pauses and efforts. 40 The meta‐analysis showed, based on two studies, 28 , 39 that there was high‐quality evidence that high exposure of repetition is significantly associated with an increased rate of the onset of CTS (HR 1.87, 95%CI 1.42–2.46) (Figure 2C).
Figure 2.
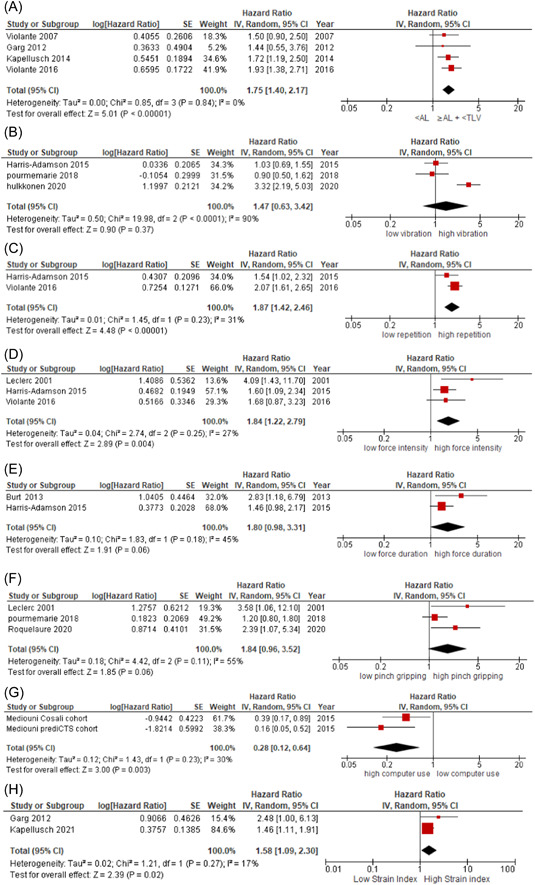
Forest plots of the eight work‐related physical risk factors for developing carpal tunnel syndrome. (A) Forest plot of comparison <Action Limit versus ≥Action limit +< Threshold Limit Value. (B) Forest plot of comparison low vibration versus high vibration. (C) Forest plot of comparison low repetition versus high repetition. (D) Forest plot of comparison low force intensity versus high force intensity. (E) Forest plot of comparison low force duration versus high force duration. (F) Forest plot of comparison low pinch gripping versus high pinch gripping. (G) Forest plot of comparison high computer use versus low computer use. (H) Forest plot of comparison low Strain Index versus high Strain Index. CI, confidence interval; SE, standard error.
3.4.3. Force and CTS
Force was measured using two methods. We made a distinction between force intensity, which measures the actual perceived force, and force duration, which measures the duration of time in forceful exertion. This resulted in two forest plots regarding force and CTS.
Force intensity was measured using the Borg‐10 scale, which estimates an individual's effort, exertion, and breathlessness during physical tasks. 41 The meta‐analysis showed, based on three studies, 28 , 33 , 39 that there was high‐quality evidence that high exposure of force is significantly associated with an increased rate of the onset of CTS (HR 1.84, 95%CI 1.22–2.79) (Figure 2D).
Force duration was measured in percentage of time in forceful exertion. The meta‐analysis showed, based on two studies, 25 , 28 that there was very low‐quality evidence that high exposure of forceful exertion is not significantly associated with an increased rate of the onset of CTS (HR 1.80, 95%CI 0.98–3.31) (Figure 2E).
3.4.4. ACGIH threshold limit values (TLV) and CTS
The ACGIH Threshold Limit Values (TLV) is a method to assess the risk on the overload of the wrists and hands of workers. It combines two parameters: the Hand Activity Level (HAL) and normalized Peak Force (nPF). ACGIH differentiates between three levels of exposure. Below Activity Level (AL) is the lowest level, AL to Threshold Limit Value (TLV) is the intermediate level and above TLV is the highest level. 42 In our meta‐analyse we used <AL as the low exposure and ≥AL + < TLV (intermediate) as the high exposure. The meta‐analysis showed, based on four studies, 27 , 32 , 38 , 39 that there was high‐quality evidence that the high exposure is significantly associated with an increased rate of the onset of CTS (HR 1.75, 95%CI 1.40–2.17) (Figure 2A).
3.4.5. Vibration and CTS
Low exposure was defined as not/lightly using a vibration tool and high exposure was defined as using a vibration tool. The meta‐analysis showed, based on three studies, 28 , 30 , 37 that there was very low‐quality evidence that high exposure of vibration is not significantly associated with an increased rate of the onset of CTS (HR 1.47, 95%CI 0.63–3.42) (Figure 2B).
3.4.6. Pinch gripping and CTS
High exposure was defined as gripping for more than 4 h a day or any pinch grip force. The meta‐analysis showed, based on three studies, 9 , 33 , 37 that there was very low‐quality evidence that high exposure of pinch gripping is not significantly associated with an increased rate of the onset of CTS (HR 1.84, 95%CI 0.96–3.52) (Figure 2F).
3.4.7. Computer/keyboard use and CTS
Low exposure was defined as never or almost never using a computer and high exposure was defined as using a computer all or almost all day. The meta‐analysis showed, based on one study with two cohorts, 35 that there was moderate‐quality evidence that high exposure of computer use is significantly associated with a decreased rate of the onset of CTS (HR 0.28, 95%CI 0.12–0.64) (Figure 2G).
3.4.8. The Strain Index (SI) and CTS
The SI is an index that assesses the physical exposure of the distal upper extremities based on frequency, duration, intensity and hand/wrist posture. 43 Kappellusch et al. 31 defined the high exposure as SI > 10 and Garg et al. 27 defined the high exposure as SI > 6.1 This meta‐analysis showed that there was high‐quality evidence that high exposure of SI is significantly associated with an increased rate of the onset of CTS (HR 1.58, 95% CI 1.09–2.30) (Figure 2H).
3.4.9. Wrist bending posture and CTS
Roquelaure et al. measured the wrist bending posture as time spent in wrist bending. They differentiated three levels of exposure: low (0 h a day), moderate (2–4 h a day) and high (more than 4 h a day). 9 The moderate exposure had an HR of 1.61 with 95% CI of 0.79–3.29 and the high exposure had an HR of 1.63 with 95% CI of 0.70–3.78 (Table 1). Harris‐Adamson et al. 28 measured the wrist bending posture as percentage of time spent in ≥30°wrist flexion or extension. The high exposure of flexion (>1%) had an HR of 0.87 with 95% CI of 0.59–1.29 and the high exposure of extension (>5%) had an HR of 0.83 with 95% CI of 0.60–1.15 (Appendix 2).
4. DISCUSSION
4.1. Main findings
This systematic review with meta‐analyses showed high certainty for a significantly increased rate of CTS due to force duration (71%), force intensity (47%) and repetition (64%). Workers that perform tasks requiring both force and repetition even have an 80% higher rate of developing CTS, as seen in the meta‐analysis for the ACGIH Threshold Limit Values, again with high certainty. We found a significantly increased rate of CTS due to the Strain Index (45%). No associations for hand‐arm vibration and pinch‐gripping with CTS were found, with low‐quality certainty. No associations were also found for wrist bending due to contradictory outcomes of the two included studies. Computer use was found to reduce the risk of work‐related CTS with 72% with moderate‐quality certainty. However, in the current study low exposure was defined as never or almost never using a computer and high exposure as using a computer all or almost all day. Therefore, the reference group might be a high‐risk CTS group performing work characterized by high exposure to force and repetition. Future studies on CTS and computer use are needed that compare high versus low exposure to computer use in terms of posture, repetition, and force, for instance comparing all‐day data entry jobs with other types of office work having more variability and thereby less exposure to computer use.
Although Barcenilla et al., 19 reporting about a meta‐analysis on CTS and occupation, did find a significant association for vibration, our meta‐analysis did not show sufficient evidence for this association. A possible explanation is that we included studies with a lower risk of bias in our meta‐analysis. In general, our conclusion is in line with the study of Kozak et al., 20 which is an overview of systematic reviews. In their meta‐analysis they also concluded that in current high‐quality primary studies vibration is not an independent risk factor of CTS. In line with our results, Barcenilla et al. 19 also found a significant association between force and repetition and the incidence of CTS. For both risk factors, they reported higher risks estimates than we found: for force OR = 4.23 (95% CI 1.53–11.68) versus our HR = 1.84 (95% CI 1.22–2.79) and for repetition OR = 2.26 (95% CI 1.73–2.94) versus our HR = 1.87 (95% CI 1.42–2.46). This could also be due to the fact that we only used prospective cohort studies, while Barcenilla et al. 19 also included cross‐sectional studies. Furthermore, our meta‐analysis showed a significant association between the ACGIH Threshold Limit Values and CTS. This finding confirmed and strengthened the evidence as reported in the study of Kozak et al. 20 The RR they reported was 1.54 (95% CI 1.02–2.31), which is lower than our HR of 1.75 (95% CI 1.40–2.17).
Two previous studies 44 , 45 reviewed the association between computer use and CTS. While those two studies did not find an association between computer use and CTS, our meta‐analysis showed a reduced risk of CTS and computer use at work, possibly due to the fact that low‐level hand‐activity is a protective factor.
Lastly, our systematic review assessed whether pinch gripping and the Strain Index are risk factors for CTS. We did find a significant association between the Strain Index and an increased rate of CTS, and did not for pinch gripping.
4.2. Methodological considerations
The strength of this review is that we only included prospective cohort studies, as these designs are the preferred evidence for inferring causality. In addition, we performed a meta‐analysis and used GRADE for the assessment of the certainty of evidence. Our systematic review solely included prospective cohort studies and used GRADE to determine the certainty of evidence and therefore has high accuracy and precision.
Another strength is that CTS had to be clinically assessed. All the studies used the same set of symptoms (tingling, weakness and numbness in the thumb, index finger, middle finger, and on the radial side of the ring finger) to diagnose CTS. Some studies did also require NCS in the diagnosis of CTS. We did not find a difference in risk estimates for studies using NCS versus those that did not. A proper clinical assessment is important to secure an accurate risk estimation because self‐assessment of CTS could lead to an overestimation of the hazard ratios and the risk factors involved.
A limitation of our review is that five studies did not perform a (blinded) observation to assess exposure. Instead, they conducted an interview or collected information on exposure using a questionnaire. This is an important source of recall bias and possibly overestimation of exposure.
4.3. Awareness and prevention
Despite the available evidence of high certainty about work‐related physical risk factors for CTS, there still might be a lack of awareness in clinical care for prevention. The study of Yagev et al. 46 on the recognition of occupational risk factors by clinicians showed that in 60% of the cases the clinician did not ask about the patient's job, and even when the job was mentioned, no further assessment was made regarding the specific tasks and activities in the job. In addition, fewer than 10% of the patients were referred to an occupational physician for further evaluation. The awareness of all clinicians is required for optimal patient care and to help the patient to promote preventative measures at work. Also in teaching, attention should be given to the importance of work as a possible etiological risk factor for the development of CTS and enhance communication among various medical disciplines and active referral of patients who are at risk at work. 46
5. CONCLUSION
This systematic review of prospective cohort studies found high certainty for an increased rate of CTS due to a high Strain Index, exposures exceeding the Activity Level of the ACGIH, and high force intensity and high repetition. Workers performing tasks requiring both high force and high repetition even have a higher rate of developing CTS. Therefore, we recommend to develop and implement preventive measures, especially for these two risk factors and to evaluate which measures best reduce the incidence of CTS.
AUTHOR CONTRIBUTIONS
Awa Hassan: Formal analysis; visualization; writing – original draft. Annechien Beumer: Conceptualization; writing – review & editing. P. Paul F. M. Kuijer: Conceptualization; Writing – review & editing. Henk F. Molen: Conceptualization; supervision; writing – review & editing.
TRANSPARENCY STATEMENT
The lead author Henk F. van der Molen affirms that this manuscript is an honest, accurate, and transparent account of the study being reported; that no important aspects of the study have been omitted; and that any discrepancies from the study as planned (and, if relevant, registered) have been explained.
ACKNOWLEDGEMENTS
We would like to thank the UVA translation agency for proofreading our manuscript. Awa Hassan affirms that this manuscript is an honest, accurate, and transparent account of the study being reported; that no important aspects of the study have been omitted; and that any discrepancies from the study as planned (and, if relevant, registered) have been explained. The work submitted to Health Science Reports has been done in accordance to Wiley's Best Practice Guidelines on Publishing Ethics and is has been performed in an ethical and responsible way, with no research misconduct, which includes, but is not limited to data fabrication and falsification, plagiarism, image manipulation, unethical research, biased reporting, authorship abuse, redundant or duplicate publication, and undeclared conflicts of interest. All authors have read and approved the final version of the manuscript had full access to all of the data in this study and takes complete responsibility for the integrity of the data and the accuracy of the data analysis.
APPENDIX 1.
See Table A1.
Table A1.
Search strategy in Pubmed and Embase
| Pubmed | ((“occupational disease*“[MeSH Terms]) OR (“occupational disease*“[Title/Abstract]) OR (“risk factor*“[MeSH Terms]) OR (“risk factor*“[Title/Abstract]) OR (“work‐related”[Title/Abstract]) OR (“worker*“[Title/Abstract]) OR (“physical load”[Title/Abstract]) OR (“occupational exposure*“[Title/Abstract]) OR (“occupational exposure*“[MeSH Terms])) AND ((“carpal tunnel syndrome”[Title/Abstract]) OR (“Median neuropathy”[MeSH Terms]) OR (“carpal tunnel syndrome”[MeSH Terms]) OR (“Median neuropathy”[Title/Abstract])) |
| Embase | ((occupational disease* or risk factor* or work‐related or physical load or occupational risk factor* or occupational exposure*). af) AND ((carpal tunnel syndrome or median neuropathy). af.) |
APPENDIX 2.
See Table A2.
Table A2.
Study characteristics of the included studies
| Author (reference) | Study population | County | Female (%) | Follow‐up | Outcome assessment | Exposure assessment | Risk factor High versus No or Low exposure | Incidence of CTS | Hazard ratio (95%CI) |
|---|---|---|---|---|---|---|---|---|---|
| ACGIH Threshold Limit Values (TLV) | |||||||||
| Kapellusch 32 | Full‐time male and female study participants aged ≥18 and employed by 54 predominantly manufacturing and service companies located in 10 US states (N = 2751) | United States | 1400 (51%) | 2001–2010 | Clinically assessed with NCS | Blinded observation by walk‐through |
< AL ≥AL + < TLV ≥TLV |
90/1522 40/512 50/717 |
1.00 a 1.73 (1.19–2.50) 1.48 (1.02–2.13) |
| Violante 39 | Workers enrolled in the study were full‐time employees of seven industrial (tiles, small appliance, large appliances, garment, and shoes – two companies – manufacturing) and service organizations (N = 3131) | Italy | Unknown | 2000–2011 | Clinically assessed with NCS | Observation by trained professionals (with videotapes whenever possible) |
< AL ≥AL + < TLV ≥TLV |
51 36 39 Only cases reported |
1.00 a 1.93 (1.38–2.71) 1.95 (1.27–3.00) |
| Bonfiglioli 24 | A heterogeneous dynamic cohort of persons employed in one of six selected factories [producing large (N = 1) and small (N = 1) domes‐tic appliances, underwear (N = 1), ceramic tiles (N = 1) and shoes (N = 2)] and workers employed in all municipal nursery schools of Bologna (N = 2194). | Italy | 1349 (61.5%) | 2000–2003 | Clinically assessed with NCS | Blinded walk‐through inspection by trained professionals |
< AL ≥AL + < TLV ≥TLV |
34/1235 24/518 26/442 |
Incident rate ratio 1.00 a 1.95 (1.21–3.16) 2.70 (1.48–4.91) |
| Burt 25 | Three worksites: a hospital, a school bus manufacturing plant, and an engine assembly plant. (N = 347) | United States | 146 (42.1%) | 2‐year follow‐up | Clinically assessed with NCS | Observation on‐site and videotaped |
< AL ≥AL + < TLV ≥TLV |
5/102 1/10 23/235 |
1.00 2.16 (0.23–20.51)* 2.10 (0.78–5.70)* |
| Violante 38 | A heterogeneous dynamic cohort of persons employed in one of six selected factories [producing large (N = 1) and small (N = 1) domes‐tic appliances, underwear (N = 1), ceramic tiles (N = 1) and shoes (N = 2)] and workers employed in all municipal nursery schools of Bologna (N = 2092) | Italy | 1356 (64.8%) | 1‐year follow‐up | Clinically assessed without NCS | Preliminary walk‐through surveys |
< AL ≥AL + < TLV ≥TLV |
63/1009 25/333 65/418 |
1.00 1.50 (0.90–2.50) 3.00 (2.00–4.50) |
| Garg 27 | Workers were recruited from 10 diverse production facilities. Workers at these facilities performed a variety of operations including: (i) poultry processing, (ii) manufacturing and assembly of animal laboratory testing equipment, (iii) small engine manufacturing and assembly, (iv) small electric motor manufacturing and assembly, (v) commercial lighting assembly and warehousing, (vi) electrical generator manufacturing and assembly, (vii) metal automotive engine parts manufacturing and (viii) plastic and rubber automotive engine parts manufacturing and assembly (N = 429) | Unites States |
272 63.4% |
6‐year follow‐up | Clinically assessed with NCS | Observation by trained professionals (with videotapes whenever possible) and interviews |
< AL ≥AL + < TLV ≥TLV |
7/98 12/160 16/171 |
1.00a 1.44 (0.55–3.76) 2.01 (0.80–5.04) |
| Repetition | |||||||||
| Dale 26 | The study cohort consisted of pooled data from six prospective studies. Participants were full‐time employees, 18 years of age or older, who performed hand‐intensive activities, and were employed in industries such as manufacturing, production, service and construction (N = 2393) | United States | 1249 (52.2%) | 2.8‐year follow‐up | Clinically assessed with NCS | Observations and measurements at the worksite by trained observers and detailed video analysis of the worker performing their tasks |
HAL < 4.5 HAL > 4.5 |
Not given |
1.00b 1.28 (0.90–1.83) |
| Harris‐Adamson 29 | Participants in four different prospective studies were at least 18 years of age (N = 1605) | United States | 717 (45.0%) | 3.5‐year follow‐up | Clinically assessed with NCS | Blinded trained analyst's observation of each participant performing his/her usual work tasks, measurement of hand forces, weights of tools, force matching required to complete each task, videotape analysis, and interviews |
HAL ≤ 4.4 HAL > 4.4 |
41 49 Only cases reported |
1.00 b 1.90 (1.17–3.10) |
| Harris‐Adamson 28 | The pooled study cohort consisted of data from five research groups. Participants in all studies were at least 18 years of age (N = 3214) | United States | 1274 (39.6%) | 6.5‐year follow‐up | Clinically assessed with NCS | Videotape analysis, interviews, and measurements |
HAL ≤ 4 HAL > 4 ‐ ≤5.3 HAL > 5.3 |
59 48 57 Only cases reported |
1.00 b 1.54 (1.02–2.32) 1.32 (0.87–2.02) |
| Violante 39 | Workers enrolled in the study were full‐time employees of seven industrial (tiles, small appliance, large appliances, garment, and shoes – two companies – manufacturing) and service organizations (N = 3131) | Italy | Unknown | 2000–2011 | Clinically assessed with NCS | Observation (with videotapes whenever possible) and was complemented, where available, by standard production times and data by a team of trained professionals |
HAL 1.0–3.0 HAL 3.1–5.0 HAL 5.1–8.5 |
44 60 22 Only cases reported |
1.00 a 2.06 (1.61–2.65) 2.06 (1.37–3.09) |
| Force duration | |||||||||
| Burt 25 | Three worksites were selected: a hospital, a school bus manufacturing plant, and an engine assembly plant. (N = 347) | United States | 146 (42.1%) | 2‐year follow‐up | Clinically assessed with NCS | Observation on‐site and videotaped |
Force duration <20% ≥20% to <60% >60% |
10/216 14/112 5/13 |
1.00 2.83 (1.18–6.79) 9.57 (5.96–64.24) |
| Dale 26 | The study cohort consisted of pooled data from six prospective studies. Participants were full‐time employees, 18 years of age or older, who performed hand‐intensive activities, and were employed in industries such as manufacturing, production, service and construction (N = 2393) | United States | 1249 (52,2%) | 2.8‐year follow‐up | Clinically assessed with NCS | Observations and measurements at the worksite by trained observers and detailed video analysis of the worker performing their tasks |
Force duration <16.38% >16.38% |
Not given |
1.00b 1.74 (1.38–2.20) |
| Harris‐Adamson 28 | The pooled study cohort consisted of data from five research groups. Participants in all studies were at least 18 years of age, employed at a company where some workers performed hand‐intensive activities (N = 3214) | United States | 1274 (39.6%) | 6.5‐year follow‐up | Clinically assessed with NCS | Videotape analysis, interviews, and measurements |
Force duration ≤11% >11% to ≤32% >32% |
56 53 57 Only cases reported |
1.00 b 1.46 (0.98–2.17) 2.05 (1.34–3.15) |
| Harris‐Adamson 29 | Participants in four different prospective studies were at least 18 years of age (N = 1605) | United States | 717 (45.0%) | 3.5‐year follow‐up | Clinically assessed with NCS | Blinded trained analyst's observation of each participant performing his/her usual work tasks, measurement of hand forces, weights of tools, force matching required to complete each task, videotape analysis and interviews |
Force duration ≤11% >11% ‐ ≤32% >32% |
56 53 57 Only cases reported |
1.00 b 1.46 (0.98‐2.17) 2.05 (1.34–3.15) |
| Hand‐arm vibration | |||||||||
| Hulkkonen 30 | The study population consisted of the Northern Finland Birth Cohort of 1966 (NFBC1966) who were working ≥3 days a week in a paid job and answered the postal questionnaire on work‐related factors (N = 6326) | Finland | 3066 (48.5%) | 31‐year follow‐up | Clinically assessed without NCS | Questionnaire |
None or light Moderate or high |
185/5858 30/468 |
1.00 c 3.32 (2.19–5.03) |
| Pourmemari 37 | A representative sample of men and women aged 30 years or older living in Finland between the fall 2000 and spring 2001 was recruited using a two stage cluster sampling design (N = 6177) | Finland | 3353 (54.3%) | 11‐year follow‐up | Clinically assessed without NCS | Interviews |
No vibration tools Using vibration tools |
103/5489 10/589 |
1.00 c 0.90 (0.5–1.90) |
| Nathan 36 | A group of Portland, Oregon, area industrial workers first examined in 1984 (N = 471) | United States | 188 (40.0%) | 1984–2001 | Clinically assessed with NCS | Observation of job tasks |
No vibration tools Using vibration tools |
Not given |
Odds ratio 1.00 2.15 (not given) p‐value = 0.33 |
| Harris‐Adamson 28 | The pooled study cohort consisted of data from five research groups. Participants in all studies were at least 18 years of age, employed at a company where some workers performed hand‐intensive activities (N = 3214) | United States | 1274 (39.6%) | 6.5‐year follow‐up | Clinically assessed with NCS | Videotape analysis, interviews, and measurements |
No vibration tools Using vibration tools |
82 57 Only cases reported |
1.00 b 1.04 (0.69–1.55) |
| Force intensity | |||||||||
| Dale 26 | The study cohort consisted of pooled data from six prospective studies. Participants were full‐time employees, 18 years of age or older, who performed hand‐intensive activities, and were employed in industries such as manufacturing, production, service and construction (N = 2393) | United States | 1249 (52,2%) | 2.8‐year follow‐up | Clinically assessed with NCS | Observations and measurements at the worksite by trained observers and detailed video analysis of the worker performing their tasks |
Borg CR‐10 scale ≤3 >3 |
Not given |
1.00 b 1.38 (1.06–1.80) |
| Harris‐Adamson 28 | The pooled study cohort consisted of data from five research groups. Participants in all studies were at least 18 years of age, employed at a company where some workers performed hand‐intensive activities (N = 3214) | United States | 1274 (39.6%) | 6.5‐year follow‐up | Clinically assessed with NCS | Videotape analysis, interviews and measurements |
Borg CR‐10 scale ≤2.5 >2.5 to ≤4 >4 |
49 65 39 Only cases reported |
1.00 b 1.59 (1.09–2.34) 2.17 (1.38–3.43) |
| Harris‐Adamson 29 | Participants in four different prospective studies were at least 18 years of age (N = 1605) | United States | 717 (45.0%) | 3.5‐year follow‐up | Clinically assessed with NCS | Blinded trained analyst's observation of each participant performing his/her usual work tasks, measurement of hand forces, weights of tools, force matching required to complete each task, videotape analysis, and interviews |
Borg CR‐10 scale ≤3 >3 |
42 37 Only cases reported |
1.00 b 1.38 (0.85–2.26) |
| Violante 39 | Workers enrolled in the study were full‐time employees of seven industrial (tiles, small appliance, large appliances, garment and shoes – two companies – manufacturing) and service organizations (N = 3131) | Italy | Unknown | 2000‐2011 | Clinically assessed with NCS | Observation by trained professionals (with videotapes whenever possible) |
Borg CR‐10 scale 1.0‐3.0 3.1‐5.0 5.1‐7.0 |
18 86 22 Only cases reported |
1.00 a 1.68 (0.87–3.23) 2.62 (1.63–4.21) |
| Leclerc 33 | Workers were exposed to repetitive work in one of the following five activity sectors: (i) assembly line in the manufacture of small electrical appliances, motor vehicle accessories, or ski accessories (packaging excluded), (ii) clothing and shoe industry (packaging excluded), (iii) food industry (mainly, meat industry), packaging excluded, (iv) packaging (primarily in the food industry), (v) supermarket cashiering (N = 158) | France | Only men were included | 3‐year follow‐up | Clinically assessed without NCS | Questionnaire |
No Yes |
Not given |
Odds ratio 1.00 4.09 (1.43–11.70) |
| Lund 34 | a cohort of Danish citizens born 1940–1979 (18–80 year‐olds) within 30 different jobs (N = 1,015,418) | Denmark | 583,370 (57.5%) | 1992–2015 | Clinically assessed without NCS | Measurements of movements and position of the wrist using representative whole day electro‐gonio‐metrical measurement |
Mean power frequency, Hz <0.001 ≤− <0.23 0.23 ≤− 0.24 0.24 ≤− 0.27 0.27 ≤− 0.29 0.29 ≤− 0.45 |
897 1117 1068 1941 1811 Only cases reported |
Incident rate ratio 1.00 a 0.78 (0.72–0.86) 1.51 (1.37–1.66) 1.33 (1.23–1.44) 1.83 (1.68–1.98) |
| Wrist bending posture | |||||||||
| Roquelaure 9 | A large sample of workers in the French Pays de la Loire (N = 1367) | France | 563 (41.2%) | 5‐year follow‐up | Clinically assessed without NCS | A self‐administered questionnaire |
Never 2–4 h a day >4 h a day |
20/678 13/278 8/169 |
1.00 1.61 (0.79–3.29)* 1.63 (0.70–3.78)* |
| Harris‐Adamson 28 | The pooled study cohort consisted of data from five research groups. Participants in all studies were at least 18 years of age, employed at a company where some workers performed hand‐intensive activities (N = 3214) | United States | 1274 (39.6%) | 6.5‐year follow‐up | Clinically assessed with NCS | Videotape analysis, interviews, and measurements |
Time≥30°wrist extension: ≤5% >5% Time≥30°wrist flexion: ≤1% >1% |
Only cases reported 88 65 83 70 |
1.00 b 0.87 (0.59–1.29) 1.00 b 0.83 (0.60–1.15) |
| Holding tools/objects in a pinch grip | |||||||||
| Roquelaure 9 | A large sample of workers in the French Pays de la Loire (N = 1367) | France | 563 (41.2%) | 5‐year follow‐up | Clinically assessed without NCS | A self‐administered questionnaire |
Never pinch gripping 2–4 h a day >4 h a day |
31/958 6/147 8/108 |
1.00 1.27 (0.52–3.10)* 2.39 (1.07–5.34)* |
| Pourmemari 37 | A representative sample of men and women aged 30 years or older living in Finland between the fall 2000 and spring 2001 was recruited using a two‐stage cluster sampling design (N = 6177) | Finland | 3353 (54.3%) | 11‐year follow‐up | Clinically assessed without NCS | Interviews |
Not pinch gripping Pinch gripping |
76/4305 37/1767 |
1.00 c 1.20 (0.80–1.90) |
| Leclerc 33 | Workers were exposed to work in one of the following five activity sectors: (i) assembly line in the manufacture of small electrical appliances, motor vehicle accessories, or ski accessories (packaging excluded), (ii) clothing and shoe industry (packaging excluded), (iii) food industry (mainly, meat industry), packaging excluded, (iv) packaging (primarily in the food industry), (v) supermarket cashiering (N = 158) | France | Only men were included | 3‐year follow‐up | Clinically assessed without NCS | Questionnaire |
Not pinch gripping Pinch gripping |
Not given |
Odds ratio: 1.00 3.59 (1.06–12.10) |
| Computer/keyboard use | |||||||||
| Mediouni 35 |
The Cosali cohort: Workers from the Loire Valley area of West Central France. This area represents 5.6% of the French workforce (N = 1551) |
France | 658 (42.4%) | 2007–2010 | Clinically assessed without NCS | A self‐administered questionnaire |
Never/almost never <2 h a day 2–4 h a day All/almost all day |
22/611 5/234 1/219 8/482 |
1.00 a 0.60 (0.22–1.63) 0.13 (0.02–1.01) 0.39 (0.17–0.89) |
| The prediCTS cohort: Newly employed workers from eight companies and three construction trade unions in the St Louis region of the USA (N = 711) | United States | 253 (35.6%) | 2007–2011 | Clinically assessed with NCS | Job exposure matrix |
Never/almost never <2 h a day 2–4 h a day All/almost all day |
23/355 2/77 1/52 3/202 |
1.00 a 0.38 (0.09–1.67) 0.20 (0.03–1.62) 0.16 (0.05–0.59) |
|
| Nathan 36 | A group of Portland, Oregon, area industrial workers first examined in 1984 (N = 471) | United States | 188 (40.0%) | 1984–2001 | Clinically assessed with NCS | Observation of job tasks |
≤1 h a day >1 h a day |
Not given |
Odds ratio: 1.00 0.81 (not given) p‐value = 0.39 |
| Revised Strain Index (RSI) | |||||||||
| Kapellusch 31 | Participants were recruited among voluntary workers performing diverse jobs in different industries (N = 1372) | United States | 798 (58.2%) | 2.5‐year follow‐up | Clinically assessed with NCS | Blinded videotape analysis, interviews, and task measurements |
RSI ≤ 10 RSI > 10 |
68/674 89/698 |
1.00d 1.45 (1.11–1.91) |
| Garg 27 | Workers were recruited from 10 diverse production facilities. Workers at these facilities performed a variety of operations including: (i) poultry processing, (ii) manufacturing and assembly of animal laboratory testing equipment, (iii) small engine manufacturing and assembly, (iv) small electric motor manufacturing and assembly, (v) commercial lighting assembly and warehousing, (vi) electrical generator manufacturing and assembly, (vii) metal automotive engine parts manufacturing and (viii) plastic and rubber automotive engine parts manufacturing and assembly (N = 429) | United States |
272 63.4% |
6‐year follow‐up | Clinically assessed with NCS | Observation by trained professionals (with videotapes whenever possible) and interviews |
RSI ≤ 6.1 RSI > 6.1 |
6/121 29/308 |
1.00a 2.48 (1.00–6.13) |
Abbreviations: CI, confidence interval; CTS, carpal tunnel syndrome; NCS, nerve conduction studies.
Hassan A, Beumer A, Kuijer PPFM, van der Molen HF. Work‐relatedness of carpal tunnel syndrome: systematic review including meta‐analysis and GRADE. Health Sci Rep. 2022;5:e888. 10.1002/hsr2.888
DATA AVAILABILITY STATEMENT
The data that supports the findings of this study are available in the supplementary material of this article.
REFERENCES
- 1. Kothari MJ. Carpal tunnel syndrome: Clinical manifestations and diagnosis. Upto Date, July 17. Accessed October 29, 2021. Available from https://www.uptodate.com/contents/carpal-tunnel-syndrome-clinical-manifestations-and-diagnosis/contributor-disclosure
- 2. Faust K, Jennings CDCarpal tunnel syndrome. OrthoInfo, July, 2016. Accessed October 29, 2021. Available from https://orthoinfo.aaos.org/en/diseases--conditions/carpal-tunnel-syndrome
- 3. Geoghegan JM, Clark DI, Bainbridge LC, Smith C, Hubbard R. Risk factors in carpal tunnel syndrome. J Hand Surg Br. 2004;29(4):315‐320. [DOI] [PubMed] [Google Scholar]
- 4. Ablove RH, Ablove TS. Prevalence of carpal tunnel syndrome in pregnant women. WMJ. 2009;108(4):194‐196. [PubMed] [Google Scholar]
- 5. Vashishtha M, Varghese B, Mosley F, Kadakia A, de Jager W. Screening for thyroid dysfunction and diabetes in patients with carpal tunnel syndrome. Surgeon. 2016;14(3):147‐149. [DOI] [PubMed] [Google Scholar]
- 6. Ferry S, Hannaford P, Warskyj M, Lewis M, Croft P. Carpal tunnel syndrome: a nested case‐control study of risk factors in women. Am J Epidemiol. 2000;151(6):566‐574. [DOI] [PubMed] [Google Scholar]
- 7. Kaplan Y, Kurt SG, Karaer H. Carpal tunnel syndrome in postmenopausal women. J Neurol Sci. 2008;270(1‐2):77‐81. [DOI] [PubMed] [Google Scholar]
- 8. Mansfield M, Thacker M, Sandford F. Psychosocial risk factors and the association with carpal tunnel syndrome: a systematic review. Hand (N Y). 2018;13(5):501‐508. [DOI] [PMC free article] [PubMed] [Google Scholar]
- 9. Roquelaure Y, Garlantézec R, Evanoff BA, Descatha A, Fassier JB, Bodin J. Personal, biomechanical, psychosocial, and organizational risk factors for carpal tunnel syndrome: a structural equation modeling approach. Pain. 2020;161(4):749‐757. [DOI] [PubMed] [Google Scholar]
- 10. Kao SY. Carpal tunnel syndrome as an occupational disease. J Am Board Fam Pract. 2003;16(6):533‐542. [DOI] [PubMed] [Google Scholar]
- 11. Luckhaupt SE, Dahlhamer JM, Ward BW, Sweeney MH, Sestito JP, Calvert GM. Prevalence and work‐relatedness of carpal tunnel syndrome in the working population, United States, 2010 national health interview survey. Am J Ind Med. 2013;56(6):615‐624. [DOI] [PMC free article] [PubMed] [Google Scholar]
- 12. Newington L, Stevens M, Warwick D, Adams J, Walker‐Bone K. Sickness absence after carpal tunnel release: a systematic review of the literature. Scand J Work Environ Health. 2018;44(6):557‐567. [DOI] [PMC free article] [PubMed] [Google Scholar]
- 13. Shahid S. The Economic Costs of Carpal Tunnel Syndrome in the Workplace. Accessed on December 9, 2021. https://www.linkedin.com/pulse/economic-costs-carpal-tunnel-syndrome-workplace-shahriar-shahid
- 14. Roquelaure Y, Ha C, Fouquet N, et al. Attributable risk of carpal tunnel syndrome in the general population: implications for intervention programs in the workplace. Scand J Work Environ Health. 2009;35(5):342‐348. [DOI] [PMC free article] [PubMed] [Google Scholar]
- 15. Werner RA, Andary M. Carpal tunnel syndrome: pathophysiology and clinical neurophysiology. Clin Neurophysiol. 2002;113(9):1373‐1381. [DOI] [PubMed] [Google Scholar]
- 16. Aboonq MS. Pathophysiology of carpal tunnel syndrome. Neurosciences (Riyadh). 2015;20(1):4‐9. [PMC free article] [PubMed] [Google Scholar]
- 17.American Academy of Orthopaedic Surgeon Management of Carpal Tunnel Syndrome Evidence‐Based Clinical Practice Guideline. February 29, 2016. Accessed on April 8, 2022. https://www.aaos.org/globalassets/quality-and-practice-resources/carpal-tunnel/cts-cpg_4-25-19.pdf [DOI] [PubMed]
- 18. van Rijn RM, Huisstede BM, Koes BW, Burdorf A. Associations between work‐related factors and the carpal tunnel syndrome–a systematic review. Scand J Work Environ Health. 2009;35(1):19‐36. [DOI] [PubMed] [Google Scholar]
- 19. Barcenilla A, March LM, Chen JS, Sambrook PN. Carpal tunnel syndrome and it's relationship to occupation: a meta‐analysis. Rheumatology. 2012;51(2):250‐261. [DOI] [PubMed] [Google Scholar]
- 20. Kozak A, Schedlbauer G, Wirth T, Euler U, Westermann C, Nienhaus A. Association between work‐related biomechanical risk factors and the occurrence of carpal tunnel syndrome: an overview of systematic reviews and a meta‐analysis of current research. BMC Musculoskelet Disord. 2015;16:231. [DOI] [PMC free article] [PubMed] [Google Scholar]
- 21. Moher D, Liberati A, Tetzlaff J, Altman DG. Preferred reporting items for systematic reviews and meta‐analyses: the PRISMA statement. BMJ. 2009;339:b2535. [DOI] [PMC free article] [PubMed] [Google Scholar]
- 22. Hayden JA, van der Windt DA, Cartwright JL, Côté P, Bombardier C. Assessing bias in studies of prognostic factors. Ann Intern Med. 2013;158(4):280‐286. [DOI] [PubMed] [Google Scholar]
- 23. Huguet A, Hayden JA, Stinson J, et al. Judging the quality of evidence in reviews of prognostic factor research: adapting the GRADE framework. Syst Rev. 2013;2:71. [DOI] [PMC free article] [PubMed] [Google Scholar]
- 24. Bonfiglioli R, Mattioli S, Armstrong TJ, et al. Validation of the ACGIH TLV for hand activity level in the OCTOPUS cohort: a two‐year longitudinal study of carpal tunnel syndrome. Scand J Work Environ Health. 2013;39(2):155‐163. [DOI] [PubMed] [Google Scholar]
- 25. Burt S, Deddens JA, Crombie K, Jin Y, Wurzelbacher S, Ramsey J. A prospective study of carpal tunnel syndrome: workplace and individual risk factors. Occup Environ Med. 2013;70(8):568‐574. [DOI] [PMC free article] [PubMed] [Google Scholar]
- 26. Dale AM, Ekenga CC, Buckner‐Petty S, et al. Incident CTS in a large pooled cohort study: associations obtained by a job exposure matrix versus associations obtained from observed exposures. Occup Environ Med. 2018;75(7):501‐506. [DOI] [PMC free article] [PubMed] [Google Scholar]
- 27. Garg A, Kapellusch J, Hegmann K, et al. The Strain Index (SI) and threshold limit value (TLV) for hand activity level (HAL): risk of carpal tunnel syndrome (CTS) in a prospective cohort. Ergonomics. 2012;55(4):396‐414. [DOI] [PubMed] [Google Scholar]
- 28. Harris‐Adamson C, Eisen EA, Kapellusch J, et al. Biomechanical risk factors for carpal tunnel syndrome: a pooled study of 2474 workers. Occup Environ Med. 2015;72(1):33‐41. [DOI] [PMC free article] [PubMed] [Google Scholar]
- 29. Harris‐Adamson C, Eisen EA, Neophytou A, et al. Biomechanical and psychosocial exposures are independent risk factors for carpal tunnel syndrome: assessment of confounding using causal diagrams. Occup Environ Med. 2016;73(11):727‐734. [DOI] [PMC free article] [PubMed] [Google Scholar]
- 30. Hulkkonen S, Shiri R, Auvinen J, Miettunen J, Karppinen J, Ryhänen J. Risk factors of hospitalization for carpal tunnel syndrome among the general working population. Scand J Work Environ Health. 2020;46(1):43‐49. [DOI] [PubMed] [Google Scholar]
- 31. Kapellusch JM, Bao SS, Malloy EJ, Thiese MS, Merryweather AS, Hegmann KT. Validation of the revised strain index for predicting risk of incident carpal tunnel syndrome in a prospective cohort. Ergonomics. 2021;1‐10. [DOI] [PubMed] [Google Scholar]
- 32. Kapellusch JM, Gerr FE, Malloy EJ, et al. Exposure‐response relationships for the ACGIH threshold limit value for hand‐activity level: results from a pooled data study of carpal tunnel syndrome. Scand J Work Environ Health. 2014;40(6):610‐620. [DOI] [PMC free article] [PubMed] [Google Scholar]
- 33. Leclerc A, Landre MF, Chastang JF, Niedhammer I, Roquelaure Y. Study group on repetitive work. upper‐limb disorders in repetitive work. Scand J Work Environ Health. 2001;27(4):268‐278. [DOI] [PubMed] [Google Scholar]
- 34. Lund CB, Mikkelsen S, Thygesen LC, Hansson GÅ, Thomsen JF. Movements of the wrist and the risk of carpal tunnel syndrome: a nationwide cohort study using objective exposure measurements. Occup Environ Med. 2019;76(8):519‐526. [DOI] [PMC free article] [PubMed] [Google Scholar]
- 35. Mediouni Z, Bodin J, Dale AM, et al. Carpal tunnel syndrome and computer exposure at work in two large complementary cohorts. BMJ Open. 2015;5(9):e008156. [DOI] [PMC free article] [PubMed] [Google Scholar]
- 36. Nathan PA, Istvan JA, Meadows KD. A longitudinal study of predictors of research‐defined carpal tunnel syndrome in industrial workers: findings at 17 years. J Hand Surg Br. 2005;30(6):593‐598. [DOI] [PubMed] [Google Scholar]
- 37. Pourmemari MH, Heliövaara M, Viikari‐Juntura E, Shiri R. Carpal tunnel release: lifetime prevalence, annual incidence, and risk factors. Muscle Nerve. 2018;58(4):497‐502. [DOI] [PubMed] [Google Scholar]
- 38. Violante FS, Armstrong TJ, Fiorentini C, et al. Carpal tunnel syndrome and manual work: a longitudinal study. J Occup Environ Med. 2007;49(11):1189‐1196. [DOI] [PubMed] [Google Scholar]
- 39. Violante FS, Farioli A, Graziosi F, et al. Carpal tunnel syndrome and manual work: the OCTOPUS cohort, results of a ten‐year longitudinal study. Scand J Work Environ Health. 2016;42(4):280‐290. [DOI] [PubMed] [Google Scholar]
- 40. Latko WA, Armstrong TJ, Foulke JA, Herrin GD, Rabourn RA, Ulin SS. Development and evaluation of an observational method for assessing repetition in hand tasks. Am Ind Hyg Assoc J. 1997;58(4):278‐285. [DOI] [PubMed] [Google Scholar]
- 41.Physiopedia contributors. Borg Rating Of Perceived Exertion [Internet]. Physiopedia, Sep 27, 2020. Accessed October 26, 2021. Available from https://www.physio-pedia.com/index.php?title=Borg_Rating_Of_Perceived_Exertion%26oldid=251587
- 42. Yung M, Dale AM, Kapellusch J, et al. Modeling the Effect of the 2018 Revised ACGIH® Hand Activity Threshold Limit Value® (TLV) at Reducing Risk for Carpal Tunnel Syndrome. J Occup Environ Hyg. 2019;16:628‐633. [DOI] [PMC free article] [PubMed] [Google Scholar]
- 43. Garg A, Moore JS, Kapellusch JM. The revised strain index: an improved upper extremity exposure assessment model. Ergonomics. 2017;60(7):912‐922. [DOI] [PubMed] [Google Scholar]
- 44. Mediouni Z, de Roquemaurel A, Dumontier C, et al. Is carpal tunnel syndrome related to computer exposure at work? A review and meta‐analysis. J Occup Environ Med. 2014;56:204‐208. [DOI] [PubMed] [Google Scholar]
- 45. Thomsen JF, Gerr F, Atroshi I. Carpal tunnel syndrome and the use of computer mouse and keyboard: a systematic review. BMC Musculoskelet Disord. 2008;9:134. [DOI] [PMC free article] [PubMed] [Google Scholar]
- 46. Yagev Y, Gringolds M, Karakis I, Carel RS. Carpal tunnel syndrome: under‐recognition of occupational risk factors by clinicians. Ind Health. 2007;45(6):820‐822. [DOI] [PubMed] [Google Scholar]
Associated Data
This section collects any data citations, data availability statements, or supplementary materials included in this article.
Data Availability Statement
The data that supports the findings of this study are available in the supplementary material of this article.