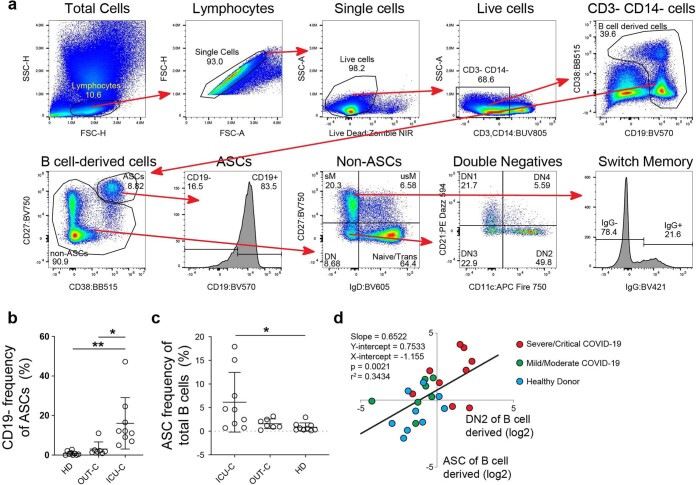
Extended Data Fig. 1. EF B cell activation in COVID-19.
(a–d) PBMCs were isolated from HD (n = 9), OUT-C (n = 7), or ICU-C (n = 10) patients and analyzed by spectral flow cytometry. (a) Progressive gating strategy for flow cytometry. Label above plot indicated pre-gating population from previous plot. (b) CD19- ASC frequency of total ASCs. (c) ASC frequency of total B cell-derived cells. (d) Linear regression analysis of log2-transformed DN2 vs ASC frequencies of total B cell-derived cells. (b, c) Statistical significance was determined using ANOVA with Tukey’s multiple-comparisons testing between all groups. *P ≤ 0.05; **P ≤ 0.01; ***P ≤ 0.001.

