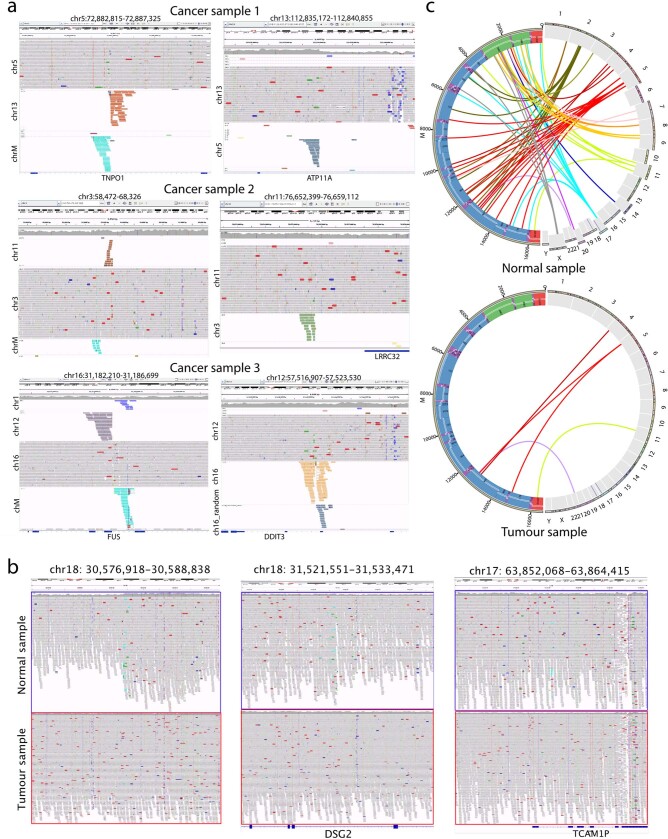
Extended Data Fig. 7. Examples of IGV alignment of NUMTs.
a. Examples of IGV alignment of tumour-specific NUMTs coupled with other translocation variations in the nuclear genome. Teal bars indicate the aligned reads which mapped to the nuclear DNA where their mates mapped to the mtDNA. Other non-grey colour bars indicate the aligned reads which mapped to one nuclear chromosome where their mates mapped to a different nuclear chromosome. For example, Cancer sample 1 had one NUMT (teal bars) on chromosome 5 and another translocation variation between chromosome 5 and chromosome 13 (orange bars) in the same region (left). The same translocation variation was also seen on chromosome 13 (right). The aligned reads mapped to chromosome 13 where their mates mapped to chromosome 5 (steel blue bars). b. An example of IGV alignment of tumour lost NUMTs. IGV screenshots show the aligned reads corresponding to the lost NUMTs in one breast tumour sample. Teal bars indicate the aligned reads which mapped to the nuclear DNA where their mates mapped to the mtDNA. NUMTs only present in the matched normal sample but not in the tumour sample, with the average sequencing depth of tumour sample (128x) was more than three-times deeper than the matched normal sample (40x). c. Cirocs plot illustrates an example of lost NUMT in a haematological tumour sample. The links represent all NUMTs detected in either normal sample or tumour sample. The tumour sample lost many NUMTs across the whole genome, with the average sequencing depth of tumour sample (116x) was more than twice deeper than the matched normal sample (40x).

