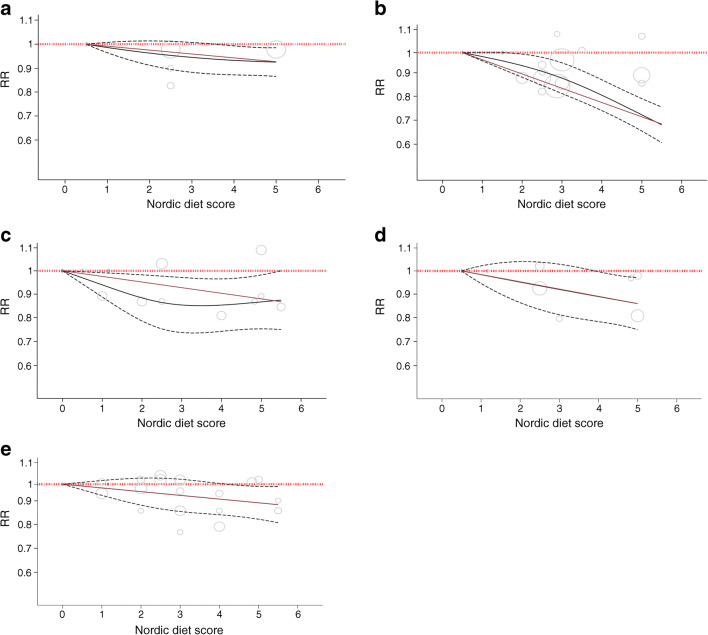
Fig. 3.
Dose–response relation between the Nordic diet score and (a) incidence of CVD (RRper-diet-score 0.98 [95% CI 0.97, 0.99], plinear<0.001, pdeparture-from-linearity=0.60), (b) CVD mortality (RRper-diet-score 0.94 [95% CI 0.93, 0.96], plinear<0.001, pdeparture-from-linearity=0.11), (c) incidence of CHD (RRper-diet-score 0.98 [95% CI 0.96, 0.99], plinear<0.001, pdeparture-from-linearity=0.13), (d) incidence of stroke (RRper-diet-score 0.97 [95% CI 0.95, 0.99], plinear<0.001, pdeparture-from-linearity=0.97) and (e) incidence of type 2 diabetes (RRper-diet-score 0.97 [95% CI 0.95, 0.99], plinear<0.001, pdeparture-from-linearity=1.00). The red lines represent the linear models and the black lines represent the non-linear models. The dotted lines represent the 95% CIs for the non-linear models

