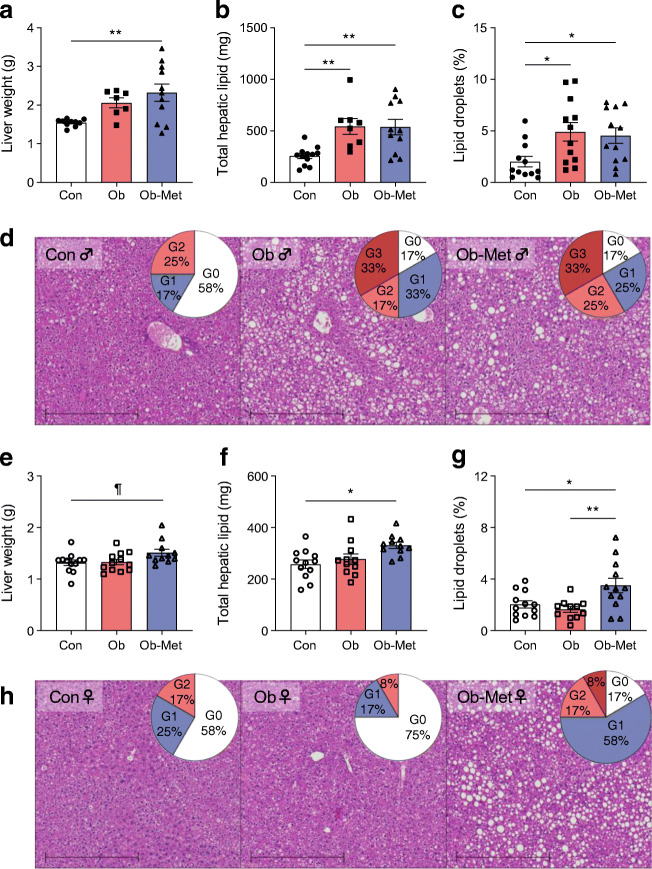
Fig. 5.
Hepatic lipid accumulation in 12-month-old mouse offspring. (a, b, e, f) Fasted liver weight (a, e) and corresponding total hepatic lipid content as assessed by Folch assay (b, f) in male (a, b) and female (e, f) offspring (n=11 or 12 independent litters per group except for n=7 or 8 male Ob offspring). (c, d, g, h) Area density of lipid droplets in H&E-stained liver tissue (c, g) with representative images (d, h) of male (c, d) and female (g, h) offspring (n=11 or 12 independent litters per group). Scale bar, 500 μm. Pie charts show percentages of pathological scoring for hepatic steatosis: white, G0 (grade 0, absent); blue, G1 (grade 1, mild); light red, G2 (grade 2, moderate); dark red, G3 (grade 3, severe). Outliers were excluded from (a) for male Con offspring (ROUT method, 2.04 g and 1.08 g) and male Ob offspring (ROUT method, 3.9 g). An outlier was excluded from (g) for female Ob offspring (ROUT method, outlier excluded value 5.03%). *p<0.05 or **p<0.01; ¶0.05<p<0.10 (one-way ANOVA with Tukey’s multiple comparison test). Closed symbols, male offspring; open symbols, female offspring

