

Abstract
The air quality in Upper Northern Thailand (UNT) deteriorates during seasonal vegetation fire events, causing adverse effects especially on respiratory health outcomes. This study aimed to quantitatively estimate respiratory morbidity from vegetation fire smoke exposure, and to assess the impact of a burning ban enforced in 2016 on morbidity burden in UNT. We computed daily population exposure to fire-originated PM10 and estimated its health burden during a 5-year period from 2014 to 2018 using daily fire-originated PM10 concentration and the concentration–response function for short-term exposure to PM10 from vegetation fire smoke and respiratory morbidity. In subgroups classified as children and older adults, the health burden of respiratory morbidity was estimated using specific effect coefficients from previous studies conducted in UNT. Finally, we compared the health burden of respiratory morbidity before and after burning ban enforcement. Approximately 130,000 hospital visits for respiratory diseases were estimated to be attributable to fire-originated PM10 in UNT from 2014 to 2018. This estimation accounted for 1.3% of total hospital visits for respiratory diseases during the 5-year period, and 20% of those during burning events. Age-specific estimates revealed a larger impact of PM10 in the older adult group. The number of hospital visits for respiratory diseases attributable to fire-originated PM10 decreased from 1.8% to 0.5% after the burning ban policy was implemented in the area. Our findings suggest that PM10 released from vegetation fires is a health burden in UNT. The prohibition of the burning using regulatory measure had a positive impact on respiratory morbidity in this area.
Subject terms: Public health, Environmental impact
Introduction
Vegetation fire events, including forest fires, grass fires, and open field burning for agricultural practices and plantation management, are significant sources of air pollution in many Southeast Asian (SEA) countries1,2. Due to proximity to the equatorial Pacific Ocean, smoke haze events in these countries are worsened by drought conditions during the El Nino phenomenon3. Smoke haze events have frequently observed in the maritime SEA region, including Indonesia, Malaysia, and Singapore since 19974. Recently, Mainland Southeast Asia (MSEA), which covers the continental land area (i.e., Vietnam, Laos, Cambodia, Myanmar, and upper northern Thailand), has also suffered from local and transboundary air pollution due to vegetation fires5.
In Thailand, smoke haze from vegetation fires is a common occurrence across Upper Northern Thailand (UNT) during dry seasons (January to April). Fires are mostly used to clear vegetation to collect non-timber forest products (i.e., mushroom and bamboo shoot)6. Forests represent the predominant burned area in UNT7. In order to address this problem, the government has implemented several control measures in UNT since 2004. However, seasonal smoke haze continues affect the area. In 2016, a prohibition of burning using National Reserved Forest Act was enforced with the strict penalties8. A previous study reported that the ban led to decreased burning activities, fewer satellite-fire hotspots, and lower PM10 concentrations in the area9.
Previous epidemiological studies have shown that exposure to air pollution emitted from vegetation fires is associated with respiratory health outcomes10–25. Despite the growing epidemiological evidence, few studies estimated the health burden of vegetation fire smoke exposure. One study estimated that more than 300,000 premature deaths are attributable to exposure to PM emitted from vegetation fires, with the highest number of deaths occurring in sub-Saharan Africa and Southeast Asia26. In Southeast Asia, some studies assessed the health burden of vegetation fire smoke in the Maritime region27–32.
To date, no study has quantified the health burden of air pollutants from vegetation fires in MSEA, where the sources of vegetation fires differ from other areas (i.e., peatland fire in Maritime SEA). The present study aimed to quantitatively estimate the number of hospital visits for respiratory diseases attributable to short-term exposure to PM10 from vegetation fires in UNT.
Results
Hospital visits for respiratory diseases in UNT
From 2014 to 2018, there were roughly 2 million hospital visits for respiratory diseases annually (Table 1). Nearly half of these visits were made by children, and 15% by older adults. The daily average of total hospital visits for respiratory diseases decreased after the enforcement of the 2016 burning ban for a 5-year period and burning days.
Table 1.
Summary of hospital visits for respiratory diseases in UNT during 2014–2018.
| 2014 | 2015 | 2016 | 2017 | 2018 | 2014–2018 | |
|---|---|---|---|---|---|---|
| 5-years period | ||||||
| Total count | 1,834,682 | 2,124,322 | 2,377,088 | 2,184,780 | 1,925,402 | 10,446,274 |
| Daily average | 689 | 728 | 807 | 743 | 690 | 731 |
| Children (%) | 49.2 | 50.4 | 50.3 | 48.6 | 47.0 | 49.2 |
| Older adults (%) | 14.5 | 14.1 | 14.7 | 16.4 | 17.5 | 15.4 |
| Burning days | ||||||
| Total count | 173,396 | 158,019 | 207,756 | 51,524 | 61,717 | 652,412 |
| Daily average | 788 | 802 | 802 | 661 | 726 | 756 |
| Children (%) | 43.9 | 45.3 | 47.2 | 44.0 | 41.8 | 45.1 |
| Older adults (%) | 15.3 | 14.9 | 15.6 | 17.8 | 18.7 | 15.8 |
Fire-originated and background PM10
Daily average fire-originated PM10 concentrations ranged from 58.7 to 171.9 μg/m3 across the eight provinces in UNT (mean: 106.5 μg/m3), and the numbers of burning days ranged from 64 days (Lamphun) to 122 days (Lampang) (Fig. 1). The daily average background concentration ranged from 21.3 μg/m3 to 30.4 μg/m3 (mean: 23.2 μg/m3, which was lower than almost one fifth of the average fire-originated PM10 concentration) (Fig. 2). The average fire-originated PM10 concentration and the average number of burning days decreased after burning ban enforcement from 114.6 to 94.5 μg/m3 and 233 to 82 days, respectively (Table 2).
Figure 1.

Average fire-originated PM10 concentration (μg/m3) and total number of burning days. Map was generated using the package “raster”46 and “tmap”47 of R (version 4.1.3, The R Foundation for Statistical Computing, Vienna, Austria).
Figure 2.
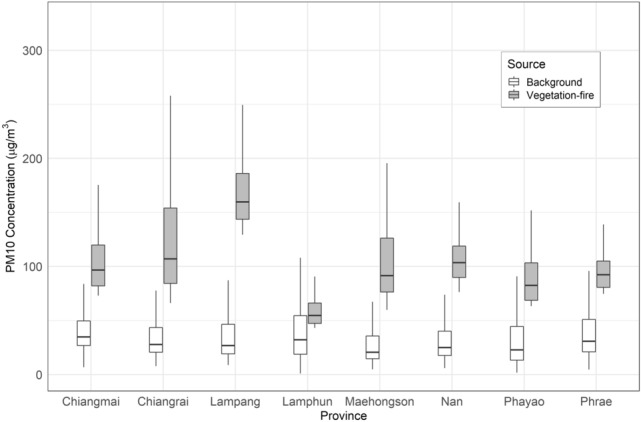
Boxplot of background and vegetation-fire-originated PM10 concentration.
Table 2.
Fire-originated PM10 concentration and estimated number of hospital visits attributable to fire-originated PM10 during 2014–2018 for eight provinces.
| Variables | Study period (year) | Burning ban enforcement (annual average) | ||||||
|---|---|---|---|---|---|---|---|---|
| 2014 | 2015 | 2016 | 2017 | 2018 | 2014–2018 | Before (2014–2016) | After (2017–2018) | |
| Environmental variables | ||||||||
| Total number of burning days | 244 | 197 | 259 | 78 | 85 | 863 | 233.3 | 81.5 |
| Average population weighted fire-originated PM10 | 115 | 120.7 | 108.2 | 98.5 | 90.4 | 106.6 | 114.6 | 94.5 |
| Number of attributable cases and uncertainty range (thousand) | ||||||||
| All ages | 36.6 | 35.9 | 40.5 | 9.4 | 10.5 | 132.9 | 37.6 | 9.9 |
| (23.2–48.6) | (22.9–47.3) | (25.6–54.0) | (5.9–12.5) | (6.6–14.0) | (84.2–176.5) | (24.0–50.0) | (6.3–13.3) | |
| Children | 7.7 | 7.9 | 9.3 | 1.9 | 2.0 | 28.9 | 8.3 | 2.0 |
| (0.9–13.9) | (0.9–14.1) | (1.1–16.6) | (0.2–3.4) | (0.2–3.7) | (3.4–51.7) | (1.0–14.9) | (0.2–3.6) | |
| Older adults | 5.9 | 5.6 | 6.7 | 1.8 | 2.1 | 22.2 | 6.1 | 2.0 |
| (2.1–9.0) | (2.0–8.4) | (2.4–10.2) | (0.6–2.8) | (0.7–3.2) | (8.1 -33.7) | (2.2–9.2) | (0.7–3.0) | |
| Proportion of attributable cases for 5-years period (%) | ||||||||
| All ages | 2.0 | 1.7 | 1.7 | 0.4 | 0.5 | 1.3 | 1.8 | 0.5 |
| Children | 0.9 | 0.7 | 0.8 | 0.2 | 0.2 | 0.6 | 0.8 | 0.2 |
| Older adults | 2.2 | 1.9 | 1.9 | 0.5 | 0.6 | 1.4 | 2.0 | 0.6 |
| Proportion of attributable cases for burning days (%) | ||||||||
| All ages | 21.1 | 22.7 | 19.5 | 18.2 | 17.0 | 20.3 | 21.0 | 17.6 |
| Children | 10.2 | 11.1 | 9.5 | 8.4 | 7.9 | 9.4 | 10.2 | 8.2 |
| Older adults | 22.4 | 23.9 | 20.6 | 20.1 | 18.4 | 21.1 | 22.1 | 19.2 |
Hospital visits for respiratory diseases attributed to fire-originated PM10
The estimated number of hospital visits for respiratory diseases attributable to fire-originated PM10 for all ages throughout the study period was 132,923 (Table 2). One third of these hospital visits were made by vulnerable groups (children: 28,937 visits, older adults: 22,207 visits). This estimation of total attributable cases accounted for approximately 1.3% of total hospital visits for respiratory diseases during the 5-year period and 20.3% during burning days. The proportion of hospital visits attributable to fire-originated PM10 was greater in older adults (1.4%) than in children (0.6%). The incidence rate of attributable cases for all ages and in vulnerable groups by province-year are shown in Fig. 3 and Supplementary Figures (S2 and S3). We observed the largest incidence rates in Lampang (4,244 cases per 100,000 persons for 5-year period) (Fig. 3).
Figure 3.

Incidence rates of annual total hospital visits for respiratory diseases attributable to fire-originated PM10 for all ages during 2014–2018 by province. Map was generated using the package “raster”46 and “tmap”47 of R (version 4.1.3, The R Foundation for Statistical Computing, Vienna, Austria).
Impact of a vegetations fire events ban on hospital visits for respiratory diseases
After burning ban enforcement in 2016, the annual average number of hospital visits for respiratory diseases attributable to fire-originated PM10 decreased from 37,682 to 9944 (approximately 70% reduction from the pre-intervention period) (Table 2), which is consistent with the decrease in the total number of hospital visits during burning days (Table 1). The proportion of total attributable cases for 5-year period decreased by 1.3% (from 1.8% to 0.5%). Simultaneously, the proportion of attributable cases also decreased by 0.6% and 1.4% for children and older adults, respectively, after burning ban enforcement in the area. The decrease in the proportion of attributable cases during burning days (− 3.4%) was greater than that during the 5-year period (− 1.3%) for all ages after ban enforcement.
Sensitivity results
The sensitivity analysis using a lower cut-off concentration (50 μg/m3) of fire-originated PM10 revealed that 2.4% and 12.6% of total hospital visits for respiratory diseases were attributable to fire-originated PM10 during the 5-year period and burning days, respectively (Table S1).
Discussion
The population-weighted daily average concentration of PM10 from vegetation fires across UNT during 2014–2018 was 106.5 μg/m3 (range: 58.7–171.9 μg/m3). In general, fire-originated PM10 concentrations was lower after burning ban enforcement in 2016.
Despite the growing concern about air pollution caused by vegetation fire events, its far-reaching health effects are often ignored. The present study showed that exposure to particles emitted from vegetation fire events throughout UNT poses health risks, such as increased respiratory morbidity, with 132,923 hospital visits (1.3% of total) being attributed to fire-originated PM10 for all ages. Moreover, approximately one-third of these visits occurred in vulnerable groups. We found that Lampang, which was the province with the highest PM10 concentration from fire events, had the highest incidence rate of attributable cases among UNT region. The number of hospital visits for respiratory diseases attributable to PM10 decreased after burning ban enforcement.
Only a few studies have estimated the health burden of exposure to air pollution from vegetation fire events, particularly in terms of morbidity. Previously studies mainly addressed mortality on a global scale or in the equatorial Southeast Asian region26–29,31–35. Some studies used morbidity as a health outcome, such as a study in Australia which examined hospitalization for cardiovascular disease and asthma36, and another that targeted respiratory diseases in the United States37. While the impact of long-term exposure to particles from all sources in Thailand has been reported38, no study has estimated morbidity impacts of short-term exposure to particles emitted from vegetation fire events in MSEA. The study estimated the number of health burden attributable to fire-originated PM10 is needed because air pollution from these events has continuously affected people in UNT and it may be useful for further policy making.
Quantifying the health burden of air pollution exposure due to vegetation burning may be useful from a policy-making perspective. We observed decreases in fire-originated PM10 concentration, number of burning days, and number of hospital visits for respiratory diseases attributable to PM10 after burning ban enforcement. These findings are consistent with previous reports that PM10 concentrations in the area have decreased since the enforcement of the burning ban policy9. While the policy may have helped reduce toxic components of particles emitted from burning activities, such as carbonaceous aerosols (black and organic carbon), Polycyclic Aromatic Hydrocarbons (PAHs), and levoglucosan39, it does not appear to offer sustainable measures against smoke haze events. In fact, we observed increases in fire-originated PM10 concentration as well as the number of hospital visits attributable to PM10 in 2018 (i.e., after ban enforcement).
In addition to the policy, global climate factors may have influenced PM10 emission from vegetation fires. The strong El Nino phenomenon was observed during 2015–2016, resulting in dry conditions, followed by La Nina events (i.e., wet climate) in 201740. During the study period, we estimated the highest number of hospital visits for respiratory diseases attributable to fire-originated PM10 to be approximately 40,000 during the time of strong El Nino (2015–2016). A previous study also estimated a high global health burden attributable to particles released from burning sources due to the influence of El Nino41.
There are some limitations to this study. In exposure assessment, we estimated the health burden of PM10 exposure using PM10 concentrations derived from ambient air pollution monitoring data, which may not have accurately reflected actual individual exposure. The inaccurate number of hospital visits for respiratory diseases attributable to fire-originated PM10 may be caused from several stages of health burden estimation (i.e., exposure assessment and applying of concentration response function). To identify burning days, we used a cut-point reported in a previous study for the occurrence of intensive fires. PM10 concentrations on the remaining days (i.e., non-burning days) were averaged as the background concentration, but small burning events might have occurred during non-burning days, contributing to the estimated background concentration. However, the background PM10 concentration did not differ from PM10 concentrations reported for non-burning months (May-December) in a previous study20.
According to the WHO guideline, the concentration of daily PM10 should not exceeded 50 μg/m3. We thus performed a sensitivity analysis by changing the cut-point from 100 μg/m3 to 50 μg/m3 in order to capture more burning events, and to lower the average fire-originated PM10 concentration as compared to the principal analysis. The proportions of estimated hospital visits during the 5-year period did not significantly differ between principal and sensitivity analyses, but the proportion during burning days was smaller when using the WHO guideline concentration. These results suggest that using the guideline concentration, which has been set based on ambient air particles, may lead to underestimation.
Despite these limitations, the present study has the following strengths. We used effect coefficients obtained from epidemiological studies that conducted with the same health outcomes in UNT. This might have helped reduce the uncertainty of health burden estimation attributable to fire-originated PM10 because the same factors were considered such as health care system, vegetation fire particle compositions, and behavioral responses to the smoke haze of people in this area. Another strength is that we estimated the number of hospital visits for respiratory diseases attributable to fire-originated PM10 in vulnerable groups. We found a larger impact of short-term exposure to fire-originated PM10 among older adults. With the increasing aging population, this study highlights the need to address the effect of burning events on the health of older people. Our findings may help prepare for and implement preventive measures against smoke haze risk in vulnerable populations.
Conclusion
Short-term exposure to PM10 emitted from vegetation fire events was associated with approximately 130,000 hospital visits for respiratory diseases in UNT during a 5-year period. In particular, the estimated number of hospital visits attributable to PM10 was high among older adults. These findings may be useful for further advancing policy-making regarding haze control and overall health and socioeconomic consequences. Moreover, our results suggest that regulatory actions on vegetation fire events had a positive impact on hospital visits for respiratory diseases in UNT.
Methods
Identification of burning days and estimation of fire-originated PM10
Hourly data of PM10 concentration were obtained from 14 air quality monitoring stations in eight provinces of UNT (Chiangrai, Chiangmai, Lampang, Lamphun, Maehongson, Nan, Phayao, and Phrea), provided by the Pollution Control Department of Thailand, from January 2014 to December 2018. Daily averages were estimated when 75% daily records were available (at least 18 valid hourly records). Initially, we calculated the population weighted PM10 concentration to refine exposure estimation, as shown in the following equation Eq. (1).
| 1 |
where is the PM10 concentration, is the population of district i (in each province), and is the total population of each province42. The population data of each district was retrieved from Gridded Population of the World, version 443.
We estimated the fire-originated PM10 concentration by subtracting background PM10 concentration from daily average PM10 concentration on burning days:
| 2 |
In this step, we identified burning days based on criteria described in a previous study25. Briefly, a burning day was identified when the number of satellite fire hotspots exceeded the 90th percentile of the daily distribution in the entire region (10 counts) and the daily PM10 concentration in each province was greater than 100 μg/m3. The fire hotspot data was obtained from the National Aeronautics and Space Administration Land, Atmosphere Near real-time Capability for Earth observing system (NASA-LANCE) for Fire Information for Resource Management System (FIRMS)44. In this study, individual fire hotpots with lower confidence values (< 20%) were excluded from the analyses to obtain the precise burning point. Moreover, the cut-point of PM10 concentration (> 100 μg/m3) was selected based on the previous study findings23. The background concentration was derived by averaging the estimated daily PM10 concentrations after adjusting for day-of-week (DOW) and seasonal patterns on non-burning days (fire hotspot = 0). Adjustments for temporal trends were performed by using a natural cubic spline of time with 5 degrees of freedom (df) per year and DOW (Supplementary Figure S1). We changed df of time from 4 to 6 to check the robustness. The minimal adequate model was chosen by the Akaike Information Criterion and ANOVA tests.
Concentration–response function and morbidity burden assessment
We estimated the number of hospital visits for respiratory diseases attributable to PM10 for all ages and vulnerable groups (children and older adults) in each province. Data were obtained from the Ministry of Public Health of Thailand for each province and included demographic information (sex and age), date of visit, and International Classification of Disease codes for diagnosis (ICD10: J00-J99). We estimated the number of hospital visits for respiratory diseases attributable to fire-originated PM10 between January 2014 and December 2018 using methods described previously33.
| 3 |
where RR is the relative risk of daily average fire-originated PM10 concentration on burning days for each province. Among few epidemiological studies conducted in this region20,25,45, we used the coefficient derived from Mueller and colleagues because the subjects included in this study are truly represented the population in this area20. Specifically, Mueller and colleagues reported the risk of hospital visits for respiratory diseases to be 1.020 (95% CI: 1.012, 1.028) per 10 μg/m3 increase in PM10 for all ages. Accordingly, was calculated as In(1.020) per 10 μg/m3. The same estimation method was used to calculate the health burden in vulnerable groups, that is, children under age 15 (1.009 (95% CI: 1.001, 1.017) for the risk of hospital visits for respiratory diseases)25 and older adults aged ≥ 65 years (1.021 (95% CI: 1.007, 1.035) for the risk of outpatient visits for chronic lower respiratory diseases)20.
The number of daily hospital visits for respiratory diseases attributable to fire-originated PM10 in each province was calculated using the following equation:
| 4 |
where HV is the daily number of hospital visits for respiratory diseases. The fraction of risk function (RR-1)/RR is defined as the population attributable fraction (PAF), which measures the disease burden attributable to a risk from exposure to fire-originated PM10. We summed number of the attributable cases by year and province. The proportion of attributable cases was estimated from the number of attributable cases divided by the total number of cases in each year and age group. We also calculated the incidence rate of the attributable cases for each province using the population data in 2015 derived from the National Statistical Office of Thailand.
Finally, we performed a sensitivity analysis to address the uncertainty of health burden estimation. We estimated the health burden by changing the cut-point for burning days from 100 μg/m3 to 50 μg/m3 according to the WHO guideline for daily PM10 concentration in order to capture lower concentration exposure that could affect health outcomes.
Ethical considerations
This study was exempt from ethical approval by the Ethics Committee of Kyoto University Graduate School of Engineering (No. 201904), since only secondary and aggregated data were used in the analyses.
Supplementary Information
Acknowledgements
We thank the Ministry of Public Health, the Pollution Control Department of the Ministry of Natural Resources and Environment. We would also like to acknowledge LANCE FIRMS, operated by NASA’s Earth Science Data and Information System (ESDIS), for permission to use their data and imagery, with funding provided by NASA Headquarters.
Author contributions
The concept of this study was conceived by A.U. and K.U.. A.U. contributed to data collection and management. Data analysis and initial draft of manuscript was carried out by A.U. and K.U.. All authors contributed to provide edits of the manuscript.
Funding
This research was performed by the Environment Research and Technology Development Fund S-20 (JPMEER21S12020) of the Environmental Restoration and Conservation Agency Provided by the Ministry of Environment of Japan.
Data availability
The data that support the findings of this study are available from Permanent Secretary Ministry of Public Health Thailand but restrictions apply to the availability of these data, which were used under license for the current study, and so are not publicly available. Data are however available from the authors upon reasonable request and with permission of Permanent Secretary Ministry of Public Health Thailand.
Competing interests
The authors declare no competing interests.
Footnotes
Publisher's note
Springer Nature remains neutral with regard to jurisdictional claims in published maps and institutional affiliations.
Supplementary Information
The online version contains supplementary material available at 10.1038/s41598-022-23388-2.
References
- 1.Vadrevu KP, et al. Trends in vegetation fires in South and Southeast Asian Countries. Atmos. Environ. 2019;9:7422. doi: 10.1038/s41598-019-43940-x. [DOI] [PMC free article] [PubMed] [Google Scholar]
- 2.Vongruang P, Pimonsree S. Biomass burning sources and their contributions to PM10 concentrations over countries in mainland Southeast Asia during a smog episode. Atmos. Environ. 2020;228:117414. doi: 10.1016/j.atmosenv.2020.117414. [DOI] [Google Scholar]
- 3.Fuller DO, Murphy K. The enso-fire dynamic in insular Southeast Asia. Clim. Change. 2006;74:435–455. doi: 10.1007/s10584-006-0432-5. [DOI] [Google Scholar]
- 4.Jones DS. ASEAN and transboundary haze pollution in Southeast Asia. Asia. Europe J. 2006;4:431–446. doi: 10.1007/s10308-006-0067-1. [DOI] [Google Scholar]
- 5.Yin S, et al. Influence of biomass burning on local air pollution in mainland Southeast Asia from 2001 to 2016. Environ. Pollut. 2019;254:112949. doi: 10.1016/j.envpol.2019.07.117. [DOI] [PubMed] [Google Scholar]
- 6.Forest Fire Control Department. Forest Fire Description, https://www.dnp.go.th/forestfire/Eng/description.htm (2003).
- 7.Boonman T, Garivait S. An inventory of air pollutant emissions from biomass open burning in thailand using MODIS burned area product (MCD45A1) J. Sustain. Energy Environ. 2014;5:85–94. [Google Scholar]
- 8.The office of the council of state. National Reserved Forests Act, https://www.rinya.maff.go.jp/j/riyou/goho/kunibetu/tha/tha-kokuyuurin-en.pdf (2016).
- 9.Yabueng N, Wiriya W, Chantara S. Influence of zero-burning policy and climate phenomena on ambient PM2.5 patterns and PAHs inhalation cancer risk during episodes of smoke haze in Northern Thailand. Atmos. Environ. 2020;232:117485. doi: 10.1016/j.atmosenv.2020.117485. [DOI] [Google Scholar]
- 10.Chakrabarti S, Khan MT, Kishore A, Roy D, Scott SP. Risk of acute respiratory infection from crop burning in India: Estimating disease burden and economic welfare from satellite and national health survey data for 250 000 persons. Int. J. Epidemiol. 2019;48:1113–1124. doi: 10.1093/ije/dyz022. [DOI] [PMC free article] [PubMed] [Google Scholar]
- 11.DeFlorio-Barker S, Crooks J, Reyes J, Rappold AG. Cardiopulmonary effects of fine particulate matter exposure among older adults, during wildfire and non-wildfire periods, in the United States 2008–2010. Environ. Health Perspect. 2019;127:37006. doi: 10.1289/EHP3860. [DOI] [PMC free article] [PubMed] [Google Scholar]
- 12.Gan RW, et al. Comparison of wildfire smoke estimation methods and associations with cardiopulmonary-related hospital admissions. Geohealth. 2017;1:122–136. doi: 10.1002/2017GH000073. [DOI] [PMC free article] [PubMed] [Google Scholar]
- 13.Gupta S. Agriculture crop residue burning and its consequences on respiration health of school-going children. Glob. Pediatr. Health. 2019 doi: 10.1177/2333794X19874679. [DOI] [PMC free article] [PubMed] [Google Scholar]
- 14.Haikerwal A, et al. Fine particulate matter (PM25) exposure during a prolonged wildfire period and emergency department visits for asthma. Respirology. 2016;21:88–94. doi: 10.1111/resp.12613. [DOI] [PubMed] [Google Scholar]
- 15.Henderson SB, Brauer M, Macnab YC, Kennedy SM. Three measures of forest fire smoke exposure and their associations with respiratory and cardiovascular health outcomes in a population-based cohort. Environ. Health Perspect. 2011;119:1266–1271. doi: 10.1289/ehp.1002288. [DOI] [PMC free article] [PubMed] [Google Scholar]
- 16.Hutchinson JA, et al. The San Diego 2007 wildfires and Medi-Cal emergency department presentations, inpatient hospitalizations, and outpatient visits: An observational study of smoke exposure periods and a bidirectional case-crossover analysis. PLoS Med. 2018;15:e1002601. doi: 10.1371/journal.pmed.1002601. [DOI] [PMC free article] [PubMed] [Google Scholar]
- 17.Kunzli N, et al. Health effects of the 2003 Southern California wildfires on children. Am. J. Respir. Crit. Care Med. 2006;174:1221–1228. doi: 10.1164/rccm.200604-519OC. [DOI] [PMC free article] [PubMed] [Google Scholar]
- 18.Liu JC, et al. Wildfire-specific fine particulate matter and risk of hospital admissions in urban and rural counties. Epidemiology. 2017;28:77–85. doi: 10.1097/EDE.0000000000000556. [DOI] [PMC free article] [PubMed] [Google Scholar]
- 19.Martin KL, Hanigan IC, Morgan GG, Henderson SB, Johnston FH. Air pollution from bushfires and their association with hospital admissions in Sydney, Newcastle and Wollongong, Australia 1994–2007. Aust. N. Z. J. Public Health. 2013;37:238–243. doi: 10.1111/1753-6405.12065. [DOI] [PubMed] [Google Scholar]
- 20.Mueller W, et al. Ambient particulate matter and biomass burning: An ecological time series study of respiratory and cardiovascular hospital visits in northern Thailand. Environ. Health. 2020;19:77. doi: 10.1186/s12940-020-00629-3. [DOI] [PMC free article] [PubMed] [Google Scholar]
- 21.Reid CE, et al. Associations between respiratory health and ozone and fine particulate matter during a wildfire event. Environ. Int. 2019;129:291–298. doi: 10.1016/j.envint.2019.04.033. [DOI] [PubMed] [Google Scholar]
- 22.Reid CE, et al. Differential respiratory health effects from the 2008 northern California wildfires: A spatiotemporal approach. Environ. Res. 2016;150:227–235. doi: 10.1016/j.envres.2016.06.012. [DOI] [PubMed] [Google Scholar]
- 23.Sahani M, et al. A case-crossover analysis of forest fire haze events and mortality in Malaysia. Atmos. Environ. 2014;96:257–265. doi: 10.1016/j.atmosenv.2014.07.043. [DOI] [Google Scholar]
- 24.Stowell JD, et al. Associations of wildfire smoke PM2.5 exposure with cardiorespiratory events in Colorado 2011–2014. Environ. Int. 2019;133:105151. doi: 10.1016/j.envint.2019.105151. [DOI] [PMC free article] [PubMed] [Google Scholar]
- 25.Uttajug A, Ueda K, Oyoshi K, Honda A, Takano H. Association between PM10 from vegetation fire events and hospital visits by children in upper northern Thailand. Sci. Total Environ. 2021;764:142923. doi: 10.1016/j.scitotenv.2020.142923. [DOI] [PubMed] [Google Scholar]
- 26.Johnston FH, et al. Estimated global mortality attributable to smoke from landscape fires. Environ. Health Perspect. 2012;120:695–701. doi: 10.1289/ehp.1104422. [DOI] [PMC free article] [PubMed] [Google Scholar]
- 27.Crippa P, et al. Population exposure to hazardous air quality due to the 2015 fires in equatorial Asia. Sci. Rep. 2016;6:37074. doi: 10.1038/srep37074. [DOI] [PMC free article] [PubMed] [Google Scholar]
- 28.Kiely L, et al. Air quality and health impacts of vegetation and peat fires in equatorial Asia during 2004–2015. Environ. Res. Lett. 2020;15:094054. doi: 10.1088/1748-9326/ab9a6c. [DOI] [Google Scholar]
- 29.Koplitz SN, et al. Public health impacts of the severe haze in equatorial Asia in september–october 2015: Demonstration of a new framework for informing fire management strategies to reduce downwind smoke exposure. Environ. Res. Lett. 2016;11:094023. doi: 10.1088/1748-9326/11/9/094023. [DOI] [Google Scholar]
- 30.Marlier ME, et al. El Nino and health risks from landscape fire emissions in Southeast Asia. Nat. Clim. Chang. 2013;3:131–136. doi: 10.1038/nclimate1658. [DOI] [PMC free article] [PubMed] [Google Scholar]
- 31.Marlier ME, et al. Fires, smoke exposure, and public health: An integrative framework to maximize health benefits from peatland restoration. Geohealth. 2019;3:178–189. doi: 10.1029/2019GH000191. [DOI] [PMC free article] [PubMed] [Google Scholar]
- 32.Uda SK, Hein L, Atmoko D. Assessing the health impacts of peatland fires: A case study for Central Kalimantan Indonesia. Environ. Sci. Pollut. Res. Int. 2019;26:31315–31327. doi: 10.1007/s11356-019-06264-x. [DOI] [PMC free article] [PubMed] [Google Scholar]
- 33.Kollanus V, et al. Mortality due to vegetation fire-originated PM2.5 exposure in Europe-assessment for the years 2005 and 2008. Environ. Health Perspect. 2017;125:30–37. doi: 10.1289/EHP194. [DOI] [PMC free article] [PubMed] [Google Scholar]
- 34.Li C, et al. Multi-pollutant emissions from the burning of major agricultural residues in China and the related health-economic effects. Atmos. Chem. Phys. 2017;17:4957–4988. doi: 10.5194/acp-17-4957-2017. [DOI] [Google Scholar]
- 35.Liu Y, et al. Health impact assessment of PM2.5 attributable mortality from the september 2020 Washington state wildfire smoke episode. MedRxiv. 2020 doi: 10.1101/2020.09.19.20197921. [DOI] [PMC free article] [PubMed] [Google Scholar]
- 36.Borchers-Arriagada N, Palmer AJ, Bowman D, Williamson GJ, Johnston FH. Health impacts of ambient biomass smoke in Tasmania, Australia. Int. J. Environ. Res. Public. Health. 2020 doi: 10.3390/ijerph17093264. [DOI] [PMC free article] [PubMed] [Google Scholar]
- 37.Fann N, et al. The health impacts and economic value of wildland fire episodes in the US: 2008–2012. Sci. Total Environ. 2018;610–611:802–809. doi: 10.1016/j.scitotenv.2017.08.024. [DOI] [PMC free article] [PubMed] [Google Scholar]
- 38.Mueller W, et al. A health impact assessment of long-term exposure to particulate air pollution in Thailand. Environ. Res. Lett. 2021;16:055018. doi: 10.1088/1748-9326/abe3ba. [DOI] [Google Scholar]
- 39.Naeher LP, et al. Woodsmoke health effects: A review. Inhal. Toxicol. 2007;19:67–106. doi: 10.1080/08958370600985875. [DOI] [PubMed] [Google Scholar]
- 40.Turkington T, Timbal B, Rahmat R. The impact of global warming on sea surface temperature based El Niño-Southern oscillation monitoring indices. Int. J. Climatol. 2019;39:1092–1103. doi: 10.1002/joc.5864. [DOI] [Google Scholar]
- 41.Johnston HJ, et al. How harmful is particulate matter emitted from biomass burning? A thailand perspective. Curr. Pollut. Rep. 2019;5:353–377. doi: 10.1007/s40726-019-00125-4. [DOI] [Google Scholar]
- 42.National statistical office Thailand Population and Housing census, http://www.nso.go.th/sites/2014en (2010).
- 43.Center for International Earth Science Information Network–CIESIN–Columbia University. (NASA Socioeconomic Data and Applications Center (SEDAC), Palisades, NY, 2018).
- 44.NASA. MODIS Collection 6 Hotspot/Active Fire Detections MCD14ML distributed from NASA FIRMS, https://earthdata.nasa.gov/firms (2007).
- 45.Pothirat C, et al. Acute effects of air pollutants on daily mortality and hospitalizations due to cardiovascular and respiratory diseases. J Thorac Dis. 2019;11:3070–3083. doi: 10.21037/jtd.2019.07.37. [DOI] [PMC free article] [PubMed] [Google Scholar]
- 46.Robert, J., Hijmans, & van Etten, J., Raster: Geographic analysis and modeling with raster data, http://CRAN.R-project.org/package=raster (2012).
- 47.Tennekes M. tmap: Thematic maps in R. J. Stat. Softw. 2018 doi: 10.18637/jss.v084.i06. [DOI] [Google Scholar]
Associated Data
This section collects any data citations, data availability statements, or supplementary materials included in this article.
Supplementary Materials
Data Availability Statement
The data that support the findings of this study are available from Permanent Secretary Ministry of Public Health Thailand but restrictions apply to the availability of these data, which were used under license for the current study, and so are not publicly available. Data are however available from the authors upon reasonable request and with permission of Permanent Secretary Ministry of Public Health Thailand.