Abstract
PBRM1 is a subunit of the PBAF chromatin remodeling complex that uniquely contains six bromodomains. PBRM1 can operate as a tumor suppressor or tumor promoter. PBRM1 is a tumor promoter in prostate cancer, contributing to migratory and immunosuppressive phenotypes. Selective chemical probes targeting PBRM1 bromodomains are desired to elucidate the association between aberrant PBRM1 chromatin binding and cancer pathogenesis and the contributions of PBRM1 to immunotherapy. Previous PBRM1 inhibitors unselectively bind SMARCA2 and SMARCA4 bromodomains with nanomolar potency. We used our protein-detected NMR screening pipeline to screen 1968 fragments against the second PBRM1 bromodomain, identifying 17 hits with Kd values from 45 μM to >2 mM. Structure–activity relationship studies on the tightest-binding hit resulted in nanomolar inhibitors with selectivity for PBRM1 over SMARCA2 and SMARCA4. These chemical probes inhibit the association of full-length PBRM1 to acetylated histone peptides and selectively inhibit growth of a PBRM1-dependent prostate cancer cell line.
Graphical Abstract
INTRODUCTION
Post-translational modification of histones and other nuclear proteins epigenetically regulates gene expression without altering the underlying genomic sequence. Lysine acetylation is a particularly abundant epigenetic modification with widespread influence over transcription.1 Bromodomains bind acetyl-lysine residues on histone tails and other nuclear proteins to facilitate acetylation-dependent protein–protein interactions. The human genome encodes 61 bromodomains distributed across 46 different proteins.2 Based on similarities in sequence and structure, bromodomains are further divided into eight subfamilies.2 Polybromo-1 (PBRM1) is a member of the bromodomain family VIII.2,3 PBRM1 uniquely contains six consecutive bromodomains.2,3 PBRM1 is a subunit of the PBRM1-BRG1/BRM-associated factors (PBAF) complex, a member of the ATP-dependent SWItch/sucrose nonfermenting (SWI/SNF) chromatin remodeling complex family.3
Bromodomains are implicated in the pathogenesis of various disease states, including cancer,4 inflammation,4,5 autoimmune,4,5 and neurological disorders.6 Canonically, PBRM1 is characterized as a tumor suppressor and gene regulator via the chromatin-targeting function of PBAF.7 To this end, mutations in the PBRM1 gene are frequently observed in cancer, specifically in clear cell renal cell carcinoma (ccRCC),8 suggesting a tumor-suppressive role. However, patients with metastatic ccRCC and loss of PBRM1 gene function show improved response to anti-PD1 cancer immunotherapy compared to patients with PBRM1 gene function intact.9 Also, the expression of T-cell cytotoxicity genes is inversely correlated with PBRM1 expression in many human cancers.9,10 Mice inoculated with Pbrm1-deficient B16F10 tumor cells exhibited delayed tumor growth and extended survival rate after treatment with anti-PD1 cancer immunotherapy.10 PBRM1 is tumor-promoting in prostate cancer, where it increases the expression of antioxidant genes to mitigate oxidative stress and contributes to a migratory and invasive phenotype via expression of genes that regulate the epithelial–mesenchymal transition.11–13 Furthermore, PBRM1 induces immunosuppressive IRF1 target genes in prostate cancer, including those that inhibit the function of cytotoxic T lymphocytes.14 Taken together, PBRM1 inhibitors may be useful clinically for prostate cancer, especially because they have the potential to be used in combination with cancer immunotherapies as sensitizing agents. However, the role of PBRM1 in cancer is context-dependent, which emphasizes the need for selective PBRM1 inhibitors as chemical probes or for further development into clinical candidates.
A few pan-inhibitors of the bromodomain family VIII have been reported. The first chemical probe reported was PFI-3 (1, Figure 1),15,16 developed from a salicylic acid fragment. PFI-3 shows selectivity for family VIII bromodomains and unusual binding mode by displacing structural water molecules, otherwise conserved in other bromodomains. Other inhibitors targeting the fifth bromodomain of PBRM1 (PBRM1-BD5) include quinazolinones (2),17,18 isochromanones (3),19 and 6-aminopyrazines (4) (Figure 1);20 however, none of these previously reported compounds are selective toward PBRM1 bromodomains, especially within family VIII bromodomains. PFI-3 (1),15,16 fused quinazolines (2),18 and 6-aminopyrazines (4)20 exhibit nanomolar binding toward the PBRM1-BD5, SMARCA2, and SMARCA4 bromodomains. Fused isochromanones (3)19 exhibit moderate binding affinities toward PBRM1-BD5 and limited stability and solubility. The development of fused quinazolines into LM14617 selective to PBRM1 was recently published; however, LM146 still binds the SMARCA2B bromodomain with low micromolar affinity. Thus, there is an unmet need for a selective chemical probe for PBRM1 over closely related bromodomains to investigate the biological function of PBRM1 and as a starting point for clinical development.
Figure 1.
Selected pan-inhibitors of bromodomain family VIII. Atoms expected to interact with proteins through specific hydrogen or halogen bonds are highlighted in brown.
As detailed above, previous studies demonstrated that targeting PBRM1-BD5 results in off-target effects also binding to bromodomains of SMARCA2 and SMARCA4;15,16,18,20 We hypothesized that targeting one of the other five PBRM1 bromodomains that are less homologous to the SMARCA2 and SMARCA4 bromodomains would improve PBRM1 selectivity. PBRM1-BD1 does not have the conserved Asn residue necessary for acetyl-lysine binding in its pocket and therefore is not critical for chromatin binding and not a preferred target;2,21 PBRM1-BD3 and PBRM1-BD6 are not thought to bind histone acetyl-lysine residues and therefore inhibiting these bromodomains is not predicted to displace the PBAF complex from acetylated chromatin.7 Our previous studies showed that PBRM1 function as a growth and gene expression regulator is dependent on the second bromodomain mediating PBAF binding to chromatin,7 and an NMR structure of PBRM1-BD2 was solved previously,21 indicating PBRM1-BD2 is amenable to NMR studies. Therefore, we targeted PBRM1-BD2 by using a protein-detected NMR-based fragment screen with the overall goal of selective inhibition of PBRM1 function. The fragment screen identified five unique scaffolds not previously reported to bind bromodomains. We report detailed structure–activity relationship (SAR) studies of the tightest binding fragment hit, resulting in a series of nanomolar-potent and selective inhibitors of PBRM1 that inhibit the growth of PBRM1-dependent prostate cancer cell lines. Partial SAR studies on the second-tightest binding hit are also reported. The reported compounds exhibit excellent selectivity for PBRM1 bromodomains compared to other bromodomains within the family VIII and the broader bromodomain superfamily.
RESULTS AND DISCUSSION
Protein-Detected NMR Fragment Screening of the Second Bromodomain of PBRM1.
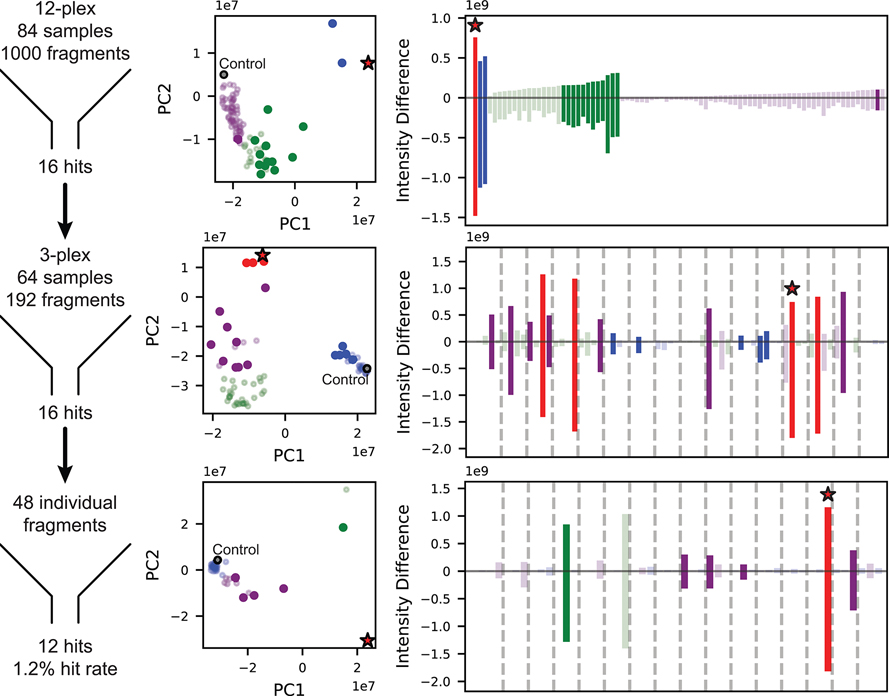
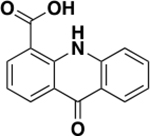
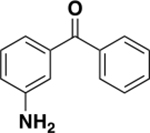
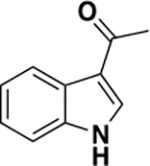
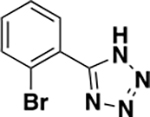
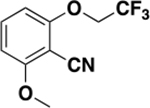
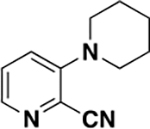
Protein-detected NMR-based fragment screening provides information about both binding affinity and the amino acid residues involved in binding. Our recent success with the second bromodomain of BRD422 prompted us to adopt the same biophysical technique to develop inhibitors of the second bromodomain of PBRM1 (PBRM1-BD2). The available solution structure (PDB 2KTB) of PBRM1-BD2 indicated that PBRM1-BD2 is amenable to protein-detected NMR approaches.21 Commercial libraries from Maybridge and Zenobia consisting of 1968 total fragments, all following the “rule of three”23 and an average molecular weight of 154 Da, ranging from 94–286 Da, were screened against PBRM1-BD2 using protein-detected NMR. 1H–15N SOFAST-HMQC NMR spectra were recorded with uniformly 15N-labeled PBRM1-BD2 with mixtures of 12 fragments (12-plex). In each screening step, “hit” samples were identified using a combination of difference intensity analysis (DIA), principal component analysis (PCA), and manual inspection of spectral overlays as we recently described.22 The hit 12-plex samples were then parsed into four pools of 3 compounds (3-plex), followed by individual fragments from the 3-plex mixture hits to identify the fragment responsible for the observed chemical shift perturbations in the HMQC spectra. The screen identified 27 12-plex hits, which gave 24 3-plex hits, which subsequently yielded 17 individual fragment hits (Figure 2, Supporting Information (SI) Figure S1), with a hit rate of 1.2% (Figure 2) and 0.7% (SI, Figure S1) for the Maybridge and Zenobia libraries, respectively. The fragment hits manifested varied Kd values ranging from 45 μM to >2 mM, calculated by plotting chemical shift perturbations of amino acid residues of PBRM1-BD2 against increasing concentrations of the fragment (Table 1, Figure 3, SI, Figures S2–S11). Varied scaffolds were identified as hits, including quinazolinones, acridones, chromanones, tetrazoles, indenones, indoles, thiazoles, and thioamides.
Figure 2.
Summary of protein-detected NMR-based fragment screen of Maybridge Library targeting PBRM1-BD2. The 1000 fragments were screened in pools of 12, 3, or individual compounds, and hits were identified through stepwise parsing of selected samples, yielding a final hit rate of 1.2% (left column). At each stage of parsing, identification of hit samples was aided by principal component analysis (middle column) and difference intensity analysis (right column) of the 2D HMQC spectra. Samples are colored according to k-means clustering of principal components. Throughout the screening process, samples selected as hits are represented as solid circles and bars, control samples in the PCA plots as gray circles outlined in black, and samples containing 5 are marked with a red star.
Table 1.
Hits Using Protein-Detected NMR Fragment Screening of PBRM1-BD2
| Compound | Structure | PBRM1-BD2 NMR Kd (μM) | LEb | PBRM1-BD2 ΔTm (°C)a |
|---|---|---|---|---|
| 5 |
|
45.3 ± 8.1 | 0.31 | 1.0 ± 0.2 |
| 6 |
|
79 ± 35 | 0.33 | 1.5 ± 1.0 |
| 6a |

|
170 ± 35 | 0.4 | 1.0 ± 0.1 |
| 6b |

|
902 ± 270 | 0.4 | ND c |
| 6c |
|
709 ± 211 | 0.29 | ND c |
| 6d |

|
1387 ± 262 | 0.23 | ND c |
| 6e |
|
1195 ± 250 | 0.33 | ND c |
| 6f |
|
1446 ± 599 | 0.32 | ND c |
| 6g |

|
1210 ± 267 | 0.3 | ND c |
| 6h |

|
>2000 | N/A | ND c |
| 6i |
|
>2000 | N/A | ND c |
| 6j |
|
>2000 | N/A | ND c |
Values are the average ± standard deviation of three replicates.
LE represents Ligand Efficiency.
Tm shift not determined/tested by DSF assay.
Figure 3.
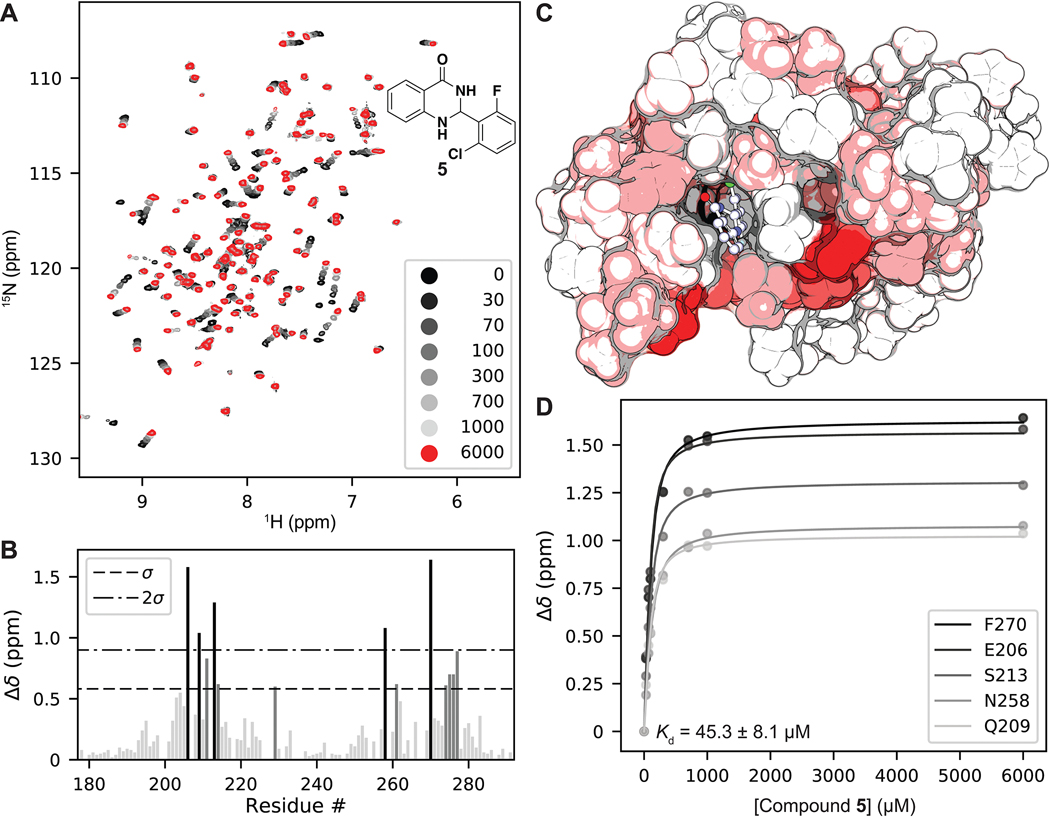
(A) 1H, 15N SOFAST-HMQC overlays of PBRM1-BD2 titrated with increasing concentrations of 5 (structure in insert). (B) Quantification of total chemical shift perturbations (CSPs) (1H/15N Δδ chemical shift) manifested by 5 (6 mM) for individual amino acid residues of PBRM1-BD2. (C) Mapping of substantially perturbed residues on the crystal structure of PBRM1-BD2 (PDB 3LJW). The in silico docked pose of 5 into the acetyl-lysine binding site of PBRM1-BD2 is included. Residues displaying CSPs > 2σ (red), between 1σ and 2σ (pink), or <1σ (white) are indicated. (D) Concentration–response curves of indicated residues used to calculate binding affinity (Kd = 45.3 ± 8.1 μM) of 5 for PBRM1-BD2 using GraphPad Prism.
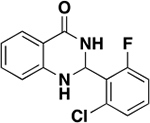
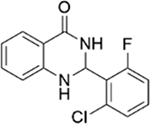
The tightest binding inhibitor was a 2-phenyldihydroquinazolinone (5), giving a Kd value of 45.3 μM (Table 1, Figure 3), as determined by NMR titrations and ligand efficiency (LE) of 0.31. With a Kd value of 79 μM (Table 1, SI, Figure S2), the second-tightest binder was an acridone scaffold containing carboxylic acid (6) and an LE of 0.33. Fragment binding to PBRM1 was also supported by differential scanning fluorimetry (DSF) with measured positive thermal shifts (Tm) of 1.0 ± 0.2 °C for 5 and 1.5 ± 1.0 °C for 6 (Table 1) compared to the apoprotein. DSF measures protein unfolding by monitoring the fluorescence of the SYPRO Orange dye as a function of temperature as the dye binds to exposed hydrophobic regions of the unfolding protein; positive thermal shifts indicate ligand binding-induced stabilization of the protein. Displaying the tightest affinity of the fragment hits, the dihydroquinazolinone (5) and acridone (6) scaffolds were selected for further optimization.
Structure–Activity Relationship Studies of the Tightest-Binding Fragment.
In the previous development of PBRM1-BD5 inhibitors,18 the introduction of chlorine at the C-5 position of quinazolinone scaffold (Figure 4A) improved binding affinity by >10-fold. On crystallization of 2 with PBRM1-BD5, the chlorine of 2 was observed to form a halogen bond with the backbone carbonyl of Met731.18 The homologous residue is Leu255 in PBRM1-BD2. Superposition of PBRM1-BD5 bound to 2 (PDB 5FH7; quinazolinone scaffold) and PBRM1-BD2 bound to 4 (PDB 6ZN6; aminopyridazine scaffold) indicated the backbone carbonyl of Leu255 is within 3 Å of the chlorine of 2. Therefore, we hypothesized that PBRM1-BD2 would form a similar halogen bond between the chlorine on the quinazolinone scaffold and the carbonyl oxygen of Leu255 in PBRM1-BD2.
Figure 4.
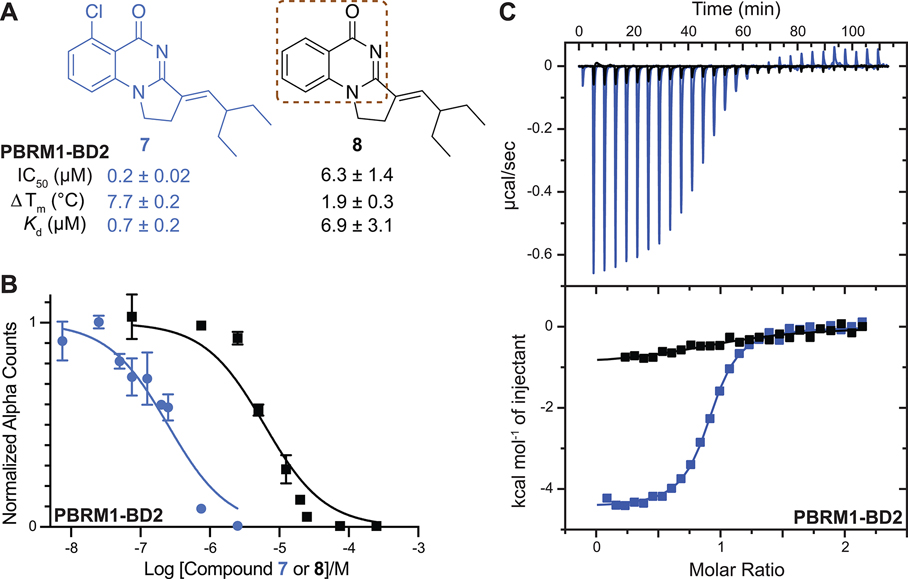
(A) Compounds synthesized to evaluate potential halogen bond formation between 7 and PBRM1-BD2 backbone. The brown dashed box highlights the quinazolinone scaffold. IC50 values were obtained using the AlphaScreen assay. Tm shift values were obtained using the DSF assay. The values shown are the average of three replicates ± the standard deviation. The Kd value for each compound was obtained from ITC measurements. (B) Concentration–response curve giving IC50 values for 7 (0.2 ± 0.02 μM, blue) and 8 (6.3 ± 1.4 μM, black), as tested by the AlphaScreen assay. (C) Overlaid ITC data for 7 (blue) and 8 (black).
To test this hypothesis, we synthesized the previously reported 7 and its nonchlorine analogue 8 by following a published synthetic route (SI, Scheme S1).18 Compound 7 was previously reported to bind PBRM1-BD2 solely based on a DSF assay without further biophysical characterization or development of 7.18 One reason could be the promiscuity of 7, as 7 also showed a ΔTm of >2.5 °C with the SMARCA2/4 bromodomains in DSF assays. The in vitro inhibitory activity of 7 and 8 was tested using our optimized competition-based amplified luminescent proximity homogeneous assay (AlphaScreen), a bead-based assay to quantify biomolecular interactions. In this AlphaScreen assay, the interaction between a biotinylated histone H3K14acetyl peptide and His6-tagged PBRM1-BD2 brings the streptavidin-coated donor and the Ni2+-chelate acceptor beads in close proximity, increasing the Alpha count signal; inhibition of this bromodomain:acetyllysine interaction via small molecules was quantified by the loss in Alpha counts in a concentration-dependent manner. A >30-fold increase in potency of 7 (IC50 = 0.2 ± 0.02 μM, Figure 4B) relative to 8 (IC50 = 6.3 ± 1.4 μM, Figure 4B) was observed toward PBRM1-BD2. Isothermal titration calorimetry (ITC) was used to further assess the binding affinity of the compounds to the bromodomains of PBRM1-BD2, PBRM1-BD5, and SMARCA4, giving Kd values of 0.7 μM, 0.35 μM, and 5.0 μM for 7, and 6.9 μM, 3.3 μM, and no detectable binding for 8 (Figure 4C, Table 2), respectively. In DSF assays using the PBRM1-BD2, PBRM1-BD5, SMARCA2B, and SMARCA4 bromodomains, 7 showed a ΔTm of 7.7 °C, 11.0 °C, 3.0 °C, and 3.1 °C (Figure 4A, SI, Table S1), respectively, compared to the apoprotein. Compounds 7 and 8 did not bind to the ASH1L bromodomain, as evaluated by ITC (Table 2). Overall, the binding affinity toward PBRM1-BD2 improved by at least 10-fold by introducing chlorine at the C-5 position of the quinazolinone scaffold.
Table 2.
Binding Affinities of Selected PBRM1-BD2 Inhibitors Determined by ITC
| ITC Kd (μM)a |
|||||
|---|---|---|---|---|---|
| compd | PBRM1-BD2 | PBRM1-BD5 | SMARCA2B | SMARCA4 | ASH1L |
| 5 | 18.4 ± 3.7 | 179 ± 92 | 15.9 ± 9.7 | ∼142 | NB c |
| 7 | 0.7 ± 0.2 | 0.35 ± 0.04 | 8.1 ± 4.4 | 5.0 ± 0.7 | NB |
| 8 | 6.9 ± 3.1 | 3.3 ± 0.4 | ND b | NB | NB |
| 11 | 9.3 ± 1.1 | 10.1 ± 1.2 | 18.4 ± 9.9 | 69 ± 34 | NB |
| 15 | 5.5 ± 1.0 | 11.1 ± 1.2 | NB | NB | ND |
| 16 | 1.5 ± 0.9 | 3.9 ± 2.6 | NB | NB | ND |
| 34 | 4.4 ± 1.3 | 25 ± 17 | NB | NB | ND |
Kd values for each compound were obtained from ITC measurements and calculated by fitting the data points to a sigmoidal curve. The errors were calculated by standard deviation or error of the fit.
ND indicates that the value was not determined.
NB indicates the compound did not bind to the bromodomain, as demonstrated by generated heat below 0.15 μcal per second in the ITC traces.
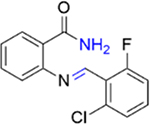
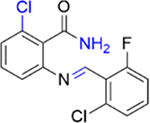
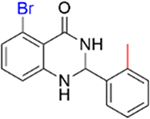
Based on the halogen bond observed in the previous structure of PBRM1-BD5 bound to 218 and our binding studies (Figure 4), SAR studies of our tightest binding hit (5) were initiated by first introducing chlorine to the C-5 position. To access analogues of the dihydroquinazolinone scaffold, the synthetic route depicted in Scheme 1 was used. Basic hydrolysis of 2-aminobenzonitriles (9a–f) resulted in 2-aminobenzamides (10a–f). Condensation of 2-aminobenzamides with benzaldehydes to form dihydroquinazolinones (11–26, 31–35) required added base; absence of base resulted in imine formation (27–28, SI, Scheme S2).
Scheme 1. General Synthetic Route to Dihydroquinazolinone Analogues.
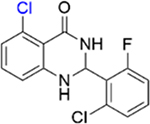
Chlorine substitution at the C-5 position of dihydroquinazolinone scaffold of 5 (IC50 = 4.2 ± 1.3 μM, Table 3, SI, Figure S12), resulting in 11 (IC50 = 1.0 ± 0.2 μM, Table 3, SI, Figure S12), displayed >4-fold increase in potency toward PBRM1-BD2, as determined by AlphaScreen assays. As assessed by ITC, the binding affinity of 11 to the bromodomains of PBRM1-BD2, PBRM1-BD5, and SMARCA4 was >2-fold tighter than 5, as displayed by Kd values of 9.3 μM, 10.1 μM, and 69 μM for 11, and 18.4 μM, 179 μM, and 142 μM for 5 (Table 2), respectively. Although the potency/binding affinity of 11 was 2-fold better than 5 for PBRM1-BD2, 5 and 11 also bound to the bromodomains of SMARCA2B and SMARCA4 (Table 2); thus, we initiated additional SAR studies to improve inhibitor selectivity within the members of bromodomain family VIII.
Table 3.
Inhibition and Thermal Shift of Compound 5 Analogues against PBRM1-BD2 as Determined by AlphaScreen and DSF Assaysa,b
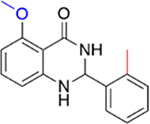
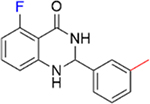
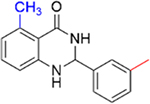
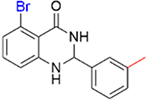
| Compound | Structure | IC50 values (μM)a | PBRM1-BD2 ΔTm (°C)a |
|---|---|---|---|
| 5 |
|
4.2 ± 1.3 | 1.0 ± 0.2 |
| 11 |
|
1.0 ± 0.2 | 4.4 ± 0.4 |
| 12 |
|
1.1 ± 0.2 | 3.8 ± 0.4 |
| 13 |
|
1.7 ± 0.3 | 3.3 ± 0.5 |
| 14 |
|
2.1 ± 0.4 | 3.7 ± 0.2 |
| 15 |
|
0.2 ± 0.04 | 5.4 ± 0.1 |
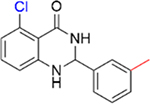
| 16 |
|
0.26 ± 0.04 | 5.4 ± 0.2 |
| 17 |
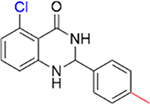
|
0.87 ± 0.14 | 2.8 ± 0.2 |
| 18 |

|
2.3 ± 0.3 | 3.4 ± 0.3 |
| 19 |
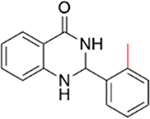
|
50 ± 11 | 1.5 ± 0.8 |
| 20 |

|
5.6 ± 1.0 | 2.9 ± 0.3 |
| 21 |
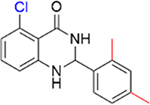
|
0.86 ± 0.15 | 4.5 ± 0.9 |
| 22 |
|
1.3 ± 0.3b | 5.5 ± 0.3 |
| 23 |
|
>70 | 0.23 ± 0.03 |
| 24 |

|
0.43 ± 0.04 | 5.4 ± 1.2 |
| 25 |
|
0.22 ± 0.02 | 3.9 ± 0.3 |
| 26 |
|
0.29 ± 0.05 | 5.2 ± 0.3 |
| 27 |
|
119 ± 3 | 0.0 |
| 28 |
|
17 ± 4 | 0.3 ± 0.2 |
| 29 |
|
236 ± 38 | 0.0 |
| 30 |
|
89.9 ± 14.8 | 0.0 |
| 31 |
|
>70 | 0.0 |
| 32 |
|
5.6 ± 1.5 | 1.8 ± 0.2 |
| 33 |
|
1.3 ± 0.4 | 2.6 ± 0.3 |
| 34 |
|
0.16 ± 0.02 | 6.4 ± 0.2 |
| 35 |
|
0.29 ± 0.04 | 4.0 ± 0.5 |
Values shown are the average of three replicates ± the standard deviation.
Compound was partially insoluble at tested concentrations.
SAR Studies on the Phenyl Ring Substituted at the 2-Position of the Quinazolinone Fragment.
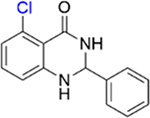
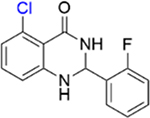
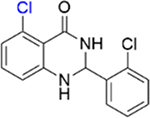
Analogues 12–14 were synthesized to investigate the importance of halogen substitution on the phenyl ring substituted at the 2-position (hereafter referred to as ring A; Scheme 1) of the quinazolinone scaffold of 5. The inhibitory potency of this series (12, IC50 = 1.1 ± 0.2 μM; 13, IC50 = 1.7 ± 0.3 μM; 14, IC50 = 2.1 ± 0.4 μM; Table 3, SI, Figure S12) toward PBRM1-BD2, as determined by AlphaScreen, was equivalent to 11 (IC50 = 1.0 ± 0.2 μM). Similarly, in DSF assays using PBRM1-BD2, 12–14 showed similar positive Tm shifts (Table 3). These AlphaScreen and DSF results indicate that the halogens substituted on ring A of 11 do not improve potency toward PBRM1-BD2.
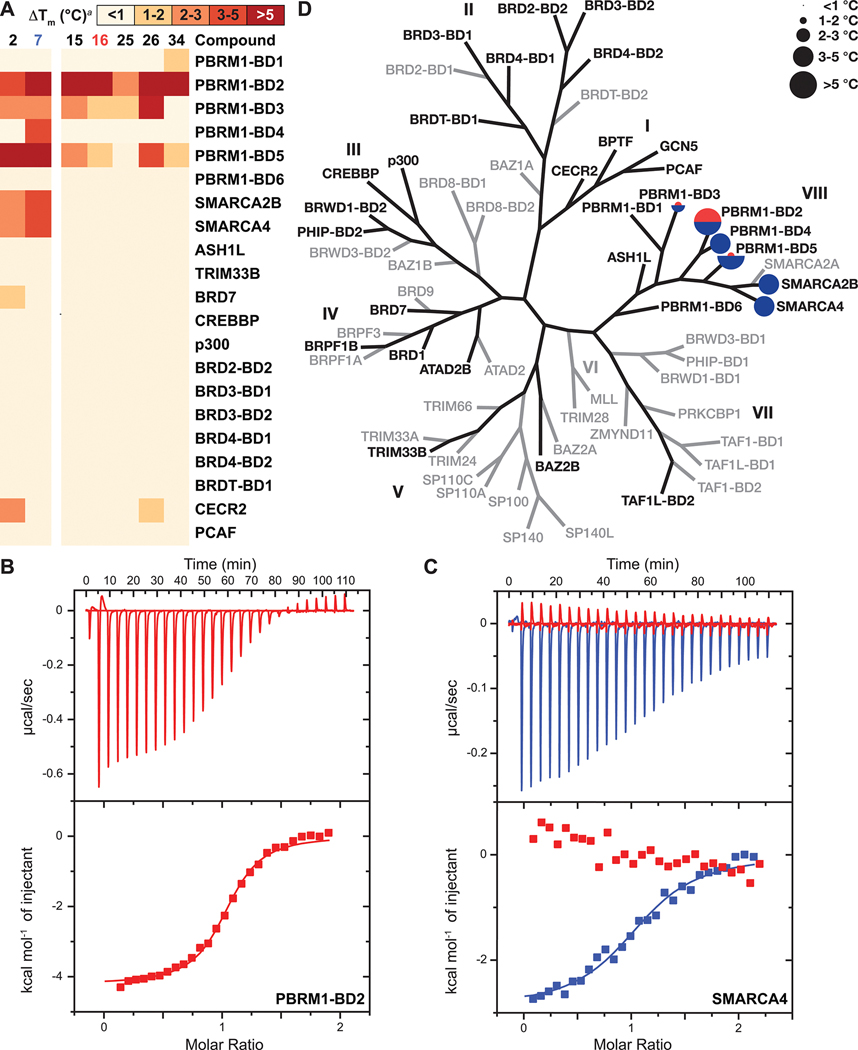
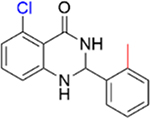
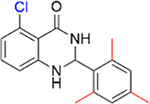
Based on the similarity in the structures of second and fifth bromodomains of PBRM1, we hypothesized that the carbonyl of the dihydroquinazolinone scaffold interacts with the conserved Asn263 of PBRM1-BD2 and the residues on the ZA and BC loops form a hydrophobic pocket. Therefore, we evaluated the introduction of methyl groups at different positions of ring A, resulting in the synthesis of compounds 15–17. Substitution of a methyl group at ortho or meta position of ring A, as in 15 (IC50 = 0.2 ± 0.04 μM) and 16 (IC50 = 0.26 ± 0.04 μM) (Table 3, SI, Figure S12), resulted in >4-fold improvement in PBRM1-BD2 inhibition. The concentration of the PBRM1-BD2 protein in the AlphaScreen assay was 0.2 μM, thus for 15 and 16, we were reaching the detection limit of the assay. Compounds 15 and 16 displayed equivalent inhibition as the previously reported unselective compound 718 (IC50 = 0.2 ± 0.02 μM; Figure 4A/B). Importantly, 15 and 16 did not exhibit detectable thermal stabilization or binding affinity toward the SMARCA2B and SMARCA4 bromodomains as assessed by DSF and ITC (Figure 5A, Table 2, SI, Table S1). Substitutions of methyl or methoxy at the para position of ring A, as in 17 (IC50 = 0.87 ± 0.14 μM) and 18 (IC50 = 2.3 ± 0.3 μM), did not improve PBRM1-BD2 inhibition with 17 having potency equivalent to the unsubstituted phenyl analogue 11 (IC50 = 1.0 ± 0.2 μM). Compound 19 (IC50 = 50 ± 11 μM), an analogue of 15 without the −Cl substitution at the C-5 position, showed a 250-fold decrease in potency toward PBRM1-BD2 relative to 15 (IC50 = 0.2 ± 0.04 μM), emphasizing the importance of halogen bond formation. Compound 20 (IC50 = 5.6 ± 1.0 μM), with substitution of trifluoromethyl at the meta position of ring A, resulted in a 22-fold decrease in potency relative to the meta methyl analogue 16 (IC50 = 0.26 ± 0.04 μM) toward PBRM1-BD2. In DSF assays with PBRM1-BD2, 15 and 16 showed Tm shifts of 5.4 °C, while 17 and 18 showed Tm shifts of ≤3.4 °C, consistent with the AlphaScreen results. As assessed by ITC, compound 16 exhibited Kd values of 1.5 ± 0.9 μM and 3.9 ± 2.6 μM toward PBRM1-BD2 and PBRM1-BD5 (Figure 5B, Table 2), respectively, and no detectable binding toward the SMARCA2B and SMARCA4 bromodomains (Figure 5C, Table 2). Importantly, compound 16 (Kd = 1.5 μM) manifested binding affinity within error of the literature reported value for 7 (Kd = 0.7 μM)18 with significantly improved selectivity for the PBRM1 bromodomains over the SMARCA2B and SMARCA4 bromodomains, as assessed by ITC and DSF (Table 2, Figure 5A/C). Compound 16, to our knowledge, is the most selective inhibitor of PBRM1 reported in the literature and serves as an excellent starting point for the further design of selective PBRM1 chemical probes.
Figure 5.
(A) Heat maps showing the selectivity profile of selected compounds against the members of the bromodomain family. Inhibitors were screened at 100 μM concentration against 10 μM of the indicated bromodomains by the DSF assay. (B) Representative ITC data for 16 with PBRM1-BD2. (C) Overlay of ITC binding curves of SMARCA4 bromodomain with 7 (blue) and 16 (red). (D) DSF selectivity profile of 16 (red) and the previously reported 718 (blue) and plotted on the phylogenetic tree of bromodomain family. Roman numerals indicate the eight bromodomain subfamilies. Bromodomains shown in black were tested. Bromodomains shown in gray were not tested.
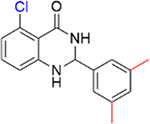
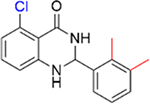
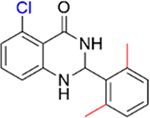
Encouraged by the inhibition data of 15 and 16, analogues 21–26 with multiple methyl substituents on ring A were synthesized and evaluated for inhibition of acetyl-lysine histone peptide binding to PBRM1-BD2. Substitution of methyl group at the ortho position(s) of ring A of the para methyl analogue 17 (IC50 = 0.87 ± 0.14 μM), resulting in 21 (IC50 = 0.86 ± 0.15 μM) and 22 (IC50 = 1.3 ± 0.3 μM), did not improve potency toward PBRM1-BD2. Compound 22 exhibited solubility issues in the AlphaScreen assay, perhaps resulting in apparent weaker potency toward PBRM1-BD2. Compound 23 (IC50 > 70 μM), with methyl groups substituted at both meta positions of ring A, resulted in no detectable binding toward PBRM1-BD2. Compounds 24–26 (24, IC50 = 0.43 ± 0.04 μM; 25, IC50 = 0.22 ± 0.02 μM; 26, IC50 = 0.29 ± 0.05 μM) had similar potencies to 16 (IC50 = 0.26 ± 0.04 μM) against PBRM1-BD2, as determined by AlphaScreen, and did not improve the IC50 values. This is potentially because the concentration of PBRM1-BD2 used in the AlphaScreen assay was 0.2 μM, and therefore we may have reached the detection limit of the AlphaScreen assay. In DSF assays using PBRM1-BD2, 21–26 (except 23) showed positive Tm shifts of ≥3.9 °C relative to apoprotein. Through these SAR studies of the phenyl ring, we obtained a series of inhibitors (11–18, 21–22, 24–26) that exhibited up to 21-fold improved potency compared to the initial hit, 5, identified by the protein-detected NMR fragment screen.
SAR Studies of the Dihydropyrimidone Ring of the Quinazolinone Scaffold.
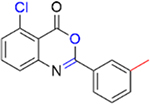
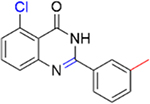
We next investigated the importance of the dihydropyrimidinone ring for the potency of the compounds against PBRM1-BD2. The ring-opened analogue of 5 (IC50 = 4.2 ± 1.3 μM), compound 27 (IC50 = 119 ± 3 μM; SI, Scheme S2), and the ring-opened analogue of 11 (IC50 = 1.0 ± 0.2 μM), compound 28 (IC50 = 17 ± 4 μM; SI, Scheme S2), displayed ≥17-fold decrease in potency toward PBRM1-BD2, however 28 was >4-fold more potent than 27 (IC50 = 119 ± 3 μM), further validating the halogen bond formation hypothesis. Compound 29 (benzoxazinone; SI, Scheme S3) and 30 (quinazolinone; SI, Scheme S3) displayed IC50 > 70 μM against PBRM1-BD2, emphasizing the importance of the dihydropyrimidone aniline −NH for potency. Also, in DSF assays using PBRM1-BD2, compounds 27, 28, 29, and 30 (Table 3) did not show thermal stabilization, consistent with our AlphaScreen results. Hence, the dihydropyrimidinone ring is critical for the potency toward PBRM1-BD2.
SAR Studies at the C-5 Position of Quinazolinone Scaffold.
As detailed above, chlorine introduction at the C-5 position of 5 (IC50 = 4.2 ± 1.3 μM), resulting in 11 (IC50 = 1.0 ± 0.2 μM), led to a 4-fold increase in potency toward PBRM1-BD2. Substitutions, except at the C-5 position, on the benzene ring of the quinazolinone structure are reported to be detrimental to potency toward PBRM1-BD2.17 To further determine the best substituent at the C-5 position of the dihydroquinazolinone scaffold, analogues 31–35 were synthesized. Methoxy substitution at C-5 (31, IC50 > 70 μM) was detrimental to PBRM1-BD2 binding, which may be explained by a steric clash between the larger methoxy group and the amide backbone of the protein and a loss in halogen bonding. Substitution of methyl at the C-5 position (33, IC50 = 1.3 ± 0.4 μM) was preferred over fluorine (32, IC50 = 5.6 ± 1.5 μM) for inhibition of PBRM1-BD2; bromine substitution at the C-5 position (34, IC50 = 0.16 ± 0.02 μM; 35, IC50 = 0.29 ± 0.04 μM) showed equivalent potency to 16 (IC50 = 0.26 ± 0.04 μM) or 15 (IC50 = 0.2 ± 0.04 μM), as determined by AlphaScreen. In DSF assays using PBRM1-BD2, 31 did not show thermal stabilization, 32–33 showed a ΔTm of ≥1.8 °C, and 34–35 showed a ΔTm of ≥4.0 °C, consistent with our AlphaScreen results. Thus, the substitution of chlorine or bromine at the C-5 position of the quinazolinone was preferred to improve potency and may halogen bond with the amide backbone of PBRM1. Fluorine substitution did not improve the potency, consistent with fluorine not being capable of forming halogen bonds.24
Selectivity Profiling Against Other Bromodomains.
Using DSF assays, we evaluated the selectivity profile of selected compounds exhibiting ΔTm ≥ 3.9 °C toward PBRM1-BD2 against a panel of up to 30 bromodomains, depending on the compound, in seven bromodomain subfamilies. We tested nine bromodomains from family VIII, including all six PBRM1 bromodomains, SMARCA2B, SMARCA4, and ASH1L; TAF1L-BD2 from family VII; BAZ2B and TRIM33B from family V; ATAD2B, BRD1, BRD7 (a subunit of the PBAF complex), and BRPF1B from family IV; BRWD1-BD2, CREBBP, PHIP-BD2, and p300 from family III; six members from bromodomain and extraterminal domain (BET) family (BRD2-BD2, BRD3-BD1, BRD3-BD2, BRD4-BD1, BRD4-BD2, and BRDT-BD1) from family II; and BPTF, CECR2, GCN5, and PCAF from family I. Compound 15 showed a ΔTm of 5.4 °C toward PBRM1-BD2 and ΔTm of >2 °C toward PBRM1-BD3 and PBRM1-BD5 and no significant thermal stabilization (<1 °C) of the other tested bromodomains (Figure 5A, SI, Table S1). Compound 16 showed a ΔTm of 5.4 °C toward PBRM1-BD2 and moderate Tm shifts of 1.8 °C toward PBRM1-BD3 and PBRM1-BD5 (Figure 5A/D, SI, Table S1) with complete selectivity for the PBRM1 bromodomains among the tested bromodomains. Compound 26 was broadly selective for PBRM1, depicting a ΔTm of 5.2 °C for PBRM1-BD2 and a ΔTm of >4 °C for PBRM1-BD3 and PBRM1-BD5 (Figure 5A, SI, Table S1); compound 26 could be developed to simultaneously target multiple bromodomains of PBRM1. Compound 34 showed an excellent ΔTm of 6.4 °C toward PBRM1-BD2 and ΔTm of ~1.5 °C for PBRM1-BD1 and PBRM-BD5 (Figure 5A, SI, Table S1). In contrast, the previously reported 218 (SI, Scheme S4) and 718 showed ΔTm values of 3.3 and 7.7 °C for PBRM1-BD2 and 7.7 and 11 °C for PBRM1-BD5 and also a significant ΔTm of ≥2 °C for both the SMARCA2B and SMARCA4 bromodomains (Figure 5A/D, SI, Table S1), as previously reported.18 In summary, all tested compounds developed herein were selective to the PBRM1 bromodomains over other tested bromodomains; the previously reported 218 and 718 were unselective and exhibited positive thermal stabilization toward other family VIII bromodomains, as shown previously.18
Molecular Modeling and Correlation with NMR Chemical Shift Perturbation.
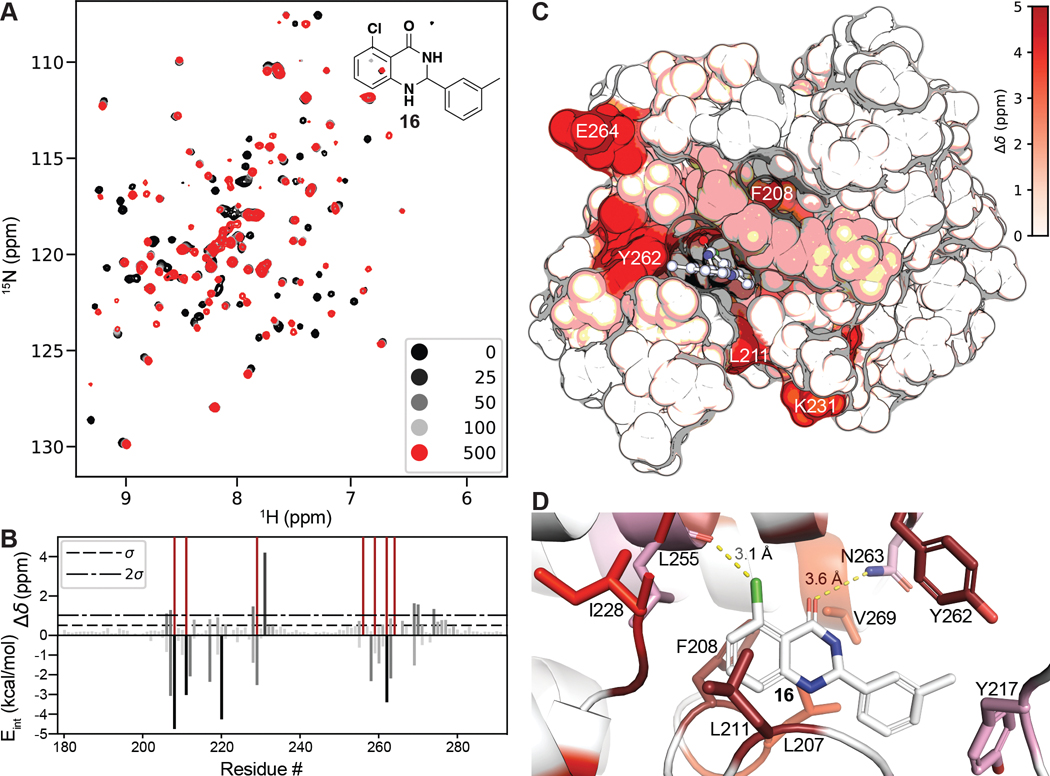
Slow intermediate exchange was observed when 16 was titrated against PBRM1-BD2, leading to peak intensity loss of protein residues at lower concentrations of 16 (25 μM, 50 μM, 100 μM) (Figure 6A). To correlate chemical shift perturbations (CSPs) with predicted binding poses, we performed Glide docking of 16 using the XP precision setting (which parses individual residue contribution to the overall Glide score) into a recent crystal structure of PBRM1-BD2 with the small molecule ligand removed (PDB 6ZN6 chain A). We found a close correlation (Figure 6B) between the observed interaction of 16 with PBRM1-BD2, as measured by protein-detected NMR CSPs, and the per residue interaction scores, as generated by the XP precision scoring algorithm,25 for our best pose (Figure 6C). In our best pose, the Asn263 (Eint = −2.2 kcal/mol) amide hydrogen-bonds to carbonyl oxygen of dihydropyrimidone ring of 16 (Figure 6D), consistent with the line broadening observed for the neighboring Glu264 and the corresponding favorable per residue interaction scores.25 As discussed above, the Leu255 carbonyl oxygen likely forms a halogen bond with the chlorine at the C-5 position of the quinazolinone scaffold of 16 (Figure 6D), as supported by the observed CSP of >1σ from the mean for Leu255 and the line broadening observed for the neighboring Ala256. Our docked model also suggests that Leu255 participates in stabilizing van der Waals interactions with 16 (Evdw = −1.9 kcal/mol). Leu207 (Eint = −3.1 kcal/mol), Phe208 (Eint = −4.8 kcal/mol), Leu211 (Eint = −3.0 kcal/mol), Ile228 (Eint = −1.4 kcal/mol), and Val269 (Eint = −1.5 kcal/mol) likely form a hydrophobic core interacting with bound 16 (Figure 6D), as supported by observed CSPs (>2σ or line broadening) and the Eint in our docked model for these residues. Tyr217 (CSP > 1σ; Eint = −2.4 kcal/mol) and Tyr262 (line broadening; Eint = −3.4 kcal/mol) also manifested large CSPs and Eint energies, suggesting formation of π–CH interactions between Tyr phenyl rings with the meta methyl group on the phenyl ring of 16 (Figure 6D).
Figure 6.
(A) 1H, 15N SOFAST-HMQC overlays of PBRM1-BD2 (100 μM) titrated with 0–500 μM of 16 (structure in insert). (B) (top) Quantification of total chemical shift perturbations (1H/15N Δδ chemical shift) manifested by 16 (500 μM) for individual amino acid residues of PBRM1-BD2. Prolines and unobserved residues have a value of zero, while amino acids whose amide cross peak broadened beyond detection during the titration were assigned a value of 5 and are colored dark red. (bottom) Internal energy (Eint) values from the per residue interaction scoring (XP Glide docking) for residues located within 12 Å of the centroid of the docked ligand 16. (C) Mapping of perturbed residues to the crystal structure of PBRM1-BD2 (PDB 6ZN6). The in silico docked pose of 16 into the acetyl-lysine binding site of PBRM1-BD2 is included. (D) Binding site view of the pose displayed in (C). Residues are colored as displaying line broadening (dark red) and CSPs > 2σ (red), between 1σ and 2σ (pink), or <1σ (white).
SAR Studies of the Second-Tightest Binding Fragment Hit.
Preliminary SAR studies on the second-best fragment, 6, consisting of an acridone scaffold, were also performed. Compounds 36–39 (SI, Scheme S5) were synthesized to assess their improvements in potency toward PBRM1-BD2. 37 (IC50 = 7 μM; SI, Table S2), with chlorine substituted at the C-8 position of acridone ring, manifested a 17-fold increase in potency toward PBRM1-BD2 compared to 6 (IC50 = 127 ± 30 μM; SI, Table S2). Compound 37 also exhibited a ΔTm of 3.0 °C compared to 1.5 °C for 6. The improved potency of 37 compared to 6 further supports the hypothesis of chlorine participating in the halogen-bond formation with the protein backbone. Compound 36 (IC50 = 26 μM; SI, Table S2), the ring-opened analogue of 37, had ~4-fold decreased potency toward PBRM1-BD2. The introduction of chlorine at the C-1 position of 6, resulting in 39 (IC50 > 250 μM; SI, Table S2) and the ring-opened analogue 38 (IC50 > 250 μM; SI, Table S2), was detrimental to PBRM1-BD2 binding of the acridone scaffold. Overall, chlorine substitution at the C-8 position of 6 and planarity of the acridone scaffold favored inhibition of PBRM1-BD2. We speculate that the presence of a carboxylic acid at the 4′-position of 6 offers a promising handle to develop 6 into a more potent and soluble compound.
Activity of PBRM1-BD2-Selective Inhibitors Against PBRM1-Dependent Prostate Cancer Cells.
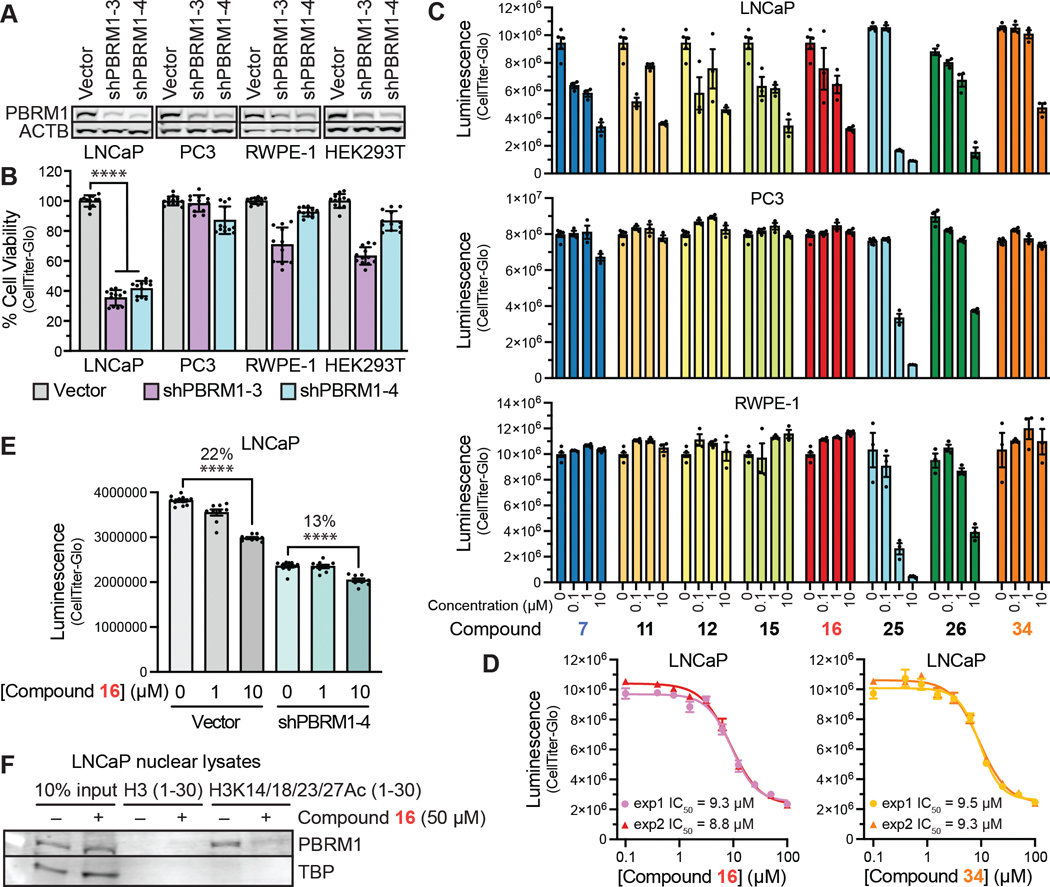
To determine which PBRM1-BD2 inhibitor is the best chemical probe for use in cellular contexts, we searched for a cell line selectively dependent on PBRM1 for viability. In prostate cancer patient tumors and cell lines, increased expression of PBRM1 correlates with aggressiveness,12 facilitates cancer cell survival under oxidative stress conditions,11,13 and promotes an immunosuppressive phenotype.14 Using lentiviral delivery of two distinct shRNAs targeting PBRM1, the viability dependence on PBRM1 was determined for a panel of prostate and other cell lines including the androgen receptor (AR) positive prostate cancer cell line LNCaP, the AR-negative prostate cancer cell line PC3, the prostate epithelial cell line RWPE-1, and the embryonic kidney cell line HEK293T (Figure 7A, SI, Figure S13A). LNCaP cells were the only cell line with decreased viability upon PBRM1 knockdown with both shRNAs targeting PBRM1 consistent with an on-target effect (Figure 7B, SI, Figure S13B). Because LNCaP cells are highly dependent on AR signaling, this PBRM1 dependence is consistent with the observed positive correlation between PBRM1 protein levels and the AR target prostate specific antigen in tumors12 and the observed decrease in AR target gene expression upon PBAF subunit knockout in a male leukemia line.26 In contrast, the viability of AR-negative prostate cancer cell line PC3 and noncancerous cell lines RWPE-1 and HEK293T were not consistently altered with both shRNAs targeting PBRM1. Next, the ability of the best PBRM1-BD2 ligands to selectively inhibit growth of the human prostate cell lines LNCaP, PC3, and RWPE-1 was tested at three doses 0.1, 1, and 10 μM (Figure 7C, SI, Figure S13C). All of the compounds tested inhibited LNCaP growth at higher concentrations, consistent with their ability to inhibit PBRM1-BD2. The most potent compound tested, 25, inhibited LNCaP cells with submicromolar potency (IC50 = 0.66 μM) but also inhibited the PC3, RWPE-1, and HEK293T cells with similar nanomolar potency (Figure 7C, SI, Figure S13C/D), indicating off-target toxicity and unsuitability as a chemical probe for PBRM1 function. Compound 26, which is structurally similar to 25, differing only in the placement of one methyl group, also displayed similar IC50 values of ~2 μM toward both LNCaP and PC3 cells and off-target toxicity at ≥10 μM concentrations in RWPE-1 and HEK293T cells (Figure 7C, SI, Figure S13C/D), indicating unsuitability as a chemical probe. Based on the biochemical properties and the selectivity and potency against LNCaP cells, the next most promising compounds were 16 and 34, which differ only in the halogen substitution at C-5 (chlorine for 16 and bromine for 34). Both compounds exhibited similar potency against LNCaP cells (IC50 ~ 9 μM) (Figure 7D) and do not inhibit the growth of PC3 and RWPE-1 cells at tested concentrations up to 10 μM (Figure 7C). Although compound 7, which also binds PBRM1-BD5 and the SMARCA2 and SMARCA4 bromodomains, displayed similar growth inhibition of LNCaP cells as the PBRM1-selective ligand 16 (Figure 7C), compound 7 also displayed more substantial inhibition of the PBRM1-independent prostate cancer cell line PC3 at higher concentrations up to 100 μM (SI, Figure S13F), potentially indicating off-target effects from inhibiting SMARCA2 and/or SMARCA4, which also contributes to prostate cancer viability through the cBAF and GBAF chromatin remodeling complexes.27,28
Figure 7.
Cellular activity of PBRM1-BD2 inhibitors. (A) Immunoblot of lysates from human cell lines with lentiviral expression of two shRNAs against PBRM1 (shPBRM1–3 and shPBRM1–4) or vector control. Cell lines include LNCaP (AR-positive prostate cancer cell line), PC3 (AR-negative prostate cancer cell line), RWPE-1 (prostate epithelial cell line), and HEK293T (transformed human embryonic kidney cell line). (B) Cell viability after 6 days incubation of cell lines expressing lentiviral shPBRM1 or vector control. (C) Prostate cell line viability after 5 days treatment with 0, 0.1, 1, or 10 μM of indicated PBRM1 bromodomain inhibitors. Viability was measured as luminescence units using CellTiter-Glo. n = 3 for compound treatments; n = 6 for DMSO alone. (D) Concentration curve measurement for 16 and 34 in LNCaP cells treated as described in (A). IC50 was calculated from the variable slope concentration curve generated using GraphPad Prism. (E) The viability of LNCaP cells expressing shRNA against PBRM1 (shPBRM1–4) or vector control after 5 days treatment with 0, 1, or 10 μM compound 16. Viability was measured as luminescence units using CellTiter-Glo. n = 9–12; **** = p < 0.0001. Significance calculated using Student’s t test. (F) Immunoblot analysis of streptavidin-mediated enrichment of biotinylated H3 or H3K14/18/23/K27Ac tetraacetylated peptides added to LNCaP nuclear lysate containing 250 mM NaCl. Enrichment of PBRM1 and TATA-binding protein (TBP) was determined using immunoblot analysis.
To provide further supporting evidence that the activity of 16 in LNCaP cells is through PBRM1, we compared the activity of 16 in LNCaP cells with and without PBRM1 knockdown (Figure 7E, SI, Figure S13G). We found that 10 μM of 16 has a more significant effect on LNCaP viability in cells with native PBRM1 levels than in cells with PBRM1 knockdown, consistent with on-target action. We also found that 16 reduces the binding of full-length PBRM1 within the PBAF complex in cell lysates to acetylated histone peptides. The addition of PBRM1-BD2 inhibitor 16 to LNCaP cell lysates reduced the association of full-length PBRM1 to H3 peptides with multiple acetylation marks (Figure 7F) or H3K14Ac alone (SI, Figure S13H).
CONCLUSIONS
We described SAR studies on a fragment hit identified by protein-detected NMR fragment screening of PBRM1-BD2 and optimized the tightest-binding fragment into a series of cell-active inhibitors that display unprecedented selectivity toward PBRM1, especially over bromodomains of SMARCA2 and SMARCA4 and other bromodomain-containing proteins. Our sequential SAR studies observed that the modifications on the phenyl ring substituted at the 2-position (ring A) of dihydroquinazolinone scaffold of 5 were more forgiving. The best substituent was a methyl at the meta or ortho position of ring A. Compounds 15 (IC50 = 0.2 ± 0.04 μM), 16 (IC50 = 0.26 ± 0.04 μM), 25 (IC50 = 0.22 ± 0.02 μM), 26 (IC50 = 0.29 ± 0.05 μM), 34 (IC50 = 0.16 ± 0.02 μM), and 35 (IC50 = 0.29 ± 0.04 μM) showed inhibitory activities comparable to the previously described unselective 7 (IC50 = 0.2 ± 0.02 μM) (Table 3); importantly, the compounds reported here demonstrated improved selectivity especially within family VIII bromodomains, as assessed by DSF (Figure 5A/D, Table S1). The dihydropyrimidinone ring was critical for the inhibitory activity of compounds toward PBRM1-BD2. Compounds 29 and 30 with IC50 > 70 μM toward PBRM1-BD2 emphasize the importance of the dihydropyrimidone aniline −NH for inhibition. Only bromine substitution, as in 34 (IC50 = 0.16 ± 0.02 μM) or 35 (IC50 = 0.29 ± 0.04 μM), could replace chlorine at the C-5 position of 16 (IC50 = 0.26 ± 0.04 μM) or 15 (IC50 = 0.2 ± 0.04 μM). Compound 16 showed promising inhibition toward PBRM1-dependent prostate cancer cell line LNCaP (IC50 ~ 9 μM). Given its cellular activity and favorable properties, 16 warrants further cellular and in vivo studies. Compounds 15, 16, 25, 26, and 34 exhibited inhibition in vitro and in cells (Table 3, Figure 7, Figure S13), and we generated a likely binding pose of 16 using Glide docking guided by our NMR data (Figure 6D). The calculated per residue interaction scores for this pose correlated well with the observed NMR chemical shift perturbations, indicating interactions that can be further exploited through future SAR studies of 16.
Overall, multiple lines of evidence detailing selective binding and inhibition of PBRM1-BD2 were obtained. Importantly, to our knowledge, this study provides inhibitors with the highest reported selectivity for PBRM1, making them potentially suitable chemical probes for future biological studies. Additionally, given the overall importance of PBRM1 in multiple types of cancer, the availability of such small-molecule inhibitors provides an important avenue for investigating the cancer-specific roles of PBRM1 and for further development of novel PBRM1-targeted cancer therapies. Because PBRM1 contributes to an immunosuppressive cellular phenotype in prostate cancer, inhibition of PBRM1 is an attractive target to sensitize prostate cancer patients to immunotherapy. We envision that these chemical probes will advance our understanding of the underlying biological mechanisms of PBRM1 function in health and disease. With further testing and improvements in selectivity, potency, and pharmacological properties and additional testing in animal models, we anticipate these chemical probes can be developed into compounds with clinical potential for the treatment of PBRM1-driven cancers.
EXPERIMENTAL SECTION
Protein Purification.
Expression and Purification of Recombinant 15N- and 13C/15N-Labeled PBRM1-BD2 Protein.
Recombinant 15N-labeled PBRM1-BD2 and 13C/15N-labeled PBRM1-BD2 (pNIC28-Bsa4) were transformed into and purified from BL21(DE3) Escherichia coli cells using nickel-affinity chromatography. 15N-Labeled PBRM1-BD2 was grown at 37 °C in minimal media which contained 100 mL of Medium P salts (500 mM Na2HPO4, 500 mM KH2PO4, 50 mM Na2SO4, 30 g/L 15N-labeled NH4Cl, 5g/L NaCl), 40 mL of 20% (w/v) glucose (sterile filtered), 2 mL vitamin solution (1 centrum vitamin dissolved in 20 mL of 50% (v/v) EtOH in ddH2O), and 120 μL of 250 mM CaCl2 (sterile filtered) per 1 L of media. 13C/15N-labeled PBRM1-BD2 was grown at 37 °C in minimal media supplemented with 2 g of U–13C-glucose (instead of natural abundance glucose) per 1 L of media. All cultures were supplemented with 50 mg/L kanamycin and grown to an OD of ~0.5–0.7 at 600 nm. Protein expression was induced overnight with 0.1 mM IPTG at 18 °C. Cells were harvested via centrifugation at 5000g, and cell pellets were frozen at −80 °C until lysis. Frozen cells were thawed on ice and resuspended in lysis buffer (50 mM HEPES pH 7.5 at 20 °C, 500 mM NaCl, 5% v/v glycerol, 5 mM imidazole). Resuspended cells were immediately lysed via sonication, and lysates were cleared by centrifugation for 30 min at 30 000g. Cleared lysates were then applied to Ni-NTA resin (0.75 mL resin/L culture) at 4 °C for at least 1 h while rocking. The protein-bound Ni-NTA resin was applied to a column and washed twice with 15 mL of lysis buffer and eluted using increasing concentrations of imidazole in lysis buffer (5 mL each of 50, 100, 150, 200, and 250 mM imidazole). Fractions were resolved by SDS-PAGE, and those containing PBRM1-BD2 were pooled and the N-terminal His6 tag was removed using tobacco etch virus (TEV) protease. Protein sample was reapplied to the Ni-NTA column, and the flow-through was concentrated to a volume of 1 mL and applied to an Enrich SEC 70 10 × 300 mm column (Bio-Rad) into a storage buffer (100 mM Na2PO4 pH 6.5, 100 mM NaCl, and 1 mM DTT). Concentrations of purified proteins were determined by the method of Bradford using BSA as a standard,29 aliquoted, flash-frozen, and stored at −80 °C.
Expression and Purification of Recombinant Bromodomains.
Recombinant His6-tagged PBRM1-BD1 (Addgene plasmid #39027), PBRM1-BD2 (Addgene plasmid #39013), PBRM1-BD3 (Addgene plasmid #39030), PBRM1-BD4 (Addgene plasmid #39103), PBRM1-BD5 (Addgene plasmid #38999), PBRM1-BD6 (Addgene plasmid #39028), SMARCA2B (Addgene plasmid #73250), SMARCA4 (Addgene plasmid #39116), ASH1L (Addgene plasmid #39051), TAF1L-BD2 (Addgene plasmid #39014), BAZ2B (Addgene plasmid #39000), TRIM33B (Addgene plasmid #98243), ATAD2B (Addgene plasmid #39046), BRD1 (Addgene plasmid #39095), BRD7 (Addgene plasmid #98245), BRPF1B (Addgene plasmid #53620), BRWD1-BD2 (Addgene plasmid #39073), CREBBP (Addgene plasmid #38977), PHIP-BD2 (Addgene plasmid #39049), p300 (Addgene plasmid #39018), BRD2-BD2 (Addgene plasmid #39074), BRD3-BD1 (Addgene plasmid #38940), BRD3-BD2 (Addgene plasmid #38941), BRD4-BD1 (Addgene plasmid #38942), BRD4-BD2 (Addgene plasmid #38943), BRDT-BD1 (Addgene plasmid #38898), BPTF (Addgene plasmid #39111), CECR2 (Addgene plasmid #39066), GCN5 (Addgene plasmid #38914), and PCAF (Addgene plasmid #39002) were gifts from Nicola Burgess-Brown and were purified from BL21(DE3) Escherichia coli cells using nickel affinity chromatography. BL21(DE3) cells were transformed and grown at 37 °C in 2XYT or TB media with 50 mg/L kanamycin to an OD of ~0.6–0.8 at 600 nm. Protein expression was induced overnight with 0.1 mM IPTG at 18 °C. Cells were harvested via centrifugation at 5000g, and cell pellets were frozen at −80 °C until lysis. Frozen cells were thawed on ice and resuspended in lysis buffer (100 mM Na2PO4 pH 7.5 at 20 °C, 100 mM NaCl, 5% v/v glycerol, and 5 mM imidazole for PBRM1-BD2; 50 mM HEPES pH 7.5 at 20 °C, 500 mM NaCl, 5% v/v glycerol, and 5 mM imidazole for all other bromodomains). Cells were lysed via sonication for 10 min (pulsed, amplitude 3.5, 50% work cycle), and lysates were cleared by centrifugation for 30 min at 30 000g. Cleared lysates were then applied to Ni-NTA resin (1 mL resin/L culture) at 4 °C for a minimum of 1 h while rocking. The supernatant was discarded, and the Ni-NTA resin was applied to a column and washed with 15 mL fractions of lysis buffer until absorbance at 280 nm was below 0.1 as determined by Nanodrop. The protein was eluted using increasing concentrations of imidazole in lysis buffer (5 mL of 50, 100, 150, 200, and 250 mM imidazole, then a final 10 mL of 250 mM imidazole). Fractions were monitored by SDS-PAGE, and those containing recombinant bromodomain were pooled. Protein samples were further purified and exchanged into a storage buffer (100 mM Na2PO4 pH 7.5 at 20 °C, 100 mM NaCl, and 5% v/v glycerol for PBRM1-BD2; 50 mM HEPES pH 7.5 at 20 °C, 500 mM NaCl, and 5% v/v glycerol for all other bromodomains) via size exclusion chromatography using an Enrich SEC 70 10 × 300 mm column (Bio-Rad). Concentrations of purified proteins were determined by the method of Bradford using BSA as a standard,29 aliquoted, flash-frozen, and stored at −80 °C.
Protein-Detected NMR Based Fragment Screening.
Library Selection.
The Maybridge Core Library (Maybridge Ltd., Thermo Fisher Scientific, UK) and Zenobia Therapeutics Library 1 (Zenobia Therapeutics, San Diego, CA) contain 1000 and 968 fragments, respectively, with an average molecular weight of 154 Da, ranging from 94–286 Da. Fragments were received in 96-well plates and solubilized to 200 mM in DMSO-d6. All fragments were soluble to 200 mM in DMSO and 1 mM in H2O. For both libraries, each compound (10 μL; 1000 or 968 each in 200 mM DMSO-d6) was mixed into 84 or 81 wells of a 96-well v-bottom plate, with each well containing 12 fragments at 16.67 mM each. An 85th or 82nd well contained DMSO only. This step was performed manually resulting in a mother matrix plate with 85 or 82 wells containing a total of 120 μL of fragments (or DMSO) in DMSO-d6. Then, 2.1 μL of each fragment mixture (or DMSO) from the mother matrix plate was transferred to single-use daughter plate 96-well v-bottom plates. Mother and daughter plates were sealed and stored at −80 °C. Chemicals for subsequent NMR titration experiments were purchased from Enamine, AK Scientific, or Sigma-Aldrich. For individual titration experiments, compounds were initially solubilized to 200 mM in DMSO-d6 and stored at −80 °C until further use.
Fragment Screening and Semiautomated Preparation of NMR Samples.22
For NMR-based screening, 100 μM 15N-labeled PBRM1-BD2 in 100 mM Na2HPO4, 100 mM NaCl, 0.02% NaN3, and pH 6.5 with 8% (v/v) D2O was used. In each well, 15N-labeled protein (67.9 μL, 100 μM) was added to fragment mixture (2.1 μL) to give final concentrations of 3% (v/v) DMSO-d6, 500 μM of each fragment, and 97 μM protein. Subsequent steps used a PAL liquid handling robot (LEAP Technologies), configured in-house for solution mixing and loading of 1.7 mm diameter NMR sample tubes. To avoid cross-contamination, the syringe was washed with acetonitrile and water between samples. Each NMR sample was mixed and transferred from the 96-well v-bottomed plate to 1.7 mm NMR tubes. Upon completion of sample preparation, NMR tubes were capped, and any signs of precipitation/aggregation were noted. Total time spent for sample preparation for NMR screening was ~4 h (2.5 min/sample).
Primary screening identified a subset of NMR samples containing fragment(s) with affinity to the protein target. To identify these, 12 fragments from the hit sample were divided into four groups each consisting of three fragments, and 2.1 μL of each sample was aliquoted into a 96-well v-bottom plate. Then, 15N-labeled protein (67.9 μL, 100 μM) was added, and the solution was gently mixed and transferred into 1.7 mm NMR tubes by using the PAL liquid-handling robot to give final concentrations of 3% (v/v) DMSO-d6, 500 μM fragment, and 97 μM protein.
The three fragments from the samples that exhibited an affinity for the protein were further aliquoted individually into three wells of a 96-well v-bottom plate. Then, 15N-labeled protein (67.9 μL, 100 μM) was added, and the solution was gently mixed and transferred into 1.7 mm NMR tubes by using the PAL liquid-handling robot to give final concentrations of 3% (v/v) DMSO-d6, 500 μM fragment, and 97 μM protein. To determine binding affinities of fragments against protein targets, titration experiments by NMR were performed as previously described.22 Briefly, the PAL robot was used to set up one DMSO control (3% v/v) and eight titration points per fragment at 47 μM, 94 μM, 188 μM, 375 μM, 750 μM, 1500 μM, 3000 μM, and 6000 μM with 15N-labeled protein (97 μM).
NMR Spectroscopy.
Automated NMR data collection was performed on 15N-labeled PBRM1-BD2 (100 μM) by using 1H,15N SOFAST-HMQC experiments.30 Data was collected at 25 °C on a Bruker Avance II 600 MHz spectrometer equipped with a triple resonance z-axis gradient cryoprobe and SampleJet autosampler, which allowed automatic tuning, matching, and shimming for each sample. 1H,15N SOFAST-HMQC experiments consisted of 32 scans with 1024 and 210 complex points in the 1H and 15N dimensions, respectively. The total time for screening 85 or 82 samples each containing 12 fragments or DMSO by 1H,15N SOFAST-HMQC was ~46 h (~32 min/sample). NMR samples of 15N-PBRM1-BD2 (100 μM) contained Na2HPO4 (100 mM) pH 6.5, NaCl (100 mM), with 8% v/v D2O. Spectra were processed using NMRPipe and spectra visualizations were created by using the nmrglue and matplotlib python packages.31 Total 1H/15N chemical shift perturbations and equilibrium dissociation constants (Kd) were calculated as previously reported.22
Backbone amide resonance assignments (BMRB ID 51472) for apo-PBRM1-BD2 were obtained using a 15N/13C-labeled PBRM1-BD2 (600 μM) in a buffer containing Na2HPO4 (100 mM) pH 6.5, NaCl (100 mM), with 8% v/v D2O. Data was collected at 25 °C on a Bruker Avance III-HD 600 MHz spectrometer equipped with a triple resonance z-axis gradient 5 mm cryoprobe. NMR data were processed using NMRPipe,32 peak picking was performed using XEASY,33 and resonance assignments were made using GARANT.34 Resonances from 15N HSQC, HNCA, HNCACB, HN(CA)CO, HNCO, HN(CO)CA, HN(CO)CACB, and (H)C(CO)NH spectra were used to assign 96% of the assignable backbone amide resonances (SI, Figure S14). Backbone amide assignments (BMRB ID 51450) for PBRM1-BD2 (600 μM) bound to 16 (750 μM) were transferred by inspection and verified using resonances from HNCA, HNCACB, HN(CO)CA, and HN(CO)CACB. Assignments for 86% of the backbone amides for 16 bound PBRM1-BD2 were successfully transferred (SI, Figure S15).
Principal Component Analysis (PCA) and k-Means Clustering.22
2D NMR spectra of 1024 and 512 complex points in proton and nitrogen dimensions, respectively, were used as input data for PCA.32 The spectral regions 6–10 ppm 1H and 105–135 ppm 15N were included for analysis. The first three principles components were used as input for k-means clustering. PCA and k-means clustering analyses were carried out using the Scikit-learn python package.35
Difference Intensity Analysis (DIA).22
By using the addNMR module (or in-house Python scripts) of NMRPipe,32 2D difference spectra were generated from heteronuclear data from each fragment mixture compared to the DMSO control. Total cross peak intensities were calculated from 2D difference spectra in NMRPipe using in-house python scripts. Only crosspeak intensities >300 000 were included. The resulting 2D difference spectra for each fragment mixture were condensed into a single positive (and negative) value representing the total sum of all positive (and negative) crosspeak intensities. Accordingly, each NMR sample gave two values. NMR samples containing fragments that gave rise to total (positive and negative) crosspeak intensity value(s) greater than one standard deviation from the mean across all 1000 samples were considered as either potential binders (+1σ and −1σ) or compounds that induce nonspecific NMR crosspeak broadening (−1σ only).
Computational Fragment Docking.
The crystal structure of PBRM1-BD2 in apo conformation (PDB 3LJW)21 was obtained from the Protein Data Bank and imported into the Schroödinger (release 2017–3) Maestro suite using the Protein Preparation Wizard and subjected to restrained minimization within the OPLS3e force field.36 Fragment structures were prepared for docking using the LigPrep application in Maestro, and ligand ionization states at pH 7.0 ± 2.0 were generated using Epik.37 Fragments were flexibly docked into a 30 × 30 × 30 Å3 grid centered on the centroid of the minimized PBRM1-BD2 structure coordinates using Glide in extra-precision (XP) mode.25 Output poses were ranked according to the Emodel score.
Molecular Modeling.
Docking was performed using the Schroödinger (Release 2021–1) Maestro suite. The receptor ensemble for docking 16 was assembled by aligning the three structures obtained from the PBRM1-BD2 crystal structures bound to inhibitors (PDB 6ZN6 and 6ZNV).20 All standard options were used unless otherwise noted. A receptor grid was generated for each structure centered around the crystal-bound ligand. Compound 16 was prepared from the SMILES code in LigPrep to give both possible enantiomers. Glide docking was then performed with extended sampling and the precision set to XP. The output was configured to include the per residue interaction scores for any residue located within 12 Å of the ligand’s centroid. The top pose for each receptor were found to be nearly identical so the ligand–receptor pair generated from 6ZN6 chain A was used for the CSP correlation analysis.
AlphaScreen.
AlphaScreen beads and 96-well 1/2-area light-gray plates (part number 6002350) were purchased from PerkinElmer. A biotinylated H3K14Ac(1–20) peptide (NH2-ARTKQTARKSTGGK(acetyl)APRKQLK(biotin)-CONH2) was purchased from Peptide 2.0. All reagents were diluted in Epigenetic Buffer (5×), 2 μM TCEP, and 0.5% v/v Tween-20. The assay used a final volume of 40 μL. Stock solutions of inhibitors in DMSO were made at eight different concentrations (100 mM, 10 mM, 1 mM, 300 μM, 100 μM, 30 μM, 10 μM, 3 μM). Then 0.4 μL of inhibitor DMSO stocks were further diluted to 10 μL in the buffer. To a 17.5 μL mixture consisting of 400 nM of His6-tagged PBRM1-BD2, 200 nM of the biotinylated H3K14Ac peptide, 2.5 μL of 0–4 mM of inhibitors (0.25% v/v final DMSO) were titrated and the mixture (20 μL) was incubated for 30 min. Then 20 μL of AlphaScreen beads (20 μg/mL Streptavidin Donor beads, 5 μg/mL Nickel-Chelate Acceptor beads) were added to achieve the final concentration of 200 nM His-tagged protein, 100 nM biotinylated H3K14Ac, and 0–250 μM of inhibitors. The mixture (40 μL) was further incubated for 1 h in a dark room, and the luminescence was read on a BioTek Cytation5 imaging reader using an AlphaScreen detection filter cube. Data was plotted in GraphPad Prism using nonlinear regression log(inhibitor) vs response (three parameters).
where y = AlphaScreen count, ymax = maximum AlphaScreen count, and ymin = minimum AlphaScreen count.
Differential Scanning Fluorimetry (DSF).
Bromodomain DSF Tm assays were performed using an Mx3005P (Stratagene) PCR detection system and low profile 96-well PCR plates (UltraFlux, Flat Top, SSI 3400–00S). Bromodomains were buffered in 100 mM Na2HPO4, 500 mM NaCl, pH 6.5, and assayed at a concentration of 10 μM with 100 μM inhibitor and 5× SyproOrange (Invitrogen). Excitation and emission filters were set to 492 and 610 nm, respectively. The temperature was raised by 1 °C/min from 25–95 °C, and fluorescence readings were taken at each interval. Melting curves were analyzed using our online interactive fitting tool for DSF experiments (https://dsf-analysis.herokuapp.com/DSF-analysis) and plotted using GraphPad Prism.
Isothermal Titration Calorimetry.
Binding affinities of inhibitors toward PBRM1-BD2, PBRM1-BD5, SMARCA2B, SMARCA4, and ASH1L were determined by using a VP-ITC instrument (MicroCal). For each inhibitor, PBRM1-BD2, PBRM1-BD5, SMARCA2B, SMARCA4, or ASH1L was injected (1 × 2 μL injection followed by 30 × 10 μL injections) into the cell containing inhibitor with a 7:1 protein:inhibitor stoichiometry (typically 210 μM protein and 30 μM inhibitor but ranging from 210 to 420 μM protein and 30–60 μM inhibitor), and heats of binding were measured. Protein concentrations were determined via the method of Bradford.29 The buffer used for all ITC experiments consisted of 50 mM HEPES (pH 7.5 at 20 °C), 500 mM NaCl, 5% v/v glycerol, and 1% v/v DMSO; except for experiments involving PBRM1-BD2 whose buffer consisted of 100 mM Na2PO4 (pH 7.5 at 20 °C), 100 mM NaCl, 5% v/v glycerol, and up to 2% v/v DMSO. Kd values were determined by least-squares fitting to the raw data using Origin (OriginLab).
Cell Culture.
LNCaP (clone FGC) (RRID:CVCL_1379), PC3 (RRID:CVCL_0035), RWPE-1 (RRID:CVCL_3791), and HEK293T (RRID:CVCL_0063) cells were purchased from American Type Culture Collection (ATCC, Manassas, VA). Media and supplements were obtained from Corning Mediatech, Inc., unless otherwise noted. HEK293T cells were cultured in DMEM media supplemented with 10% v/v fetal bovine serum, 100 units/mL penicillin, and 100 μg/mL streptomycin, 1 mM sodium pyruvate, and 2 mM l-alanyl-l-glutamine (Glutagro) and 1:10000 Plasmocin (Invivogen, San Diego, CA). PC3 cells were cultured in F12K media with the same supplements as above. LNCaP cells were cultured in RPMI-1640 with 1× MEM nonessential amino acids and the same supplements as above, and RWPE-1 cells were cultured in Keratinocyte SFM (Gibco 17005–042, Thermo Scientific). All cultures were used up to passage number 20 and tested monthly for Mycoplasma contamination with MycoAlert Mycoplasma detection kit (Lonza, Switzerland).
Lentivirus Preparation.
HEK293T cells were transfected with lentivirus constructs along with packaging vectors pMD2.G and psPAX2. After 48 h, the supernatant was collected and concentrated by ultracentrifugation (17 300 rpm for 2 h) and resuspended in 200 μL of PBS.
PBRM1 Knockdown and Viability Measurement.
First, 500 000–600 000 cells were seeded in 6 cm plates. When cells reached 50–80% confluency, (24–72 h) lentivirus containing pLKO.1 vector control or shPBRM1 was added to cells. shRNA was designed by The RNAi Consortium and sold by Horizon, a PerkinElmer company (shPBRM1–3, clone ID TRCN0000015993, sequence ATTTGCTGGTAATAATCAGGG; shPBRM1–4, clone ID TRCN0000015994, sequence TTTGTAGATCAAAGACTCCGG). After 24 h incubation, the cells were selected by treatment with puromycin (2 μg/mL) for 48 h. The cells (5000 cells per well) were reseeded in a 96-well plate and grown for 4 days. Cell viability was measured with a CellTiter-Glo kit at day 0 and day 4 and calculated as a percentage of vector control cells.
Nuclear Lysate Preparation.
Cells (5 × 10⁵) were lysed in 500 μL of buffer A (20 mM HEPES, pH 7.9, 25 mM KCl, 10% v/v glycerol, 0.1% v/v Nonidet P-40 with protease inhibitors for 10 min on ice. Nuclei were pelleted at 600g for 10 min and resuspended in lysis buffer (20 mM HEPES, pH 7.5, 200 mM KOAc, 0.2% v/v Nonidet P-40, 2 mM MgCl2) containing protease inhibitors. Nuclei were rotated for 30 min at 4 °C, and the lysate was cleared at 21 000g for 10 min.
Immunoblot Analysis.
Nuclear lysates were quantified using BCA Assay (Pierce, Rockford, IL). Equal amounts of protein were electrophoresed on a Novex 4–12% precast gel, transferred onto 0.45 μm PVDF membrane, and blocked 1 h in 5% w/v BSA in TBST. After overnight incubation in primary antibodies, the membrane was incubated with infrared-dye labeled Li-Cor goat antimouse or antirabbit antibodies. The images were acquired using a Li-Cor imaging system.
Cell Viability Assays.
Cells were seeded in a 96-well plate and incubated for 12–24 h prior to initial treatment. The number of cells per well was chosen empirically based on cell growth rates (LNCaP, 5000 cells/well; PC3 and RWPE-1, 3000 cells per well; HEK293T, 1000 cells/well). Cells were treated with either DMSO control or serial dilutions of inhibitors, and media with compound was refreshed every 48 h. Cells were harvested when control samples reached confluence (293T cells, 5 days; PC3 cells, 6 days; and RWPE-1 and LNCaP cells, 7 days), and cell viability was measured via CellTiter-Glo (Promega).
Knockdown with compound treatment: LNCaP cells were transfected with either PBRM1 knockdown or vector control and treated for 48 h with (1:1000) puromycin. Cells (5000) were seeded in a 96-well plate for 12 h. Cells were treated with 16 or DMSO control for 5 days, with media changes every 48 h, and cell viability was measured via CellTiter-Glo (Promega).
Peptide Pulldown.
LNCaP cells (1 × 10⁷) were harvested and lysed in 5 mL of buffer A (25 mM HEPES, pH 7.6, 25 mM KCl, 5 mM MgCl2, 0.05 mM EDTA, 0.1% v/v Nonidet P-40, 10% v/v glycerol, protease inhibitors) for 10 min on ice. Nuclei were pelleted at 600g for 10 min and resuspended in 2 mL of binding buffer 1 (25 mM Tris, pH 8, 250 mM NaCl, 1% v/v Nonidet P-40, 1 mM EDTA, and protease inhibitors) for multiply acetylated peptide-binding analysis or binding buffer 2 (25 mM Tris, pH 8, 150 mM NaCl, 1% v/v Nonidet P-40, 1 mM EDTA, and protease inhibitors) for singly acetylated peptide binding analysis, and rotated at 4 °C for 10 min. The lysate was cleared at 21 000g for 10 min. The lysate was split and 50 μM inhibitor was added to one-half while an equal volume of DMSO was added to the other half, and both tubes were incubated 10 min on ice. Lysate (200 μL) was added to 2 μg of biotin-labeled peptide (AnaSpec), and samples were rotated at 4 °C for 1 h. The following peptides were used: H3(1–30), H3K14Ac(1–30), and H3K14/18/23/27Ac(1–30). Streptavidin Agarose Ultra Performance Resin (15 μL) (Solulink, San Diego, CA) was washed three times with binding buffer and added to lysates for 30 min to capture peptides. The beads were washed for 3 × 5 min in their appropriate binding buffer and resuspended in 1× Bolt LDS sample buffer (Invitrogen) and boiled for 5 min. Nuclear lysate input and the samples were processed for immunoblotting analysis.
Statistics.
Statistics were performed using GraphPad Prism 9. Statistical details are provided in figure legends and within the text.
Synthesis.
General Experimental.
Reagents were from Sigma-Aldrich, AA Blocks, TCI, or Ambeed unless otherwise stated. Anhydrous solvents used in reactions were either analytical grade as obtained commercially (Sigma-Aldrich) or were dried via Grubbs apparatus. HPLC grade solvents were employed for workup and chromatography. Reagents were used as supplied (analytical or HPLC grade) without prior purification. Anhydrous MgSO4 was used as a drying agent.
Thin-layer chromatography was performed using glass plates coated with 60 F254 silica. Plates were visualized using UV light (254 nm) or 1% (w/v) aq KMnO4 stain. MPLC was performed using Biotage Sfär HC-Duo or SNAP Ultra columns on a Biotage Isolera in series with a Biotage Dalton 2000 mass spectrometer. Retention factors (Rf) are quoted to a precision of 0.05.
Microwave reactions were carried out using a Biotage Initiator+.
Deuterated solvents were from Sigma. 1H NMR and 13C NMR spectra were recorded using a Bruker AVIII500 NMR spectrometer equipped with a TCI cryoprobe. Fields were locked by external referencing to the relevant residual deuterium resonance. Chemical shifts (δ) are reported in ppm; coupling constants (J) are recorded in Hz to the nearest 0.5 Hz; when peak multiplicities are reported, the following abbreviations are used: s = singlet, d = doublet, t = triplet, q = quartet, m = multiplet, br = broadened, dd = doublet of doublets, dt = doublet of triplets, td = triplet of doublets. Spectra were recorded at room temperature unless otherwise stated.
Low-resolution mass spectra (m/z) were recorded using a Biotage Dalton 2000 by using either an APCI or ESI probe. High-resolution mass spectra were recorded at the Indiana University Mass Spectrometry Facility on a Thermo Scientific Orbitrap XL spectrometer by use of the indicated ionization method. A postacquisition gain correction was applied using reserpine as a lock mass.
For compounds, purity is >95%. Analytical high-performance liquid chromatography (HPLC) was used to assess the purity of key compounds (SI, Figure S16). Analytical HPLC was carried out on a Hypersil GOLD column (C18, 250 × 4.6 mm) using a flow rate of 1 mL/min with detection at 235, 254, and 280 nm. A 30 min gradient of 5–95% MeOH with 0.1% v/v trifluoroacetic acid in H2O with 0.1% v/v trifluoroacetic acid followed by 5 min of 95% MeOH with 0.1% v/v trifluoroacetic acid was used.
General Procedure A: Synthesis of Aminobenzamides (SI, Scheme S6).18
The desired compound was obtained according to the reported procedure.18 The appropriate aminobenzonitrile (1 mmol) and K2CO3 (0.2 mmol) were added to deionized water (8.5 mL/mmol substrate) in a 20 mL microwave vial charged with a stir bar. The reaction was irradiated under microwave at 150 °C for 1.5 h. After the consumption of the starting material (as assessed by TLC), the reaction was cooled to room temperature and then extracted with ethyl acetate (3 × 10 mL). The combined organic layer was dried (anhydrous MgSO4) and concentrated under vacuum. The resulted residue was purified via flash chromatography.
General Procedure B: Synthesis of 2,3-Dihydroquinazalinones (SI, Scheme S7).38
To a stirred solution of the appropriate aminobenzamide (1 mmol) in DMSO (1 mL/mmol) and 0.2 M KOH (2 mL/mmol) was added the appropriate benzaldehyde (1.2 mmol) dropwise, and the mixture was heated to the required temperature (rt to 80 °C). After the consumption of the starting material (as assessed by TLC), the reaction was cooled to room temperature and the crude product mixture was concentrated under reduced pressure, then diluted with ethyl acetate and washed with water (3 × 10 mL). The organic layer was dried (anhydrous MgSO4) and concentrated under vacuum. The resulted residue was purified via flash chromatography.
Compound Characterization.
2-Aminobenzamide (9a).
2-Aminobenzonitrile (1.4 g, 12.7 mmol) was hydrolyzed according to general procedure A. Purification by MPLC (1% EtOAc/hexanes to 60% EtOAc/hexanes) gave a white solid (1.4 g, 88%). TLC Rf 0.35 (50% EtOAc/hexanes). 1H NMR (500 MHz, DMSO-d6) δ 7.68 (s, 1H), 7.49 (d, J = 8.0 Hz, 1H), 7.10 (t, J = 8.0 Hz, 1H), 7.02 (s, 1H), 6.64 (d, J = 8.0 Hz, 1H), 6.53 (s, 2H), 6.45 (t, J = 7.5 Hz, 1H). 13C NMR (126 MHz, DMSO-d6) δ 171.2, 150.1, 131.8, 128.7, 116.3, 114.3, 113.6. LRMS (APCI) m/z: calculated for C7H9N2O [M + H]+ 137.1; observed 137.1. Analytical data are consistent with those reported.18
2-Amino-6-chlorobenzamide (9b).
2-Amino-6-chlorobenzonitrile (2 g, 13.2 mmol) was hydrolyzed according to general procedure A. Purification by MPLC (1% EtOAc/hexanes to 80% EtOAc/hexanes) gave a white solid (1.8 g, 81%). TLC Rf 0.65 (50% EtOAc/hexanes). 1H NMR (500 MHz, DMSO-d6) δ 7.79 (s, 1H), 7.56 (s, 1H), 6.99 (t, J = 8.0 Hz, 1H), 6.61 (d, J = 8.0 Hz, 1H), 6.56 (d, J = 8.0 Hz, 1H), 5.19 (s, 2H). 13C NMR (126 MHz, DMSO-d6) δ 167.5, 147.0, 129.9, 129.8, 121.6, 116.1, 113.6. LRMS (APCI) m/z: calculated for C7H835ClN2O [M + H]+ 171.0; observed 171.0. Analytical data are consistent with those reported.18
2-Amino-6-methoxybenzamide (9c).
2-Amino-6-methoxybenzonitrile (740 mg, 5 mmol) was hydrolyzed according to general procedure A. Purification by MPLC (1% EtOAc/hexanes to 80% EtOAc/hexanes) gave white solid (720 mg, 87%). TLC Rf 0.2 (50% EtOAc/hexanes). 1H NMR (500 MHz, DMSO-d6) δ 7.51 (s, 1H), 7.24 (s, 1H), 6.99 (t, J = 8.0 Hz, 1H), 6.33 (s, 2H), 6.28 (d, J = 8.0 Hz, 1H), 6.15 (d, J = 8.0 Hz, 1H), 3.74 (s, 3H). 13C NMR (126 MHz, DMSO-d6) δ 169.2, 158.4, 151.0, 131.0, 109.3, 105.1, 97.9, 55.5. LRMS (APCI) m/z: calculated for C8H11N2O2 [M + H]+ 167.1; observed 167.1. Analytical data are consistent with those reported.18
2-Amino-6-methylbenzamide (9d).
2-Amino-6-methylbenzonitrile (132 mg, 1 mmol) was hydrolyzed according to general procedure A. Purification by MPLC (1% EtOAc/hexanes to 40% EtOAc/hexanes) gave a white solid (133 mg, 89%). TLC Rf 0.7 (50% EtOAc/hexanes). 1H NMR (500 MHz, DMSO-d6) δ 7.61 (s, 1H), 7.40 (s, 1H), 6.90 (t, J = 8.0 Hz, 1H), 6.49 (d, J = 8.0 Hz, 1H), 6.37 (d, J = 7.5 Hz, 1H), 4.88 (s, 2H), 2.19 (s, 3H). 13C NMR (126 MHz, DMSO-d6) δ 171.0, 145.9, 134.7, 129.2, 123.5, 118.4, 113.2, 20.4. LRMS (APCI) m/z: calculated for C8H11N2O [M + H]+ 151.1; observed 151.1. Analytical data are consistent with those reported.39
2-Amino-6-bromobenzamide (9e).
2-Amino-6-bromobenzonitrile (500 mg, 2.6 mmol) was hydrolyzed according to general procedure A. Purification by MPLC (1% EtOAc/hexanes to 100% EtOAc/hexanes) gave a white solid (480 mg, 87%). TLC Rf 0.1 (50% EtOAc/hexanes). 1H NMR (500 MHz, DMSO-d6) δ 7.79 (s, 1H), 7.53 (s, 1H), 6.92 (t, J = 8.0 Hz, 1H), 6.71 (d, J = 8.0 Hz, 1H), 6.64 (d, J = 8.0 Hz, 1H), 5.13 (s, 2H). 13C NMR (126 MHz, DMSO-d6) δ 168.3, 146.7, 144.5, 130.0, 124.0, 119.2, 114.0. LRMS (APCI) m/z: calculated for C7H879BrN2O [M + H]+ 215.0; observed 215.0. Analytical data are consistent with those reported.18
2-(2-Chloro-6-fluorophenyl)-2,3-dihydroquinazolin-4(1H)-one (5).
2-Aminobenzamide (9a; 136 mg, 1 mmol) and 2-chloro-6-fluorobenzaldehyde (187 mg, 1.2 mmol) were reacted according to general procedure B. Purification by MPLC (1% EtOAc/hexanes to 60% EtOAc/hexanes) gave a white solid (90 mg, 32%). TLC Rf 0.65 (50% EtOAc/hexanes). 1H NMR (500 MHz, DMSO-d6) δ 8.21 (s, 1H), 7.60 (dd, J = 8.0, 1.5 Hz, 1H), 7.44 (td, J = 8.0, 5.5 Hz, 1H), 7.34 (d, J = 8.0 Hz, 1H), 7.27–7.18 (m, 2H), 7.05 (s, 1H), 6.64 (t, J = 7.5 Hz, 1H), 6.60 (d, J = 8.0 Hz, 1H), 6.43 (s, 1H). 13C NMR (126 MHz, DMSO-d6) δ 162.8, 161.9 (d, 1JCF = 253.0 Hz), 147.5, 133.4 (d, 3JCF = 6.0 Hz), 133.2, 131.1 (d, 3JCF = 10.0 Hz), 127.1, 125.9 (d, 4JCF = 3.0 Hz), 125.5 (d, 2JCF = 13.5 Hz), 116.7, 115.7 (d, 2JCF = 23.0 Hz), 113.8, 113.6, 62.0 (br s). HRMS (APCI) m/z: calculated for C14H1135Cl19FN2O [M + H]+ 277.0538; observed 277.0541. HPLC Rt 28.91 min, purity 95.9%. Analytical data are consistent with those reported.38
2-Chloro-6-(4-chlorobutanamido)benzamide (7b).
The desired compound was obtained according to the reported procedure.18 To a stirred solution of 6-chloro-2-aminobenzamide (9b; 170 mg, 1 mmol) in THF (2.5 mL/mmol) at 0 °C were added triethylamine (0.3 mL, 2 mmol) and 4-chlorobutanoyl chloride (0.15 mL, 1.2 equiv) in THF (2 mL/mmol). After the completion of the reaction (as assessed by TLC), the reaction mixture was extracted with ethyl acetate and washed with water (3 × 10 mL). The combined organic layer was dried (anhydrous MgSO4) and concentrated under vacuum. The residue was purified via MPLC (1% EtOAc/hexanes to 50% EtOAc/hexanes), resulting in a white amorphous solid (220 mg, 80%). TLC Rf 0.40 (50% EtOAc/hexanes). 1H NMR (500 MHz, DMSO-d6) δ 9.32 (s, 1H), 7.88 (s, 1H), 7.72 (s, 1H), 7.59 (d, J = 8.0 Hz, 1H), 7.33 (t, J = 8.0 Hz, 1H), 7.26 (d, J = 8.0 Hz, 1H), 3.66 (t, J = 6.5 Hz, 2H), 2.45 (d, J = 7.0 Hz, 2H), 1.98 (p, J = 7.0 Hz, 2H). 13C NMR (126 MHz, DMSO-d6) δ 174.4, 170.7, 166.0, 135.8, 129.7, 129.4, 125.5, 123.9, 44.7, 32.9, 28.1. LRMS (APCI) m/z: calculated for C11H1335Cl2N2O2 [M + H]+ 275.0; observed 275.0. Analytical data are consistent with those reported.18
6-Chloro-2,3-dihydropyrrolo[1,2-a]quinazolin-5(1H)-one (7c).
The desired compound was obtained according to the reported procedure.18 To a stirred solution of 2-chloro-6-(4-chlorobutanamido)benzamide (7b; 180 mg, 0.7 mmol) in THF (10 mL/mmol) was added t-BuOK (147 mg, 1.3 mmol). After the completion of the reaction (as assessed by TLC), the solvent was removed under reduced pressure. The crude mixture was diluted with CH2Cl2 and washed with NaHCO3 (15 mL), then water and finally with brine. The combined organic layer was dried (anhydrous MgSO4) and concentrated under vacuum. Purification of the resulted residue via MPLC (1% MeOH/DCM to 5% MeOH/DCM) gave the title compound as a white amorphous solid (70 mg, 50%). TLC Rf 0.3 (5% MeOH/DCM). 1H NMR (500 MHz, DMSO-d6) δ 7.69 (t, J = 8.0 Hz, 1H), 7.46 (d, J = 8.0 Hz, 1H), 7.40 (d, J = 8.5 Hz, 1H), 4.18 (t, J = 7.5 Hz, 2H), 2.99 (t, J = 8.0 Hz, 2H), 2.22 (p, J = 7.5 Hz, 2H). 13C NMR (126 MHz, DMSO-d6) δ 166.7, 166.0, 141.1, 133.7, 133.4, 127.8, 115.1, 114.8, 49.3, 32.0, 18.0. LRMS (APCI) m/z: calculated for C11H1035ClN2O [M + H]+ 221.0; observed 221.0. Analytical data are consistent with those reported.18
(E)-6-Chloro-3-((dimethylamino)methylene)-2,3-dihydropyrrolo[1,2-a]quinazolin-5(1H)-one (2).
The desired compound was obtained according to the reported procedure.18 To a stirred solution of 6-chloro-2,3-dihydropyrrolo[1,2-a]quinazolin-5(1H)-one (7c; 54 mg, 0.24 mmol) in anhydrous DMF (2 mL) was added phosphoryl trichloride (0.5 mL, 0.5 mmol). The reaction was heated to 70 °C until the completion of the reaction (as assessed by TLC). The reaction was then cooled to room temperature, and the solvent was removed under reduced pressure. The crude mixture was diluted with CH2Cl2 and washed with NaHCO3 (15 mL), and the aqueous layer was extracted with CH2Cl2. The combined organic layer was dried (anhydrous MgSO4) and concentrated under vacuum. The residue was purified via MPLC (1% MeOH/DCM to 5% MeOH/DCM), which resulted in a tan amorphous solid (41 mg, 94%). TLC Rf 0.3 (5% MeOH/DCM). 1H NMR (500 MHz, DMSO-d6) δ 7.54 (t, J = 8.0 Hz, 1H), 7.37 (s, 1H), 7.24 (d, J = 8.0 Hz, 1H), 7.16 (d, J = 8.0 Hz, 1H), 4.10–4.01 (m, 2H), 3.18 (t, J = 8.0 Hz, 2H), 3.09 (s, 6H). 13C NMR (126 MHz, DMSO-d6) δ 177.0, 163.0, 144.3, 141.9, 133.5, 132.7, 126.1, 115.1, 113.5, 93.6, 46.1, 22.5 (2C). HRMS (ESI) m/z: calculated for C14H1535ClN3O [M + H]+ 276.0898; observed 276.0899. Analytical data are consistent with those reported.18
(E)-6-Chloro-3-(2-ethylbutylidene)-2,3-dihydropyrrolo[1,2-a]quinazolin-5(1H)-one (7).
The desired compound was obtained according to the reported procedure.18 To a stirred solution of 6-chloro-2,3-dihydropyrrolo[1,2-a]quinazolin-5(1H)-one (7c; 100 mg, 0.45 mmol) in CH2Cl2 (10 mL/mmol) was added t-BuOK (61 mg, 0.54 mmol). After 5 min, 2-ethylbutyraldehyde (61 μL, 0.54 mmol) was added. After completion of the reaction (approximately 1 h, as assessed by TLC), the crude mixture was diluted with CH2Cl2 and washed with NaHCO3 (15 mL), and the aqueous layer extracted with CH2Cl2 (3 × 10 mL). The combined organic layer was dried (anhydrous MgSO4) and concentrated under vacuum. The resulted residue was purified via MPLC (1% MeOH/DCM to 5% MeOH/DCM) and gave title compound as a white amorphous solid (80 mg, 60%). TLC Rf 0.3 (4% MeOH/DCM). 1H NMR (500 MHz, DMSO-d6) δ 7.69 (t, J = 8.0 Hz, 1H), 7.46 (d, J = 8.0 Hz, 1H), 7.43 (d, J = 8.0 Hz, 1H), 6.52 (dt, J = 10.5, 2.5 Hz, 1H), 4.25 (t, J = 7.5, 2H), 2.95 (ddd, J = 8.5, 6.5, 2.5 Hz, 2H), 2.21 (ddq, J = 13.5, 9.0, 5.0 Hz, 1H), 1.53 (ddd, J = 13.0, 7.5, 5.0 Hz, 2H), 1.35 (dt, J = 13.5, 8.0 Hz, 2H), 0.85 (t, J = 7.5 Hz, 6H). 13C NMR (126 MHz, DMSO-d6) δ 166.8, 158.9, 141.3, 139.3, 133.7, 133.4, 132.8, 128.1, 115.7, 115.1, 46.4, 42.8, 26.9, 22.4 (2C), 11.7 (2C). HRMS (APCI) m/z: calculated for C17H2035ClN2O [M + H]+ 303.1259; observed 303.1261. HPLC Rt 26.97 min, purity 100%. Analytical data are consistent with those reported.18
2-(4-Chlorobutanamido)benzamide (8b).
The desired compound was obtained according to the reported procedure.18 To a stirred solution of 2-aminobenzamide (1 g, 7.35 mmol) in THF (20 mL) at 0 °C were added triethylamine (2 mL, 14.7 mmol) and 4-chlorobutanoyl chloride (1 mL, 8.8 mmol) in THF (18 mL). After the completion of the reaction (as assessed by TLC), the reaction mixture was extracted with ethyl acetate and washed with water (3 × 10 mL). The combined organic layer was dried (anhydrous MgSO4) and concentrated under vacuum. The residue was purified via MPLC (1% EtOAc/hexanes to 100% EtOAc/hexanes), which resulted in the title compound (1.4 g, 80%). TLC Rf 0.6 (5% MeOH/DCM). 1H NMR (500 MHz, DMSO-d6) δ 11.68 (s, 1H), 8.41 (d, J = 8.0 Hz, 1H), 8.24 (s, 1H), 7.77 (dd, J = 8.0, 1.5 Hz, 1H), 7.70 (s, 1H), 7.46 (td, J = 8.0, 1.5 Hz, 1H), 7.09 (t, J = 7.5 Hz, 1H), 3.68 (t, J = 6.5 Hz, 2H), 2.48 (t, J = 7.5 Hz, 2H), 2.03 (p, J = 7.0 Hz, 2H). 13C NMR (126 MHz, DMSO-d6) δ 170.7, 169.9, 139.4, 132.1, 128.5, 122.3, 120.1, 119.6, 44.6, 34.3, 27.8. LRMS (APCI) m/z: calculated for C11H1435ClN2O2 [M + H]+ 241.1; observed 241.1. Analytical data are consistent with those reported.18
2,3-Dihydropyrrolo[1,2-a]quinazolin-5(1H)-one (8c).
The desired compound was obtained according to the reported procedure.18 To a stirred solution of 6-(4-chlorobutanamido)benzamide (8b; 1.4 g, 5.8 mmol) in THF (30 mL) was added t-BuOK (1.3 g, 11.7 mmol). After the completion of the reaction (as assessed by TLC), the solvent was removed under reduced pressure. The crude mixture was diluted with CH2Cl2 and washed with NaHCO3 (15 mL), then water, and finally with brine. The combined organic layer was dried (anhydrous MgSO4) and concentrated under vacuum. The resulted residue was purified via MPLC (1% MeOH/DCM to 5% MeOH/DCM) which gave the title compound (0.6 g, 50%). TLC Rf 0.3 (5% MeOH/DCM). 1H NMR (500 MHz, DMSO-d6) δ 8.03 (d, J = 8.0 Hz, 1H), 7.78 (td, J = 7.5, 1.5 Hz, 1H), 7.45 (dd, J = 8.0, 7.5 Hz, 2H), 4.25–4.19 (m, 2H), 3.01 (t, J = 8.0 Hz, 2H), 2.23 (p, J = 8.0 Hz, 2H). 13C NMR (126 MHz, DMSO-d6) δ 169.0, 166.8, 138.7, 133.6, 127.3, 125.3, 118.1, 115.8, 48.5, 32.3, 18.2. LRMS (APCI) m/z: calculated for C11H11N2O [M + H]+ 187.1; observed 187.1. Analytical data are consistent with those reported.18
(E)-3-(2-Ethylbutylidene)-2,3-dihydropyrrolo[1,2-a]quinazolin-5(1H)-one (8).
The desired compound was obtained according to the reported procedure.18 To a stirred solution of 2,3-dihydropyrrolo[1,2-a]quinazolin-5(1H)-one (8c; 200 mg, 1.1 mmol) in CH2Cl2 (5 mL) was added t-BuOK (145 mg, 1.3 mmol). After 5 min, 2-ethylbutyraldehyde (0.15 mL, 1.2 mmol) was added. After completion of the reaction (approximately 1 h, as assessed by TLC), the crude mixture was diluted with CH2Cl2 and washed with NaHCO3 (15 mL), and the aqueous layer was extracted with CH2Cl2 (3 × 10 mL). The combined organic layer was dried (anhydrous MgSO4) and concentrated under vacuum. The resulted residue was purified via MPLC (1% MeOH/DCM to 5% MeOH/DCM) and gave the title compound (100 mg, 34%). TLC Rf 0.70 (10% MeOH/DCM). 1H NMR (500 MHz, DMSO-d6) δ 8.04 (d, J = 8.0 Hz, 1H), 7.78 (t, J = 7.5 Hz, 1H), 7.56–7.41 (m, 2H), 6.53 (dd, J = 10.5, 3.0 Hz, 1H), 4.26 (t, J = 7.0 Hz, 2H), 2.96 (td, J = 7.0, 2.5 Hz, 2H), 2.21 (tt, J = 9.0, 4.5 Hz, 1H), 1.53 (dp, J = 13.0, 7.0 Hz, 2H), 1.34 (dp, J = 15.0, 7.5 Hz, 2H), 0.85 (t, J = 7.5 Hz, 6H). 13C NMR (126 MHz, DMSO-d6) δ 169.0, 159.6, 138.9, 138.8, 133.6, 133.2, 127.3, 125.7, 119.1, 115.8, 45.7, 42.8, 27.0, 22.6 (2C), 11.7 (2C). HRMS (APCI) m/z: calculated for C17H21N2O [M + H]+ 269.1648; observed 269.1651. HPLC Rt 20.90 min, purity 100%. Analytical data are consistent with those reported.18
5-Chloro-2-(2-chloro-6-fluorophenyl)-2,3-dihydroquinazolin-4(1H)-one (11).
2-Amino-6-chlorobenzamide (9b; 170 mg, 1 mmol) and 2-chloro-6-fluorobenzaldehyde (187 mg, 1.2 mmol) were reacted according to general procedure B. Purification by MPLC (1% EtOAc/hexanes to 40% EtOAc/hexanes) gave a white solid (100 mg, 32%). TLC Rf 0.70 (50% EtOAc/hexanes). 1H NMR (500 MHz, DMSO-d6) δ 8.34 (s, 1H), 7.45 (td, J = 8.0, 5.5 Hz, 1H), 7.39–7.34 (m, 2H), 7.27 (dd, J = 10.5, 8.0 Hz, 1H), 7.14 (t, J = 8.0 Hz, 1H), 6.67 (d, J = 8.0 Hz, 1H), 6.62 (d, J = 8.0 Hz, 1H), 6.31 (s, 1H). 13C NMR (126 MHz, DMSO-d6) δ 161.9 (d, 1JCF = 253.0 Hz), 160.8, 150.4, 133.7, 133.5 (d, 3JCF = 6.0 Hz), 132.9, 131.3 (d, 3JCF = 10.0 Hz), 126.0 (d, 4JCF = 3.0 Hz), 124.5 (d, 2JCF = 14.0 Hz), 120.0, 115.7 (d, 2JCF = 23.0 Hz), 113.3, 111.0, 61.3 (br s). HRMS (APCI) m/z: calculated for C14H1035Cl219FN2O [M + H]+ 311.0149; observed 311.0152. HPLC Rt 28.46 min, purity 98.5%.
5-Chloro-2-phenyl-2,3-dihydroquinazolin-4(1H)-one (12).
2-Amino-6-chlorobenzamide (9b; 100 mg, 0.6 mmol) and benzaldehyde (0.07 mL, 0.7 mmol) were reacted according to general procedure B. Purification by MPLC (1% EtOAc/hexanes to 50% EtOAc/hexanes) gave a white solid (90 mg, 65%). TLC Rf 0.65 (50% EtOAc/hexanes). 1H NMR (500 MHz, DMSO-d6) δ 8.40 (bs, 1H), 7.49–7.41 (m, 3H), 7.38 (app t, J = 7.0 Hz, 2H), 7.34 (d, J = 7.0 Hz, 1H), 7.14 (t, J = 8.0 Hz, 1H), 6.74 (d, J = 8.0 Hz, 1H), 6.66 (d, J = 7.5 Hz, 1H), 5.65 (s, 1H). 13C NMR (126 MHz, DMSO-d6) δ 161.2, 150.6, 140.6, 133.7, 133.0, 128.5, 128.3, 126.9, 120.2, 113.9, 112.0, 65.5. HRMS (APCI) m/z: calculated for C14H1235ClN2O [M + H]+ 259.0633; observed 259.0635. HPLC Rt 25.56 min, purity 98.7%.
5-Chloro-2-(2-fluorophenyl)-2,3-dihydroquinazolin-4(1H)-one (13).
2-Amino-6-chlorobenzamide (9b; 100 mg, 0.6 mmol) and 2-fluorobenzaldehyde (0.07 mL, 0.7 mmol) were reacted according to general procedure B. Purification by MPLC (1% EtOAc/hexanes to 60% EtOAc/hexanes) gave a white solid (70 mg, 42%). TLC Rf 0.75 (50% EtOAc/hexanes). 1H NMR (500 MHz, DMSO-d6) δ 8.37 (s, 1H), 7.54–7.48 (m, 1H), 7.43–7.41 (m, 1H), 7.35 (s, 1H), 7.26–7.20 (m, 2H), 7.16 (t, J = 8.0 Hz, 1H), 6.74 (d, J = 8.0 Hz, 1H), 6.69 (d, J = 7.5 Hz, 1H), 5.93 (s, 1H). 13C NMR (126 MHz, DMSO-d6) δ 161.2, 159.8 (d, 1JCF = 247.5 Hz), 150.4, 133.8, 133.0, 130.6 (d, 3JCF = 8.0 Hz), 128.4 (d, 3JCF = 3.5 Hz), 127.2 (d, 2JCF = 12.5 Hz), 124.4 (d, 4JCF = 3.5 Hz), 120.4, 115.6 (d, 2JCF = 22.0 Hz), 113.8, 111.8, 60.1 (d, 3JCF = 3.5 Hz). LRMS (APCI) m/z: calculated for C14H1135Cl19FN2O [M + H]+ 277.1; observed 277.1. HPLC Rt 25.56 min, purity 98.4%.
5-Chloro-2-(2-chlorophenyl)-2,3-dihydroquinazolin-4(1H)-one (14).
2-Amino-6-chlorobenzamide (9b; 100 mg, 0.6 mmol) and 2-chlorobenzaldehyde (0.08 mL, 0.7 mmol) were reacted according to general procedure B. Purification by MPLC (1% EtOAc/hexanes to 40% EtOAc/hexanes) gave a white solid (60 mg, 34%). TLC Rf 0.7 (50% EtOAc/hexanes). 1H NMR (500 MHz, DMSO-d6) δ 8.33 (s, 1H), 7.66–7.61 (m, 1H), 7.51–7.46 (m, 1H), 7.42–7.38 (m, 2H), 7.31 (s, 1H), 7.17 (t, J = 8.0 Hz, 1H), 6.75 (d, J = 8.0 Hz, 1H), 6.72 (d, J = 7.5 Hz, 1H), 6.00 (s, 1H). 13C NMR (126 MHz, DMSO-d6) δ 161.2, 150.5, 136.8, 133.8, 133.1, 132.0, 130.4, 129.6, 128.7, 127.4, 120.5, 114.0, 111.8, 62.8. HRMS (APCI) m/z: calculated for C14H1135Cl19FN2O [M + H]+ 293.0243; observed 293.0247.
5-Chloro-2-(2-methylphenyl)-2,3-dihydroquinazolin-4(1H)-one (15).
2-Amino-6-chlorobenzamide (9b; 100 mg, 0.6 mmol) and 2-methylbenzaldehyde (0.07 mL, 0.7 mmol) were reacted according to general procedure B. Purification by MPLC (1% EtOAc/hexanes to 70% EtOAc/hexanes) gave a white solid (100 mg, 62%). TLC Rf 0.7 (50% EtOAc/hexanes). 1H NMR (500 MHz, DMSO-d6) δ 8.18 (s, 1H), 7.53 (dd, J = 7.5, 2.0 Hz, 1H), 7.29–7.18 (m, 3H), 7.18–7.13 (m, 2H), 6.74 (d, J = 8.0 Hz, 1H), 6.70 (d, J = 8.0 Hz, 1H), 5.86 (s, 1H), 2.40 (s, 3H). 13C NMR (126 MHz, DMSO-d6) δ 161.6, 151.4, 136.9, 136.2, 133.8, 132.8, 130.6, 128.5, 127.4, 125.8, 120.2, 113.9, 112.1, 63.7, 18.7. HRMS (APCI) m/z: calculated for C15H1435ClN2O [M + H]+ 273.0789; observed 273.0792. HPLC Rt 27.64 min, purity 96.2%.
5-Chloro-2-(3-methylphenyl)-2,3-dihydroquinazolin-4(1H)-one (16).
2-Amino-6-chlorobenzamide (9b; 100 mg, 0.6 mmol) and 3-methylbenzaldehyde (0.1 mL, 0.7 mmol) were reacted according to general procedure B. Purification by MPLC (1% EtOAc/hexanes to 60% EtOAc/hexanes) gave a white solid (40 mg, 25%). TLC Rf 0.4 (50% EtOAc/hexanes). 1H NMR (500 MHz, DMSO-d6) δ 8.34 (s, 1H), 7.37 (s, 1H), 7.30–7.23 (m, 3H), 7.17–7.12 (m, 2H), 6.73 (d, J = 8.0 Hz, 1H), 6.66 (d, J = 8.0 Hz, 1H), 5.60 (s, 1H), 2.30 (s, 3H). 13C NMR (126 MHz, DMSO-d6) δ 161.2, 150.6, 140.5, 137.4, 133.7, 132.9, 129.1, 128.2, 127.5, 124.0, 120.1, 113.9, 112.0, 65.6, 21.0. HRMS (APCI) m/z: calculated for C15H1435ClN2O [M + H]+ 273.0789; observed 273.0790. HPLC purity 95.4%.
5-Chloro-2-(4-methylphenyl)-2,3-dihydroquinazolin-4(1H)-one (17).
2-Amino-6-chlorobenzamide (9b; 100 mg, 0.6 mmol) and 4-methylbenzaldehyde (0.07 mL, 0.7 mmol) were reacted according to general procedure B. Purification by MPLC (1% EtOAc/hexanes to 70% EtOAc/hexanes) gave a white solid (115 mg, 71%). TLC Rf 0.8 (50% EtOAc/hexanes). 1H NMR (500 MHz, DMSO-d6) δ 8.35 (s, 1H), 7.39–7.31 (m, 3H), 7.18 (d, J = 8.0 Hz, 2H), 7.13 (t, J = 8.0 Hz, 1H), 6.72 (d, J = 8.0 Hz, 1H), 6.65 (d, J = 8.0 Hz, 1H), 5.59 (s, 1H), 2.27 (s, 3H). 13C NMR (126 MHz, DMSO-d6) δ 161.2, 150.6, 137.8, 137.6, 133.7, 132.9, 128.8, 126.8, 120.1, 113.9, 112.1, 65.3, 20.6. HRMS (APCI) m/z: calculated for C15H1435ClN2O [M + H]+ 273.0789; observed 273.0792.
5-Chloro-2-(4-methoxyphenyl)-2,3-dihydroquinazolin-4(1H)-one (18).
2-Amino-6-chlorobenzamide (9b; 100 mg, 0.6 mmol) and 4-methoxybenzaldehyde (0.07 mL, 0.7 mmol) were reacted according to general procedure B. Purification by MPLC (1% EtOAc/hexanes to 60% EtOAc/hexanes) gave a white solid (108 mg, 62%). TLC Rf 0.8 (50% EtOAc/hexanes). 1H NMR (500 MHz, DMSO-d6) δ 8.30 (bs, 1H), 7.38 (d, J = 8.5 Hz, 2H), 7.32 (s, 1H), 7.14 (t, J = 8.0 Hz, 1H), 6.93 (d, J = 8.5 Hz, 2H), 6.72 (d, J = 8.0 Hz, 1H), 6.66 (d, J = 8.0 Hz, 1H), 5.59 (s, 1H), 3.73 (s, 3H). 13C NMR (126 MHz, DMSO-d6) δ 161.2, 159.4, 150.7, 133.7, 132.9, 132.4, 128.2, 120.1, 113.9, 113.6, 112.1, 65.2, 55.1. HRMS (APCI) m/z: calculated for C15H1435ClN2O2 [M + H]+ 289.0738; observed 289.074.
2-(2-Methylphenyl)-2,3-dihydroquinazolin-4(1H)-one (19).
2-Aminobenzamide (9a; 100 mg, 0.6 mmol) and 2-methylbenzaldehyde (0.2 mL, 0.7 mmol) were reacted according to general procedure B. Purification by MPLC (1% EtOAc/hexanes to 50% EtOAc/hexanes) gave a white solid (40 mg, 28%). TLC Rf 0.35 (50% EtOAc/hexanes). 1H NMR (500 MHz, DMSO-d6) δ 8.04 (bs, 1H), 7.64 (dd, J = 7.5, 1.5 Hz, 1H), 7.55 (dd, J = 7.5, 2.0 Hz, 1H), 7.30–7.15 (m, 4H), 6.85 (bs, 1H), 6.78–6.65 (m, 2H), 5.99 (s, 1H), 2.42 (s, 3H). 13C NMR (126 MHz, DMSO-d6) δ 164.0, 148.5, 138.0, 136.0, 133.1, 130.6, 128.4, 127.4, 125.9, 117.1, 114.8, 114.4, 64.6, 18.7. HRMS (APCI) m/z: calculated for C15H15N2O [M + H]+ 239.1179; observed 239.1180. HPLC Rt 25.82 min, purity 97.2%.
5-Chloro-2-(3-(trifluoromethyl)phenyl)-2,3-dihydroquinazolin-4(1H)-one (20).
2-Amino-6-chlorobenzamide (9b; 100 mg, 0.6 mmol) and 3-trifluoromethylbenzaldehyde (0.12 mL, 0.7 mmol) were reacted according to general procedure B. Purification by MPLC (1% EtOAc/hexanes to 50% EtOAc/hexanes) gave a white solid (60 mg, 30%). TLC Rf 0.4 (50% EtOAc/hexanes). 1H NMR (500 MHz, DMSO-d6) δ 8.53 (s, 1H), 7.82 (s, 1H), 7.77 (q, J = 6.5 Hz, 2H), 7.75–7.69 (m, 1H), 7.63 (t, J = 7.5 Hz, 1H), 7.53 (s, 1H), 6.75 (d, J = 8.0 Hz, 1H), 6.69 (d, J = 8.0 Hz, 1H), 5.79 (s, 1H). 13C NMR (126 MHz, DMSO-d6) major peaks are listed. δ 161.1, 150.4, 142.2, 133.8, 133.2, 131.1, 129.6, 125.3 (q, 3JCF = 4.0 Hz), 129.0 (q, 2JCF = 32.0 Hz), 124.1 (q, 1JCF = 272.0 Hz), 123.7 (q, 3JCF = 4.0 Hz), 120.6, 114.1, 112.1, 64.8. HRMS (APCI) m/z: calculated for C15H1135Cl19F3N2O [M + H]+ 327.0507; observed 327.0508.
5-Chloro-2-(2,4-dimethylphenyl)-2,3-dihydroquinazolin-4(1H)-one (21).
2-Amino-6-chlorobenzamide (9b; 100 mg, 0.6 mmol) and 2,4-dimethylbenzaldehyde (0.1 mL, 0.7 mmol) were reacted according to general procedure B. Purification by MPLC (1% EtOAc/hexanes to 60% EtOAc/hexanes) gave a white solid (30 mg, 18%). TLC Rf 0.4 (50% EtOAc/hexanes). 1H NMR (500 MHz, DMSO-d6) δ 8.12 (s, 1H), 7.39 (d, J = 8.0 Hz, 1H), 7.15 (t, J = 8.0 Hz, 1H), 7.11 (s, 1H), 7.05–7.00 (m, 2H), 6.74 (d, J = 8.0 Hz, 1H), 6.69 (d, J = 8.0 Hz, 1H), 5.81 (s, 1H), 2.35 (s, 3H), 2.26 (s, 3H). 13C NMR (126 MHz, DMSO-d6) δ 161.6, 151.4, 137.7, 136.0, 134.0, 133.8, 132.8, 131.2, 127.4, 126.3, 120.2, 113.9, 112.1, 63.6, 20.5, 18.6. HRMS (APCI) m/z: calculated for C16H1635ClN2O [M + H]+ 287.0946; observed 287.0948.
5-Chloro-2-(2,4,6-trimethylphenyl)-2,3-dihydroquinazolin-4(1H)-one (22).
2-Amino-6-chlorobenzamide (9b; 100 mg, 0.6 mmol) and 2,4,6-trimethylbenzaldehyde (0.1 mL, 0.7 mmol) were reacted according to general procedure B. Purification by MPLC (1% EtOAc/hexanes to 50% EtOAc/hexanes) gave a white solid (20 mg, 11%). TLC Rf 0.55 (50% EtOAc/hexanes). 1H NMR (500 MHz, DMSO-d6) δ 8.03 (s, 1H), 7.13 (t, J = 8.0 Hz, 1H), 7.04 (s, 1H), 6.86 (s, 2H), 6.68 (d, J = 8.0 Hz, 2H), 6.09 (s, 1H), 2.41 (s, 6H), 2.22 (s, 3H). 13C NMR (126 MHz, DMSO-d6) δ 161.8, 152.0, 137.8, 137.6, 133.9, 132.6, 130.3, 129.7, 120.0, 113.8, 111.9, 62.9, 20.44, 20.36. LRMS (APCI) m/z: calculated for C17H1835ClN2O [M + H]+ 301.1; observed 301.2. HPLC Rt 28.82 min, purity 95.7%.
5-Chloro-2-(3,5-dimethylphenyl)-2,3-dihydroquinazolin-4(1H)-one (23).
2-Amino-6-chlorobenzamide (9b; 100 mg, 0.6 mmol) and 3,5-dimethylbenzaldehyde (0.1 mL, 0.7 mmol) were reacted according to general procedure B. Purification by MPLC (gradient 1% DCM/hexanes to 20% EtOAc/DCM) gave a white solid (30 mg, 18%). TLC Rf 0.45 (50% EtOAc/hexanes). 1H NMR (500 MHz, acetone-d6) δ 7.27–7.12 (m, 4H), 7.01 (s, 1H), 6.88–6.81 (m, 1H), 6.77 (d, J = 8.0 Hz, 1H), 6.41 (s, 1H), 5.72 (s, 1H), 2.29 (s, 6H). 13C NMR (126 MHz, acetone-d6) δ 160.8, 150.5, 139.2, 137.5, 134.4, 132.3, 129.9, 127.8, 124.5, 120.6, 113.4, 66.7, 19.8 (2C). HRMS (ESI) m/z: calculated for C16H1435ClN2O [M − H]− 285.0789; observed 285.0793.
5-Chloro-2-(2,5-dimethylphenyl)-2,3-dihydroquinazolin-4(1H)-one (24).
2-Amino-6-chlorobenzamide (9b; 100 mg, 0.6 mmol) and 2,5-dimethylbenzaldehyde (0.1 mL, 0.7 mmol) were reacted according to general procedure B. Purification by MPLC (gradient 1% DCM/hexanes to 20% EtOAc/DCM) gave white solid (60 mg, 35%). TLC Rf 0.35 (50% EtOAc/hexanes). 1H NMR (500 MHz, DMSO-d6) δ 8.11 (s, 1H), 7.37 (s, 1H), 7.15 (d, J = 8.0 Hz, 1H), 7.12 (s, 1H), 7.09 (s, 2H), 6.74 (d, J = 8.0 Hz, 1H), 6.70 (d, J = 8.0 Hz, 1H), 5.82 (s, 1H), 2.33 (s, 3H), 2.27 (s, 3H). 13C NMR (126 MHz, DMSO-d6) δ 162.2, 152.1, 137.0, 135.2, 134.4, 133.7, 133.4, 131.1, 129.7, 128.6, 120.8, 114.5, 112.7, 64.6, 21.2, 18.8. HRMS (APCI) m/z: C16H1635ClN2O [M + H]+ 287.0946; observed 287.0948.
5-Chloro-2-(2,3-dimethylphenyl)-2,3-dihydroquinazolin-4(1H)-one (25).
2-Amino-6-chlorobenzamide (9b; 100 mg, 0.6 mmol) and 2,3-dimethylbenzaldehyde (0.1 mL, 0.7 mmol) were reacted according to general procedure B. Purification by MPLC (1% EtOAc/hexanes to 60% EtOAc/hexanes) gave a white solid (42 mg, 24%). TLC Rf 0.45 (50% EtOAc/hexanes). 1H NMR (500 MHz, DMSO-d6) δ 8.14 (s, 1H), 7.37 (d, J = 7.5 Hz, 1H), 7.22–7.08 (m, 4H), 6.74 (d, J = 8.0 Hz, 1H), 6.70 (d, J = 8.0 Hz, 1H), 5.90 (s, 1H), 2.28 (s, 3H), 2.25 (s, 3H). 13C NMR (126 MHz, DMSO-d6) δ 162.1, 151.9, 137.4, 137.2, 135.4, 134.4, 133.4, 130.6, 125.9, 125.8, 120.8, 114.5, 112.7, 64.7, 20.7, 15.1. HRMS (APCI) m/z: C16H1635ClN2O [M + H]+ 287.0946; observed 287.0948.
5-Chloro-2-(2,6-dimethylphenyl)-2,3-dihydroquinazolin-4(1H)-one (26).
2-Amino-6-chlorobenzamide (9b; 100 mg, 0.6 mmol) and 2,6-dimethylbenzaldehyde (100 mg, 0.7 mmol) were reacted according to general procedure B. Purification by MPLC (gradient 1% DCM/hexanes to 20% EtOAc/DCM) gave a white solid (20 mg, 12%). TLC Rf 0.4 (50% EtOAc/hexanes). 1H NMR (500 MHz, acetone-d6) δ 7.20 (t, J = 8.0 Hz, 1H), 7.14 (d, J = 7.5 Hz, 1H), 7.07–6.98 (m, 3H), 6.82 (d, J = 8.0 Hz, 1H), 6.78 (d, J = 8.0 Hz, 1H), 6.38 (s, 1H), 6.22 (s, 1H), 2.53 (s, 6H). 13C NMR (126 MHz, acetone-d6) δ 151.6, 137.8, 134.6, 132.6, 132.2, 128.9, 128.7, 128.3, 120.5, 113.4, 113.3, 63.4, 19.6 (2C). HRMS (APCI) m/z calculated for C16H1635ClN2O [M + H]+ 287.0946; observed 287.0948. HPLC Rt 27.02 min, purity 95.8%.
(E)-2-((2-Chloro-6-fluorobenzylidene)amino)benzamide (27).
o-Aminobenzamide (9a; 200 mg, 1.5 mmol) and 2-chloro-6-fluorobenzaldehyde (232 mg, 1.5 mmol) were added to toluene (20 mL) in a 20 mL microwave vial charged with a stir bar. The reaction was irradiated under microwave at 150 °C for 1 h. After the consumption of the starting material (as assessed by TLC), the reaction was cooled to room temperature and the crude product mixture was concentrated under reduced pressure, then diluted with ethyl acetate and washed with water (3 × 10 mL). The combined organic layer was dried (anhydrous MgSO4) and concentrated under vacuum. The resulted residue was purified via MPLC (1% EtOAc/hexanes to 40% EtOAc/hexanes), which gave the title compound (100 mg, 25%). TLC Rf 0.55 (50% EtOAc/hexanes). 1H NMR (500 MHz, DMSO-d6) δ 8.78 (s, 1H), 8.36 (s, 1H), 7.99 (dd, J = 8.0, 1.5 Hz, 1H), 7.70 (dt, J = 4.0, 2.0 Hz, 1H), 7.65–7.56 (m, 2H), 7.51 (d, J = 8.0 Hz, 1H), 7.45–7.38 (m, 2H), 7.25 (d, J = 8.0 Hz, 1H). 13C NMR (126 MHz, DMSO-d6) δ 166.5, 161.1 (d, 1JCF = 257.0 Hz), 155.6 (d, 3JCF = 2.0 Hz), 149.0, 135.2 (d, 3JCF = 4.5 Hz), 133.7 (d, 2JCF = 10.5 Hz), 132.3, 130.1, 127.6, 126.9, 126.6 (d, 4JCF = 3.0 Hz), 121.1 (d, 3JCF = 11.5 Hz), 118.9, 116.0 (d, 2JCF = 22.0 Hz). HRMS (APCI) m/z: calculated for C14H1135Cl19FN2O [M + H]+ 277.0538; observed 277.0541.
(E)-2-Chloro-6-((2-chloro-6-fluorobenzylidene)amino)-benzamide (28).
2-Amino-6-chlorobenzamide (9b; 93 mg, 0.5 mmol) and 2-chloro-6-fluorobenzaldehyde (86 mg, 0.5 mmol) were added to toluene (20 mL) in a 20 mL microwave vial charged with a stir bar. The reaction was irradiated under microwave at 150 °C for 1 h. After the consumption of the starting material (as assessed by TLC), the reaction was cooled to room temperature and the crude product mixture was concentrated under reduced pressure, then diluted with ethyl acetate and washed with water (3 × 10 mL). The combined organic layer was dried (anhydrous MgSO4) and concentrated under vacuum. The purification via MPLC (1% EtOAc/hexanes to 40% EtOAc/hexanes) resulted in a white solid (100 mg, 60%). TLC Rf 0.40 (50% EtOAc/hexanes). 1H NMR (500 MHz, DMSO-d6) δ 8.65 (s, 1H), 7.80 (s, 1H), 7.57 (q, 1H), 7.50 (s, 1H), 7.48–7.32 (m, 4H), 7.11 (d, J = 8.0 Hz, 1H). 13C NMR (126 MHz, DMSO-d6) δ 166.7, 161.4 (d, 1JCF = 259.0 Hz), 156.6 (d, 3JCF = 2.0 Hz), 150.5, 135.3 (d, 3JCF = 4.0 Hz), 133.8 (d, 2JCF = 10.0 Hz), 132.4, 130.7, 130.4, 126.9, 126.7 (d, 4JCF = 3.5 Hz), 122.1 (d, 3JCF = 12.0 Hz), 117.7, 116.2 (d, 2JCF = 22.0 Hz). HRMS (ESI) m/z: calculated for C14H935Cl219FN2ONa [M + Na]+ 332.9968; observed 332.9970.
5-Chloro-2-(3-methylphenyl)-4H-benzo[d][1,3]oxazin-4-one (29).
The compound was prepared according to a modified procedure.40 3-Methylbenzoyl chloride (0.8 mL, 2 mmol) in CH2Cl2 (2 mL) was added into a solution of 2-amino 5-chlorobenzoic acid (0.17 g, 1 mmol) and diisopropylethylamine (0.3 mL) in dichloromethane (2 mL) at 0 °C. The reaction mixture was stirred overnight at room temperature and then condensed in vacuo. The residue was dissolved in anhydrous DMF (2 mL), followed by addition of diisopropylethylamine (0.3 mL) and HATU (0.4 g, 1 mmol). After stirring for 1 h at room temperature, the reaction was quenched with cold water (100 mL) at 0 °C. The precipitate was collected and purified by MPLC (1% EtOAc/hexanes to 20% EtOAc/hexanes) to give the title compound (0.1 g, 37%). TLC Rf 0.65 (50% EtOAc/hexanes). 1H NMR (500 MHz, DMSO-d6) δ 7.99–7.94 (m, 2H), 7.84 (t, J = 8.0 Hz, 1H), 7.64 (dd, J = 8.0, 2.0 Hz, 2H), 7.47 (d, J = 5.0 Hz, 2H), 2.41 (s, 3H). 13C NMR (126 MHz, DMSO-d6) δ 157.6, 156.2, 149.4, 139.0, 137.1, 134.6, 134.2, 131.0, 130.1, 129.5, 128.7, 126.8, 125.7, 115.3, 21.4. HRMS (APCI) m/z: calculated for C15H1135ClN2O [M + H]+ 272.0473; observed 272.0475.
5-Chloro-2-(3-methylphenyl)quinazolin-4(3H)-one (30).
5-Chloro-2-(3-methylphenyl)-4H-benzo[d][1,3]oxazin-4-one (29; 100 mg, 0.37 mmol) was suspended in 3 mL of an ammonium hydroxide solution (30–33% NH3 in H2O) and heated to 100 °C for 4 h. The crude mixture was concentrated under reduced pressure, and the resulting precipitate was filtered and dried. The crude products were subsequently recrystallized from methanol and gave the title compound as a white solid (60 mg, 60%). TLC Rf 0.6 (50% EtOAc/hexanes). 1H NMR (500 MHz, DMSO-d6) δ 12.46 (s, 1H), 8.00 (s, 1H), 7.94 (d, J = 7.0 Hz, 1H), 7.72 (t, J = 8.0 Hz, 1H), 7.66 (d, J = 8.0 Hz, 1H), 7.49 (d, J = 7.5 Hz, 1H), 7.41 (d, J = 7.5 Hz, 2H), 2.39 (s, 3H). 13C NMR (126 MHz, DMSO-d6) δ 160.8, 153.6, 151.8, 138.4, 134.9, 133.0, 132.8, 132.5, 129.3, 129.0, 128.8, 127.6, 125.5, 118.4, 21.4. HRMS (APCI) m/z: calculated for C15H1235ClN2O [M + H]+ 271.0633; observed 271.0635.
5-Methoxy-2-(2-methylphenyl)-2,3-dihydroquinazolin-4(1H)-one (31).
2-Amino-6-methoxybenzamide (9c; 332 mg, 2 mmol) and 2-methylbenzaldehyde (0.1 mL, 0.7 mmol) were reacted according to general procedure B. Purification by MPLC (gradient 1% DCM/hexanes to 20% EtOAc/DCM) gave a white solid (200 mg, 37%). 1H NMR (500 MHz, DMSO-d6) δ 7.74 (s, 1H), 7.52 (dd, J = 7.5, 2.0 Hz, 1H), 7.27–7.16 (m, 3H), 7.13 (t, J = 8.0 Hz, 1H), 6.83 (s, 1H), 6.37 (d, J = 8.0 Hz, 1H), 6.29 (d, J = 8.0 Hz, 1H), 5.75 (s, 1H), 3.70 (s, 3H), 2.38 (s, 3H). 13C NMR (126 MHz, DMSO) δ 162.4, 160.6, 151.0, 137.5, 136.1, 133.2, 130.5, 128.3, 127.3, 125.8, 107.3, 104.5, 101.2, 63.8, 55.3, 18.7. HRMS (ESI) m/z: calculated for C16H16N2O2Na [M + Na]+ 291.1104; observed 291.1105.
5-Fluoro-2-(3-methylphenyl)-2,3-dihydroquinazolin-4(1H)-one (32).
2-Amino-6-fluorobenzamide (200 mg, 1.3 mmol) and 3-methylbenzaldehyde (0.2 mL, 1.6 mmol) were reacted according to general procedure B. Purification by MPLC (1% EtOAc/hexanes to 60% EtOAc/hexanes) gave a white solid (65 mg, 20%). TLC Rf 0.5 (50% EtOAc/hexanes). 1H NMR (500 MHz, DMSO-d6) δ 8.24 (s, 1H), 7.39 (s, 1H), 7.30–7.23 (m, 3H), 7.18 (ddd, J = 19.5, 10.0, 6.0 Hz, 2H), 6.56 (d, J = 8.0 Hz, 1H), 6.37 (dd, J = 11.5, 8.0 Hz, 1H), 5.64 (s, 1H), 2.30 (s, 3H). 13C NMR (126 MHz, DMSO-d6) δ 162.2 (d, 1JCF = 259.0 Hz), 160.8 (d, 3JCF = 2.5 Hz), 150.2 (d, 3JCF = 2.5 Hz), 140.8, 137.4, 133.9 (d, 2JCF = 11.5 Hz), 129.2, 128.2, 127.5, 124.0, 110.4 (d, 4JCF = 3.5 Hz), 104.5 (d, 2JCF = 21.5 Hz), 103.6 (d, 3JCF = 9.0 Hz), 66.0, 21.0. HRMS (APCI) m/z: calculated for C15H1419FN2O [M + H]+ 257.1085; observed 257.1086.
5-Methyl-2-(3-methylphenyl)-2,3-dihydroquinazolin-4(1H)-one (33).
2-Amino-6-methylbenzamide (9d; 100 mg, 0.7 mmol) and 3-methylbenzaldehyde (0.1 mL, 0.8 mmol) were reacted according to general procedure B. Purification by MPLC (gradient 1% DCM/hexanes to 20% EtOAc/DCM) gave a white solid (80 mg, 53%). TLC Rf 0.5 (50% EtOAc/hexanes). 1H NMR (500 MHz, DMSO-d6) δ 8.07 (s, 1H), 7.30 (s, 1H), 7.28–7.22 (m, 2H), 7.17–7.11 (m, 1H), 7.05 (t, J = 8.0 Hz, 1H), 6.92 (s, 2H), 6.61 (d, J = 8.0 Hz, 1H), 6.44 (d, J = 7.45 Hz, 1H), 2.50 (s, 3H), 2.30 (s, 3H). 13C NMR (126 MHz, DMSO-d6) δ 164.9, 149.8, 141.7, 140.8, 137.8, 132.6, 129.5, 128.7, 128.1, 124.6, 121.4, 114.0, 113.4, 66.6, 22.5, 21.6. HRMS (APCI) m/z: calculated for C16H17N2O [M + H]+ 253.1335; observed 253.1336.
5-Bromo-2-(3-methylphenyl)-2,3-dihydroquinazolin-4(1H)-one (34).
2-Amino-6-bromobenzamide (9e; 100 mg, 0.5 mmol) and 3-methylbenzaldehyde (0.1 mL, 0.6 mmol) were reacted according to general procedure B. Purification by MPLC (1% EtOAc/hexanes to 50% EtOAc/hexanes) gave a white solid (40 mg, 25%). TLC Rf 0.6 (50% EtOAc/hexanes). 1H NMR (500 MHz, DMSO-d6) δ 8.37 (s, 1H), 7.37 (s, 1H), 7.33–7.22 (m, 3H), 7.16 (d, J = 6.5 Hz, 1H), 7.05 (t, J = 8.0 Hz, 1H), 6.87 (d, J = 8.0 Hz, 1H), 6.78 (d, J = 8.0 Hz, 1H), 5.60 (s, 1H), 2.30 (s, 3H). 13C NMR (126 MHz, DMSO) δ 161.8, 151.2, 141.0, 138.0, 133.8, 129.7, 128.8, 128.1, 124.6, 124.3, 122.4, 115.1, 113.6, 66.0, 21.5. HRMS (APCI) m/z: calculated for C15H1479BrN2O [M + H]+ 317.0284; observed 317.0287. HPLC Rt 27.52 min, purity 95.9%.
5-Bromo-2-(o-tolyl)-2,3-dihydroquinazolin-4(1H)-one (35).
2-Amino-6-bromobenzamide (9e; 100 mg, 0.5 mmol) and 2-methylbenzaldehyde (0.1 mL, 0.6 mmol) were reacted according to general procedure B. Purification by MPLC (1% EtOAc/hexanes to 50% EtOAc/hexanes) gave a white solid (38 mg, 25%). TLC Rf 0.6 (50% EtOAc/hexanes). 1H NMR (500 MHz, DMSO-d6) δ 8.28 (bs, 1H), 7.57 (d, J = 7.5, 1H), 7.38–7.24 (m, 3H), 7.23 (s, 1H), 7.13 (t, J = 8.0 Hz, 1H), 6.97 (d, J = 7.5 Hz, 1H), 6.84 (d, J = 8.0 Hz, 1H), 5.91 (bs, 1H), 2.44 (s, 3H). 13C NMR (126 MHz, DMSO-d6) δ 161.8, 151.4, 136.9, 136.3, 133.3, 130.7, 128.7, 127.4, 126.0, 123.9, 122.0, 114.7, 113.2, 63.6, 18.8. HRMS (ESI) m/z: calculated for C15H13BrN2NaO [M + Na]+ 339.0103; observed 339.0105.
2-((2-Carboxyphenyl)amino)-6-chlorobenzoic Acid (36).
The desired compound was obtained according to the reported procedure.41 To a stirred suspension of 2-amino-6-chlorobenzoic acid (860 mg, 5 mmol), 2-bromobenzoic acid (1.1 mg, 5.5 mmol), and K2CO3 (1.4 g, 10 mmol) was added copper powder (63 mg, 1 mmol) in EtOH (10 mL/mmol). The suspension was refluxed for 1.5 h. After completion of the reaction (as assessed by TLC), the mixture was filtered on Celite to remove the copper. The filter bed was washed with H2O, and the resulting solution was acidified with concentrated HCl to a pH of 2–3. The resulting suspension was stirred for 1 h at 10 °C, the solid was filtered and washed with H2O. The product was recrystallized in EtOH/H2O and dried under vacuum. The title product was obtained as a white solid (1.2 g, 83%). 1H NMR (500 MHz, DMSO-d6) δ 13.80 (bs, 1H), 13.20 (bs, 1H), 9.89 (s, 1H), 7.89 (d, J = 7.5 Hz, 1H), 7.45–7.34 (m, 3H), 7.19 (d, J = 8.0 Hz, 1H), 7.16 (d, J = 8.0 Hz, 1H), 6.84 (t, J = 7.5 Hz, 1H). 13C NMR (126 MHz, DMSO-d6) δ 169.5, 166.6, 145.8, 139.2, 134.0, 131.7, 130.8, 130.1, 128.3, 123.9, 120.0, 118.6, 114.7, 113.7. HRMS (ESI) m/z: calculated for C14H935ClNO4 [M − H]− 290.0226; observed 290.0220.
8-Chloro-9-oxo-9,10-dihydroacridine-4-carboxylic Acid (37).
The desired compound was obtained according to the reported procedure.41 To a stirred suspension of 2-((2-carboxyphenyl)amino)-6-chlorobenzoic acid (36; 1.45 g, 5 mmol) in CH3CN at reflux was added phosphorus(V)oxychloride (1 mL, 11 mmol) over a period of 1 h. The solution was refluxed until the consumption of starting material (approximately 2 h, as assessed by TLC) and then cooled to 10–15 °C. H2O (10 mL) was added, and the mixture was refluxed for an additional 2.5 h. The suspension was cooled to 10 °C and filtered. The solid was washed with H2O and CH3CN and then dried under vacuum. The title product was obtained as white solid (1.0 g, 73%). 1H NMR (500 MHz, DMSO-d6) δ 13.82 (bs, 1H), 11.87 (s, 1H), 8.47–8.35 (m, 2H), 7.72–7.58 (m, 2H), 7.38–7.24 (m, 2H). 13C NMR (126 MHz, DMSO-d6) δ 175.4, 168.9, 142.3, 140.3, 136.7, 133.5, 132.9, 132.5, 124.8, 122.7, 120.6, 118.1, 116.7, 114.7. HRMS (ESI) m/z: calculated for C14H735ClNO3 [M − H]− 272.0120; observed 272.0114.
2-((2-Carboxyphenyl)amino)-4-chlorobenzoic Acid (38).
The desired compound was obtained according to the reported procedure.41 To a stirred suspension of 2-aminobenzoic acid (1.3 g, 10 mmol), 2-bromo-4-chloro-benzoic acid (2.5 g, 11 mmol), and K2CO3 (2.77 g, 20 mmol) was added copper powder (0.125 g, 2 mmol) in EtOH (20 mL). The suspension was refluxed for 1.5 h. After completion of the reaction (as assessed by TLC), the mixture was filtered on Celite to remove the copper. The filter bed was washed with H2O, and the resulting solution was acidified with concentrated HCl to a pH of 2–3. The resulting suspension was stirred for 1 h at 10 °C, the solid was filtered and washed with H2O. The product was recrystallized in EtOH/H2O and dried under vacuum. The title product was obtained as a white solid (1.6 g, 28%). 1H NMR (500 MHz, DMSO-d6) δ 7.89 (app t, J = 8.0 Hz, 2H), 7.54–7.46 (m, 2H), 7.34 (d, J = 2.0 Hz, 1H), 7.06–6.99 (m, 1H), 6.91 (dd, J = 8.5, 2.0 Hz, 1H), −COOH protons were not observed. 13C NMR (126 MHz, DMSO-d6) δ 168.1, 167.8, 145.4, 142.1, 137.8, 133.6, 133.2, 131.7, 121.2, 119.5, 119.0, 118.8, 115.7, 115.3. HRMS (ESI) m/z: calculated for C14H935ClNO4 [M − H]− 290.0226; observed 290.0219
1-Chloro-9-oxo-9,10-dihydroacridine-4-carboxylic Acid (39).
The desired compound was obtained according to the reported procedure.41 To a stirred suspension of 2-((2-carboxyphenyl)amino)-4-chlorobenzoic acid (38; 400 mg, 1.4 mmol) in CH3CN at reflux was added phosphorus(V)oxychloride (0.3 mL, 3 mmol) over a period of 1 h. The solution was refluxed until the consumption of starting material (approximately 2 h, as assessed by TLC) and then cooled to 10–15 °C. H2O (10 mL) was added, and the mixture was refluxed for an additional 2.5 h. The suspension was cooled to 10 °C and filtered. The solid was washed with H2O and CH3CN and then dried under vacuum. 1H NMR (500 MHz, DMSO-d6) δ 13.82 (bs, 1H), 11.87 (s, 1H), 8.47–8.35 (m, 2H), 7.72–7.58 (m, 2H), 7.38–7.24 (m, 2H). 13C NMR (126 MHz, DMSO-d6) δ 175.4, 168.9, 142.3, 140.3, 136.7, 133.5, 132.9, 132.5, 124.8, 122.7, 120.6, 118.1, 116.7, 114.7. HRMS (ESI) m/z: calculated for C14H735ClNO3 [M − H]− 272.0120; observed 272.0115.
Supplementary Material
ACKNOWLEDGMENTS
This study was funded by the National Institutes of Health grants R35 GM128840 (B.C.S.), U01 CA207532 (E.C.D.), R01 GM097381 (B.F.V.), S10 OD020000 (B.F.V.), and S10 RR024665 (B.F.V.). M.D.O., K.L.B., and M.E.B. are members of the Medical Scientist Training Program at Medical College of Wisconsin, which is supported in part by National Institutes of Health Training Grant T32 GM080202 from the National Institute of General Medical Sciences. K.L.B. is also supported by the Medical College of Wisconsin Cancer Center. R.N. is supported by an American Heart Association predoctoral fellowship (908819). B.P.S. acknowledges support from the Purdue Drug Discovery Training Program (NIH T32 GM125620). This study made use of NMRbox: National Center for Biomolecular NMR Data Processing and Analysis, a Biomedical Technology Research Resource (BTRR), which is supported by NIH grant P41 GM111135.
ABBREVIATIONS
- APCI
atmospheric pressure chemical ionization
- AR
androgen receptor
- ASH1L
ASH1 like histone lysine methyltransferase
- ATAD2B
ATPase family AAA domain-containing protein 2B
- BAF
BRG1/BRM associated factor
- BAZ2B
bromodomain adjacent to zinc finger domain protein 2B
- BCA
bicinchoninic acid
- BD1
bromodomain 1
- BD2
bromodomain 2
- BD3
bromodomain 3
- BD4
bromodomain 4
- BD5
bromodomain 5
- BD6
bromodomain 6
- BET
bromodomain and extra terminal domain
- BPTF
bromodomain PHD finger transcription factor
- BRD1
bromodomain containing protein 1
- BRD2
bromodomain containing protein 2
- BRD3
bromodomain containing protein 3
- BRD4
bromodomain containing protein 4
- BRDT
bromodomain testis-specific protein
- BRD7
bromodomain containing protein 7
- BRG1
brahma-related gene-1
- BRM
brahma
- BRPF1B
bromodomain and PHD finger-containing protein 1B
- BRWD1
bromodomain and WD repeat-containing protein 1
- cBAF
canonical BRG1/BRM associated factor
- ccRCC
clear cell renal cell carcinoma
- CECR2
cyclin E repressor complex 2
- CREBBP
cAMP-response element binding protein binding protein
- CSP
chemical shift perturbation
- Da
Dalton
- DIA
difference intensity analysis
- DSF
differential scanning fluorimetry
- GBAF
GLTSCR1/like-containing BAF complex
- GCN5
general control of amino acid synthesis protein 5
- H3K14Ac
histone 3 acetylated at lysine14
- HEPES
(4-(2-hydroxyethyl)-1-piperazineethanesulfonic acid)
- ITC
isothermal titration calorimetry
- K d
dissociation constant
- LE
ligand efficiency
- LNCaP
androgen receptor positive prostate cancer cell line
- LRMS
low-resolution mass spectrometry
- MPLC
medium pressure flash liquid chromatography
- NB
not binding
- ND
not determined
- PBRM1
polybromo-1
- Pbrm1
polybromo-1 gene
- PBAF
polybromo-associated BAF complex
- PC3
androgen receptor negative prostate cancer cell line
- PCAF
p300/CBP-associated factor
- PHIP
PH-interacting protein
- RWPE-1
prostate epithelial cell line
- SAR
structure–activity relationship
- shRNA
short hairpin RNA
- SMARCA2
SWI/SNF related, matrix associated, actin dependent regulator of chromatin, subfamily A, member 2
- SMARCA4
SWI/SNF related, matrix associated, actin dependent regulator of chromatin, subfamily A, member 4
- SOFAST
selective optimized flip angle short transient
- SWI/SNF
switch/sucrose nonfermenting
- TAF1L
transcription initiation factor TFIID subunit 1-like
- TRIM33
tripartite motif-containing 33
- T m
melting temperature
Footnotes
The authors declare no competing financial interest.
Supporting Information
The Supporting Information is available free of charge at https://pubs.acs.org/doi/10.1021/acs.jmedchem.2c00864.
IC50 curves, supplementary figures, supplementary synthesis schemes, supplementary tables, titration data of compounds (PDF)
Molecular formula strings of compounds (CSV)
Contributor Information
Shifali Shishodia, Department of Biochemistry, Program in Chemical Biology, Medical College of Wisconsin, Milwaukee, Wisconsin 53226, United States.
Raymundo Nuñez, Department of Biochemistry, Program in Chemical Biology, Medical College of Wisconsin, Milwaukee, Wisconsin 53226, United States.
Brayden P. Strohmier, Department of Medicinal Chemistry and Molecular Pharmacology, Purdue University, West Lafayette, Indiana 47907, United States
Karina L. Bursch, Department of Biochemistry, Program in Chemical Biology, Medical College of Wisconsin, Milwaukee, Wisconsin 53226, United States
Christopher J. Goetz, Department of Biochemistry, Program in Chemical Biology, Medical College of Wisconsin, Milwaukee, Wisconsin 53226, United States
Michael D. Olp, Department of Biochemistry, Program in Chemical Biology, Medical College of Wisconsin, Milwaukee, Wisconsin 53226, United States
Davin R. Jensen, Department of Biochemistry, Program in Chemical Biology, Medical College of Wisconsin, Milwaukee, Wisconsin 53226, United States
Tyler G. Fenske, Department of Biochemistry, Program in Chemical Biology, Medical College of Wisconsin, Milwaukee, Wisconsin 53226, United States.
Sandra C. Ordonez-Rubiano, Department of Medicinal Chemistry and Molecular Pharmacology, Purdue University, West Lafayette, Indiana 47907, United States.
Maya E. Blau, Department of Biochemistry, Program in Chemical Biology, Medical College of Wisconsin, Milwaukee, Wisconsin 53226, United States
Mallory K. Roach, Department of Medicinal Chemistry and Molecular Pharmacology, Purdue University, West Lafayette, Indiana 47907, United States
Francis C. Peterson, Department of Biochemistry, Program in Chemical Biology, Medical College of Wisconsin, Milwaukee, Wisconsin 53226, United States
Brian F. Volkman, Department of Biochemistry, Program in Chemical Biology, Medical College of Wisconsin, Milwaukee, Wisconsin 53226, United States.
Emily C. Dykhuizen, Department of Medicinal Chemistry and Molecular Pharmacology, Purdue University, West Lafayette, Indiana 47907, United States.
Brian C. Smith, Department of Biochemistry, Program in Chemical Biology, Medical College of Wisconsin, Milwaukee, Wisconsin 53226, United States.
REFERENCES
- (1).Choudhary C; Kumar C; Gnad F; Nielsen ML; Rehman M; Walther TC; Olsen JV; Mann M Lysine Acetylation Targets Protein Complexes and Co-Regulates Major Cellular Functions. Science 2009, 325, 834–40. [DOI] [PubMed] [Google Scholar]
- (2).Filippakopoulos P; Picaud S; Mangos M; Keates T; Lambert J-P; Barsyte-Lovejoy D; Felletar I; Volkmer R; Müller S; Pawson T; Gingras A-C; Arrowsmith CH; Knapp S Histone Recognition and Large-Scale Structural Analysis of the Human Bromodomain Family. Cell 2012, 149, 214–231. [DOI] [PMC free article] [PubMed] [Google Scholar]
- (3).Thompson M Polybromo-1: The Chromatin Targeting Subunit of the PBAF Complex. Biochimie 2009, 91, 309–319. [DOI] [PMC free article] [PubMed] [Google Scholar]
- (4).Cochran AG; Conery AR; Sims RJ 3rd. Bromodomains: A New Target Class for Drug Development. Nat. Rev. Drug Discov 2019, 18, 609–628. [DOI] [PubMed] [Google Scholar]
- (5).Jahagirdar R; Attwell S; Marusic S; Bendele A; Shenoy N; McLure KG; Gilham D; Norek K; Hansen HC; Yu R; Tobin J; Wagner GS; Young PR; Wong NCW; Kulikowski E RVX-297, a Bet Bromodomain Inhibitor, Has Therapeutic Effects in Preclinical Models of Acute Inflammation and Autoimmune Disease. Mol. Pharmacol. 2017, 92, 694–706. [DOI] [PubMed] [Google Scholar]
- (6).Singh MB; Sartor GC BET Bromodomains as Novel Epigenetic Targets for Brain Health and Disease. Neuropharmacology 2020, 181, 108306. [DOI] [PMC free article] [PubMed] [Google Scholar]
- (7).Porter EG; Dykhuizen EC Individual Bromodomains of Polybromo-1 Contribute to Chromatin Association and Tumor Suppression in Clear Cell Renal Carcinoma. J. Biol. Chem. 2017, 292, 2601–2610. [DOI] [PMC free article] [PubMed] [Google Scholar]
- (8).Varela I; Tarpey P; Raine K; Huang D; Ong CK; Stephens P; Davies H; Jones D; Lin M-L; Teague J; Bignell G; Butler A; Cho J; Dalgliesh GL; Galappaththige D; Greenman C; Hardy C; Jia M; Latimer C; Lau KW; Marshall J; Mclaren S; Menzies A; Mudie L; Stebbings L; Largaespada DA; Wessels LFA; Richard S; Kahnoski RJ; Anema J; Tuveson A, D.; Perez-Mancera PA; Mustonen V; Fischer A; Adams DJ; Rust A; Chan-On W; Subimerb C; Dykema K; Furge K; Campbell PJ; Teh BT; Stratton MR; Futreal PA Exome Sequencing Identifies Frequent Mutation of the SWI/SNF Complex Gene PBRM1 in Renal Carcinoma. Nature 2011, 469, 539–542. [DOI] [PMC free article] [PubMed] [Google Scholar]
- (9).Pan D; Kobayashi A; Jiang P; Ferrari De Andrade L; Tay RE; Luoma AM; Tsoucas D; Qiu X; Lim K; Rao P; Long HW; Yuan G-C; Doench J; Brown M; Liu XS; Wucherpfennig KW A Major Chromatin Regulator Determines Resistance of Tumor Cells to T Cell–Mediated Killing. Science 2018, 359, 770–775. [DOI] [PMC free article] [PubMed] [Google Scholar]
- (10).Miao D; Margolis CA; Gao W; Voss MH; Li W; Martini DJ; Norton C; Bossé D; Wankowicz SM; Cullen D; Horak C; Wind-Rotolo M; Tracy A; Giannakis M; Hodi FS; Drake CG; Ball MW; Allaf ME; Snyder A; Hellmann MD; Ho T; Motzer RJ; Signoretti S; Kaelin WG; Choueiri TK; Van Allen EM Genomic Correlates of Response to Immune Checkpoint Therapies in Clear Cell Renal Cell Carcinoma. Science 2018, 359, 801–806. [DOI] [PMC free article] [PubMed] [Google Scholar]
- (11).Hagiwara M; Fushimi A; Yamashita N; Bhattacharya A; Rajabi H; Long MD; Yasumizu Y; Oya M; Liu S; Kufe D MUC1-C Activates the PBAF Chromatin Remodeling Complex in Integrating Redox Balance with Progression of Human Prostate Cancer Stem Cells. Oncogene 2021, 40, 4930–4940. [DOI] [PMC free article] [PubMed] [Google Scholar]
- (12).Mota STS; Vecchi L; Zóia MAP; Oliveira FM; Alves DA; Dornelas BC; Bezerra SM; Andrade VP; Maia YCP; Neves AF; Goulart LR; Araújo TG New Insights into the Role of Polybromo-1 in Prostate Cancer. International Journal of Molecular Sciences 2019, 20, 2852. [DOI] [PMC free article] [PubMed] [Google Scholar]
- (13).Porter EG; Dhiman A; Chowdhury B; Carter BC; Lin H; Stewart JC; Kazemian M; Wendt MK; Dykhuizen EC PBRM1 Regulates Stress Response in Epithelial Cells. iScience 2019, 15, 196–210. [DOI] [PMC free article] [PubMed] [Google Scholar]
- (14).Hagiwara M; Fushimi A; Bhattacharya A; Yamashita N; Morimoto Y; Oya M; Withers HG; Hu Q; Liu T; Liu S; Wong KK; Long MD; Kufe D MUC1-C Integrates Type II Interferon and Chromatin Remodeling Pathways in Immunosuppression of Prostate Cancer. OncoImmunology 2022, 11, 2029298. [DOI] [PMC free article] [PubMed] [Google Scholar]
- (15).Fedorov O; Castex J; Tallant C; Owen DR; Martin S; Aldeghi M; Monteiro O; Filippakopoulos P; Picaud S; Trzupek JD; Gerstenberger BS; Bountra C; Willmann D; Wells C; Philpott M; Rogers C; Biggin PC; Brennan PE; Bunnage ME; Schüle R; Günther T; Knapp S; Müller S Selective Targeting of the BRG/PB1 Bromodomains Impairs Embryonic and Trophoblast Stem Cell Maintenance. Science Advances 2015, 1, e1500723. [DOI] [PMC free article] [PubMed] [Google Scholar]
- (16).Gerstenberger BS; Trzupek JD; Tallant C; Fedorov O; Filippakopoulos P; Brennan PE; Fedele V; Martin S; Picaud S; Rogers C; Parikh M; Taylor A; Samas B; O’Mahony A; Berg E; Pallares G; Torrey AD; Treiber DK; Samardjiev IJ; Nasipak BT; Padilla-Benavides T; Wu Q; Imbalzano AN; Nickerson JA; Bunnage ME; Muller S; Knapp S; Owen DR Identification of a Chemical Probe for Family VIII Bromodomains through Optimization of a Fragment Hit. J. Med. Chem. 2016, 59, 4800–11. [DOI] [PMC free article] [PubMed] [Google Scholar]
- (17).Mélin L; Gesner E; Attwell S; Kharenko OA; van der Horst EH; Hansen HC; Gagnon A Design and Synthesis of LM146, a Potent Inhibitor of PB1 with an Improved Selectivity Profile over SMARCA2. ACS Omega 2021, 6, 21327–21338. [DOI] [PMC free article] [PubMed] [Google Scholar]
- (18).Sutherell CL; Tallant C; Monteiro OP; Yapp C; Fuchs JE; Fedorov O; Siejka P; Müller S; Knapp S; Brenton JD; Brennan PE; Ley SV Identification and Development of 2,3-Dihydropyrrolo[1,2-a]quinazolin-5(1H)-one Inhibitors Targeting Bromodomains within the Switch/Sucrose Nonfermenting Complex. J. Med. Chem. 2016, 59, 5095–5101. [DOI] [PMC free article] [PubMed] [Google Scholar]
- (19).Myrianthopoulos V; Gaboriaud-Kolar N; Tallant C; Hall M-L; Grigoriou S; Brownlee PM; Fedorov O; Rogers C; Heidenreich D; Wanior M; Drosos N; Mexia N; Savitsky P; Bagratuni T; Kastritis E; Terpos E; Filippakopoulos P; Müller S; Skaltsounis A-L; Downs JA; Knapp S; Mikros E Discovery and Optimization of a Selective Ligand for the Switch/Sucrose Nonfermenting-Related Bromodomains of Polybromo Protein-1 by the Use of Virtual Screening and Hydration Analysis. J. Med. Chem. 2016, 59, 8787–8803. [DOI] [PMC free article] [PubMed] [Google Scholar]
- (20).Wanior M; Preuss F; Ni X; Kramer A; Mathea S; Gobel T; Heidenreich D; Simonyi S; Kahnt AS; Joerger AC; Knapp S Pan-SMARCA/PB1 Bromodomain Inhibitors and Their Role in Regulating Adipogenesis. J. Med. Chem. 2020, 63, 14680–14699. [DOI] [PubMed] [Google Scholar]
- (21).Charlop-Powers Z; Zeng L; Zhang Q; Zhou MM Structural Insights into Selective Histone H3 Recognition by the Human Polybromo Bromodomain 2. Cell Res. 2010, 20, 529–38. [DOI] [PMC free article] [PubMed] [Google Scholar]
- (22).Egner JM; Jensen DR; Olp MD; Kennedy NW; Volkman BF; Peterson FC; Smith BC; Hill RB Development and Validation of 2D Difference Intensity Analysis for Chemical Library Screening by Protein-Detected NMR Spectroscopy. Chembiochem 2018, 19, 448–458. [DOI] [PMC free article] [PubMed] [Google Scholar]
- (23).Congreve M; Carr R; Murray C; Jhoti HA ‘Rule of Three’ for Fragment-Based Lead Discovery? Drug Discovery Today 2003, 8, 876–877. [DOI] [PubMed] [Google Scholar]
- (24).Hardegger LA; Kuhn B; Spinnler B; Anselm L; Ecabert R; Stihle M; Gsell B; Thoma R; Diez J; Benz J; Plancher JM; Hartmann G; Banner DW; Haap W; Diederich F Systematic Investigation of Halogen Bonding in Protein–Ligand Interactions. Angew. Chem., Int. Ed. 2011, 50, 314–318. [DOI] [PubMed] [Google Scholar]
- (25).Friesner RA; Murphy RB; Repasky MP; Frye LL; Greenwood JR; Halgren TA; Sanschagrin PC; Mainz DT Extra Precision Glide: Docking and Scoring Incorporating a Model of Hydrophobic Enclosure for Protein–Ligand Complexes. J. Med. Chem. 2006, 49, 6177–6196. [DOI] [PubMed] [Google Scholar]
- (26).Schick S; Rendeiro AF; Runggatscher K; Ringler A; Boidol B; Hinkel M; Majek P; Vulliard L; Penz T; Parapatics K; Schmidl C; Menche J; Boehmelt G; Petronczki M; Muller AC; Bock C; Kubicek S Systematic Characterization of BAF Mutations Provides Insights into Intracomplex Synthetic Lethalities in Human Cancers. Nat. Genet. 2019, 51, 1399–1410. [DOI] [PMC free article] [PubMed] [Google Scholar]
- (27).Xiao L; Parolia A; Qiao Y; Bawa P; Eyunni S; Mannan R; Carson SE; Chang Y; Wang X; Zhang Y; Vo JN; Kregel S; Simko SA; Delekta AD; Jaber M; Zheng H; Apel IJ; McMurry L; Su F; Wang R; Zelenka-Wang S; Sasmal S; Khare L; Mukherjee S; Abbineni C; Aithal K; Bhakta MS; Ghurye J; Cao X; Navone NM; Nesvizhskii AI; Mehra R; Vaishampayan U; Blanchette M; Wang Y; Samajdar S; Ramachandra M; Chinnaiyan AM Targeting SWI/SNF ATPases in Enhancer-Addicted Prostate Cancer. Nature 2022, 601, 434–439. [DOI] [PMC free article] [PubMed] [Google Scholar]
- (28).Alpsoy A; Dykhuizen EC Glioma tumor suppressor candidate region gene 1 (GLTSCR1) and its paralog GLTSCR1-like form SWI/SNF chromatin remodeling subcomplexes. J. Biol. Chem. 2018, 293, 3892–3903. [DOI] [PMC free article] [PubMed] [Google Scholar]
- (29).Bradford MM A Rapid and Sensitive Method for the Quantitation of Microgram Quantities of Protein Utilizing the Principle of Protein-Dye Binding. Anal. Biochem. 1976, 72, 248–254. [DOI] [PubMed] [Google Scholar]
- (30).Schanda P; Brutscher B Very Fast Two-Dimensional NMR Spectroscopy for Real-Time Investigation of Dynamic Events in Proteins on the Time Scale of Seconds. J. Am. Chem. Soc. 2005, 127, 8014–8015. [DOI] [PubMed] [Google Scholar]
- (31).Helmus JJ; Jaroniec CP Nmrglue: An Open Source Python Package for the Analysis of Multidimensional NMR Data. J. Biomol NMR 2013, 55, 355–67. [DOI] [PMC free article] [PubMed] [Google Scholar]
- (32).Delaglio F; Grzesiek S; Vuister G; Zhu G; Pfeifer J; Bax A NMRPipe: A Multidimensional Spectral Processing System Based on Unix Pipes. J. Biomol. NMR 1995, 6, 277–293. [DOI] [PubMed] [Google Scholar]
- (33).Bartels C; Xia T-H; Billeter M; Guntert P; Wuthrich K The Program XEASY for Computer Supported NMR Spectral Analysis of Biological Macromolecules. Journal of Biomolecular NMR 1995, 6, 1–10. [DOI] [PubMed] [Google Scholar]
- (34).Bartels C; Billeter M; Güntert P; Wüthrich K Automated Sequence-Specific NMR Assignment of Homologous Proteins Using the Program GARANT. J. Biomol. NMR 1996, 7, 207–213. [DOI] [PubMed] [Google Scholar]
- (35).Pedregosa FVG; Gramfort A; Michel V; Thirion B; Grisel O; Blondel M; Prettenhofer P; Weiss R; Dubourg V; Vanderplas J; Passos A; Cournapeau D; Brucher M; Perrot M; Duchesnay E Scikit-learn: Machine Learning in Python. J. Mach. Learn. Res. 2011, 12, 2826. [Google Scholar]
- (36).Roos K; Wu C; Damm W; Reboul M; Stevenson JM; Lu C; Dahlgren MK; Mondal S; Chen W; Wang L; Abel R; Friesner RA; Harder ED OPLS3e: Extending Force Field Coverage for Drug-Like Small Molecules. J. Chem. Theory Comput. 2019, 15, 1863. [DOI] [PubMed] [Google Scholar]
- (37).Greenwood JR; Calkins D; Sullivan AP; Shelley JC Towards the Comprehensive, Rapid, and Accurate Prediction of the Favorable Tautomeric States of Drug-Like Molecules in Aqueous Solution. Journal of Computer-Aided Molecular Design 2010, 24, 591–604. [DOI] [PubMed] [Google Scholar]
- (38).Dutta A; Damarla K; Bordoloi A; Kumar A; Sarma D KOH/DMSO: A Basic Suspension for Transition Metal-Free Tandem Synthesis of 2,3-Dihydroquinazolin-4(1H)-ones. Tetrahedron Lett. 2019, 60, 1614–1619. [Google Scholar]
- (39).Sutherell C; Ley S On the Synthesis and Reactivity of 2,3-Dihydropyrrolo[1,2-a]quinazolin-5(1H)-ones. Synthesis 2016, 49, 135–144. [Google Scholar]
- (40).Jin S; Liu Z; Milburn C; Tomaszewski M; Walpole C; Wei Z-Y; Yang H Preparation of Benzamide Derivatives for Therapeutic Use as Cannabinoid Receptor Modulators. World Patent WO2005115972A1, 2005. [Google Scholar]
- (41).Dörner B; Kuntner C; Bankstahl JP; Wanek T; Bankstahl M; Stanek J; Müllauer J; Bauer F; Mairinger S; Löscher W; Miller DW; Chiba P; Müller M; Erker T; Langer O Radiosynthesis and in Vivo Evaluation of 1-[18F]fluoroelacridar as a Positron Emission Tomography Tracer for P-glycoprotein and Breast Cancer Resistance Protein. Bioorg. Med. Chem. 2011, 19, 2190–2198. [DOI] [PMC free article] [PubMed] [Google Scholar]
Associated Data
This section collects any data citations, data availability statements, or supplementary materials included in this article.


