

Abstract
Clinicians have published research and reports on calcium and phosphate solubility within parenteral nutrition (PN) for over 40 years. Foundational empirical laboratory investigation in the 1980s motivated by the prevalence of neonatal rickets and osteomalacia in the Neonatal Intensive Care Unit (NICU) population led to precipitation curves that have guided PN prescribing and compounding. Over subsequent decades, numerous publications have expanded the knowledge of factors influencing calcium and phosphate solubility in formulating optimal and safe PN admixtures. Failure to adhere to known principles has led to serious injury and death. Known solubility curves are derived from empiric analysis of a finite number of conditions and concentrations, whereas custom PN orders vary widely and rarely match the admixture composition in the data set used to derive the published precipitation curves. Various commercial platforms have been developed to aid the pharmacist in assessing the potential for precipitation when evaluating a PN order. Some applications plot the calcium and phosphate concentrations of the prescribed PN against known published graphs most similar to the order, allowing the pharmacist to judge the risk of precipitation. Other approaches use intellectually protected trade secret algorithms to determine calcium and phosphate solubility across a continuum of conditions. This publication reports equations that have been used successfully for over 2 decades in our regional network of NICUs and shared with others to determine safe prescribing limits for calcium and phosphate concentrations using an electronic PN prescribing program.
Keywords: nutrition, nutritional support, intravenous therapy, pediatrics
Prescribing and compounding parenteral nutrition PN admixtures is a high-risk process due to the complexity of the large number of components, the wide range of concentrations, and the various additives prescribed to meet clinical demands of therapy. 1 To help guide professionals in the safe provision of PN therapy, the American Society for Parenteral and Enteral Nutrition (A.S.P.E.N.) has published recommendations. 2 These guidelines emphasize the need for all formulations to be evaluated for risk of calcium and phosphate precipitation. Early work within PN formulations determined pH to be a predominant factor in calcium and phosphate solubility. 3 At lower pH, the monobasic phosphate ion (H2PO4−) prevails allowing solubility with calcium 60-fold greater than the dibasic phosphate ion (HPO42−), which predominates at higher pH. 4 In addition to the pH and calcium/phosphate concentrations, the amino acid concentration, amino acid product, form of calcium utilized, and temperature also influence calcium and phosphate solubility. 5 Since amino acid solutions are the principle acidic component of PN, amino acid composition and pH are linked variables. Studies show that the precipitation curves became more favorable, that is, calcium-phosphate solubility increases, with increased amino acid concentrations and decreased pH.6,7 Original research studied various amino acid products at discrete concentrations within PN.3,6,8-11 Historically, the pharmacist would compare an individual patient’s order against the most closely matched reference precipitation curves from published sources. Over time software was developed that would automatically plot the calcium and phosphate concentrations of a prescribed PN against known curves. 12 Because an ordered PN rarely matches the published curves within the software, the pharmacist must still make a judgment regarding the potential for precipitation of the ordered product. Industry has developed certain intellectually protected algorithms based on published precipitation curves. 13 These unpublished algorithms are used to stop an order from being placed that would have a high potential for precipitation. We report equations utilized in an electronic PN prescribing program to prospectively determine if an order for PN is likely to precipitate.
Methods
Equations were developed according to mathematical principles to match the general hyperbolic shape of published curves, incorporating those elements most strongly influencing the buffering capacity and pH of a PN admixture.
A numeric value, referred to as the precipitation limit, is assigned to each PN order according to the following formulas:
-
Equation 1: 2-in-1 PN that will be run separate from fat emulsion
-
Equation 2: 2-in-1 PN with y-site administration with fat emulsion
-
Equation 3: 3-in-1 PN
AAF = amino acid factor (a constant empirically assigned to an amino acid product based on its reported pH and published precipitation curves, see Table 1). CYS = cysteine amount ordered in mg/g amino acid; FIR = fat emulsion infusion rate in mL/h; FIT = fat emulsion infusion time in h/d; FPP = % fat emulsion of the commercially provided product (usually 20); FAT = fat emulsion amount ordered in g/kg; AA = amino acid amount ordered in g/kg; WT = weight in kg.
Table 1.
Assigned Amino Acid Factor Values by Source Product.
| Commercial amino acid product | Assigned amino acid factor |
|---|---|
| Aminosyn PF, Premasol, TrophAmine | 200 |
| Aminosyn II, Clinisol, Travasol | 100 |
A solution factor is assigned to each PN order:
-
Equation 4: Solution factor
The solution factor value is compared to the precipitation limit value. The calcium and phosphate within the PN admixture is considered compatible if the solution factor value is less than the precipitation limit value.
Example for 2-in-1 PN with y-site administration with fat emulsion
1 kg neonate
3.5 g/kg of amino acid (Trophamine or Premasol)
40 mg cysteine per g of amino acids
3 g/kg of fat emulsion (20%) run over 24 hours (0.63 mL/hour) y-site administration with PN
Calcium 3.6 mEq/kg
Phosphates 1.8 mmol/kg
Volume of 2-in-1 PN 120 mL/kg
Precipitation limit = 200 + (40 * 200)/100 − (0.63 * 24 * 20 * 200)/(3.5 * 1 * 1000) = 262.7
Solution factor = (300.863 * 151.19)/2.92 = 161.8
The solution factor value (161.8) is less than the precipitation factor value (262.7), therefore the calcium and phosphate within the solution is determined to be compatible at standard storage and administration temperatures.
Example for 3-in-1 PN
30 kg adolescent
1.6 g/kg of Travasol
0.9 g/kg of fat emulsion (20%)
Calcium 1 mEq/kg
Phosphates 0.9 mmol/kg
Volume of 3-in-1 PN 75 mL/kg
Precipitation limit = 100 + (0 * 100)/100 – (0.9 * 100)/(1.6 * 10) = 94.4
Solution factor = (13.330.863 * 121.19)/2.13 = 84.4
The solution factor value (84.4) is less than the precipitation factor value (94.4), therefore the calcium and phosphate within the PN is determined to be compatible at standard storage and administration temperatures.
Discussion
Published calcium and phosphate precipitation curves are a key safety component of PN. Some have suggested development of probability-based curves and logistic regression analysis be applied when developing new curves. 14 The pharmacist is responsible for assessing calcium and phosphate solubility during verifying and compounding of PN orders. Original precipitation curves were developed using a small number of representative PN admixtures at finite concentrations of calcium and phosphate. Custom PN order combinations are vast and therefore do not match the limited number of published PN calcium and phosphate curves. Extrapolation of published results is required to make a determination regarding compatibility for any admixture that deviates from the representative samples. In practice a unique PN order rarely matches the exact precipitation curve parameters that were tested in the laboratory. For example each of the original TrophAmine precipitation curves, which continue to be referenced today, were compiled from 20 distinct data points. In reality practitioners are required to make daily judgment calls in the precipitation potential of a vast number of PN orders that fail to match the exact conditions tested in the laboratory. Figure 1 shows the original 2% and 1.5% TrophAmine curves. If a patient has an order for a 1.8% TrophAmine, 17% dextrose, with 20 mEq/L of calcium and 20 mmol/L of phosphate, there is not a curve to reference for this admixture. The practitioner can use the 1.5% TrophAmine, 10% dextrose curve, and deem the formula incompatible because the calcium and phosphate are in the incompatible zone. Alternatively, the practitioner could look at the 2% TrophAmine, 10% dextrose curve, and deem the formula compatible.
Figure 1.

TrophAmine 1.5% and 2% with 10% dextrose parenteral nutrition original published curves.
Approximately 4 decades ago a team at our institution began developing equations to define limits for calcium and phosphate additives that apply to a continuum of custom PN orders. The equations evaluate calcium gluconate and inorganic phosphate concentrations and incorporate the driving factors of source amino acid, amino acid concentration in the final product, addition of cysteine with its pH lowering effect, and the addition of alkaline fat emulsions. Dextrose concentration was shown to have a lesser effect on calcium and phosphate solubility than amino acid concentration in early studies.15,16 The equations presented herein do not include dextrose as a variable and were conservatively developed to maintain solubility regardless of dextrose amount. They have been successfully utilized in practice in admixtures containing 0% to 30% dextrose. The calculations were developed to accommodate a continuum of amino acid, fat emulsion and cysteine concentrations within a PN order and were built into the computerized ordering software to prevent order submission when pre-defined calcium and phosphate concentration limits are exceeded. Rather than rely on inconsistent extrapolation of the finite number of published curves to an infinite number of PN formulations, the equations provide a consistent approach to evaluating precipitation potential based on the published curves. The equations were developed to match the general hyperbolic shape of the published curves. Key to this approach was assigning an amino acid factor to each amino acid product. The larger the amino acid factor, the more the equation curve moves up and to the right. The amino acid factors were assigned based on published precipitation curves for each individual amino acid product. The factor was assigned conservatively to ensure a buffer between the original precipitation curve and the assigned precipitation limit according to the developed equation. Development of the equations allows for the systematic and consistent evaluation of numerous combinations of PN admixtures, for which there are no exact matches within published literature. Validation of the equation’s utility in predicting the solubility of calcium and phosphate within PN has occurred in their actual use in clinical practice. Over their decades of use in our multi-hospital healthcare system, caring for both inpatient and homecare patients, there has not been a report of calcium and phosphate precipitation related to the utilization of the equations. Our system has utilized filters, according to recommendations of national societies, and these filters have not occluded nor shown signs of calcium and phosphate precipitates.
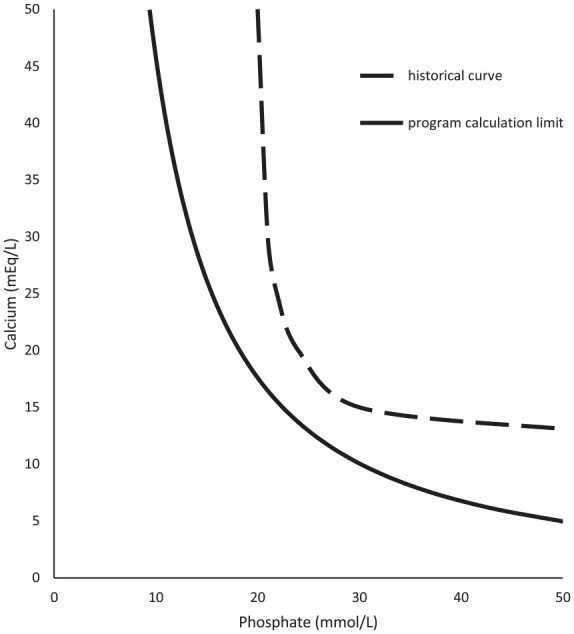
To provide an example of the empirical calculations to literature precipitation limits, Figures 2 to 9 compare historical TrophAmine published curves with program curve limits as dictated by equations 1 through 4. 6 The original TrophAmine curves were based on microscopy visualized of precipitation in a set of PN admixtures. Equations developed for the computerized physician order entry system were constructed to be slightly more restrictive than the published precipitation curves to allow for variability in compounding accuracy in the original test formulations as well as in current clinical practice. Application of the equations results in hyperbolic curves, which follow the general shape of the finite point determinations from the original research.
Figure 2.
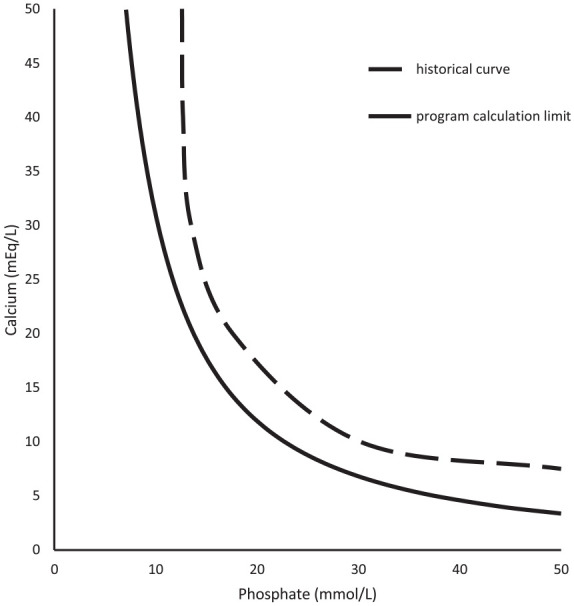
TrophAmine 1.5% with 10% dextrose parenteral nutrition.
Figure 9.

TrophAmine 2% with 10% dextrose, 12% Intralipids, and cysteine (40 mg/g amino acids) parenteral nutrition.
Figure 3.

TrophAmine 1.5% with 10% dextrose and 12% Intralipids parenteral nutrition.
Figure 4.
TrophAmine 1.5% with 10% dextrose and cysteine (40 mg/g amino acids) parenteral nutrition.
Figure 5.

TrophAmine 1.5% with 10% dextrose, 12% Intralipids, and cysteine (40 mg/g amino acids) parenteral nutrition.
Figure 6.

TrophAmine 2% with 10% dextrose parenteral nutrition.
Figure 7.

TrophAmine 2% with 10% dextrose and 12% Intralipids parenteral nutrition.
Figure 8.

TrophAmine 2% with 10% dextrose and cysteine (40 mg/g amino acids) parenteral nutrition.
The empirically developed equations account for continuous concentrations of amino acid, fat emulsion, cysteine, calcium, and phosphates seen within custom PN orders. For example, Figures 10 and 11 illustrate how defined calcium and phosphate limits within the prescribing software are influenced by changes in the final amino acid or cysteine concentrations, respectfully. The program calculations allow precipitation potential to be evaluated at any point within the continuum of amino acid concentrations. The empiric curves have been used in practice with the historical generic cysteine product as well as the 2019 FDA approved product at variable doses during shortages and as our institution changed dosing strategies based on new package labeling and current research.17-19 The equations have also been used in practice across vitamin and trace element product reformulations that manufacturers have made in response to requests from the PN community as well as with the various FDA approved fat emulsions.
Figure 10.

Predicted calcium and phosphate program limits at varying TrophAmine concentrations, 2-in-1 parenteral nutrition solution.
Figure 11.

Predicted calcium and phosphate program limits at varying cysteine concentrations, 3% TrophAmine 2-in-1 parenteral nutrition solution.
The equations presented herein have been used to guide risk of precipitation in hundreds of thousands of PN orders in real world settings both within the hospital and for home care preparations. Within our acute care settings the admixtures have been utilized with 24 hours hang times and nurses are trained to avoid hanging admixtures next to heat sources. Homecare products undergo typical storage under refrigeration prior to being brought to room temperature for infusion within the patients’ home environments. The PN ordering program places a hard stop on any admixture for which the solution factor exceeds the precipitation factor. The practitioner is therefore able to adjust the PN order at time of entry, with feedback prompts, to achieve a calcium/phosphate compatibility before the order is sent to the compounding pharmacist. Practical utilization of the empiric calculations has occurred over a broad range of PN orders for more than 20 years. 7
Conclusion
Ensuring calcium and phosphate solubility within PN is critical for patient safety and outcomes. Published calcium and phosphate solubility curves provide a foundation for safe administration of PN. Equations have been developed to predict calcium and phosphate solubility across a continuum of conditions. These equations have been successfully utilized within an electronic PN prescribing program for more than 2 decades across numerous facilities.
Footnotes
The author(s) declared the following potential conflicts of interest with respect to the research, authorship, and/or publication of this article: Collin Anderson: Consultant for Baxter on a limited basis (<10 hours per year) for a product which is not a part of this manuscript.
Funding: The author(s) received no financial support for the research, authorship, and/or publication of this article.
ORCID iD: Collin Anderson  https://orcid.org/0000-0001-9441-3663
References
- 1. High-Alert Medications in Acute Care Settings. Institute for Safe Medication Practices Website. 2018. Accessed August 9, 2021. https://www.ismp.org/recommendations/high-alert-medications-acute-list
- 2. Ayers P, Adams S, Boullata J, et al. A.S.P.E.N. parenteral nutrition safety consensus recommendations. JPEN J Parenter Enteral Nutr. 2014;38(3):296-333. [DOI] [PubMed] [Google Scholar]
- 3. Lenz GT, Mikrut BA. Calcium and phosphate solubility in neonatal parenteral nutrient solutions containing Aminosyn-PF or TrophAmine. Am J Hosp Pharm. 1988;45(11):2367-2371. [PubMed] [Google Scholar]
- 4. Lide D. CRC Handbook of Chemistry and Physics. 73rd ed. CRC Press; 1993:4-49. [Google Scholar]
- 5. Newton DW, Driscoll DF. Calcium and phosphate compatibility revisited again. Am J Health Syst Pharm. 2008;65(1):73-80. [DOI] [PubMed] [Google Scholar]
- 6. Fitzgerald KA, MacKay MW. Calcium and phosphate solubility in neonatal parenteral nutrient solutions containing TrophAmine. Am J Hosp Pharm. 1986;43(1):88-93. [PubMed] [Google Scholar]
- 7. MacKay M, Jackson D, Eggert L, Fitzgerald K, Cash J. Practice-based validation of calcium and phosphorus solubility limits for pediatric parenteral nutrition solutions. Nutr Clin Pract. 2011;26(6):708-713. [DOI] [PubMed] [Google Scholar]
- 8. Henry RS, Jurgens RW, Sturgeon R, Athanikar N, Welco A, Van Leuven M. Compatibility of calcium chloride and calcium gluconate with sodium phosphate in a mixed TPN solution. Am J Hosp Pharm. 1980;37(5):673-674. [PubMed] [Google Scholar]
- 9. Fitzgerald KA, MacKay MW. Calcium and phosphate solubility in neonatal parenteral nutrient solutions containing Aminosyn PF. Am J Hosp Pharm. 1987;44(6):1396-1400. [PubMed] [Google Scholar]
- 10. Eggert LD, Rusho WJ, MacKay MW, Chan GM. Calcium and phosphorus compatibility in parental nutrition solutions for neonates. Am J Hosp Pharm. 1982;39(1):49-53. [PubMed] [Google Scholar]
- 11. MacKay MW, Fitzgerald KA, Jackson D. The solubility of calcium and phosphate in two specialty amino acid solutions. JPEN J Parenter Enteral Nutr. 1996;20(1):63-66. [DOI] [PubMed] [Google Scholar]
- 12. Abacus Product Software Brochure. 2020. Accessed August 13, 2021. https://ushospitalproducts.baxter.com/sites/g/files/ebysai2186/files/2020-06/Abacus%20Software%20Product%20Brochure.pdf
- 13. Apex Custom Software, Inc. Nutrition assistant. Accessed August 13, 2021. https://www.apexcustomsoftware.com/our-solutions
- 14. Gonyon T, Carter PW, Phillips G, et al. Probability-based compatibility curves for calcium and phosphates in parenteral nutrition formulations. JPEN J Parenter Enteral Nutr. 2014;38(6):717-727. [DOI] [PubMed] [Google Scholar]
- 15. MacMahon P, Mayne PD, Blair M, Pope C, Kovar IZ. Calcium and phosphorus solubility in neonatal intravenous feeding solutions. Arch Dis Child. 1990;65:352-353. [DOI] [PMC free article] [PubMed] [Google Scholar]
- 16. Niermeyer S, Thieme R, Givan C, Thibodeau S, Quissell BJ. Optimized calcium/phosphorus solubility in a parenteral nutrition solution containing dicarboxylic amino acids and cysteine. J Am Coll Nutr. 1986;5(5):459-466. [DOI] [PubMed] [Google Scholar]
- 17. Elcys (cysteine hydrochloride injection) package insert . Exela Pharma Sciences, LLC; 2019. [Google Scholar]
- 18. ASPEN. Releases new parenteral nutrition L-cysteine product shortage considerations. American Society for Parenteral and Enteral Nutrition Website. Accessed August 18, 2021. https://www.nutritioncare.org/News/General_News/A_S_P_E_N__Releases_New_Parenteral_Nutrition_L-Cysteine_Product_Shortage_Considerations/ [DOI] [PubMed]
- 19. Soghier LM, Brion LP. Cysteine, cystine or N-acetylcysteine supplementation in parenterally fed neonates. Cochrane Database Syst Rev. 2006;4:CD004869. [DOI] [PMC free article] [PubMed] [Google Scholar]