

Abstract
Aims
Cardiac rehabilitation (CR) improves survival in patients with coronary heart disease (CHD), which is largely mediated by the improvements in cardiorespiratory fitness (CRF) defined as peak oxygen consumption (VO2). Therefore, measuring CRF is essential to predict long-term outcomes in this population. It is unclear, however, whether peak VO2 achieved at the end of CR (END-peak VO2) predicts survival or whether the changes of CRF achieved during CR provide a greater prognostic value. To determine whether END-peak VO2 independently predicts long-term survival in patients with CHD undergoing CR. We also aimed at identifying cut-offs for END-peak VO2 that could be used in clinical practice.
Methods and results
Retrospective analysis of 853 patients with CHD referred to CR who completed a maximal cardiopulmonary exercise test. Survival analysis was performed to examine the risk of all-cause mortality (average follow-up years: 6.65) based on peak VO2. The Contal and O’Quigley’s method was used to determine the optimal cut-off of END-peak VO2 based on the log-rank statistic. END-peak VO2 was inversely associated with mortality risk [hazard ratio (HR) = 0.84; 95% confidence interval (CI) = 0.78–0.90], independent of changes in peak VO2 adjusted for the baseline peak VO2. The estimated cut-off of END-peak VO2 at ≥17.6 mL/kg/min best predicted the survival with high predictive accuracy and patients with END-peak VO2 under the cut-off had a greater risk of mortality (HR = 2.93; 95% CI = 1.81–4.74).
Conclusions
In patient with CHD undergoing CR, END-peak VO2 is an independent predictor for long-term survival. Studies utilizing higher intensity CR programmes, with and without pharmacologic strategies, to increase peak VO2 to a greater degree in those achieving a suboptimal END-peak VO2, are urgently needed.
Keywords: Cardiac rehab, Cardiorespiratory fitness, Exercise training, Coronary heart disease
Introduction
Despite several improvements made in the last few decades in the treatment of coronary heart disease (CHD), long-term mortality in this population remains high.1 Cardiac rehabilitation (CR) is the cornerstone therapy for patients with CHD as it improves cardiovascular and metabolic risk factors, and short- and long-term survival, despite its relatively short duration.2–4 Most benefits of CR are mediated by improvements in cardiorespiratory fitness (CRF),3,5–7 typically defined as peak oxygen consumption (VO2) measured during maximal cardiopulmonary exercise testing (CPX).8 Therefore, measuring peak VO2 at the beginning and at the end of CR to predict long-term outcomes in these patients is of crucial importance.
Importantly, due to its strong prognostic value, CRF has been proposed as a new vital sign in healthy and diseased populations.9–11 A large variability in terms of changes in CRF in response to CR exists, however, with some patients improving peak VO2 to a greater degree than others (i.e. responders and non-responders).3 Importantly, although changes in peak VO2 are strong predictors of long-term survival, at this time it is unclear whether the peak VO2 achieved at the end of CR (END-peak VO2) predicts long-term survival, independent of the changes in CRF achieved during the CR programme.
In this study, we investigated whether END-peak VO2 predicted long-term survival in patients with CHD. We also hypothesized that END-peak VO2 would predict survival in this population, independent of the changes in CRF during CR. Finally, we investigated whether we could identify specific cut-offs for END-peak VO2 that could be used in clinical practice to detect individuals that remain at increased risk for all-cause mortality.
Methods
We conducted a retrospective analysis of patients with CHD treated medically with or without revascularization referred to CR between 1 January 2000 and 30 June 2013 at the Ochsner Medical Center in New Orleans, LA, as previously described.3,12 The Ochsner Foundation Institutional Review Board approved the study.
Briefly, biochemical, anthropometrics, and body composition were collected at baseline and in the morning. Body fat (BF) was measured using the sum of the skinfold method.13 Fat-free mass index (FFMI) was calculated by [1 − BF × body mass index (kg/m2)], as previously described.14 The patients were categorized into low and high BF using the cut-offs of ≤25% for men and ≤35% for women, and low and high FFMI based on the cut-offs of ≤18.9 kg/m2 for men and ≤15.4 kg/m2 for women, respectively.15 Comorbidities such as hypertension and diabetes mellitus were retrieved from diagnostic codes. The CR included three sessions per week for 12 weeks, for a total of 36 sessions, with the intensity of each session chosen based on heart rate close to anaerobic threshold. Each session started with 10 min of warm-up exercises and approximately 30–40 min of aerobic exercise such as treadmill, bicycle, and elliptical machine, and isometrics, followed by 10 min of cool-down exercise. No differences in exercise prescription were given between men and women.
CRF was defined as peak VO2 measured during a maximal CPX with gas exchange analysis (MedGraphics), at baseline and at the end of CR. The last CPX was only conducted if participants completed all 36 sessions of CR. The predicted peak VO2 based on Wasserman–Hansen (W-H)16 and FRIEND-Registry17 prediction equations was calculated and the percent (%) achieved of predicted peak VO2 was obtained.
The changes in CRF indicators, including peak VO2, %W-H, and %FRIEND, were calculated by taking the difference between the baseline and the end of CR. The changing variable was then additionally adjusted for the baseline level of the respective indicator using the residual method18 in order to control for the possible confounding effect of the baseline level of CRF on the change. The retrospective data contained the variables for a total of 1215 patients. Of those, 362 were excluded due to invalid follow-up time (n = 27), missing on peak VO2 (n = 36), or the respiratory exchange ratio <1.0 (n = 288), or invalid/unreliable data (n = 11), which resulted in a final analytic sample of 853 (see Supplementary material online, Figure S1 for a flow diagram). An average follow-up time of the final analytic sample was 6.55 years (standard deviation = 3.69; median = 6.66 years; range = 0.02–13.12 years), and the all-cause mortality was determined by the National Death Index.
Statistical analysis
Descriptive characteristics of patients at pre- and post-CR were calculated. Two-tailed dependent sample t-test or Wilcoxon signed-rank test and the McNemar’s test were used to examine pre- and post-differences in continuous and categorical variables, respectively. Two Cox proportional hazard (PH) regression models were sequentially established for each of three CRF indicators (i.e. peak VO2, %W-H, and %FRIEND). Model 1 examined the risk of all-cause mortality in relation to the change in the level of CRF between pre- and post-CR while adjusting for age (years) at post-CR, sex, and body mass index (BMI) (kg/m2) at post-CR. The follow-up Model 2 additionally included the level of CRF at post-CR to test the relative importance of CRF level at post-CR (i.e. END-peak VO2) for the prediction of mortality over the CR-induced change in CRF.
Next, a split-sample approach was applied to determine the optimal prognostic cut-offs of CRF at post-CR predicting survival over time. We first randomly selected 70% of the original sample, stratified by survival status at the follow-up, as a development sample (n = 597; deceased = 74), and the remaining 30% was used as a validation sample (n = 256; deceased = 32). The Contal and O’Quigley’s method,19 which estimates the best cut-off based on the log-rank test statistics, was applied to the development sample using the ‘%FINDCUT’ SAS macro.20 The estimated cut-offs were then tested on the validation sample for its predictive accuracy in discriminating overall survival based on the bootstrapping method, in which 80% of the validation sample were bootstrapped 200 times. For each bootstrapped sample, time-dependent receiver operating characteristic curves were created to evaluate predictive accuracy at the follow-up years of 3, 5, and 10 based on the area under the curve (AUC), sensitivity (true positive), and specificity (true negative). Additionally, Uno’s concordance index (C-index)21 and integrated AUC were estimated to evaluate the overall accuracy of discrimination. The higher Uno’s C-index and integrated AUC indicate the better performance of cut-offs in discriminating survival over time and the estimates were interpreted as poor (<0.6), moderate (0.6–0.75), and high (≥0.75) predictive accuracy.22 The median and middle 95th percentile (2.5th–97.5th percentile) of the bootstrap distribution are reported.
Lastly, the established optimal cut-offs for the level of END-peak VO2 was applied to the entire sample. Cox PH regression analysis was conducted to predict the risk of all-cause mortality while adjusting age (years) at post-CR, sex, and BMI (kg/m2) at post-CR. The relative risk of mortality was presented as hazard ratio (HR) along with 95% confidence intervals. Graphical presentations of adjusted survival probability over time were performed using the SAS macro.23 For all Cox PH regression models, the PH assumption was checked using time-dependent interaction terms of all covariates and the Schoenfeld residual plots. The sensitivity analyses were performed after excluding early deaths within 2 years of follow-up to address the potential bias due to the reverse causation (e.g. lower CRF due to poor health condition). All statistical analyses were conducted using the SAS v9.4 (SAS Institute, Cary, NC, USA) and the significance level was set at ≤.05.
Results
The descriptive statistics of patient’s characteristics at pre- and post-CR are presented in Table 1. Patients were on average 63.96 ± 10.32 years old (male = 64.00 ± 10.54 years old; female = 63.80 ± 10.54 years old) when referred to the CR and largely predominated by men (79.37%). There were significant and positive changes in body composition during CR, in which average BMI and BF (%) were reduced from 29.02 kg/m2 to 28.75 kg/m2 and from 27.92% to 26.35%, respectively (P’s < 0.001). CR was associated with statistically significant improvements in CRF indicators, but also of cardiovascular biomarkers and risk factors, including total cholesterol, LDL-C, triglycerides, and C-reactive protein. Peak VO2 was significantly increased by an average of 2.16 mL/kg/min during CR, and %W-H16 and %FRIEND17 also improved by an average of 7.74% and 5.1%, respectively (P’s < 0.001).
Table 1.
Descriptive characteristics of study sample at pre- and post-cardiac rehabilitation (N = 853)
| Pre-cardiac rehabilitation | Post-cardiac rehabilitation | P-valuea | |
|---|---|---|---|
| Age (years) | 63.96 (10.32) | 64.32 (10.32) | <0.001 |
| Sex | |||
| Male | 677 (79.37%) | — | — |
| Female | 176 (20.63%) | — | — |
| Ejection fraction (%) | 54.29 (11.66) | — | — |
| BMI (kg/m2) | 29.02 (5.07) | 28.75 (4.94) | <0.001 |
| Obesity (n, %)b | 305 (35.76%) | 281 (32.94%) | 0.004 |
| Body fat (%) | 27.92 (7.39) | 26.35 (7.54) | <0.001 |
| High (n, %)c | 451 (52.87%) | 371 (43.49%) | <0.001 |
| Fat-free mass index (kg/m2) | 20.70 (2.83) | 20.96 (2.86) | <0.001 |
| High (n, %)d | 720 (84.41%) | 737 (86.40%) | 0.041 |
| Peak systolic BP (mmHg) | 170.41 (30.21) | 167.33 (30.61) | 0.002 |
| Peak diastolic BP (mmHg) | 82.17 (14.45) | 79.91 (13.63) | <0.001 |
| Respiratory exchange ratio | 1.15 (0.09) | 1.17 (0.10) | <0.001 |
| Peak VO2 (mL/kg/min) | 18.85 (5.33) | 21.01 (6.25) | <0.001 |
| Predicted peak VO2-W-He | 28.32 (5.09) | 28.17 (5.08) | <0.001 |
| %W-Hf | 66.97 (16.2) | 74.71 (17.85) | <0.001 |
| Predicted peak VO2-Fg | 41.00 (6.41) | 40.96 (6.42) | 0.007 |
| %FRIENDh | 46.09 (11.06) | 51.19 (12.01) | <0.001 |
| Total cholesterol (mg/dL) | 152.94 (34.85) | 153.11 (34.77) | 0.459 |
| HDL (mg/dL) | 39.60 (10.82) | 42.88 (11.16) | <0.001 |
| LDL (mg/dL) | 86.66 (27.89) | 86.80 (31.32) | 0.884 |
| Triglycerides (mg/dL)i | 114.00 (77.00) | 102.00 (71.00) | <0.001 |
| Fasting glucose (mg/dL)i | 103.00 (21.00) | 102.00 (21.00) | 0.479 |
| C-reactive protein (mg/dL)i | 2.40 (3.80) | 1.50 (2.50) | <0.001 |
Values are presented as mean (standard deviation) for continuous variables and as n (%) for categorical variables unless otherwise specified.
BMI, body mass index; BP, blood pressure; FRIEND, Fitness Registry and the Importance of Exercise: A National Data Base; HDL, high-density lipoprotein; LDL, low-density lipoprotein; VO2, oxygen consumption; W-H, Wasserman–Hansen predictive equation.
P-values are estimated from within-group comparisons using dependent sample t-tests for continuous variables and McNemar’s test for categorical variables. For the continuous variables with non-normal distribution, a non-parametric Wilcoxon signed-rank tests was performed.
BMI ≥30 kg/m2.
Age- and sex-specific body fat (%) thresholds were used.15
Fat-free mass index ≥18.9 kg/m2 for male and ≥15.4 kg/m2 for female.15
Wasserman–Hansen prediction equation16 was used.
Percent (%) achieved of predicted peak VO2 based on Wasserman–Hansen prediction equation.16
FRIEND-Registry prediction equation17 was used.
Percent (%) achieved of predicted peak VO2 based on FRIEND-Registry prediction equation.
Values are presented as median (interquartile range) due to non-normal distribution.
Table 2 presents the results of Cox PH regression analyses examining the risk of all-cause mortality based on the change in CRF (Model 1) and the level of CRF at post-CR (Model 2) while adjusting for study covariates. The results demonstrated that greater improvements in CRF during the CR were significantly associated with lower risk of mortality (HRs = 0.92, 0.97, and 0.97 for changes in peak VO2, %W-H, and %FRIEND, respectively). However, the observed associations were attenuated after introducing END-peak VO2 in Model 2, in fact, the changes in CRF no longer predicted the risk of mortality. Greater END-peak VO2, instead, remained significantly associated with lower risk of mortality (HRs = 0.84, 0.96, and 0.93 for peak VO2, %W-H, and %FRIEND at post-CR, respectively).
Table 2.
Multivariate Cox proportional hazard regression analyses (N = 853; deceased = 106)
| Model 1a | Model 2a | |||
|---|---|---|---|---|
| HR (95% CI) | P-value | HR (95% CI) | P-value | |
| Based on peak VO2 (mL/kg/min) | ||||
| Changes in peak VO2b | 0.92 (0.86–0.98) | 0.010 | 1.01 (0.93–1.10) | 0.766 |
| Peak VO2 at post-CR | — | — | 0.84 (0.78–0.90) | <0.001 |
| Based on the % achieved of predicted peak VO2 (Wasserman-Hansen prediction equation) | ||||
| Changes in %W-Hb,c | 0.97 (0.95–0.98) | 0.001 | 1.01 (0.98–1.03) | 0.712 |
| %W-H at post-CRc | — | — | 0.96 (0.94–0.97) | <0.001 |
| Based on the % achieved of predicted peak VO2 (FRIEND-Registry prediction equation) | ||||
| Changes in %FRIENDb,d | 0.97 (0.95–0.99) | 0.020 | 1.01 (0.97–1.04) | 0.721 |
| %FRIEND at post-CRd | — | — | 0.93 (0.91–0.96) | <0.001 |
CI, confidence interval; CR, cardiac rehabilitation; HR, hazard ratio.
Models were adjusted for age (years) at post-CR, sex, ejection fraction (%), and body mass index (kg/m2) at post-CR.
Change variables were adjusted for the respective pre-CR levels using residual method.18
Percent (%) achieved of predicted peak VO2 based on Wasserman–Hansen prediction equation.
Percent (%) achieved of predicted peak VO2 based on FRIEND-Registry prediction equation.
Figure 1 depicts absolute log-rank statistics across the levels of CRF indicators at post-CR estimated from developmental sample using the Contal and O’Quigley’s method. The estimated optimal cut-offs maximizing absolute log-rank statistic were ≥17.6 mL/kg/min for peak VO2 (|log-rank statistics| = 24.28, Q-statistics = 2.92, P = 7.795 × 10⁻⁸), ≥62.1% for %W-H (|log-rank statistics| = 19.87, Q-statistics = 2.39, P = 2.170 × 10⁻⁵), and ≥41.4% for %FRIEND (|log-rank statistics| = 24.33, Q-statistics = 2.93, P = 7.255 × 10⁻⁸).
Figure 1.
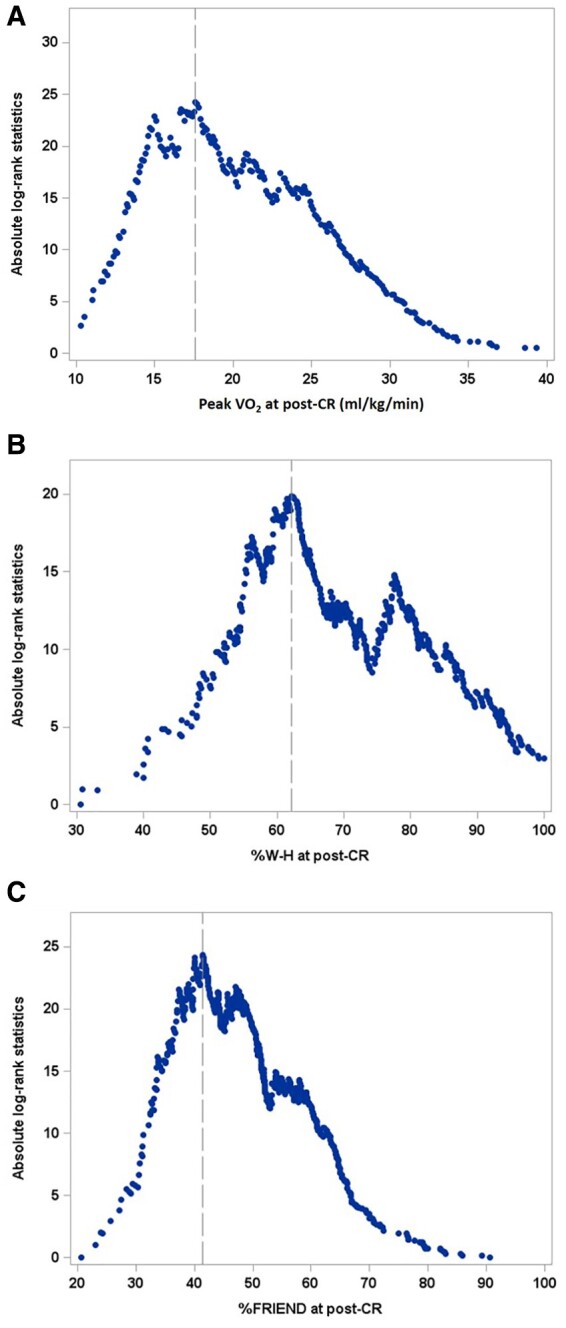
Absolute log-rank statistics by the level of cardiorespiratory fitness at post-cardiac rehab. Peak VO2 ≥17.6 mL/kg/min (A), % predicted peak VO2 using W-H (cut-off: ≥62.1%) (B), and (C) %% predicted peak VO2 using FRIEND (cut-off: ≥41.4%) (C) among development sample (n = 597; deceased = 74). Vertical lines indicate the optimal cut-offs maximizing absolute log-rank statistics based on the Contal and O’Quigley’s method. FRIEND, Fitness Registry and the Importance of Exercise: A National Data Base; VO2, oxygen consumption; W-H, Wasserman–Hansen predictive equation.
Table 3 presents the predictive accuracies of the established cut-offs tested among the validation sample using the bootstrapping method. The median of the bootstrap distribution estimated for Uno’s C-index was 0.75 for both peak VO2 (middle 95th percentile: 0.66–0.81) and %FRIEND (middle 95th percentile = 0.66–0.81) and lowest for %W-H (median = 0.68; middle 95th percentile: 0.57–0.72). Similarly, the median of the bootstrap distribution estimated for integrated AUC was highest for %FRIEND (0.73), followed by Peak VO2 (0.70) and %W-H (0.62). Pertaining to the predictive accuracy at follow-up years of 3, 5, 10 years, the median values of the bootstrap distribution estimated for time-dependent AUC were ranged between 0.62 and 0.71 for peak VO2, between 0.50 and 0.59 for %W-H, and between 0.66 and 0.70 for %FRIEND, respectively. The highest median values of specificity were observed for %FRIEND across all follow-up years (0.79, 0.79, and 0.83 at follow-up years of 3, 5, and 10, respectively). The lowest sensitivity values were estimated for %W-H showing the sensitivity of 0.23, 0.29, and 0.43 at follow-up years of 3, 5, and 10, respectively.
Table 3.
Predictive accuracy of the estimated optimal cut-offs based on the bootstrapped validation sample modela
| Peak VO2 at post-CR (cut-off: ≥17.6 mL/kg/min) | %W-H at post-CR (cut-off: ≥62.1%) | %FRIEND at post-CR (cut-off: ≥41.4%) | |
|---|---|---|---|
| Uno’s C-index | 0.75 (0.66–0.81) | 0.68 (0.57–0.72) | 0.76 (0.64–0.80) |
| Integrated AUC | 0.70 (0.63–0.78) | 0.62 (0.55–0.67) | 0.73 (0.65–0.78) |
| Time-dependent AUC | |||
| Follow-up year 3 | 0.71 (0.65–0.78) | 0.50 (0.44–0.55) | 0.70 (0.64–0.78) |
| Follow-up year 5 | 0.62 (0.57–0.68) | 0.52 (0.48–0.56) | 0.66 (0.61–0.70) |
| Follow-up year 10 | 0.67 (0.63–0.72) | 0.59 (0.54–0.63) | 0.69 (0.65–0.73) |
| Sensitivity (true positive) | |||
| Follow-up year 3 | 0.74 (0.63–0.87) | 0.23 (0.13–0.32) | 0.62 (0.49–0.78) |
| Follow-up year 5 | 0.58 (0.49–0.69) | 0.29 (0.21–0.38) | 0.53 (0.44–0.62) |
| Follow-up year 10 | 0.65 (0.59–0.73) | 0.43 (0.35–0.50) | 0.55 (0.46–0.62) |
| Specificity (true negative) | |||
| Follow-up year 3 | 0.68 (0.66–0.71) | 0.77 (0.74–0.79) | 0.79 (0.77–0.81) |
| Follow-up year 5 | 0.67 (0.63–0.70) | 0.75 (0.72–0.78) | 0.79 (0.76–0.81) |
| Follow-up year 10 | 0.70 (0.65–0.75) | 0.74 (0.69–0.79) | 0.83 (0.80–0.87) |
Eighty percent of validation sample (n = 256; deceased = 32) was bootstrapped 200 times with replacement while maintaining the proportion of deceased to be equal to the proportions in the entire sample. Values are the median and middle 95th percentile (2.5th and 97.5th) obtained from the bootstrapped distribution of the estimates.
AUC, area under the curve; C-index, concordance index; CR, cardiac rehabilitation.
The results of Cox PH regression analysis among the entire sample and the adjusted survival probability curves stratified by the optimal cut-offs established for CRF level at post-CR are presented in Figure 2. The relative risks of all-cause mortality were significantly greater for patients who had CRF levels at post-CR below the established cut-offs (HRs = 2.93, 2.94, and 3.28 for peak VO2, %W-H, and %Friend’s cut-offs, respectively).
Figure 2.
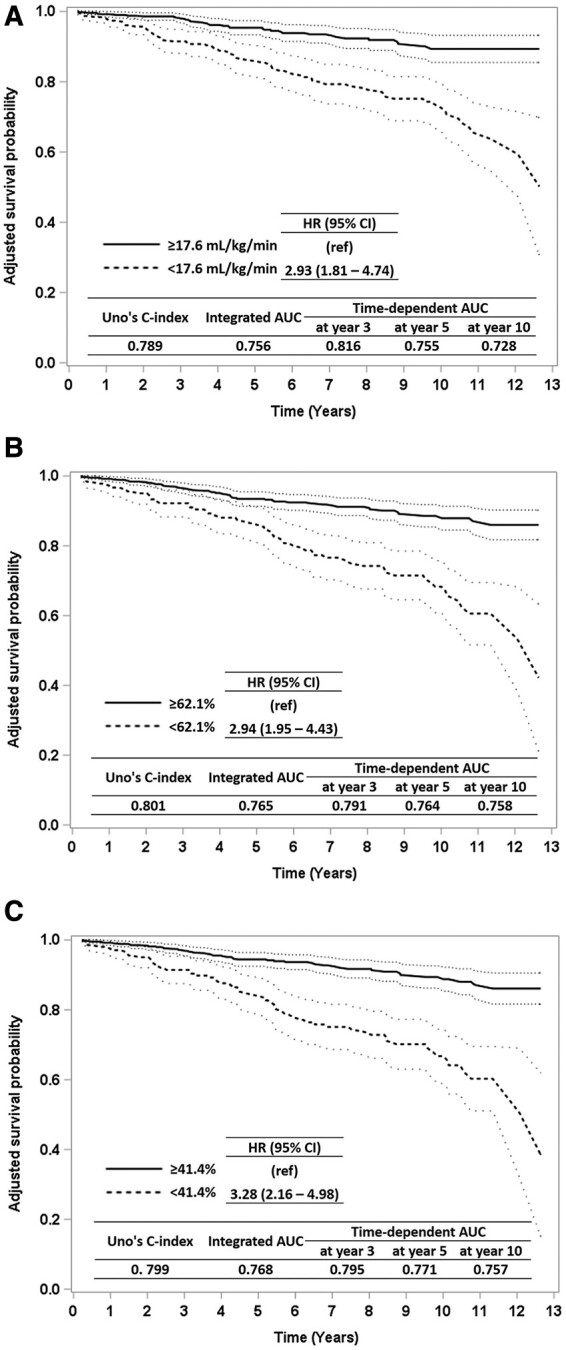
Survival curves. Adjusted survival curves stratified by the optimal cut-offs of cardiorespiratory fitness level at post-cardiac rehab among the entire sample (n = 853; deceased = 106). Peak VO2 ≥17.6 mL/kg/min (A), % predicted peak VO2 using W-H (cut-off: ≥62.1%) (B), and (C) %% predicted peak VO2 using FRIEND (cut-off: ≥41.4%) (C). The survival probability was estimated from Cox proportional hazard regression models adjusting age (years) at post-cardiac rehab, sex, ejection fraction (%), and body mass index (kg/m2) at post-cardiac rehab. FRIEND, Fitness Registry and the Importance of Exercise: A National Data Base; VO2, oxygen consumption; W-H, Wasserman–Hansen predictive equation.
Discussion
In the current study, we have shown that END-peak VO2 is a strong predictor for long-term survival in patients with CHD undergoing CR. Importantly, these effects were independent of the changes of CRF adjusted for the baseline level of CRF. In fact, consistently with prior studies, baseline peak VO2 and changes in peak VO2 were strong predictors of survival3; however, these effects were no longer significant after statistical adjustments for END-peak VO2 in our sample. The protective effects of END-peak VO2 were also independent of age, sex, and BMI, suggesting that independent of the patient’s characteristics, achieving a greater peak VO2 at the end of CR should perhaps remain the primary goal of CR.
Prior studies from our group have shown that greater changes in CRF during CR (i.e. responders) would present a more favourable long-term prognosis.3 Herein, however, we further expanded our understanding of CRF in patients with CHD undergoing CR. In fact, we detected cut-offs for peak VO2 and % predicted peak VO2 using clinically available predictive equations. We identified that achieving an END-peak VO2 ≥17.6 mL/kg/min at the end of CR predicts favourable long-term survival compared to those who achieve a lower END-peak VO2. Moreover, we have found that ≥62.1% and ≥41.4% predicted END-peak VO2 using the W-H and the FRIEND predictive equations, respectively, were also associated with a favourable outcome.
Our findings would propose that individuals who achieve a level of CRF (i.e. END-peak VO2) that is sub-optimal, hence, lower than our identified cut-offs, would benefit from additional therapeutics targeted at improving CRF. A longer CR programme could potentially allow to achieve such level of CRF needed to improve long-term survival, however, it would be plausible to hypothesize that high-intensity CR, while maintaining the relative short duration of the programme, might also be efficacious in this population.24 Many individuals would therefore benefit from additional strategies aimed at improving peak CRF further.
On the other hand, however, individuals who improve their peak VO2 only minimally during CR, or do not experience any improvements or even a decline in CRF, yet have an END-peak VO2 above the above identified threshold, might still present a more favourable long-term prognosis compared to those with a lower END-peak VO2, even if they have experienced significant improvements in CRF. Moreover, our study provided additional evidence highlighting the importance of measuring CRF using peak VO2 in patients with CHD undergoing CR due to its ability in predicting long-term clinical outcomes.
The lack of measures of adherence to the individual sessions of CR and the time when data collection was obtained, are limitations of our study, as the change in the management of patients with CHD might have impacted our findings. Moreover, we have not validated our findings in a different cohort and possibly with a larger number of women, diverse races, and ethnicities. Finally, these data were obtained with exercise gas exchange and precisely measuring exercise capacity, and these results may not be applicable to estimating exercise capacity based on treadmill speed and incline or estimated metabolic equivalents.
In conclusion, the END-peak VO2 is a strong and independent predictor of long-term survival in patients with CHD. This proposes that additional strategies aimed at improving peak VO2 further in patients undergoing CR should be implemented. Clearly, further study of factors to improve peak VO2 are needed.
One sentence summary
Peak oxygen consumption, a measure of cardiorespiratory fitness, achieved at the end of cardiac rehabilitation in patients with coronary heart disease predicted long-term survival, independent of the changes of peak oxygen consumption adjusted for the baseline level, proposing that greater effort should be placed by clinicians to achieve the identified cut-offs for peak oxygen consumption at the end of cardiac rehab.
Supplementary material
Supplementary material is available at European Heart Journal – Quality of Care and Clinical Outcomes online.
Funding
S.C. is supported by a Career Development Award 19CDA34660318 from the American Heart Association and by the Clinical and Translational Science Awards Program UL1TR002649 from National Institutes of Health to Virginia Commonwealth University.
Conflict of interest: The authors have nothing to disclose.
Data availability
The anonymized data underlying this article will be shared on reasonable request to the corresponding author.
Contributor Information
Salvatore Carbone, Department of Kinesiology & Health Sciences, College of Humanities & Sciences, Virginia Commonwealth University, 1020 W Grace Street, Richmond, VA, 23220, USA; VCU Pauley Heart Center, Division of Cardiology, Department of Internal Medicine, Virginia Commonwealth University, 1020 E Broad Street, Richmond, VA 23298, USA.
Youngdeok Kim, Department of Kinesiology & Health Sciences, College of Humanities & Sciences, Virginia Commonwealth University, 1020 W Grace Street, Richmond, VA, 23220, USA.
Sergey Kachur, John Ochsner Heart and Vascular Institute, Ochsner Clinical School—The University of Queensland School of Medicine, 1514 Jefferson Highway, New Orleans, LA 70121-2483, USA.
Hayley Billingsley, Department of Kinesiology & Health Sciences, College of Humanities & Sciences, Virginia Commonwealth University, 1020 W Grace Street, Richmond, VA, 23220, USA; VCU Pauley Heart Center, Division of Cardiology, Department of Internal Medicine, Virginia Commonwealth University, 1020 E Broad Street, Richmond, VA 23298, USA.
Jonathan Kenyon, Department of Kinesiology & Health Sciences, College of Humanities & Sciences, Virginia Commonwealth University, 1020 W Grace Street, Richmond, VA, 23220, USA.
Alban De Schutter, John Ochsner Heart and Vascular Institute, Ochsner Clinical School—The University of Queensland School of Medicine, 1514 Jefferson Highway, New Orleans, LA 70121-2483, USA.
Richard V Milani, John Ochsner Heart and Vascular Institute, Ochsner Clinical School—The University of Queensland School of Medicine, 1514 Jefferson Highway, New Orleans, LA 70121-2483, USA.
Carl J Lavie, John Ochsner Heart and Vascular Institute, Ochsner Clinical School—The University of Queensland School of Medicine, 1514 Jefferson Highway, New Orleans, LA 70121-2483, USA.
References
- 1. Virani SS, Alonso A, Benjamin EJ, Bittencourt MS, Callaway CW, Carson AP et al. Heart Disease and Stroke Statistics-2020 update: a report from the American Heart Association. Circulation 2020;141:e139–e596. [DOI] [PubMed] [Google Scholar]
- 2. Anderson L, Oldridge N, Thompson DR, Zwisler AD, Rees K, Martin N et al. Exercise-based cardiac rehabilitation for coronary heart disease: cochrane systematic review and meta-analysis. J Am Coll Cardiol 2016;67:1–12. [DOI] [PubMed] [Google Scholar]
- 3. De Schutter SA, Kachur S, Lavie CJ, Menezes A, Shum KK, Bangalore S et al. Cardiac rehabilitation fitness changes and subsequent survival. Eur Heart J Qual Care Clin Outcomes 2018;4:173–179. [DOI] [PubMed] [Google Scholar]
- 4. Lavie CJ, Ozemek C, Arena R. Bringing cardiac rehabilitation and exercise training to a higher level in heart failure. J Am Coll Cardiol 2019;73:1444–1446. [DOI] [PubMed] [Google Scholar]
- 5. Mikkelsen N, Cadarso-Suárez C, Lado-Baleato O, Díaz-Louzao C, Gil CP, Reeh J et al. Improvement in VO2peak predicts readmissions for cardiovascular disease and mortality in patients undergoing cardiac rehabilitation. Eur J Prev Cardiol 2020;27:811–819. [DOI] [PubMed] [Google Scholar]
- 6. Kavanagh T, Mertens DJ, Hamm LF, Beyene J, Kennedy J, Corey P et al. Peak oxygen intake and cardiac mortality in women referred for cardiac rehabilitation. J Am Coll Cardiol 2003;42:2139–2143. [DOI] [PubMed] [Google Scholar]
- 7. Oldridge N, Pakosh M, Grace SL. A systematic review of recent cardiac rehabilitation meta-analyses in patients with coronary heart disease or heart failure. Future Cardiol 2019;15:227–249. [DOI] [PubMed] [Google Scholar]
- 8. Lavie CJ, Ozemek C, Carbone S, Katzmarzyk PT, Blair SN. Sedentary behavior, exercise, and cardiovascular health. Circ Res 2019;124:799–815. [DOI] [PubMed] [Google Scholar]
- 9. Ross R, Blair SN, Arena R, Church TS, Despres JP, Franklin BA et al. Importance of assessing cardiorespiratory fitness in clinical practice: a case for fitness as a clinical vital sign: a scientific statement from the American Heart Association. Circulation 2016;134:e653–e699. [DOI] [PubMed] [Google Scholar]
- 10. Imboden MT, Harber MP, Whaley MH, Finch WH, Bishop DL, Fleenor BS et al. The association between the change in directly measured cardiorespiratory fitness across time and mortality risk. Prog Cardiovasc Dis 2019;62:157–162. [DOI] [PubMed] [Google Scholar]
- 11. Carbone S, Del Buono MG, Ozemek C, Lavie CJ. Obesity, risk of diabetes and role of physical activity, exercise training and cardiorespiratory fitness. Prog Cardiovasc Dis 2019;62:327–333. [DOI] [PubMed] [Google Scholar]
- 12. Kachur S, Menezes AR, De Schutter A, Milani RV, Lavie CJ. Significance of comorbid psychological stress and depression on outcomes after cardiac rehabilitation. Am J Med 2016;129:1316–1321. [DOI] [PubMed] [Google Scholar]
- 13. Jackson AS, Pollock ML. Practical assessment of body composition. Phys Sportsmed 1985;13:76–90. [DOI] [PubMed] [Google Scholar]
- 14. Lavie CJ, De Schutter A, Patel D, Artham SM, Milani RV. Body composition and coronary heart disease mortality—an obesity or a lean paradox? Mayo Clin Proc 2011;86:857–864. [DOI] [PMC free article] [PubMed] [Google Scholar]
- 15. Lavie CJ, De Schutter A, Patel DA, Romero-Corral A, Artham SM, Milani RV. Body composition and survival in stable coronary heart disease: impact of lean mass index and body fat in the "obesity paradox". J Am Coll Cardiol 2012;60:1374–1380. [DOI] [PubMed] [Google Scholar]
- 16. Arena R, Myers J, Abella J, Pinkstaff S, Brubaker P, Moore B et al. Determining the preferred percent-predicted equation for peak oxygen consumption in patients with heart failure. Circ Heart Fail 2009;2:113–120. [DOI] [PMC free article] [PubMed] [Google Scholar]
- 17. Kaminsky LA, Myers J, Arena R. Determining cardiorespiratory fitness with precision: compendium of findings from the FRIEND Registry. Prog Cardiovasc Dis 2019;62:76–82. [DOI] [PubMed] [Google Scholar]
- 18. Willett WC, Howe GR, Kushi LH. Adjustment for total energy intake in epidemiologic studies. Am J Clin Nutr 1997;65 (4 Suppl):1220S–1228S; discussion 1229S–1231S. [DOI] [PubMed] [Google Scholar]
- 19. Contal C, O'Quigley J. An application of changepoint methods in studying the effect of age on survival in breast cancer. Comput Stat Data Anal 1999;30:253–270. [Google Scholar]
- 20. Meyers J, Mandrekar J. Cutpoint determination methods in survival analysis using SAS: Updated %FINDCUT macro 2020. https://support.sas.com/resources/papers/proceedings15/3249-2015.pdf (last accessed 1 April 2020).
- 21. Uno H, Cai T, Pencina MJ, D'Agostino RB, Wei LJ. On the C-statistics for evaluating overall adequacy of risk prediction procedures with censored survival data. Stat Med 2011;30:1105–1117. [DOI] [PMC free article] [PubMed] [Google Scholar]
- 22. Parmar C, Leijenaar RT, Grossmann P, Rios Velazquez E, Bussink J, Rietveld D et al. Radiomic feature clusters and prognostic signatures specific for Lung and Head & Neck cancer. Sci Rep 2015;5:11044. [DOI] [PMC free article] [PubMed] [Google Scholar]
- 23. Zhang X, Loberiza FR, Klein JP, Zhang MJ. A SAS macro for estimation of direct adjusted survival curves based on a stratified Cox regression model. Comput Methods Programs Biomed 2007;88:95–101. [DOI] [PubMed] [Google Scholar]
- 24. Taylor JL, Holland DJ, Spathis JG, Beetham KS, Wisløff U, Keating SE et al. Guidelines for the delivery and monitoring of high intensity interval training in clinical populations. Prog Cardiovasc Dis 2019;62:140–146. [DOI] [PubMed] [Google Scholar]
Associated Data
This section collects any data citations, data availability statements, or supplementary materials included in this article.
Supplementary Materials
Data Availability Statement
The anonymized data underlying this article will be shared on reasonable request to the corresponding author.