Key Points
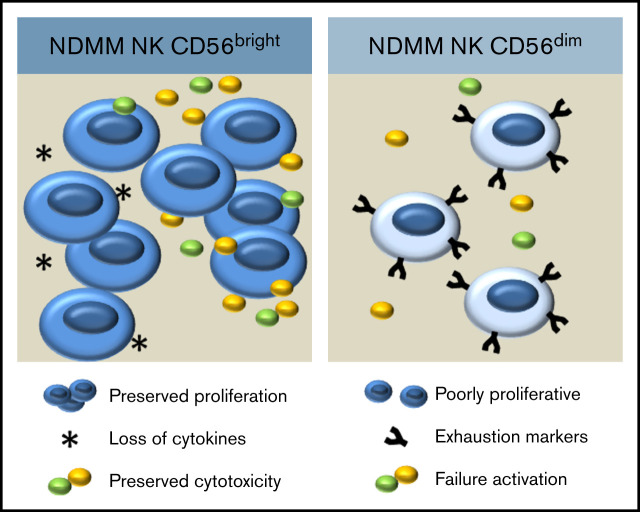
NK CD56bright cytokine-producing populations are selectively lost in myeloma with expansion of a dysfunctional CD56bright cytotoxic subset.
NK CD56dim cells in myeloma have features of exhaustion with impaired proliferation and activation, and increased inhibitory receptors.
Visual Abstract
Abstract
Natural killer (NK) cells are the key cells of the innate immune system that share many characteristics with T lymphocytes; their activation, however, is based on the integration of a range of activatory and inhibitory signals via receptors recognizing recurrent pathogen-associated molecular patterns. Two important populations of NK cells with differing functions are recognized: CD56bright and CD56dim. NK cells have the potential to recognize and kill malignant plasma cells, which offers therapeutic opportunities. We used mass cytometry to examine the phenotype and function of NK cell subsets from patients with newly diagnosed multiple myeloma (NDMM). We show that NK cells in NDMM are shifted toward a CD56bright but dysfunctional cytotoxic phenotype, which exhibits selective loss of cytokine production. The CD56dim subset has features of exhaustion with impaired proliferation, upregulation of programmed cell death protein 1, and loss of T-cell immunoglobulin and mucin domain 3 expression. Poor expression of NK cell activation markers is seen and is associated with inferior long-term survival. These results suggest that NK cell exhaustion is already present by the time of myeloma diagnosis and likely contributes to the loss of immunologic control of malignant plasma cells. Restoring NK cell function via immune-directed therapies offers a route to restoring immunologic control in multiple myeloma.
Introduction
The importance of the immune microenvironment and functional cellular cytotoxicity in the control of multiple myeloma has become increasingly well recognized. Both chimeric antigen receptor T-cell products1 and ex vivo modified natural killer (NK) cells2 have antimyeloma activity, whereas established pharmaceutical therapies, including immunomodulatory drugs such as lenalidomide and monoclonal antibodies such as daratumumab, function via both direct plasma cell–mediated toxicity and through their effects on cytotoxic immune cells.3
NK cells are innate lymphoid cells that share many phenotypic and functional features with CD8+ T lymphocytes. NK cell behavior is determined by a complex interplay between activating and inhibitory signals, including the loss of target cell major histocompatibility complex (MHC) class 1 expression and upregulation of stress ligands such as MHC class I chain-related protein and UL16 binding protein.
NK cells are classically divided into 2 subpopulations based on their expression of CD56. The NK 56bright subset constitutes 10% and the NK 56dim subset 90% of circulating NK cells.4 The NK CD56bright subset is immature and predominantly secretes cytokines in response to interleukin-12 (IL-12) and IL-18. In contrast, the NK 56dim subset is considered more mature and releases cytotoxic granules in addition to cytokines after encounters with NK receptor ligands. Healthy NK cells predominantly produce tumor necrosis factor α (TNFα) and interferon γ (IFNγ).5 The dominant cytokine produced depends on the nature of the activating stimulus received by the NK cells, with TNFα production requiring the engagement of fewer receptor classes compared with IFNγ production.4
Malignant plasma cells differ from many other transformed cells because they continue to express MHC class 16 and therefore have a degree of protection against NK cell–mediated lysis. Nonetheless, NK cells have the potential to target malignant plasma cells, provided sufficient levels of NK cell–activating ligands are expressed by myeloma cells. Plasma cells express cell surface MICA, the ligand for the NK receptor NKG2D, although the level of expression decreases with progressive disease.7 The NK cell–activating receptors NKG2D,8,9 DNAM1,10 and 2B49 are reduced in myeloma, suggesting that the response to plasma cell ligands will be suboptimal, and indeed NK cells in myeloma exhibit reduced in vitro cytotoxicity.11,12 Furthermore, NK cell expression of the immune checkpoint inhibitor programmed cell death protein 1 (PD1) is elevated, leading to impaired NK cytotoxicity and IFNγ production.13
We used mass cytometry to characterize NK cells in newly diagnosed multiple myeloma (NDMM) and show that features of NK cell exhaustion are present at the time of diagnosis, affecting both the NK CD56bright and NK CD56dim populations and that this can influence prognosis.
Methods
Study populations
Bone marrow samples obtained from 18 NDMM patients and control samples from discarded femoral heads of healthy individuals undergoing elective surgery (n = 6) or noninvolved staging bone marrows from individuals with high-grade lymphoma (n = 3) were stored and maintained in the Barts Cancer Institute tissue bank.
All NDMM bone marrow samples were obtained at diagnosis and before the initiation of treatment. NDMM samples represented a range of immunoglobulin A (n = 7), immunoglobulin G (n = 7), and light chain (n = 4) disease. Median age of NDMM patients was 64 years (range, 41-90 years); control individuals had a median age of 67 years (range, 40-85 years).
All bone marrow samples underwent density gradient centrifugation, were cryopreserved, thawed, and tested in batches. Ethical approval was provided by the East London and the City Health Authority Local Research Ethics Committee. Written informed consent was obtained from all patients in accordance with the Declaration of Helsinki.
Monoclonal antibodies
Metal conjugated monoclonal antibodies were obtained from Fluidigm (supplemental Table 1). The antibodies 2B4 (Cl.7), CD38 (HIT2), IL-2 (MQ1.17H2), IL-10 (Jes3-9D7), Ki67 (Ki67), PD1 (9EH.12.2H7), programmed cell death-ligand 1 (29E.2AS), and T-cell immunoglobulin and mucin domain 3 (TIM3) (F38-ZE2) were purchased from BioLegend and metal conjugated by using Fluidigm MaxparX8 conjugation kits as per manufacturer’s instructions.
Cell stimulation
Unselected bone marrow mononuclear cells (BMMCs) were thawed and rested overnight in complete culture medium before stimulation for 72 hours with plate-bound CD3 (OKT3; eBioscience) and suspension CD28 (CD28.2; eBioscience), resulting in the indirect, cytokine-driven stimulation of the entire BMMC compartment. Protein transport inhibitor (2 µL/mL; eBioscience) and metal tagged CD107a (2 µL/mL; Fluidigm) were added for the final 4 hours of stimulation.
Immune profiling by mass cytometry
Cryopreserved BMMCs were thawed and rested overnight in complete culture medium. For cell surface staining, cells were washed twice and incubated for 30 minutes with a pretitrated antibody mastermix. Cisplatin (2 µL of 10× dilution stock solution) (Fluidigm) was added for the final 5 minutes of incubation, and cells were washed twice. Cells were stained for intracellular and intranuclear expression according to the Fluidigm intranuclear staining protocol. Fully stained samples were fixed and stored for 12 to 72 hours at 4°C. Immediately before analysis, samples were incubated for 20 minutes with 1 µL of iridium intercalator (Fluidigm) at a 1000× dilution. A final 3 washes were undertaken before data acquisition.
Data were acquired by using a CyTOF2 mass cytometer (Fluidigm) with a Super Sampler (Victorian Airships) at a cell concentration of 2.5 × 10⁶/mL. Data were normalized against EQ bead standards using the Helios normalizer (version 6.7).
Cytotoxicity assay
A cytotoxicity assay was performed as described in the supplemental Methods.
Statistics
Data analysis was performed by using Cytobank. Live single-cell events were identified on the basis of Iridium 191+Iridium 193+cisplatin–. NK cells were identified by using the phenotype CD45+CD3–CD16+/−CD56+. The CD56dim subset was defined as CD16+CD56low, and the CD56bright subset was CD16+/−CD56high. Backgating on B-cell and plasma cell lineage markers was used to ensure that CD56+ plasma cells were not included within the NK gate. Statistical analysis was performed in GraphPad Prism version 9 (GraphPad Software). The t test was used to compare groups when data were parametric, and the Mann-Whitney U test was used for nonparametric data. viSNE analysis14 was used to further characterize subpopulations within the NK cell gate. The viSNE algorithm is based on the t-distributed stochastic neighbor embedding algorithm; it generates a two-dimensional plot of multi-dimensional data, with each cell positioned according to its similarity to the phenotype of surrounding cells.
Results
NK cell population in NDMM is skewed toward a CD56bright phenotype
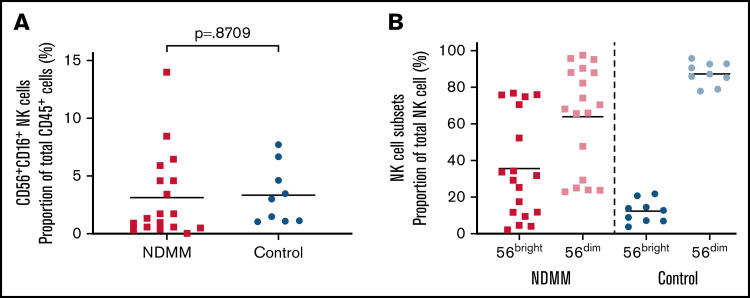
Total NK cell numbers were comparable between NDMM and control samples (Figure 1A). A significant skew toward the CD56bright population was observed in NDMM compared with control (CD56bright NDMM mean, 24.08%; control mean, 11.34% [t test, P = .046]; CD56dim NDMM mean, 58.97%; control mean, 80.22% [t test, P = .0213]) (Figure 1B). Importantly, a bimodal distribution was seen in myeloma, with some individuals having a pattern of distribution similar to that seen in the control samples.
Figure 1.
Bone marrow NK cell subsets in patients with NDMM and control subjects. (A) Bone marrow CD3–CD56+CD16+ NK cells in patients with NDMM and in control subjects. (B) Proportions of NK56bright and NK56dim subsets in bone marrow of patients with NDMM and control subjects.
Because this skew in subpopulations could be due to a relative expansion of the NK CD56bright subset or loss of the CD56dim population, we next examined expression of Ki67 as a measure of proliferative potential.
NK cells in NDMM have reduced expression of Ki67, with the CD56dim population being least proliferative
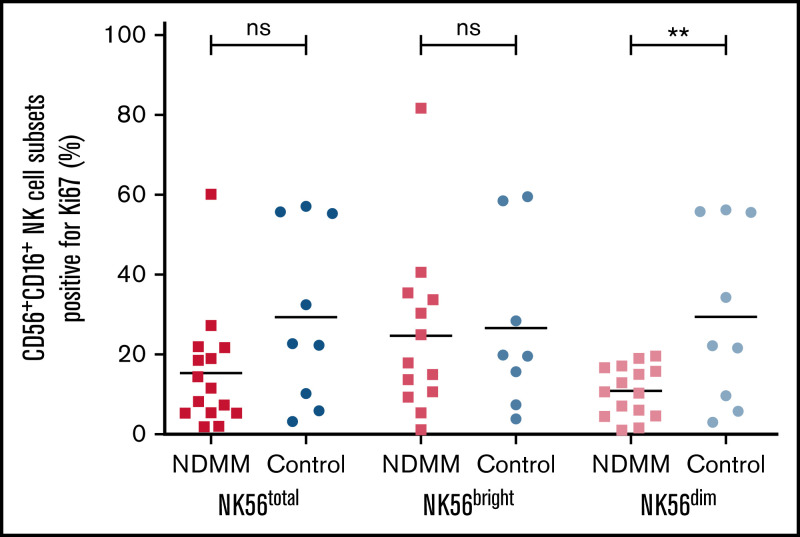
Expression of Ki67 across the total NK cell population in NDMM was one-half that seen in control samples (NDMM mean, 15.50%; control mean, 29.57%) (Figure 2). Ki67 expression was significantly lower in NDMM in the CD56dim subset (NDMM mean, 11.12%; control mean, 29.51%; t test, P = .005), whereas no difference was seen in the CD56bright subset (NDMM mean, 24.84%; control mean, 26.78%; t test, P = .84). This suggests that the relative expansion of the NK56bright subset seen in NDMM is due to a relative failure of proliferation in the NK56dim subset, and we hypothesized that this may indicate the development of exhaustion in the NK56dim subset.
Figure 2.
Bone marrow NK cell expression of Ki67 in patients with NDMM and control subjects. Bone marrow CD3–CD56+CD16+ NK cell Ki67 expression in NDMM and control subjects. Proportions of NK56bright and NK56dim subsets expressing Ki67 in bone marrow of patients with NDMM and control subjects are also shown. **P ≤ .01; ns, not significant.
NK cells in NDMM have phenotypically and functionally abnormal NK56bright and NK56dim populations demonstrated by viSNE analysis
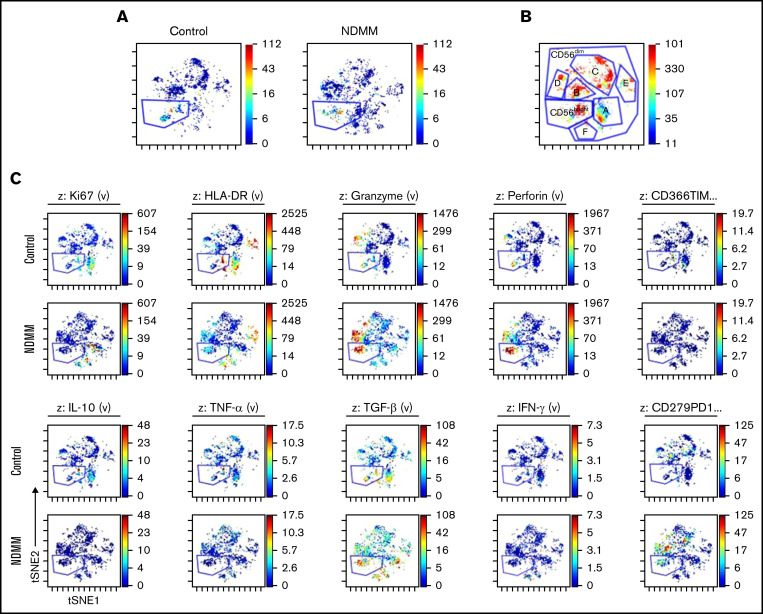
NK cells in the resting state were identified by using traditional Boolean gating, and a viSNE analysis was performed to further characterize the NK cell populations (Figure 3A). The CD56bright and CD56dim populations could be readily identified. Within these classical NK cell populations, further phenotypically and functionally distinct cell groups could be identified by mass cytometry analysis (Figure 3B).
Figure 3.
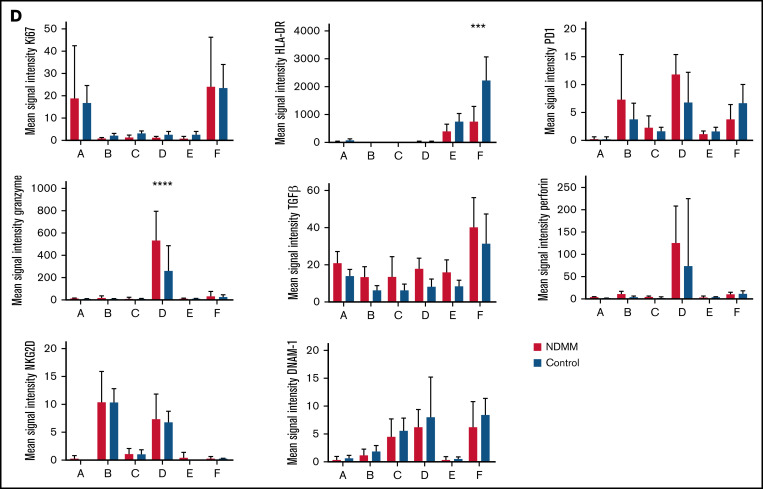
viSNE analysis of NK cell subset in NDMM and control subjects. (A) Representative samples of two viSNE analyses. NK cells were identified by traditional Boolean gating before performing the viSNE analysis with equal sampling across all samples. The gated population is the CD56bright population. (B) Within the CD56dim population, multiple subpopulations (labeled A-F) can also be identified. (C) viSNE analysis of mass cytometry data allows multiple NK subsets to be identified based on immune marker expression, cytokine production, proliferation, and granzyme and perforin expression. The gated population is the CD56bright subset; the ungated region is the CD56dim subset. (D) Patterns of marker expression across the CD56dim subpopulations reveal distinct populations with different phenotypic and functional characteristics. Statistically significant differences between NDMM and control expression are seen for the HLA-DR population F (***P ≤ .001) and granzyme population D (****P ≤ .0001).
Within control samples, 2 distinct CD56bright populations were identified (Figure 3C). The first is an active population that is Ki67 positive, indicating proliferation, and coexpresses IL-10, transforming growth factor β (TGFβ), and a variable level of TNFα and IFNγ. Granzyme and perforin expression in this population was low, in keeping with the expected phenotype, but the activation markers HLA-DR and TIM3 were expressed, indicating that this is an activated population.
In contrast, the second control CD56bright population was poorly proliferative, expressed TGFβ but not the classical NK cell cytokines, and was strongly positive for both granzyme and perforin. This indicates that although CD56bright populations were predominantly cytokine producing, they did have cytotoxic capacity and that the cytotoxic population was phenotypically distinct from the cytokine-producing population.
In NDMM, there was a relative loss of the proliferative NK56bright cytokine-producing population with preservation of the cytotoxic subset. Unlike the equivalent population in control samples, this population expressed both PD1 and TGFβ. This indicates that in myeloma, there was selective loss of the “true” CD56bright population with expansion of a functionally impaired CD56bright cytotoxic subset with features of pro-tumor immune dysfunction.
The CD56dim region contains multiple distinct populations with varied phenotype (Figure 3D), which would not be apparent using traditional grating techniques. These are characterized by a highly proliferative region with minimal cytotoxic activity (population A); a poorly proliferative NKG2D-expressing region (population B); and a poorly proliferative region with moderate DNAM-1 expression (population C), a region coexpressing NKG2D and DNAM1, granzyme, and perforin in keeping with the classically described mature, cytotoxic CD56dim population. In NDMM, this has additional expression of PD1 indicating NK cell exhaustion (population D), a region with globally poor marker expression (population E), and an activated and proliferative population with high expression of HLA-DR and DNAM-1 that coexpresses elevated levels of TGF-β and is expanded in NDMM (population F). It is interesting to note that a differential distribution of the NK cell–activating receptors NKG2D and DNAM1 was seen across the subpopulations, with coexpression apparent on population D, whereas prominent NKG2D expression was seen on population B and DNAM-1 expression on population F. This suggests that these markers may define different NK cell populations with distinct functional activity.
To further explore the functional capabilities of NK cells in NDMM, we performed stimulation studies to assess granzyme, perforin, and cytokine production capacity.
NK cells in NDMM retain the capacity to upregulate granzyme and perforin production after cell stimulation
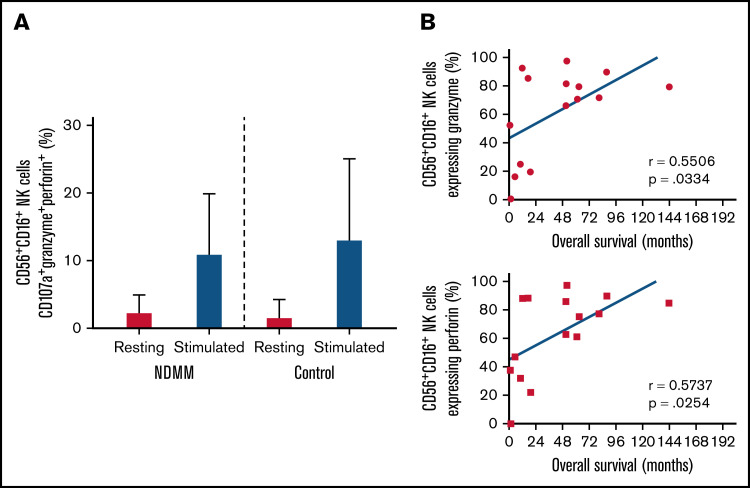
The expression of granzyme, perforin, and CD107a and the proportion of NK cells triple-positive for all 3 markers were assessed before and after stimulation of BMMCs. The proportion of triple-positive cells rose in both control (resting NK median, 0.26%; stimulated NK median, 9.986%; Mann-Whitney U test, P = .012) and NDMM (resting NK median, 1.582%; stimulated NK median, 8.537%; Mann-Whitney U test, P = .045). No differences in peak triple-positive cell numbers were observed (Figure 4A). This suggests that NK cells in NDMM retain the capacity to upregulate granzyme and perforin production when faced with appropriate stimuli. An in vitro functional cytotoxicity assay revealed impaired target cell killing in NDMM (supplemental Figure 1A).
Figure 4.
Bone marrow NK cell expression of degranulation markers in patients with NDMM and control subjects. (A) Bone marrow CD3–CD56+CD16+ NK cells triple-positive for granzyme, perforin, and CD107a in NDMM and control subjects in the resting and stimulated state. (B) Correlation between survival and CD3–CD56+CD16+ NK cell granzyme or perforin expression in NDMM.
Interestingly, both NK cell perforin (Pearson correlation r = 0.57; P = .025) and granzyme (Pearson correlation r = 0.55; P = .03) expression (Figure 4B) positively correlated with overall survival from time of diagnosis. This suggests that persistent NK cell cytotoxicity is a key aspect of the immunologic control of NDMM.
NDMM NK cells have incompetent cytokine production after cell stimulation
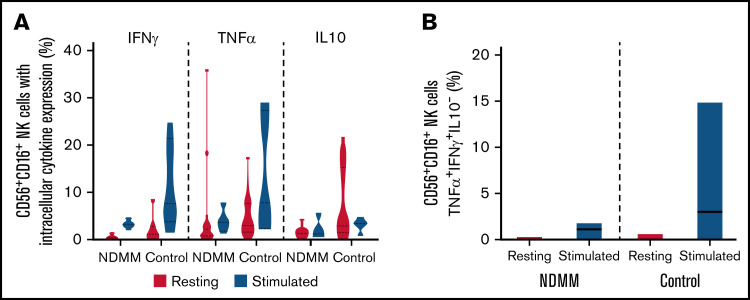
NK cells produce the antitumor cytokines IFNγ and TNFα and the pro-tumor cytokine IL-10. The distribution of multiple cytokine phenotypes was examined in both the resting state and the stimulated state. Loss of IFNγ was particularly noted (resting NDMM mean, 0.54%; control mean, 2% [t test, P = .03]; stimulated NDMM, 3.2%; control, 11.45% [t test, P = .13]) (Figure 5A). As expected, in the resting state, the majority of NK cells were triple-negative for TNFα, IL-10, and IFNγ (NDMM mean, 78.82%; control mean, 87.15%). After stimulation, control samples exhibited a 10-fold increase in IFNγ+TNFα+IL10– cell population, whereas in NDMM, there was minimal increase in this population (Figure 5B). This is in keeping with the loss of the cytokine-producing subset observed in the viSNE analysis. An in vitro functional cytotoxicity assay exhibited impaired cytokine production in NDMM, and this was particularly pronounced for IFNγ (supplemental Figure 1B).
Figure 5.
Bone marrow NK cell expression of intracellular cytokines in patients with NDMM and control subjects. (A) Bone marrow CD3–CD56+CD16+ NK cells expressing IFNγ, TNFα, and IL-10 in the resting and stimulated state. (B) Bone marrow CD3–CD56+CD16+ NK cells double-positive for IFNγ and TNFα in the resting and stimulated state.
TIM3 expression is reduced in NK cells from NDMM and may represent failure of NK cell activation
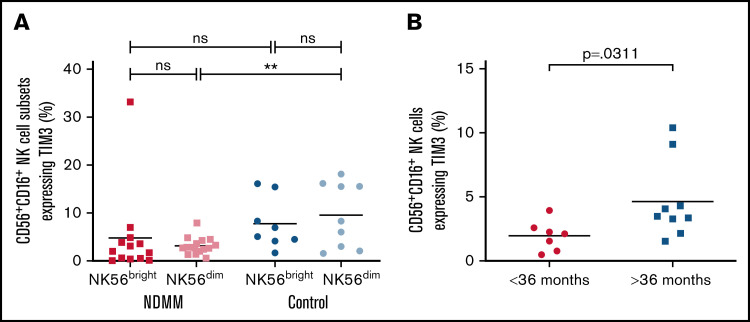
Expression of TIM3 was significantly lower on NDMM NK cells than those of control samples (NDMM mean, 3.01%; control mean, 9.34%; t test, P = .002). This was predominantly due to a loss of expression on the CD56dim subset (NDMM mean, 3.23%; control mean, 9.62%; t test, P = .002) (Figure 6A).
Figure 6.
Bone marrow NK cell expression of TIM3 in patients with NDMM and control subjects. (A) Proportions of NK56bright and NK56dim subsets expressing TIM3 in bone marrow of patients with NDMM and control subjects. (B) Bone marrow CD3–CD56+CD16+ NK cell TIM3 expression in patients with NDMM in those surviving <36 months and >36 months. **P ≤ .01; ns, not significant.
TIM3 expression increases with NK cell maturation and is considered to be a marker of NK cell activation.15 As expected, TIM3 levels rose on control samples with decreased CD56 expression (NK56bright, 7.764%; NK56dim, 9.620%); however, they fell in NDMM (NK56bright, 4.705%; NK56dim, 3.228%) (Figure 6A). Loss of NK cell TIM3 expression in NDMM may therefore represent the development of an exhausted state. When patients with NDMM were stratified according to survival, a higher level of TIM3 was seen in those surviving >36 months (mean survival <36 months, 2.13%; mean survival >36 months, 3.47%; Mann-Whitney U test, P = .031) (Figure 6B), again suggesting that NK cell activation may be important for long-term myeloma survival.
PD1 expression is upregulated on NK cells from NDMM
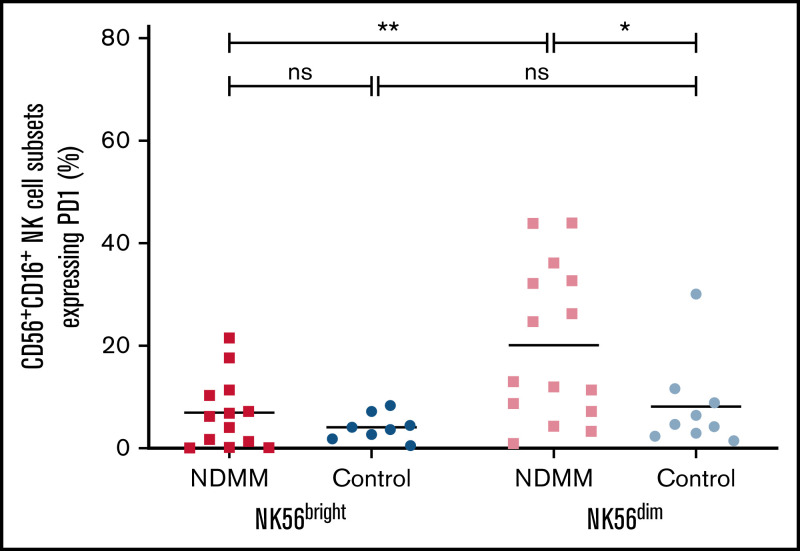
Expression of PD1 on NDMM NK cells was more than twice than on controls (PD1 mean control, 7.5%; NDMM, 15.85%) and was increased on both control and NDMM NK CD56dim cells compared with NK CD56bright subsets (Figure 7). Upregulation of CD56dim PD1 expression was more pronounced in NDMM (NDMM mean, 20.04%; control mean, 7.99%; t test, P = .039) populations. Increased expression of PD1 on NDMM CD56dim populations is suggestive of NK cell exhaustion in this population.
Figure 7.
Bone marrow NK expression of PD1 in patients with NDMM and control subjects. Proportions of NK56bright and NK56dim subsets expressing PD1 in bone marrow of patients with NDMM and control subjects. *P ≤ .05; **P ≤ .01; ns, not significant.
Discussion
Here we established that multiple defects in both CD56dim and CD56bright NK cell populations are present at the time of myeloma diagnosis and that there is a survival disadvantage associated with these features of NK cell derangement.
The CD56bright defects result in selective loss of the classical cytokine-producing population with preservation of a functionally abnormal cytotoxic subset. The CD56dim defects result in reduced proliferation, loss of IFNγ production, loss of NK cell activation, and elevated PD1 expression.
NK CD56bright skewing has been reported in other malignancies. In non–small cell lung cancer, the predominant tumor infiltrating NK cell is CD56bright, compared with CD56dim being predominant in noncancerous lung tissue.16 Furthermore, CD56dim tumor-infiltrating NK cells have defects in degranulation16,17 and IFNγ production.17 In hematologic malignancies, Vari et al18 reported that NK cells in the peripheral blood of patients with Hodgkin lymphoma are shifted toward an NK CD56bright subset. In Hodgkin lymphoma, however, it is these CD56bright cells that have elevated expression of PD1. Unlike the work we present here, none of these previous studies has examined in detail the functional NK cell subpopulations within the CD56bright and CD56dim groups. It is important to remember that circulating NK cells may not reflect the functional changes seen within the tumor microenvironment, where NK cells are in direct contact with the malignant population, as will be the case with the bone marrow samples studies here.
By harnessing the deep phenotyping power of mass cytometry, we have extended the existing data on NK cells in myeloma by examining multiple parameters at the single-cell level and identifying key subpopulation abnormalities. This includes the selective loss of the CD56bright cytokine-producing population, which would not be apparent using traditional analysis.
The role of tumor immune surveillance is often attributed to cytotoxic T cells, with the role of NK cells being overlooked. Our observation that features of exhaustion can be seen in NK CD56dim populations, while those patients with superior long-term survival express multiple markers of NK cell activation at the time of myeloma diagnosis, highlights the crucial role that NK cells are playing in tumor surveillance in this disease.
These data have important implications for optimizing therapeutic strategies for NDMM. Traditionally, individuals with NDMM are offered treatment only once symptomatic disease has become apparent. Our data, however, clearly indicate that NK cell defects which may affect prognosis are already detectable at the time of myeloma diagnosis. Focusing on repairing these defects at an early disease time point may allow long-term myeloma control to be established, avoiding or delaying the need for more intensive therapeutic strategies and preventing end-organ damage. Possible therapeutic options would include the use of lenalidomide, which has been shown to restore IFNγ production in NK cells from individuals with chronic lymphocytic leukemia.19 Because this drug has an established use in myeloma, is a well-tolerated oral treatment, and has already been explored in the setting of smoldering myeloma, its role in restoring NK cell function in this setting should be examined.
The monoclonal antibody elotuzumab has a variety of immune stimulatory activities, including the activation of NK cells via targeting of SLAMF7. It has displayed antimyeloma activity when combined with an immunomodulatory drug and corticosteroids in the relapsed refractory setting20,21 but has not yet been evaluated in earlier lines of treatment.
In summary, these data show that NK cells in NDMM exhibit multiple features of NK cell exhaustion that affect both the CD56dim and CD56bright subsets. Deleterious NK cell activation is associated with inferior long-term survival. NK cell subsets may serve as a useful therapeutic target at this early disease stage, and steps to optimize NK cell activation should be explored.
Supplementary Material
The full-text version of this article contains a data supplement.
Acknowledgments
The authors thank the staff of the Barts Cancer Institute Tissue Bank and Flow Cytometry Core facility who assisted with this work.
This work was supported by research funding from The London Clinic Charity (ONAS1A2R) and from Barts Charity (MRD0203/G-001195, J.G.G. and F.S.).
Authorship
Contribution: F.S. performed experiments and made the figures; F.S. and J.G.G. analyzed results; F.S., J.D.C., and J.G.G. designed the research and wrote the paper; and J.M. provided clinical data.
Conflict-of-interest disclosure: The authors declare no competing financial interests.
Correspondence: Frances Seymour, Department of Haematology, Leeds Cancer Centre, St James's Hospital, Leeds LS9 7TF, United Kingdom; e-mail: frances.seymour1@nhs.net.
References
- 1.Raje N, Berdeja J, Lin Y, et al. Anti-BCMA CAR T-cell therapy bb2121 in relapsed or refractory multiple myeloma. N Engl J Med. 2019;380(18):1726-1737. [DOI] [PMC free article] [PubMed] [Google Scholar]
- 2.Shah N, Martin-Antonio B, Yang H, et al. Antigen presenting cell-mediated expansion of human umbilical cord blood yields log-scale expansion of natural killer cells with anti-myeloma activity. PLoS One. 2013;8(10):e76781. [DOI] [PMC free article] [PubMed] [Google Scholar]
- 3.Luptakova K, Rosenblatt J, Glotzbecker B, et al. Lenalidomide enhances anti-myeloma cellular immunity. Cancer Immunol Immunother. 2013;62(1):39-49. [DOI] [PMC free article] [PubMed] [Google Scholar]
- 4.Fauriat C, Long EO, Ljunggren H-G, Bryceson YT. Regulation of human NK-cell cytokine and chemokine production by target cell recognition. Blood. 2010;115(11):2167-2176. [DOI] [PMC free article] [PubMed] [Google Scholar]
- 5.Reefman E, Kay JG, Wood SM, et al. Cytokine secretion is distinct from secretion of cytotoxic granules in NK cells. J Immunol. 2010;184(9):4852-4862. [DOI] [PubMed] [Google Scholar]
- 6.Carbone E, Neri P, Mesuraca M, et al. HLA class I, NKG2D, and natural cytotoxicity receptors regulate multiple myeloma cell recognition by natural killer cells. Blood. 2005;105(1):251-258. [DOI] [PubMed] [Google Scholar]
- 7.Bernal M, Garrido P, Jiménez P, et al. Changes in activatory and inhibitory natural killer (NK) receptors may induce progression to multiple myeloma: implications for tumor evasion of T and NK cells. Hum Immunol. 2009;70(10):854-857. [DOI] [PubMed] [Google Scholar]
- 8.von Lilienfeld-Toal M, Frank S, Leyendecker C, et al. Reduced immune effector cell NKG2D expression and increased levels of soluble NKG2D ligands in multiple myeloma may not be causally linked. Cancer Immunol Immunother. 2010;59(6):829-839. [DOI] [PMC free article] [PubMed] [Google Scholar]
- 9.Fauriat C, Mallet F, Olive D, Costello RT. Impaired activating receptor expression pattern in natural killer cells from patients with multiple myeloma. Leukemia. 2006;20(4):732-733. [DOI] [PubMed] [Google Scholar]
- 10.El-Sherbiny YM, Meade JL, Holmes TD, et al. The requirement for DNAM-1, NKG2D, and NKp46 in the natural killer cell-mediated killing of myeloma cells. Cancer Res. 2007;67(18):8444-8449. [DOI] [PubMed] [Google Scholar]
- 11.Jurisic V, Srdic T, Konjevic G, Markovic O, Colovic M. Clinical stage-depending decrease of NK cell activity in multiple myeloma patients. Med Oncol. 2007;24(3):312-317. [DOI] [PubMed] [Google Scholar]
- 12.Konjević G, Vuletić A, Mirjačić Martinović K, Colović N, Čolović M, Jurišić V. Decreased CD161 activating and increased CD158a inhibitory receptor expression on NK cells underlies impaired NK cell cytotoxicity in patients with multiple myeloma. J Clin Pathol. 2016;69(11):1009-1016. [DOI] [PubMed] [Google Scholar]
- 13.Benson DM Jr, Bakan CE, Mishra A, et al. The PD-1/PD-L1 axis modulates the natural killer cell versus multiple myeloma effect: a therapeutic target for CT-011, a novel monoclonal anti-PD-1 antibody. Blood. 2010;116(13):2286-2294. [DOI] [PMC free article] [PubMed] [Google Scholar]
- 14.Amir AD, Davis KL, Tadmor MD, et al. viSNE enables visualization of high dimensional single-cell data and reveals phenotypic heterogeneity of leukemia. Nat Biotechnol. 2013;31(6):545-552. [DOI] [PMC free article] [PubMed] [Google Scholar]
- 15.Ndhlovu LC, Lopez-Vergès S, Barbour JD, et al. Tim-3 marks human natural killer cell maturation and suppresses cell-mediated cytotoxicity. Blood. 2012;119(16):3734-3743. [DOI] [PMC free article] [PubMed] [Google Scholar]
- 16.Carrega P, Morandi B, Costa R, et al. Natural killer cells infiltrating human nonsmall-cell lung cancer are enriched in CD56 bright CD16(-) cells and display an impaired capability to kill tumor cells. Cancer. 2008;112(4):863-875. [DOI] [PubMed] [Google Scholar]
- 17.Platonova S, Cherfils-Vicini J, Damotte D, et al. Profound coordinated alterations of intratumoral NK cell phenotype and function in lung carcinoma. Cancer Res. 2011;71(16):5412-5422. [DOI] [PubMed] [Google Scholar]
- 18.Vari F, Arpon D, Keane C, et al. Immune evasion via PD-1/PD-L1 on NK cells and monocyte/macrophages is more prominent in Hodgkin lymphoma than DLBCL. Blood. 2018;131(16):1809-1819. [DOI] [PMC free article] [PubMed] [Google Scholar]
- 19.Riches JC, Sangaralingam A, Chaplin T, et al. NK cells from CLL patients exhibit down-regulation of interferon response genes that can be reversed with lenalidomide. Blood. 2013;122(21):4131. [Google Scholar]
- 20.Dimopoulos MA, Lonial S, White D, et al. Elotuzumab, lenalidomide, and dexamethasone in RRMM: final overall survival results from the phase 3 randomized ELOQUENT-2 study. Blood Cancer J. 2020;10(9):91. [DOI] [PMC free article] [PubMed] [Google Scholar]
- 21.Dimopoulos MA, Dytfeld D, Grosicki S, et al. Elotuzumab plus pomalidomide and dexamethasone for multiple myeloma. N Engl J Med. 2018; 379(19):1811-1822. [DOI] [PubMed] [Google Scholar]
Associated Data
This section collects any data citations, data availability statements, or supplementary materials included in this article.


