

Abstract

We have explored the impact of electron-donating (methoxy) and electron-withdrawing (nitro) substituents on SalEen ligand based spin crossover (SCO) behavior of Fe(III) complexes. Thus, 3-X-substituted SalEen ligands were employed to prepare [Fe(3-X-SalEen)2]·NCSe, where X = OMe (1), H (2), and NO2 (3) (3-X-SalEen is the condensation product of 3-substituted salicylaldehyde and N-ethylethylenediamine). The characteristic spin transition temperature (T1/2) is shown to shift to a lower temperature when an electron-donating substituent (OMe) is used and to a higher temperature when an electron-withdrawing substituent (NO2) is used. We used experimental and theoretical methods to determine the reasons for this behavior. The solid-state magnetic data revealed the transition temperatures for complexes 1, 2, and 3 to be 219, 251, and 366 K, respectively. The solution-state magnetic data also support this trend in T1/2 values. UV–vis spectra analysis indicates that there is greater delocalization in the π-manifold of the ligand when the nitro group is the substituent. Theoretical studies through density functional theory methods suggest the methoxy substituent decreases the energy gap between the t2g and eg orbitals (explaining the lower T1/2 value), while the nitro substituent increases the energy gap between the t2g and eg orbitals and thus increases the T1/2 value.
Introduction
Accessing a bistable state through external stimuli is of huge scientific interest.1 Spin crossover (SCO) allows two different spin states to be accessed by external stimuli such as light, temperature, and pressure.2 Since the first report of this phenomenon in 1931 by Cambi et al.,3 there has been a huge amount of research in this area, most of which has focused on six-coordinated Fe(II) complexes4 and, to a lesser extent, six-coordinated Fe(III) complexes.5 Indeed, SCO and spin transition behavior have been studied in transition-metal complexes where the metal ion has an electronic configuration from d4 to d9.6 Most Fe(II) SCO complexes contain a N6 surrounding with a moderate ligand field environment7 while with Fe(III) SCO complexes contain mainly N4O2, N2O4, or N2O2S2 surroundings with moderate or slightly weaker ligand field environments compared to Fe(II) systems.8 While many Fe(II) complexes are not air-stable, the corresponding Fe(III) complexes are typically air-stable and therefore are of great interest.9 Among the many ligand systems that have been employed to study SCO in Fe(III) complexes, SalEen (Scheme 1a) stands out.10 While many studies employing the SalEen family of ligands are in vogue,11 some simple questions of interest remain. These include a systematic study that involves varying the substituents present in the vicinity of the coordinating manifold. Many other ligand systems such as bpp (2,6-di{pyrazol-1-yl}pyridine),12 X-pybox (X-substituted 2,6-bis(oxazolin-2-yl)pyridine),13 thio-pybox (2,6-bis(4,4-dimethyl-4,5-dihydrothiazol-2-yl)pyridine),14 bpypz (3,5-bis(pyridine-2-yl)pyrazolate),15 Trien (triethylenetetramine),16 Pytacn (1-[(4-R′-6-R-2-pyridyl)methyl]-4,7-dimethyl-1,4,7-triazacyclononane),17 and X-SalMeen (condensation product of X-substituted salicylaldehyde and N-methylethylenediamine)18 have been investigated in terms of the effect of the substituent on the SCO behavior. These types of studies are important as they allow an understanding of the influence of various substituents on the respective ligand system and can help achieve the desired transition temperature (T1/2). While many Fe(III) complexes with the SalEen ligand family are known, most studies involve varying the counteranions.19 There has been one study detailing the influence of the substituent (Me, Br, and OMe) on SCO properties of SalEen-ligand-based Fe(III) complexes (Scheme 1b).20 However, in this study, the substituents were present far away from the metal center.
Scheme 1. Schematic Representations of (a) the SalEen Ligand, (b) the 5-X-Substituted SalEen Ligand (X = Me, Br, and OMe), (c) the 3-X-Substituted SalEen Ligand (X = OMe, H, NO2), and (d) Complexes with 3-X-Substituted Ligands.

In order to understand the trends that could be observed by having electron-donating groups (EDG) and electron-withdrawing groups (EWG) as close substituents, we chose modified SalEen ligands (Scheme 1c). Additionally, to minimize the influence of the counteranion, we chose NCSe– as the counteranion. Our aim was to keep the counteranion unchanged while changing the substituents on the ligand to try to infer their influence on the SCO properties. Accordingly, we report the synthesis, structure, magnetism, and theoretical studies of [Fe(3-X-SalEen)2]·NCSe, where X = OMe (1), H (2), and NO2 (3) (Scheme 1d).
Materials and Methods
Caution! The complexes are synthesized using KNCSe as the source of NCSe–. It is a foul smelling compound and is classified as health hazard. Therefore, proper precaution should be taken while handling this chemical, and KNCSe should be used inside fume hoods.
2-Hydroxy-3-methoxybenzaldehyde, 2-hydroxybenzaldehyde, 2-hydroxy-3-nitrobenzaldehyde, N-ethylethylenediamine, Fe(SO4)2·7H2O, and KNCSe were purchased from Merck. The ligands (E)-2-(((2-(ethylamino)ethyl)imino)methyl)-6-methoxyphenol (HL1), (E)-2-(((2-(ethylamino)ethyl)imino)methyl)phenol (HL2), and (E)-2-(((2-(ethylamino)ethyl)imino)methyl)-6-nitrophenol (HL3) were prepared in situ by a Schiff base condensation reaction between 3-X-salicylaldehyde (where X = OMe, H, and NO2) and N-ethylethylenediamine. The metalation of the in situ-generated ligands was carried out per the reported procedure.20 FT-IR spectra (4000–400 cm–1) were recorded on KBr pellets with a Bruker–Alpha spectrometer. UV–vis spectra were acquired on a Jasco V-670 spectrometer using quartz cells with a path length of 1 cm. Elemental analyses were carried out on Elemental Microvario Cube elemental analyzer. Thermogravimetric analysis was performed on a PerkinElmer TGA 4000 instrument. Powder X-ray diffraction (PXRD) data were collected on a PANalytical EMPYREAN instrument using Cu Kα radiation. Magnetic measurements were performed on polycrystalline samples using Quantum Design MPMS-XL EverCool SQUID magnetometer between 2 and 380 K for dc applied fields ranging from −5 to 5 T for 1–3. Polycrystalline samples of 1–3 (14.40, 8.75, and 23.43 mg, respectively) were introduced in a polypropylene bag (2.8 × 0.75 × 0.02 cm) and subjected to measurements. Susceptibility versus temperature measurements were performed using 1000 and 10000 Oe dc fields. The temperature-dependent data were measured using variable sweep rates ranging from 1 to 5 K min–1.
The isothermal magnetization data were acquired at 2, 4, 5, and 6 K (Figure S1) for complexes 1–3.M versus H measurements were performed at 100 K to check for the presence of ferromagnetic or diamagnetic impurities, which were found to be absent for complexes 1–3 (Figure S2). M versus H/T data for complexes 1–3 are provided in Figure S3. The data were corrected for the diamagnetic contribution from the sample holder and for the ligand atoms using Pascal’s table.21
Synthesis of the Metal Complexes (1–3)
[Fe(L1)2]·NCSe (1)
[HL1 = (E)-2-(((2-(ethylamino)ethyl)imino)methyl)-6-methoxyphenol]. To a solution of N-ethylethylenediamine (88 mg, 1 mmol, 0.1 mL) in 10 mL of methanol was added 2-hydroxy-3-methoxybenzaldehyde (152 mg, 1.0 mmol) (solution A), and the solution was left to stir for 30 min. In another solution, Fe(SO4)2·7H2O (139 mg, 0.5 mmol) and KNCSe (144 mg, 1 mmol) were taken in 10 mL of methanol (solution B), and the solution was stirred for 30 min and filtered to remove K2SO4. After that, solution A was added to solution B dropwise, and the reaction mixture was stirred for another 30 min. The resulting mixture was filtered and kept for aerial oxidation and slow evaporation. Black crystals of complex 1 were obtained from the filtrate after two days. Yield: 74% (based on Fe). Elemental analysis Calcd. (%) for C25H34FeN5O4Se: C 49.76, N 11.61, H 5.68. Found: C 49.6, N 11.61, H 5.53. Selected IR data (KBr pellet. cm–1): 3435 ν(N–H, m), 2934 ν(C–Harom), 2064 ν(C≡N), 1617 ν(C=N), 1547 and 1438 ν(C=C), 1220 ν(C–O).
Following a similar synthetic method, complexes 2 and 3 were synthesized using 2-hydroxybenzaldehyde and 2-hydroxy-3-nitrobenzaldehyde, respectively. The details of these complexes are given in the following sections.
[Fe(L2)2]·NCSe (2)
[HL2 = (E)-2-(((2-(ethylamino)ethyl)imino)methyl)phenol]. Yield: 72% (based on Fe). Elemental analysis Calcd. (%) for C23H30FeN5O2Se: C 50.84, N 12.89, H 5.57. Found: C 51.02, N 12.9, H 5.46. Selected IR data (KBr pellet, cm–1): 3438 ν(N–H, m), 2947 ν(C–Harom), 2035 ν(C≡N), 1621 ν(C=N), 1530 and 1432 ν(C=C), 1147 ν(C–O).
[Fe(L3)2]·NCSe (3)
[HL3 = (E)-2-(((2-(ethylamino)ethyl)imino)methyl)-6-nitrophenol]. Yield: 65% (based on Fe). Elemental analysis Calcd. (%) for C23H28FeN7O6Se: C 43.62, N 15.48, H 4.46. Found: C 43.68, N 15.57, H 4.34. Selected IR data (KBr pellet, cm–1): 3442 ν(N–H, m), 3098 ν(C–Harom), 2038 ν(C≡N), 1634 ν(C=N), 1546 and 1433 ν(C=C), 1519 and 1360 ν(NO2).
Crystal Data Collection and Structure Determination
Single-crystal diffraction data were collected using a Rigaku XtaLAB X-ray diffractometer system equipped with a CCD area detector and operated at 30 W power (50 kV, 0.6 mA) to generate Mo Kα radiation (λ = 0.71073 Å) at 120, 250, 270, and 300 K. Data collection was performed using φ- and ω-scans. Olex222a was used as the graphical interface, and the structures were solved with the ShelXT(22b) structure solution program using intrinsic phasing. The models were refined with ShelXL(22c) with full-matrix least-squares minimization on F2. All non-hydrogen atoms were refined anisotropically.
CCDC nos are as follows: 2166212 (for 1, 120 K), 2166213 (for 2, 120 K), 2166214 (for 2, 270 K), 2166215 (for 3, 250 K), and 2166216 (for 3, 300 K). These crystallographic data can be obtained free of charge from the Cambridge Crystallographic Data Center via www.ccdc.cam.ac.uk/data_request/cif.
Hirshfield Surface Analysis
Crystal Explorer package ver. 17 was used for Hirshfeld surface and 2D fingerprint calculations. Crystal structures were imported from CIF files. Hirshfeld surfaces for all the complexes were generated using very high resolution and mapped with the dnorm function.23
Electron Paramagnetic Resonance (EPR) Studies
EPR spectra of all the complexes were recorded on a Bruker EMXplus instrument. Powder samples were taken for the measurement. To compare the temperature evolution of the EPR spectra, all other parameters were kept constant during the measurement. The X-band frequency (9.5 GHz) was used for the measurements.
Computational Details
All density functional calculations (DFT) were carried out with the Gaussian 16 (rev. B0.1)24 electronic structure package with a 10–8 convergence criterion for the density matrix elements using the latest triple-ζ basis set with polarization functions for all elements (def2-TZVP).25 The exchange-correlation functional B3LYP*,26 which was recently reported to be the most accurate one toward Fe(III) system in terms of spin-state energy gaps,27 was used for all system. The corresponding vibrational analysis was done for all optimized structures to ensure that they were minima along the potential energy surface. The transition temperatures (T1/2) were estimated using the thermochemistry quantities obtained in the vibrational analysis.
Results and Discussion
The synthesis of the Fe(III) complexes 1–3 (Scheme 1d) was accomplished according to the procedure described in the Materials and Methods. The ligands were generated in situ, and their metalation was carried out. Slow evaporation of the reaction mixture afforded single crystals that were used for crystallographic study as described below. The crystal data are summarized in Table 1.
Table 1. Crystallographic Data for Complexes 1–3.
| compound | 1 | 2 | 2 | 3 | 3 |
|---|---|---|---|---|---|
| temperature (K) | 120 K | 120 K | 270 K | 250 K | 300 K |
| formula | C25H34FeN5O4Se | C23H30FeN5O2Se | C23H30FeN5O2Se | C23H28FeN7O6Se | C23H28FeN7O6Se |
| M.W. (g mol–1) | 603.38 | 543.33 | 543.33 | 633.33 | 633.33 |
| crystal system | Triclinic | Monoclinic | Monoclinic | Monoclinic | Monoclinic |
| space group | P1 | P21/c | P21/c | P21/c | P21/c |
| a (Å) | 9.8509(4) | 9.89800(10) | 10.0722(11) | 16.2435(9) | 16.2845 |
| b (Å) | 10.8916(4) | 26.6523(4) | 27.006(3) | 9.8396(6) | 9.8560 |
| c (Å) | 25.5217(10) | 10.49430(10) | 10.5221(12) | 16.6193(12) | 16.6648 |
| α (°) | 80.995(3) | 90 | 90 | 90 | 90 |
| β (°) | 84.088(3) | 116.9730(10) | 117.135(6) | 93.164(12) | 93.039 |
| γ (°) | 72.508(4) | 90 | 90 | 90 | 90 |
| cell V (Å3) | 2574.91(18) | 2467.29(5) | 2547.1(5) | 2652.2(3) | 2670.94(19) |
| Z | 4 | 4 | 4 | 4 | 4 |
| reflections collected | 37276 | 20532 | 44472 | 20627 | 40210 |
| independent reflections (Rint) | 10909/0.0621 | 5051/0.0440 | 6394/0.0427 | 6123/0.0446 | 6423/0.0518 |
| restraints/parameters | 0/657 | 0/291 | 0/299 | 0/345 | 0/345 |
| goodness-of-fit | 1.003 | 0.949 | 1.060 | 1.041 | 1.048 |
| final R indices R1, wR2 (I > 2σ(I))a | 0.0436, 0.1033 | 0.0401, 0.0649 | 0.0443, 0.1184 | 0.0466, 0.1129 | 0.0687, 0.1735 |
| CCDC no. | 2166212 | 2166213 | 2166214 | 2166215 | 2166216 |
R1 = Σ|F0| – |Fc|/ Σ|F0| and wR2 = | Σw(|F0|2 – |Fc|2)|/ Σ|w(F0)2|1/2.
General Structural Details of 1–3
Prior to the discussion of the supramolecular structures of 1–3, the general features of the molecular structures of 1–3 are briefly indicated here. All the complexes contain six-coordinated Fe(III) in a N4O2 coordination environment, as seen in the representative example of 2 (Figure 1). The complexes are cationic in nature, and the NCSe– counteranion is present in the crystal lattice. The metric parameters in the immediate coordination environment are summarized in the caption of Figure 1. The basic molecular structures and the metric parameters are similar to those previously observed in other Fe–SalEen complexes10,11 (Table S1). Complex 1 contains two crystallographically independent molecules in the asymmetric unit.
Figure 1.

Molecular structure of 2. Hydrogen atoms were removed for clarity. Thermal ellipsoids are shown at 50% probability. Color coding is as follows: gray, C; blue, N; red, O; denim, Se; and orange, Fe. Metric parameters are as follows: Fe1–O1, 1.8824(13) Å; Fe1–O2, 1.8815(13) Å; Fe1–N1, 2.0496(16) Å; Fe1–N2, 1.9324(16) Å; Fe1–N3, 2.0535(15) Å; Fe1–N4, 1.9291(16) Å.
Supramolecular Structures
The supramolecular structures of 1–3 are discussed below. It is known that the magnetic properties in general and those specifically involved in SCO behavior are affected by intermolecular interactions. An assessment of the latter can be obtained by analyzing the supramolecular structures. We have also carried out Hirshfeld analysis (see below), which allows the quantification of the supramolecular interactions.
[Fe(L1)2]·NCSe (1)
The asymmetric unit of 1 is composed of two crystallographically independent molecules composed of two cationic units and two anionic units (Figure 2). There are several strong hydrogen bonding interactions (Table S2) in the asymmetric unit, including hydrogen bonds N5–H5···N10 (dD-A = 3.105(4) Å), N7–H7···N10 (dD-A = 3.271(4) Å), etc. Among the two cationic subunits, the cationic Fe1 unit is mostly connected to the selenium via hydrogen bonding, while the cationic Fe2 unit is bound to the nitrogen via hydrogen bonding (Figure S4).
Figure 2.

Asymmetric unit of 1 at 120 K. Except for a select few, hydrogen atoms were removed for clarity. Color coding is as follows: gray, C; blue, N; orange, Fe; and white, H.
According to the structural analysis, both the Fe centers in the asymmetric unit of 1 (Fe1 and Fe2) are present in very similar crystal field environments, as the distortion parameters have nearly the same values (Table S3). Bond distances of most of the complexes of the SalEen family of ligands are summarized in Table S1. By comparing the Fe–N and Fe–O distances found in these literature precedents, the spin state of the Fe(III) center can be understood. Both the Fe centers form P4AE (parallel fourfold aryl embrace)28 interactions with equivalent metal centers (Fe1–Fe1 and Fe2–Fe2), and these pairs are connected with each other via hydrogen bonding and other weak interactions along the crystallographic c-axis. The P4AE interaction of Fe1–Fe1 pair consists of one π···π interaction (centroid (C6–C11)···centroid (C6–C11), 3.468 Å), a pair of C–H···π interactions (C8–H8···centroid (C18–C23), 2.908 Å), and a pair of C–H···O interactions (C9–H9···O6, 2.601 Å) (Figure 3). The P4AE interaction of the Fe2–Fe2 pair consists of one π···π interaction (centroid (C30–C35)···centroid (C30–C35), 3.512 Å), a pair of C–H···π interactions (C32–H32···centroid (C42–C47), 2.859 Å,) and a pair of C–H···O interactions (C33–H33···O8, 2.622 Å) (Figure S5).
Figure 3.
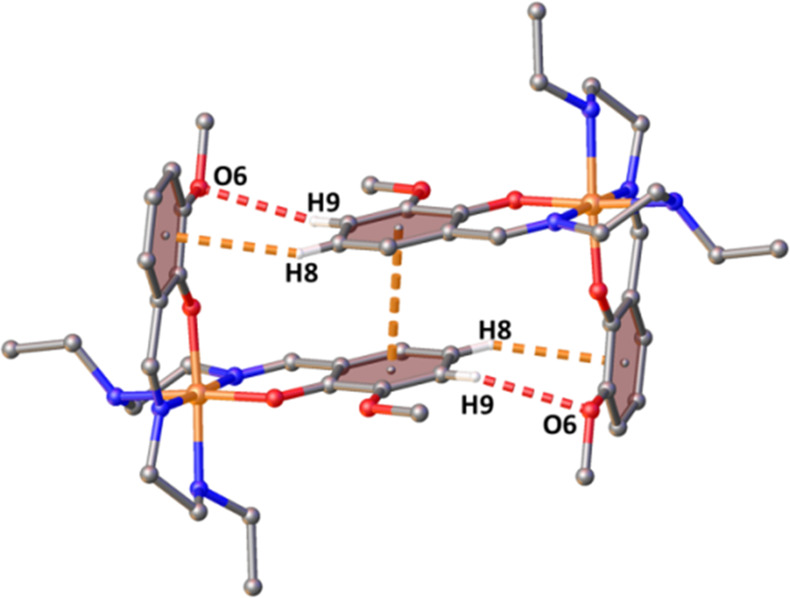
P4AE interaction of the Fe1 centers of complex 1.
Both the Fe centers are also connected to their equivalent centers via a pair of C–H···π interactions along the crystallographic a-axis. For Fe1 these interactions are C21–H21···centroid (C6–C11) (2.967 Å) and C13–H13A···centroid (C18–C23) (3.047 Å), and for Fe2 these interactions are C37–H37B···centroid (C42–C47) (2.899 Å) and C45–H45···centroid (C30–C35) (2.853 Å) (Figure 4). In this way, the dimeric unit bound via P4AE interactions extends to the crystallographic a-axis. The cationic units are bound with each other via cation–anion interactions along the crystallographic c-axis.
Figure 4.
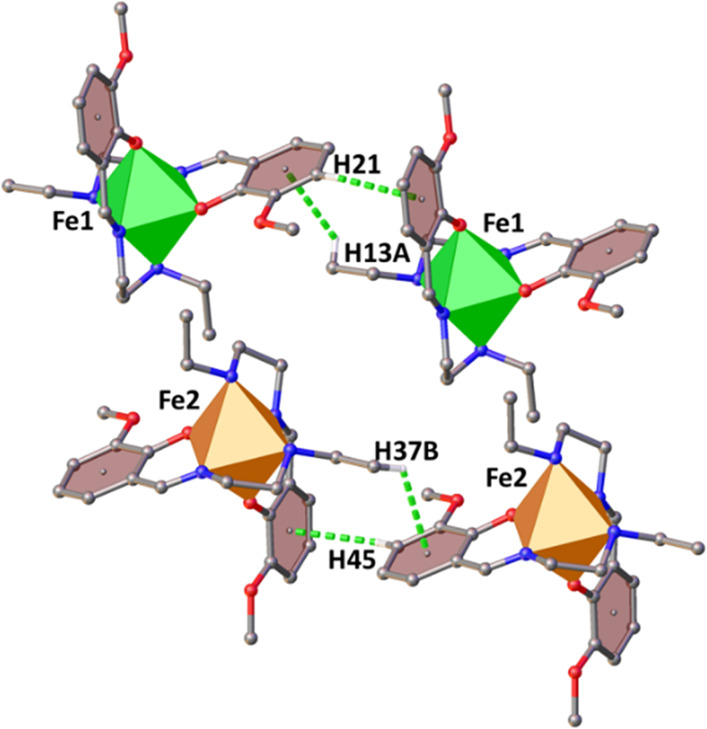
Weak interactions connecting the cationic units of 1.
Along the b-axis, the cations are connected via C–H···Se interactions through the anion (Figure S6). Thus, the overall packing of the molecules consists of a layer of alternating dimeric Fe1–Fe1 and Fe2–Fe2 units (Figure 5).
Figure 5.

Packing of complex 1. Green and orange polyhedra represent Fe1 and Fe2 centers, respectively.
[Fe(L2)2]·NCSe (2)
The molecule contains a hexacoordinated Fe(III) cation and a NCSe– anion in the asymmetric unit, which are bound together by hydrogen bonds (N1–H1···N5, dD-A = 2.9497(1) Å; N3–H3···N5, dD-A = 3.0133(1) Å) (Figure S7 and Table S4). The cationic unit of complex 2 forms a zigzag chain along the crystallographic c-axis. The basic unit of this 1D zigzag chain (Figure 6c) is formed by a dimeric unit via various weak interactions, including three C–H···π interactions (C4–H4B···centroid (C17–C22), 3.63267(4) Å; C5–H5···centroid (C17–C22), 3.09840(3) Å; and C13–H13B···centroid (C6–C11), 3.38053(3) Å) and two C–H···O interactions (C5–H5···O1, 2.906 Å; C11–H11···O1, 3.026 Å). The closest distance between the FeIII centers is 7.623 Å (Figure 6a). The 1D chains along the c-axis are further connected with each other via C–H···N (C15–H15A···N5, 2.679 Å; C4–H4A···N5, 2.805 Å) and C–H···Se (C2–H2B···Se1, 3.132 Å) interactions, which allow the propagation of the supramolecular architecture along the crystallographic b-axis (Figure S8). The cationic units connect along the a-axis via C–H···π interactions (C9–H9···centroid (C17–C22), 3.63267(4)to 3.386 Å; C20–H20···centroid (C6–C11), 2.970 Å (Figure 6b).
Figure 6.

(a) Interactions between the cations that leads to the formation of the 1D zigzag chain along the c-axis. (b) Interaction among the cation along the crystallographic a-axis. (c) Packing diagram of 2.
[Fe(L3)2]·NCSe (3)
The molecular structure of complex 3 is composed of a cationic unit and an anionic unit that are bound together by hydrogen bonding (C3–H14B···N7, dD-A = 3.294(6) Å). Additionally, there is a weak intramolecular hydrogen bonding present (C3–H3B···O5, dD-A = 3.762(5) Å) (Figure 7). Other hydrogen bonding interactions are listed in Tables S5 and S6. Along the b-axis, there are two types of strong interactions among the cationic units. There is a P4AE interaction consisting of one π···π interaction (centroid (C6–C11)···centroid (C6–C11), 3.576(2) Å), a pair of C–H···π interactions (C10–H10···centroid (C17–C22), 3.531 Å), and a pair of C9–H9···O5 (3.030 Å) interactions (Figure 8a). These P4AE units are further connected via C–H···π interactions (C12–H12C···centroid (C17–C22), 3.306 Å; C20–H20···centroid (C17–C22), 2.663 Å) (Figure 8b). These two types of interactions extend along the crystallographic b-axis, forming a close packing of the cations. Along the c-axis, the cationic units are further connected by C–H···O interactions (C-4-H4A···O6, 2.537 Å; C5–H5···O5, 2.506 Å; C11–H11···O5, 2.76 Å; C1–H1B···O3, 2.506 Å) with the nitro group in addition to C–H···π interactions (C3–H3A···centroid(C17–C22), 3.205 Å) (Figure S9).
Figure 7.
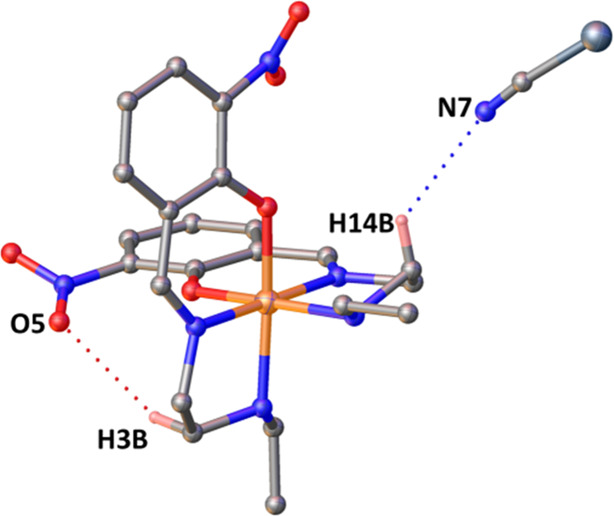
Molecular structure of 3. Color coding is as follows: gray, C; blue, N; red, O; orange, Fe; and denim, Se. Except for those involved in hydrogen bonding, hydrogen atoms were removed for clarity.
Figure 8.
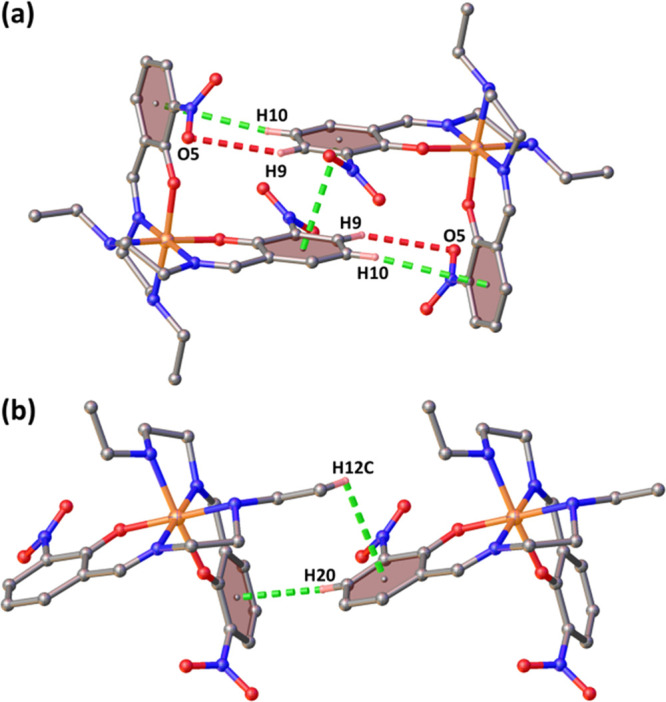
(a) P4AE interactions and (b) CH−π interactions along the b-axis for 3.
The packing consists of a zigzag arrangement of cations along the b-axis connected by a layer of anions along the crystallographic a-axis (Figure 9). Bond lengths and angles around the metal center and distortion parameters for 2 and 3 are given in Table S7.
Figure 9.

Packing diagram of 3.
Magnetic Susceptibility Measurements
Polycrystalline samples were taken for the magnetic measurements, and the phase purity of each sample was checked by PXRD (Figure S10). Magnetic measurements were performed using 1 and 10 kOe dc fields. All the complexes were found to be in low spin states in the low-temperature region from 2 to 100 K. 1 has an χMT value of 0.33 cm3 K mol–1 at 2 K and exhibits an abrupt spin transition centered at around 218 K, followed by a small hysteresis. A 4 K, wide hysteresis was observed at the scan rate of 3 K min–1 (Figure S11), where T1/2↑ = 220.5 and T1/2 = 216.5 K. At 380 K, the χMT value is 4.17 cm3 K mol–1. This behavior is very similar to that found in [FeIII(3-OMe-SalEen)2]PF6, where a hysteretic spin crossover with T1/2↑ = 164 and T1/2 = 160 K was observed (Figure S12).10b The difference between the magnetic profile of the reported complex and that of 1 is due to the change in the counteranion. In the current instance, the use of the NCSe– counteranion leads to a shift in the hysteresis loop toward a higher temperature compared to the reported complex.
Complex 2 shows a gradual spin crossover at a higher temperature than complex 1. The T1/2 value is 251 K for complex 2. At 380 K, the χMT value of complex 2 is 3.914 cm3 K mol–1, which indicates a 91% conversion from the low-spin state to the high-spin state (Figure 10). For, 3 SCO is less gradual as compared to 2 and incomplete in nature, as at the highest temperature (400 K) the χMT value is only 3.116 cm3 K mol–1, which indicates a conversion of 72% to the high-spin state. All the χMT versus T data were fit to the ideal solution model (eq 1) (for complex 1, data from only one scan (heating) were considered for fitting), and the thermodynamic parameters extracted are provided in Table 2. From the magnetic data, it is clear that the T1/2 temperature shifts at higher temperatures as we go from 1 to 3.
 |
1 |
Figure 10.

χMT vs T data for complexes 1 (green), 2 (red), and 3 (blue). The red lines indicate the susceptibility data fit using the regular solution model of SCO.
Table 2. Thermodynamic Parameters Extracted from the χMT vs T Fitting of the solid state magnetic susceptibility data.
| complexes | T1/2 (K) | ΔH (kJ mol–1) | ΔS (J mol–1 K–1) |
|---|---|---|---|
| 1 | 219 | 20.06 | 91.66 |
| 2 | 251 | 8.82 | 35.16 |
| 3 | 366 | 20.07 | 54.85 |
Solution-State Magnetic Data
Solution-state magnetic data are important for evaluating the actual effect of the ligand field strength on the SCO temperature, as in the solid state intermolecular interactions (such as hydrogen bonding, π···π stacking, etc.) can influence the local coordination environment around the metal center, which can in turn impact the ligand field strength. Additionally, cooperativity due to various solid-state interactions is absent in the solution; thus, the molecular property can be determined more exclusively. For this purpose, we used a coaxial double-walled NMR tube where the inner tube contained only the solvent, and the outer pocket contained the paramagnetic complex solution. CDCl3 was used for the experiment, and 5 × 10⁻³ mol L–1 samples of complexes 1–3 were investigated. Variable-temperature NMR data were collected, and the frequency difference (Δν, Hz) between the reference peak in the pure solvent and the solution containing the paramagnetic compound was converted into the magnetic susceptibility (χ) according to the eq 2.
| 2 |
Here χ0 is the gram susceptibility (−59.30 × 10⁻⁶ cm3 mol–1) of pure CDCl3, ν is the operating radio frequency, and m is the concentration of paramagnetic solution. The magnetic susceptibility data (Figure 11) were fit with a regular solution model of SCO (eq 1), and the thermodynamic parameters extracted from the fitting data are given in Table 3. These data are in good agreement with the values of ΔH and ΔS reported in the literature.11,20 The T1/2 values for 1, 2 and 3, are 241, 277, and 318 K, respectively, indicating that the transition temperature increases as we go from 1 to 3. The linear trend of the susceptibility plot is comparable to liquid state magnetic data of other similar complexes.18,20,29
Figure 11.

Magnetic susceptibility data obtained via NMR for complexes 1–3 in the solution state. The red lines indicate the susceptibility fit using the ideal solution model of SCO.
Table 3. Thermodynamic Parameters Extracted from the χMT vs T Fitting of the Solution-State Magnetic Susceptibility Data.
| complexes | T1/2 (K) | ΔH (kJ mol–1) | ΔS (J mol–1 K–1) |
|---|---|---|---|
| 1 | 241 | 8.44 | 35.02 |
| 2 | 277 | 16.22 | 58.61 |
| 3 | 318 | 12.70 | 39.93 |
EPR Measurements
For a low-spin Fe(III) complex, there is only one unpaired electron (S = 1/2); thus, the compound should exhibit only one signal. However, the signal can be split into two signals if axial distortion is present and three or more signals if rhombic distortion is present. The spin Hamiltonian can be expressed as follows (eq 3):
| 3 |
where gii = gi (i = x, y, z) is the diagonal component of the g-tensor along the principal axis. For the high-spin Fe(III) center, there are five unpaired electrons (S = 5/2). Due to spin–orbit coupling and the structural distortions, there are three spin doublets (Kramers doublets ±5/2, ±3/2, and ±1/2) among which the spin transition can occur. The Hamiltonian used to describe the Fe(III) high-spin system is given in eq 4, which describes the combined effect of the rhombic zfs (E), the axial zfs (D), and the Zeeman interaction on the 6A electronic term.30 The EPR spectrum of Fe(III) in a high-spin state depends on the E/D ratio.
| 4 |
To evaluate the g-values of low-spin complexes, simple spectrum software was used.31 For 1 at a lower temperature (150 K), a rhombic spectrum with g-values of gx = 1.85, gy = 2.06, and gz = 2.1 was observed (Figure 12a). This is typical for low-spin Fe(III) with high rhombic distortion.32 At a higher temperature (300 K), the spectrum was broadened and looked completely different, which is indicative of a high-spin Fe(III) center caused by SCO. At 150 K, 2 again exhibits a rhombic spectrum with g-values of gx = 1.97, gy = 1.92, and gz = 1.8 after simulation (Figure 12b), consistent with Fe(III) with rhombic distortion in the low-spin state.32 The anisotropy vanishes at room temperature (300 K), resulting in a featureless broad signal around g ∼ 2.0 that is indicative of spin-state conversion from the low-spin state to the high-spin state. Additionally, a new peak appears around g ∼ 4, which corresponds to the Fe(III) S = 5/2 system with a small degree of rhombicity. At 380 K, the spectrum remain similar to that observed at 300 K. Complex 3 exhibits an anisotropic spectrum at the lowest temperature (150 K), with gx = 2.025, gy = 2.000, and gz = 1.99 (Figure 12c).32 At 300 K, the peak around g ∼ 2 becomes isotropic and another peak appears around g ∼ 4.000. This indicates the conversion of the spin state from the low-spin state to the high-spin state. Moreover, at 380 K, the spectrum changes further with the appearance of a new peak around g ∼ 9, confirming that the spin-state conversion in this instance is a high-temperature process.20 The separate observation of low-spin and high-spin EPR signals in the same spectrum is an indication that the frequency of EPR spectroscopy (∼1010 s–1 for the X-band) is much faster than the rate of spin-state conversion.
Figure 12.

EPR spectra of complexes (a) 1, (b) 2, and (c) 3.
Hirshfeld Analysis
To quantify the interactions present in the crystal structures, Hirshfield analysis was adopted. It was found that there were different numbers of C–H···O and C–H···π interactions present in the complexes. C–H···O interactions are more common in complexes 1 and 3 as compared to 2 due to the presence of methoxy and nitro groups, respectively (Figure 13). On the other hand, C–H···π interactions are more common in 2 as compared to 1 and 3. As C–H···O interactions exert a strong influence, 1 and 3 show a higher degree of cooperativity. Additionally, 1 and 3 have a higher percentage of C–C interactions, which is indicative of π···π interactions. Indeed, on the basis of the structural analysis, we found that P4AE interactions were present in 1 and 3; thus, 1 and 3 exhibit more cooperative spin-state switching than 2.
Figure 13.

Hirshfeld surface analysis results depicting various weak interactions present in complexes 1–3.
UV–vis Spectroscopy
The UV–vis spectra of 1-3 were recorded in methanol (Figure 14) using a concentration of 50 × 10–6 mol L–1. Two or more peaks can be observed for all the three complexes, one ranging from 300 to 450 nm and the others ranging from 450 to 800 nm. The peak below 400 nm is due to the π–π* transition of the ligand.20,33 Complex 2, which has no substituent, exhibits a λmax of 331 nm for the π–π* transition. In 1, the mesomeric effect of the methoxy group (OMe) reduces the π–π* energy gap, leading to a bathochromic effect (λmax = 354 nm). In 3, there is stronger delocalization of the π-clouds to the nitro group due to the presence of the nitro group (NO2), and thus the peak exhibits a red shift (λmax = 366 nm).34 The shifting in the absorption maxima of these complexes confirms the effect of ligand substituents.
Figure 14.

UV–vis spectra of complexes 1–3.
Absorption bands in the range 450–800 nm are assigned to ligand-to-metal charge transfer (LMCT) bands.35 Spectroscopic analysis of similar [Fe(5-X-SalEen)2]+ complexes revealed that the low-energy band (650 nm < λmax < 800 nm) is due to low-spin species and the high-energy band (450 nm < λmax < 650 nm) is due to the high-spin species.20 If we focus on absorption bands in this region, then we will find out that for complex 1 there is only one peak in the region (λ = 575 nm), which corresponds to high-spin state, and for complex 2 there are two peaks (λ1 = 527 nm and λ2 = 660 nm), where λ1 corresponds to the high-spin state and λ2 corresponds to the low-spin state. Similarly for complex 3, there are two clearly visible peaks (λ1 = 512 nm and λ2 = 624 nm) corresponding to different spin states. Based on these observations, it can be said that at room temperature complex 1 is fully in the high-spin state and complexes 2 and 3 have both spin states. This is also supported by the solution-state magnetic data (Table 3), which provide the T1/2 values of 241, 277, and 318 K for 1–3, respectively.
DFT Calculations
Electronic structure calculations were done on 1–3 in order to gain insight into the correlation between ligand functionalization and the experimentally observed shifts in the T1/2 values. Optimized geometries of all the complexes are given in Table S8, and optimized molecules are shown in Figure S13. These calculations show that spin-state switching occurs between the low- (S = 1/2) and high-spin (S = 5/2) states, as the intermediate spin-state (S = 3/2) is inaccessible at the temperature used for the experiments. The energy difference between the high- and low-spin states is in the usual range for SCO (between 4 and 6 kcal mol–1) (Figure 15a).36 The optimized geometries are also in good agreement with the experimental bond lengths (Table S9) as well as other Fe(III) SCO complexes with the same type of tridentate ligand (Tables S1, S3, and S7). The computed T1/2 values correctly reproduce the experimentally observed trend T1/2(1) < T1/2(2) < T1/2(3) (Table 4). The electron-donor (EDG) or electron-withdrawing (EWG) character of the R substituent in the ligand can be quantified using the Hammett constants.37 In fact, using both σp and σp+ values, one can obtain linear correlations between T1/2 and the EWG or EDG character of the R group, a trend that is properly reproduced by the electronic structure calculations (Figure 15b). Further insight into this behavior can be obtained by analyzing the underlying electronic structure in terms of the relevant d-orbital-based molecular orbital diagram (Figure 16). As can be seen from the Figure, 1 has R = OMe, one of the strongest EDGs. This substituent localizes the π-type orbital on the donor atoms of the ligand, thus increasing the antibonding character of the frontier molecular orbitals with the dxz/dyz pair of orbitals. This raises the energy of this pair of d-orbital-based MOs, thus reducing the energy gap between the formerly nonbonding orbitals and the σ-antibonding orbitals dz2 and dx2–y2. Replacing the R group with a −H or −NO2 group (among the most EWGs) has quite the opposite effect: it removes the p-contribution on the donor atoms of the ligand, thus reducing the antibonding character of the dxz/dyz pair of orbitals. Due to the loss of antibonding character, this pair of orbitals decreases in energy and splitting becomes larger in the d-orbital MOs, leading to a higher value for T1/2.
Figure 15.

(a) Energies of different spin states of the Fe(III) center present in complexes 1–3. (b) Correlation between the experimental (black) and computed (blue) T1/2 and Hammett σp parameters.
Table 4. Theoretical and Experimental (Solid-State) Thermodynamic Parameters for Complexes 1–3.
| complexes | ΔH (kJ mol–1) (exp.) | ΔH (kJ mol–1) (calc.) | ΔS (J mol–1 K–1) (exp.) | ΔS (J mol–1 K–1) (calc.) | T1/2 (K) (exp.) | T1/2 (K) (calc.) |
|---|---|---|---|---|---|---|
| 1 | 20.06 | 12.744 | 91.66 | 60.183 | 219 | 211 |
| 2 | 8.82 | 19.707 | 35.16 | 61.367 | 251 | 321 |
| 3 | 20.07 | 19.949 | 54.85 | 60.467 | 366 | 329 |
Figure 16.

Relevant d-orbital-based MOs for complexes 1–3 showing the decrease in the antibonding character of the dxz/dyz pair of orbitals.
Thermogravimetric Analysis
Thermogravimetric measurements were carried out for 1–3, and the data are provided in Figure S14. It was found that 3 is thermally very stable, with a decomposition temperature of 448 K.10,11,19,20,33 This type of thermally stable SCO molecule with a high transition temperature (366 K) can be used to prepare magnetic switches and devices for high-temperature applications.
Conclusions
In this work, we have analyzed the effect of an electron-donating group (methoxy) and an electron-withdrawing group (nitro) on the spin-state switching temperatures of SalEen-based Fe(III) complexes. Experimental measurements (magnetic and EPR) indicate that the SCO temperature increases when an electron-withdrawing group (NO2 group in complex 3) is employed and the transition temperature decreases when an electron-donating group (OMe group in complex 1) is employed. This experimental observation is supported by DFT calculations, which suggest that electron-withdrawing groups stabilize the t2g set of orbitals more than electron-donating groups, so the gap between the t2g and eg sets of orbitals is higher in complexes with an EWG. Therefore, compared to the complex with no substituent, the complex with a NO2 substituent has a higher SCO temperature, and the OMe-substituted complex has a lower SCO temperature. This observation for SalEen-type complexes can be readily adapted to other types of ligand systems to tune the SCO behavior of complexes.
Acknowledgments
V.C. is grateful to the DST for a J. C. Bose fellowship. and B.D. is thankful to the Science and Engineering Research Board, New Delhi, India (file number PDF/2020/002670), for the award of a National Postdoctoral Fellowship. A.M. is thankful to the Council of Scientific and Industrial Research (CSIR), Governemnt of India (project no. 01(3031)/21/EMR-II), and the Solid State and Structural Chemistry Unit at the Indian Institute of Science (IISc) Bangalore, India, for providing the SQUID Magnetometer facility. J.C. thanks the Spanish MICINN for a Ramón y Cajal research contract (RYC2018-024692-I) and a Spanish MICINN research grant (PID2020-115165GB-I00). E.C. is thankful to Spanish Ministerio de Ciencia e Innovación for project (PGC2018 102052–B-C21) MCIN/AEI/10.13039/501100011033/FEDER “Una manera de hacer Europa”, Junta de Andalucía (FQM-195), the projects I+D+i Junta de Andalucía (P20_00692) and FEDER Junta de Andalucía (A-FQM-172-UGR18), and the University of Granada.
Supporting Information Available
The Supporting Information is available free of charge at https://pubs.acs.org/doi/10.1021/acsomega.2c05380.
Accession Codes
CCDC 2166212–2166216 contain the supplementary crystallographic data for this paper. These data can be obtained free of charge via www.ccdc.cam.ac.uk/data_request/cif, or by emailing data_request@ccdc.cam.ac.uk, or by contacting The Cambridge Crystallographic Data Centre, 12 Union Road, Cambridge CB2 1EZ, UK; fax: + 44 1223 336033.
The authors declare no competing financial interest.
Supplementary Material
References
- Malavolti L.; Lanzilotto V.; Ninova S.; Poggini L.; Cimatti I.; Cortigiani B.; Margheriti L.; Chiappe D.; Otero E.; Sainctavit P.; Totti F.; Cornia A.; Mannini M.; Sessoli R. Magnetic Bistability in a Submonolayer of Sublimated Fe4 Single-Molecule Magnets. Nano Lett. 2015, 15 (1), 535–541. 10.1021/nl503925h. [DOI] [PubMed] [Google Scholar]
- a Šalitros I.; Madhu N. T.; Boc a R.; Pavlik J.; Ruben M. Room-temperature spin-transition iron compounds. Monatsh. Chem. 2009, 140, 695–733. 10.1007/s00706-009-0128-4. [DOI] [Google Scholar]; b Phan H.; Benjamin S. M.; Steven E.; Brooks J. S.; Shatruk M. Photomagnetic Response in Highly Conductive Iron(II) Spin-Crossover Complexes with TCNQ Radicals. Angew. Chem., Int. Ed. 2015, 54, 823–827. 10.1002/anie.201408680. [DOI] [PubMed] [Google Scholar]; c Shepherd H. J.; Rosa P.; Vendier L.; Casati N.; Letard J.-F.; Bousseksou A.; Guionneau P.; Molnar G. High-pressure spin-crossover in a dinuclear Fe(II) complex. Phys. Chem. Chem. Phys. 2012, 14, 5265–5271. 10.1039/c2cp23940j. [DOI] [PubMed] [Google Scholar]
- a Cambi L.; Cagnasso A. Iron dithiocarbamates and nitroso dithiocarbamates. Atti Accad. Naz. Lincei, Cl. Sci. Fis., Mat. Nat., Rend. 1931, 13, 809–813. [Google Scholar]; b Cambi L.; Szego L. Über die magnetische Susceptibilität der komplexen Verbindungen. Ber., Dtsch. Chem. Ges. 1931, 64, 2591–2598. 10.1002/cber.19310641002. [DOI] [Google Scholar]
- a Feltham H. L. C.; Barltrop A. S.; Brooker S. Spin crossover in iron(II) complexes of 3,4,5-trisubstituted-1,2,4-triazole (Rdpt), 3,5-di-substituted-1,2,4-triazolate (dpt–), and related ligands. Coord. Chem. Rev. 2017, 344, 26–53. 10.1016/j.ccr.2016.10.006. [DOI] [Google Scholar]; b Kulmaczewski R.; Olguín J.; Kitchen J. A.; Feltham H. L. C.; Jameson G. N. L.; Tallon J. L.; Brooker S. Remarkable Scan Rate Dependence for a Highly Constrained Dinuclear Iron(II) Spin Crossover Complex with a Wide Thermal Hysteresis Loop. J. Am. Chem. Soc. 2014, 136, 878–881. 10.1021/ja411563x. [DOI] [PubMed] [Google Scholar]; c Shatruk M.; Phan H.; Chrisostomo B. A.; Suleimenova A. Symmetry-breaking structural phase transitions in spin crossover complexes. Coord. Chem. Rev. 2015, 289–290, 62–73. 10.1016/j.ccr.2014.09.018. [DOI] [Google Scholar]; d Kershaw Cook L. J.; Mohammed R.; Sherborne G.; Roberts T. D.; Alvarez S.; Halcrow M. A. Spin state behavior of iron(II)/dipyrazolylpyridine complexes. New insights from crystallographic and solution measurements. Coord. Chem. Rev. 2015, 289–290, 2–12. 10.1016/j.ccr.2014.08.006. [DOI] [Google Scholar]
- a Nihei M.; Shiga T.; Maeda Y.; Oshio H. Spin crossover iron(III) complexes. Coord. Chem. Rev. 2007, 251, 2606–2621. 10.1016/j.ccr.2007.08.007. [DOI] [Google Scholar]; b Phonsri W.; Harding D. J.; Harding P.; Murray K. S.; Moubaraki B.; Gass I. A.; Cashion J. D.; Jameson G. N. L.; Adams H. Stepped spin crossover in Fe(III) halogen substituted quinolylsalicylaldimine complexes. Dalton Trans. 2014, 43, 17509–17518. 10.1039/C4DT01701C. [DOI] [PubMed] [Google Scholar]; c Fitzpatrick A. J.; Martinho P. N.; Gildea B. J.; Holbrey J. D.; Morgan G. G. Robust Room Temperature Hysteresis in an FeIII Spin Crossover Metallomesogen. Eur. J. Inorg. Chem. 2016, 2016, 2025–2029. 10.1002/ejic.201501335. [DOI] [Google Scholar]
- a Ma H.; Petersen J. L.; Young V. G.; Yee G. T.; Jensen M. P. Solid-State Spin Crossover of Ni(II) in a Bioinspired N3S2 Ligand Field. J. Am. Chem. Soc. 2011, 133 (15), 5644–5647. 10.1021/ja110890v. [DOI] [PubMed] [Google Scholar]; b Hayami S.; Komatsu Y.; Shimizu T.; Kamihata H.; Lee Y. H. Spin-crossover in cobalt(II) compounds containing terpyridine and its derivatives. Coord. Chem. Rev. 2011, 255 (17), 1981–1990. 10.1016/j.ccr.2011.05.016. [DOI] [Google Scholar]; c Chen Y.; Cao F.; Wei R.-M.; Zhang Y.; Zhang Y.-Q.; Song Y. Spin-crossover phenomena of the mononuclear MnIII complex tuned by metal dithiolene counteranions. Dalton Trans. 2014, 43 (9), 3783–3791. 10.1039/C3DT53173B. [DOI] [PubMed] [Google Scholar]; d Halepoto D. M.; Holt D. G. L.; Larkworthy L. F.; Leigh G. J.; Povey D. C.; Smith G. W. Spin crossover in chromium(II) complexes and the crystal and molecular structure of the high spin form of bis[1,2-bis(diethylphosphino)ethane]di-iodochromium(II). J. Chem. Soc., Chem. Commun. 1989, 18, 1322–1323. 10.1039/c39890001322. [DOI] [Google Scholar]; e Rey P.; Ovcharenko V. I.. Copper(II) Nitroxide Molecular Spin-Transition Complexes. In Magnetism: Molecules to Materials, Vol. 4; Miller J. S., Drillon M., Eds.; Wiley-VCH: Weinheim, Germany, 2001; pp 41–63. 10.1002/9783527620548.ch2c [DOI]
- a Olguín J.; Brooker S. Spin crossover active iron(II) complexes of selected pyrazole-pyridine/pyrazine ligands. Coord. Chem. Rev. 2011, 255 (1), 203–240. 10.1016/j.ccr.2010.08.002. [DOI] [Google Scholar]; b Hogue R. W.; Singh S.; Brooker S. Spin crossover in discrete polynuclear iron(ii) complexes. Chem. Soc. Rev. 2018, 47 (19), 7303–7338. 10.1039/C7CS00835J. [DOI] [PubMed] [Google Scholar]
- a Harding D. J.; Harding P.; Phonsri W. Spin crossover in iron(III) complexes. Coord. Chem. Rev. 2016, 313, 38–61. 10.1016/j.ccr.2016.01.006. [DOI] [Google Scholar]; b Takahashi K.; Kawamukai K.; Okai M.; Mochida T.; Sakurai T.; Ohta H.; Yamamoto T.; Einaga Y.; Shiota Y.; Yoshizawa K. A New Family of Anionic FeIII Spin Crossover Complexes Featuring a Weak-Field N2O4 Coordination Octahedron. Chem. Eur. J. 2016, 22 (4), 1253–1257. 10.1002/chem.201504883. [DOI] [PubMed] [Google Scholar]; c Spitsyna N. G.; Blagov M. A.; Lazarenko V. A.; Zorina L. V.; Vasiliev A. N.; Krapivin V. B.; Svetogorov R. D.; Maximova O. V.; Simonov S. V.; Yagubskii E. B. Spin-crossover behavior of neutral iron(III) complexes with salicylaldehyde thio-, seleno- and semicarbazone ligands: experiment and theoretical analysis. Dalton Trans. 2019, 48 (25), 9328–9336. 10.1039/C9DT01404G. [DOI] [PubMed] [Google Scholar]
- a Nemec I.; Herchel R.; Boca R.; Travnicek Z.; Svoboda I.; Fuess H.; Linert W. Tuning of spin crossover behaviour in iron(III) complexes involving pentadentate Schiff bases and pseudohalides. Dalton Trans. 2011, 40, 10090–10099. 10.1039/c1dt10696a. [DOI] [PubMed] [Google Scholar]; b Nemec I.; Herchel R.; Travnicek Z. The relationship between the strength of hydrogen bonding and spin crossover behaviour in a series of iron(III) Schiff base complexes. Dalton Trans. 2015, 44, 4474–4484. 10.1039/C4DT03400G. [DOI] [PubMed] [Google Scholar]; c Harding D. J.; Phonsri W.; Harding P.; Murray K. S.; Moubaraki B.; Jameson G. N. L. Abrupt two-step and symmetry breaking spin crossover in an iron(III) complex: an exceptionally wide [LS-HS] plateau. Dalton Trans. 2015, 44, 15079–15082. 10.1039/C4DT03184A. [DOI] [PubMed] [Google Scholar]
- a Sheu C.-F.; Chen S.-M.; Lee G.-H.; Liu Y.-H.; Wen Y.-S.; Lee J.-J.; Chuang Y.-C.; Wang Y. Structure and Magnetism of the Iron(III) Spin-Crossover Complex [FeIII{N-ethyl-N-(2-aminoethyl)salicylaldiminate}2]ClO4. Eur. J. Inorg. Chem. 2013, 2013 (5–6), 894–901. 10.1002/ejic.201201067. [DOI] [Google Scholar]; b Tissot A.; Bertoni R.; Collet E.; Toupet L.; Boillot M.-L. The cooperative spin-state transition of an iron(iii) compound [FeIII(3-MeO-SalEen)2]PF6: thermal- vs. ultra-fast photo-switching. J. Mater. Chem. 2011, 21 (45), 18347–18353. 10.1039/c1jm14163e. [DOI] [Google Scholar]; c Martinho P. N.; Vicente A. I.; Realista S.; Saraiva M. S.; Melato A. I.; Brandão P.; Ferreira L. P.; Carvalho M. d. D. Solution and solid state properties of Fe(III) complexes bearing N-ethyl-N-(2-aminoethyl)salicylaldiminate ligands. J. Organomet. Chem. 2014, 760, 48–54. 10.1016/j.jorganchem.2013.12.028. [DOI] [Google Scholar]; d Hayami S.; Miyazaki S.; Yamamoto M.; Hiki K.; Motokawa N.; Shuto A.; Inoue K.; Shinmyozu T.; Maeda Y. Spin-Crossover Behaviors of Iron(III) Compounds with Strong Intermolecular Interactions. Bull. Chem. Soc. Jpn. 2006, 79 (3), 442–450. 10.1246/bcsj.79.442. [DOI] [Google Scholar]
- a Haddad M. S.; Lynch M. W.; Federer W. D.; Hendrickson D. N. Spin-crossover ferric complexes: curiosities observed for unperturbed solids. Inorg. Chem. 1981, 20 (1), 123–131. 10.1021/ic50215a028. [DOI] [Google Scholar]; b Haddad M. S.; Federer W. D.; Lynch M. W.; Hendrickson D. N. Spin-crossover ferric complexes: unusual effects of grinding and doping solids. Inorg. Chem. 1981, 20 (1), 131–139. 10.1021/ic50215a029. [DOI] [Google Scholar]; c Faulmann C.; Chahine J.; Valade L.; Chastanet G.; Létard J.-F.; de Caro D. Photomagnetic Studies of Spin-Crossover- and Photochromic-Based Complexes. Eur. J. Inorg. Chem. 2013, 2013 (5–6), 1058–1067. 10.1002/ejic.201201328. [DOI] [Google Scholar]; d Sorai M.; Burriel R.; Westrum E. F.; Hendrickson D. N. Mechanochemical Effect in the Iron(III) Spin Crossover Complex [Fe(3-MeO-salenEt)2]PF6 as Studied by Heat Capacity Calorimetry. J. Phys. Chem. B 2008, 112 (14), 4344–4350. 10.1021/jp7101989. [DOI] [PubMed] [Google Scholar]; e Faulmann C.; Jacob K.; Dorbes S.; Lampert S.; Malfant I.; Doublet M.-L.; Valade L.; Real J. A. Electrical Conductivity and Spin Crossover: A New Achievement with a Metal Bis Dithiolene Complex. Inorg. Chem. 2007, 46 (21), 8548–8559. 10.1021/ic062461c. [DOI] [PubMed] [Google Scholar]
- Kershaw Cook L. J.; Kulmaczewski R.; Mohammed R.; Dudley S.; Barrett S. A.; Little M. A.; Deeth R. J.; Halcrow M. A. A Unified Treatment of the Relationship Between Ligand Substituents and Spin State in a Family of Iron(II) Complexes. Angew. Chem., Int. Ed. 2016, 55 (13), 4327–4331. 10.1002/anie.201600165. [DOI] [PMC free article] [PubMed] [Google Scholar]
- Kimura A.; Ishida T. Pybox-Iron(II) Spin-Crossover Complexes with Substituent Effects from the 4-Position of the Pyridine Ring (Pybox = 2,6-Bis(oxazolin-2-yl)pyridine). Inorganics 2017, 5 (3), 52. 10.3390/inorganics5030052. [DOI] [Google Scholar]
- Liang H.-C.; Pan Y.; Zhu H.-L.; Meng Y.-S.; Liu C.-H.; Liu T.; Zhu Y.-Y. The substituent effect on the spin-crossover behaviour in a series of mononuclear Fe(II) complexes from thio-pybox ligands. Inorg. Chem. Front. 2022, 9 (10), 2343–2352. 10.1039/D2QI00208F. [DOI] [Google Scholar]
- Létard J.-F.; Carbonera C.; Real J. A.; Kawata S.; Kaizaki S. Photomagnetism of a Series of Dinuclear Iron(II) Complexes. Chem. Eur. J. 2009, 15 (16), 4146–4155. 10.1002/chem.200802171. [DOI] [PubMed] [Google Scholar]
- Tweedle M. F.; Wilson L. J. Variable spin iron(III) chelates with hexadentate ligands derived from triethylenetetramine and various salicylaldehydes. Synthesis, characterization, and solution state studies of a new 2T ⇋ 6A spin equilibrium system. J. Am. Chem. Soc. 1976, 98 (16), 4824–4834. 10.1021/ja00432a023. [DOI] [Google Scholar]
- Prat I.; Company A.; Corona T.; Parella T.; Ribas X.; Costas M. Assessing the Impact of Electronic and Steric Tuning of the Ligand in the Spin State and Catalytic Oxidation Ability of the FeII(Pytacn) Family of Complexes. Inorg. Chem. 2013, 52 (16), 9229–9244. 10.1021/ic4004033. [DOI] [PubMed] [Google Scholar]
- Petty R. H.; Dose E. V.; Tweedle M. F.; Wilson L. J. Bis(N-methylethylenediaminesalicylaldiminato)iron(III) complexes. Magnetic, Moessbauer, and intersystem crossing rate studies in the solid and solution states for a new (S = 1/2) ⇆ (S = 5/2) spin-equilibrium case. Inorg. Chem. 1978, 17 (4), 1064–1071. 10.1021/ic50182a053. [DOI] [Google Scholar]
- a Ivanova T. A.; Ovchinnikov I. V.; Turanov A. N. Influence of the outersphere anion on the properties of the spin transition in Fe(4-OCH3-SalEen)2Y (Y = PF6, NO3). Phys. Solid State 2007, 49 (11), 2132–2137. 10.1134/S1063783407110194. [DOI] [Google Scholar]; b Haddad M. S.; Federer W. D.; Lynch M. W.; Hendrickson D. N. An explanation of unusual properties of spin-crossover ferric complexes. J. Am. Chem. Soc. 1980, 102 (4), 1468–1470. 10.1021/ja00524a065. [DOI] [Google Scholar]; c Tissot A.; Fertey P.; Guillot R.; Briois V.; Boillot M.-L. Structural, Magnetic, and Vibrational Investigations of FeIII Spin-Crossover Compounds [Fe(4-MeO-SalEen)2]X with X = NO3– and PF6–. Eur. J. Inorg. Chem. 2014, 2014 (1), 101–109. 10.1002/ejic.201300960. [DOI] [Google Scholar]
- Dey B.; Mondal A.; Konar S. Effect of Ligand Field Strength on the Spin Crossover Behaviour in 5-X-SalEen (X = Me, Br and OMe) Based Fe(III) Complexes. Chem. Asian J. 2020, 15 (11), 1709–1721. 10.1002/asia.202000156. [DOI] [PubMed] [Google Scholar]
- Kahn O.Molecular Magnetism; Wiley-VCH: Weinheim, Germany, 1991. [Google Scholar]
- a Dolomanov O. V.; Bourhis L. J.; Gildea R. J.; Howard J. A. K.; Puschmann H. A complete structure solution, refinement and analysis program. J. Appl. Crystallogr. 2009, 42, 339–341. 10.1107/S0021889808042726. [DOI] [Google Scholar]; b Sheldrick G. M. SHELXT - Integrated space-group and crystal-structure determination. Acta Cryst. A 2015, 71, 3–8. 10.1107/S2053273314026370. [DOI] [PMC free article] [PubMed] [Google Scholar]; c Sheldrick G. M. Crystal structure refinement with ShelXL. Acta Cryst. Sect. C 2015, 71, 3–8. 10.1107/S2053229614024218. [DOI] [PMC free article] [PubMed] [Google Scholar]
- a Mahmoudi G.; Chowdhury H.; Ghosh B. K.; Lofland S. E.; Maniukiewicz W. Syntheses, crystal structures and Hirshfeld surface analysis of a coordination polymer of Cu(II) chlorido and a tris-octahedral complex of Ni(II) containing isonicotinoylhydrazone blockers. J. Mol. Struct. 2018, 1160, 368–374. 10.1016/j.molstruc.2018.02.015. [DOI] [Google Scholar]; b Hayati P.; Gutiérrez A. The role of non-covalent interactions on supramolecular assembly of coordination compounds of mercury(II) based on substituted pyridine mixed ligands. A survey of different conditions on morphology of new flower and ribbon like submicro structures. Inorg. Chim. Acta 2018, 479, 83–96. 10.1016/j.ica.2018.04.024. [DOI] [Google Scholar]; c Banik R.; Roy S.; Kirillov A. M.; Bauza A.; Frontera A.; Rodríguez-Diéguez A.; Salas J. M.; Maniukiewicz W.; Das S. K.; Das S. Two mixed-ligand cadmium(ii) compounds bearing 5-nitrosopyrimidine and N-donor aromatic blocks: self-assembly generation, structural and topological features, DFT studies, and Hirshfeld surface analysis. CrystEngComm. 2016, 18 (30), 5647–5657. 10.1039/C6CE00989A. [DOI] [Google Scholar]
- Frisch M. J.; Trucks G. W.; Schlegel H. B.; Scuseria G. E.; Robb M. A.; Cheeseman J. R.; Scalmani G.; Barone V.; Petersson G. A.; Nakatsuji H.; Li X.; Caricato M.; Marenich A. V.; Bloino J.; Janesko B. G.; Gomperts R.; Mennucci B.; Hratchian H. P.; Ortiz J. V.; Izmaylov A. F.; Sonnenberg J. L.; Williams-Young D.; Ding F.; Lipparini F.; Egidi F.; Goings J.; Peng B.; Petrone A.; Henderson T.; Ranasinghe D.; Zakrzewski V. G.; Gao J.; Rega N.; Zheng G.; Liang W.; Hada M.; Ehara M.; Toyota K.; Fukuda R.; Hasegawa J.; Ishida M.; Nakajima T.; Honda Y.; Kitao O.; Nakai H.; Vreven T.; Throssell K.; Montgomery J. A. Jr.; Peralta J. E.; Ogliaro F.; Bearpark M. J.; Heyd J. J.; Brothers E. N.; Kudin K. N.; Staroverov V. N.; Keith T. A.; Kobayashi R.; Normand J.; Raghavachari K.; Rendell A. P.; Burant J. C.; Iyengar S. S.; Tomasi J.; Cossi M.; Millam J. M.; Klene M.; Adamo C.; Cammi R.; Ochterski J. W.; Martin R. L.; Morokuma K.; Farkas O.; Foresman J. B.; Fox D. J.. Gaussian 16, rev. B.01; Gaussian, Inc.: Wallingford, CT, 2016. [Google Scholar]
- Weigend F.; Ahlrichs R. Balanced basis sets of split valence, triple zeta valence and quadruple zeta valence quality for H to Rn: Design and assessment of accuracy. Phys. Chem. Chem. Phys. 2005, 7 (18), 3297–3305. 10.1039/b508541a. [DOI] [PubMed] [Google Scholar]
- Reiher M. Theoretical Study of the Fe(phen)2(NCS)2 Spin-Crossover Complex with Reparametrized Density Functionals. Inorg. Chem. 2002, 41 (25), 6928–6935. 10.1021/ic025891l. [DOI] [PubMed] [Google Scholar]
- Vidal D.; Cirera J.; Ribas-Arino J. Accurate calculation of spin-state energy gaps in Fe(III) spin-crossover systems using density functional methods. Dalton Trans. 2021, 50 (47), 17635–17642. 10.1039/D1DT03335B. [DOI] [PubMed] [Google Scholar]
- Russell V.; Scudder M.; Dance I. The crystal supramolecularity of metal phenanthroline complexes. J. Chem. Soc., Dalton Trans. 2001, (6), 789–799. 10.1039/b008607j. [DOI] [Google Scholar]
- Habarakada U.; Boonprab T.; Harding P.; Murray K. S.; Phonsri W.; Neville S. M.; Ahmed M.; Harding D. J. Solvent Effects on the Structural and Magnetic Properties of FeIII Spin-Crossover Complexes. Cryst. Growth Des. 2022, 22 (8), 4895–4905. 10.1021/acs.cgd.2c00390. [DOI] [Google Scholar]
- a Wickman H. H.; Klein M. P.; Shirley D. A. Paramagnetic Resonance of Fe3+ in Polycrystalline Ferrichrome A. J. Chem. Phys. 1965, 42 (6), 2113–2117. 10.1063/1.1696253. [DOI] [Google Scholar]; b Aasa R. Powder Line Shapes in the Electron Paramagnetic Resonance Spectra of High-Spin Ferric Complexes. J. Chem. Phys. 1970, 52 (8), 3919–3930. 10.1063/1.1673591. [DOI] [Google Scholar]
- a Hagen W. R. EPR spectroscopy as a probe of metal centres in biological systems. Dalton Trans. 2006, (37), 4415–4434. 10.1039/b608163k. [DOI] [PubMed] [Google Scholar]; b Hagen W. R.Biomolecular EPR Spectroscopy, 1st ed.; CRC Press: Boca Raton, FL, 2008. 10.1201/9781420059588 [DOI] [Google Scholar]
- a Rajput A.; Sharma A. K.; Barman S. K.; Koley D.; Steinert M.; Mukherjee R. Neutral, Cationic, and Anionic Low-Spin Iron(III) Complexes Stabilized by Amidophenolate and Iminobenzosemiquinonate Radical in N,N,O Ligands. Inorg. Chem. 2014, 53 (1), 36–48. 10.1021/ic401985d. [DOI] [PubMed] [Google Scholar]; b Rutkowska I.; Dzilinski K.; Kaczmarzyk T.; Stanek J. J. Spectroscopic study of a bis(imidazole) (octaethylporphyrinato)iron(III) complex. Nukleonika 2013, 58 (3), 419–423. [Google Scholar]
- Dey B.; Gupta A.; Kapurwan S.; Konar S. Study of Spin Crossover Property of a Series of X-OMe-SalEen (X = 6, 5 and 4) Based Fe(III) Complexes. ChemistrySelect 2020, 5 (46), 14677–14684. 10.1002/slct.202003135. [DOI] [Google Scholar]
- Tetteh S.; Zugle R.; Adotey J. P. K.; Quashie A. Electronic Spectra of ortho-Substituted Phenols: An Experimental and DFT Study. J. Spectrosc. 2018, 2018, 4193657. 10.1155/2018/4193657. [DOI] [Google Scholar]
- a Domracheva N. E.; Ovchinnikov I. V.; Turanov A. N.; Konstantinov V. N. EPR detection of presumable magnetoelectric interactions in the liquid-crystalline state of an iron mesogen. J. Mag. Mag. Mater. 2004, 269 (3), 385–392. 10.1016/S0304-8853(03)00635-8. [DOI] [Google Scholar]; b Domracheva N. E.; Vorobeva V. E.; Ovcharenko V. I.; Bogomyakov A. S.; Zueva E. M.; Gruzdev M. S.; Chervonova U. V.; Kolker A. M. Counterion effect on the spin-transition properties of the second generation iron(III) dendrimeric complexes. Inorg. Chim. Acta 2017, 459, 131–142. 10.1016/j.ica.2017.02.008. [DOI] [Google Scholar]; c Domracheva N.; Pyataev A.; Manapov R.; Gruzdev M.; Chervonova U.; Kolker A. Structural, Magnetic and Dynamic Characterization of Liquid Crystalline Iron(III) Schiff Base Complexes with Asymmetric Ligands. Eur. J. Inorg. Chem. 2011, 2011 (8), 1219–1229. 10.1002/ejic.201001157. [DOI] [Google Scholar]; d Domracheva N. E.; Pyataev A. V.; Manapov R. A.; Gruzdev M. S. Magnetic Resonance and Mössbauer Studies of Superparamagnetic γ-Fe2O3 Nanoparticles Encapsulated into Liquid-Crystalline Poly(propylene imine) Dendrimers. ChemPhysChem 2011, 12 (16), 3009–3019. 10.1002/cphc.201100363. [DOI] [PubMed] [Google Scholar]; e Domracheva N. E.; Vorob’eva V. E.; Pyataev A. V.; Manapov R. A.; Zueva E. M.; Gruzdev M. S.; Chervonova U. V. Stepwise magnetic behavior of the liquid crystal iron(III) complex. J. Struct. Chem. 2013, 54 (1), 16–27. 10.1134/S0022476613070020. [DOI] [Google Scholar]
- Kepp K. P. Theoretical Study of Spin Crossover in 30 Iron Complexes. Inorg. Chem. 2016, 55 (6), 2717–2727. 10.1021/acs.inorgchem.5b02371. [DOI] [PubMed] [Google Scholar]
- Hammett L. P. The Effect of Structure upon the Reactions of Organic Compounds. Benzene Derivatives. J. Am. Chem. Soc. 1937, 59 (1), 96–103. 10.1021/ja01280a022. [DOI] [Google Scholar]
Associated Data
This section collects any data citations, data availability statements, or supplementary materials included in this article.