

Abstract

Huperzine A (HupA), an alkaloid found in the club moss Huperzia Serrata, has been in use for centuries in Chinese traditional medicine to treat dementia owing to its ability to inhibit the cholinergic enzyme acetylcholinesterase (AChE), thus acting as an acetylcholinesterase inhibitor (AChEI). An imbalance of metal ions in the brain is linked to Alzheimer’s disease (AD) pathology. Transferrin (Tf) is a crucial player in iron homeostasis, thus highlighting its significance in AD. This study explores the plausible binding of HupA with Tf using molecular docking, molecular dynamics (MD) simulation, and free energy landscape (FEL) analyses. The docking results show that HupA binds to the functionally active region of Tf by forming three hydrogen bonds with Thr392, Glu394, and Ser688 and several hydrophobic interactions. The MD simulation analyses show that HupA binding is stable with Tf, causing minimal changes to the protein conformation. Moreover, principal component analysis (PCA) and FEL also depict the stable binding of HupA with Tf without any significant fluctuations. Further, fluorescence-based binding suggested excellent binding affinity of HupA with Tf affirming in silico observations. Isothermal titration calorimetry (ITC) advocated the spontaneous binding of HupA with Tf. This study provides an insight into the binding mechanism of HupA with Tf, and overall, the results show that HupA, after required experimentations, can be a better therapeutic agent for treating AD while targeting Tf.
1. Introduction
Trace metals are well known to be essential in maintaining human physiology. Iron is a vital trace element involved in important processes like oxygen and electron transport, reduction and oxidation reactions, and other functions to maintain brain homeostasis.1,2 Iron concentrations are vital in maintaining various pathways, and a misregulation in iron storage and release can affect the overall cellular pathways.2 Iron has several inevitable roles in the brain, such as synthesizing neurotransmitters.3,4 Regions of the brain undergoing myelination show age-dependent accumulation of iron.5 Iron storage is directly associated with age up to 40 years in humans, and the process remains steady beyond that age.5 All these reports suggest the crucial role of iron in the brain. Unsurprisingly, Iron-related dysfunction has been related widely to neurodegeneration.6 The generation and metabolism of free radicals is a common event during the oxidative metabolism of the central nervous system (CNS).7 Still, a surplus of unbound and free iron contributes to the generation of rapid oxygen intermediates; the toxicity may be one factor contributing to brain cell death and neurodegeneration.8 Metal ion homeostasis in the brain is fundamental for continuing common physiological roles.9 Therefore, iron homeostasis is essential, and transferrin (Tf) is the leading performer in iron metabolism. Tf, a group of proteins, transports iron around the bloodstream forming an iron–protein complex.10
The 679 amino acid residue protein, Tf, has a mass of 79.6 kDa.11 Tf quenches the free iron in the bloodstream, avoiding the stressed oxidative environment. The free iron across the blood is picked up by Tfs and delivered to the cells. The process involves a receptor-mediated endocytic mechanism; Tf complexed with the receptor is internalized, losing the bound iron in the endosome. The complex is further recovered to the cell’s surface, releasing the Tf.12 Reactive oxygen species (ROS) produced in response to free iron contribute to many diseases, emphasizing the importance of transferrin in managing the menace. Tfs control the flow of free iron, protecting the body from the harmful effects of free iron in the oxygen-rich environment of body fluids.13 The scarcity of Tf significantly affects red blood cell production; Tf deficiency stores the iron in the storage pool, ultimately leading to iron scarcity.
Alzheimer’s disease (AD) is one of the most prevalent neurodegenerative disorders that shows a characteristic deposition of amyloid-β (Aβ), further assisting senile plaques and tau generation, ultimately leading to neurofibrillary tangle (NFT) production.14,15 Different hypotheses deciphers the AD pathogenesis; one is cholinergic, and the other is the amyloid hypothesis. Additionally, the tau hypothesis in which neurofibrillary tangles (NFTs) formed from hyperphosphorylated tau are major players is gaining recognition. The metal hypothesis states that metal ion dyshomeostasis in the brain is linked to AD pathology. Tf is a vital iron-binding protein that plays a crucial role in iron ion absorption through the transferrin receptor (TfR), possibly involving AD pathogenesis.16 The pathogenesis of AD is greatly affected by the balance of metal ions in the central nervous system and, hence, are significant contributors to tau phosphorylation and Aβ accumulation. Imbalanced metal concentrations have been well reported in the AD brain.17,18 Neurodegeneration mediated by iron accumulation is also termed iron death; increased iron concentrations in CNS have been linked to other tauopathies and Aβ toxicity.19 Tau and Aβ bound to iron induces aggregations and hence amplify neurotoxicity. Aβ, when bound to an iron ion at its N-terminal, produces free radicals responsible for membrane surface damage.20 All these reports suggest the importance of Tf in AD pathogenesis.
Natural products provide a platform for new chemical entities having diverse molecular structures and thus serve as a key player in drug discovery. In most cases, modification and optimization are required for natural compounds in a bid to modify the structural features that result in increased potency and selectivity with reduced toxicity.21 Huperzine A (Hup A) is a Chinese medicinal herb used as traditional medicine for ages. The compound is extracted from Huperzia Serrata and is characterized as a lycopodium alkaloid with various medicinal properties.22 The most common use of the medicine is against neurological disorders such as schizophrenia, contrusion, etc. It is recognized as a potential acetylcholinesterase inhibitor (AChI) and hence a potent anti-AD candidate.23,24 Surprisingly, the potential is considered greater than the drugs in use as AChI, such as donepezil and galantamine.25 Acetylcholine (ACh) occurs in multiple forms in the mammalian brain, the central part of which occurs as a tetrameric form, with small amounts of monomeric forms.26 Hup A has shown inhibitor effects against the tetrameric form of ACh, which is present in abundance, and other drugs such as rivastigmine inhibit the scarce monomeric form.27 A recent study reported binding of HupA with the most abundant plasma protein, human serum albumin (HSA).28 Thus, in lieu of the importance of Tf in AD therapeutics and the potential of HupA as an excellent therapeutic candidate for AD, this study was performed to decipher the binding mechanism of HupA with Tf. In this study, we used molecular docking and molecular dynamic (MD) simulation approaches along with free energy landscape (FEL) and principal component analysis (PCA) to study the binding potential of HupA toward Tf. After performing the interaction analysis, the MD trajectories were analyzed for the root mean square deviation (RMSD), root mean square deviation fluctuations (RMSF), radius of gyration (Rg), solvent accessible surface area (SASA), and intra- and intermolecular hydrogen bonding (H-bonding) followed by PCA and FEL analysis. Additionally, in silico observations were validated by the fluorescence-based binding assay. Isothermal titration calorimetry (ITC) further revealed the binding energetics of the Tf-HupA system delineating the associated thermodynamic parameters.
2. Materials and Methods
2.1. Data Preparation and Computational Settings
The crystal structure of human Tf [PDB: 3 V83] was used as the receptor in this study. The parent coordinates for receptor preparation deleted the heteroatoms and water molecules. The PyMOL29 was used for deleting heteroatoms, and missing atoms were added through the SwissPDB-Viewer.30 Missing hydrogen atoms were added using MGL AutoDock tools,31 and Amber 7FF99 atom types were assigned. The energy minimization process was also performed on the receptor file under vacuum conditions and the GROMOS force field option.32 The final structure of the receptor was stored for molecular docking study. For ligand preparation, the three-dimensional structure (3D) of HupA was downloaded from the PubChem repository (PubChem CID: 854026). The molecular struture of HupA is shown in Figure S1. For preprocessing, approperiate atom types were assigned and the structure was energy minimized. The final structure of the ligand was stored for docking study.
2.2. Molecular Docking
The molecular docking of Tf and HupA was carried out to assess the binding affinity and make preliminary coordinates available for the MD simulation studies. The docking was performed using the InstaDock software33 in a fully available search space. During the docking procedure, the grid box with dimensions 84 × 96 × 88 centered at the coordinates X = −51.216, Y = 17.726, and Z = −29.071 was utilized as a search area. The default settings and parameters in InstaDock were used, generating a maximum of nine docked conformations for the ligand. The scoring function in InstaDock is implemented from the AutoDock Vina program, i.e., the sum of energy terms of H-bonding, electrostatic interactions, dispersion/repulsion, internal ligand torsional constraints, deviation from covalent geometry, and desolvation effects. After the docking procedure, the possible docked poses of the ligand were split and analyzed for pose selection. The final docked pose, known as the representative binding pose, was selected based on the binding affinity and critical interactions toward the receptor-binding pocket. The pKi and ligand efficiency for HupA was estimated following the protocol described in our initial publications.33−35 The interaction analyses were carried out using PyMOL and Discovery Studio Visualizer36 programs.
The pKi, the negative decimal logarithm of the inhibition constant, was calculated from ΔG through the following formula:
where ΔG is the binding affinity (kcal mol–1), R (gas constant) is 1.98 cal × (mol × K)−1, T (room temperature) is 298.15 Kelvin, and Kipred is the predicted inhibitory constant.
Ligand efficiency (LE) was calculated through the following formula:
where LE is the ligand efficiency (kcal mol–1 non-H atom–1), ΔG is the binding affinity (kcal mol–1), and N is the number of non-hydrogen atoms in the ligand.
2.3. MD Simulations
The classical MD simulation for 100 ns was performed on Tf and Tf-HupA docked complex using GROMACS 2020 beta.37 The MD simulation study helps evaluate the binding interactions between a protein–ligand complex in a time evolution manner.38,39 The free protein and the protein–ligand complex from the docking study were used as initial coordinates for MD simulations. The HupA was parameterized through the PRODRG program.40 The topology and the coordinate files for Tf were produced using the Gromos54a7 force field embedded in the GROMACS suite. The free protein and the protein–ligand complex were enclosed in a cubic box of the SPCE water model with distance of 10 Å from the edges. An appropriate number of counter ions were supplied to both the systems for neutralization, followed by an energy minimization process using the steepest descent algorithm with 1500 steps. This was followed by the NVT (constant number of particles, volume, and temperature) ensemble for one ns and the NPT (constant number of particles, pressure, and temperature) ensemble for one ns. Thermodynamic properties, including potential energy and total energy of both the systems, were monitored, ensuring adequate equilibration in the simulations. Finally, unrestrained 100 ns production runs for each system were performed at 300 K and one atmospheric bar pressure. The detailed protocol for the analysis of the produced MD trajectories has been discussed in several protein–ligand interaction studies.
2.4. Principal Component Analysis
In this work, the internal collective motions of Tf before and after the binding of HupA were also examined through the principal component analysis (PCA) based on the positional covariance matrix generated using the coordinates of Cα atoms and two principal components (PCs), named PC1 and PC2. PCA helps in revealing the collective motions in a protein.41 The basic elements of the positional covariance matrix were obtained by the following equation:42
where xi/xj denotes the Cartesian coordinate of the ith/jth atom, and <−> denotes the ensemble average.
2.5. Free-Energy Landscape Analysis
The free-energy landscape (FEL) records all possible conformations of a molecular system, especially proteins.42 The analysis of FELs is useful in exploring the spatial position of molecular systems along with their corresponding energy levels.43 To examine the energy bases of Tf conformational states, FELs were generated according to the following equation:
where KB denotes the Boltzmann constant, T denotes the temperature, i.e., 300 K, and P(X) denotes the probability distribution.
2.6. MM-PBSA Calculations
To further evaluate the binding of HupA with Tf, the binding affinity of the docked complex was calculated using the MM-PBSA approach.44 MM-PBSA was calculated through the g_mmpbsa package of GROMACS.45 The trajectory from a stable region, i.e., between 50 and 60 ns, was used for the calculation.
2.7. Fluorescence-Based Binding
To further confirm the in silico observations, a fluorescence-based assay was carried out to check the actual binding between Tf and HupA as per earlier published literature studies46,47 on a Jasco FP-6200 spectrofluorometer (Tokyo, Japan) at 25 °C. The protein was excited at 280 nm, and the emission was recorded in the 300–400 nm range with the slit width set at 10 nm and response set to medium. The protein concentration was kept constant at 4 μM, and we titrated the ligand (HupA) in the range of 0–10 μM. The experiment was performed in triplicates, and all the reported spectra are subtracted spectra.
2.8. Isothermal Titration Calorimetry
We performed an ITC experiment on MicroCal VP-ITC (Northampton, MA, USA) in accordance with earlier studies.34,48 Initially, all the samples were degassed thoroughly to remove the bubbles, and post degassing, the sample cell was filled with protein of interest, while the ligand was loaded into the rotator syringe. A programmed titration of 26 injections, in which the first injection of 2 μL is considered false, is followed by 10 μL injections, with the stirring speed set at 307 rpm and spacing set at 280 s. Microcal Origin 8.0 is used to plot the final figure and find the associated binding and thermodynamic parameters, Ka, ΔG, ΔH, and ΔS.
3. Result and Discussion
3.1. Molecular Docking of HupA and Tf
Molecular docking is usually deployed to find the binding sites of ligands on the proteins and reveal the binding energy of protein–ligand complexes.49−51 Molecular docking of HupA was performed with Tf, showing a binding affinity of −6.6 kcal/mol. It was estimated that the predicted pKi and LE values of HupA were 4.84 and 0.367 kcal/mol/non-H atom, respectively. Meanwhile, the molecular interactions of HupA with AchE are shown in Figure S2, where it shows an affinity of −7.3 kcal/mol. The calculated ADMET properties of HupA are described in Table S1. Visual inspection of the docked complex showed that HupA interacted with the Tf binding pocket that accommodated most of the ligand’s part inside the deep cavity of the protein (Figure 1). HupA formed three conventional hydrogen bonds with Thr392, Glu394, and Ser688 (Figure 1A). The docking pose showed that HupA is bound in a position too close to Asp411, which is critical for the functional activity of Tf. The hydrophobic core of Tf, surrounded of Arg327, Phe414, Ala472, Val473, Gly506, Ser507, Lys508, Thr686, and Leu689 forms multiple van der Waals interactions with HupA (Figure 1B). The docking pose of HupA predicted that the aromatic ring of HupA occupies the hydrophobic pocket of Tf surrounded by several residues (Figure 1C). The alternative docking modes of HupA with Tf in the presence of Fe+3 are shown in Figure S3. From the docking study, it was exciting that HupA showed exceptional affinity, which strongly supported its candidature of being a plausible binding partner of Tf.
Figure 1.

Docking pose of HupA with Tf. (A) Ribbon diagram of Tf with HupA. (B) Close-up render of Tf showing interactions with HupA. (C) Surface plot of the interpolated charged binding pocket of Tf occupied with HupA.
The selected docked pose of HupA and its corresponding 2D and 3D interaction plots are depicted in Figure 2. The pose demonstrated that the HupA binds within the Tf’s active site and makes various interactions. Figure 2A shows that HupA bound tightly through three conventional hydrogen bonds with Thr392, Glu394, and Ser688, along with several other interactions such as van der Waals contacts. The Glu394 and Pro527 of Tf showed pi–anion and pi–alkyl interactions, respectively. The stability of a small molecule within the binding pocket is associated with the number of interactions shared by the surrounding residues. The strong binding of HupA with Tf can be correlated with various interactions formed between the docked complex of Tf-HupA. Binding site residue Tyr411 is critical for the iron-binding in Tf. It was apparent from the figure that HupA was near Tyr411 and shared a hydrophobic interaction (Figure 2A). The charged potential of the Tf binding pocket occupied by HupA is shown in Figure 2B. The analysis uncovered that HupA occupied the deep binding pocket of Tf properly, which supports our premise of their interaction.
Figure 2.

Selected docked pose of HupA and its corresponding (A) 2D and (B) 3D interaction plots.
3.2. MD Simulations
To explore the dynamic behavior of the Tf with HupA correlated to the inhibition mechanism, MD simulations were performed for the 100 ns Gromacs suite. The simulation trajectory of the apo form of the protein was served as the control for comparative analysis. The time evolution of the total energy of Tf and the Tf-HupA complex for 100 ns is shown in Figure 3. The graph showed in some way a parallel trend of both the systems. The stability of the docked complex was assessed by evaluating the RMSD, RMSF, Rg, SASA, and hydrogen bond analysis.
Figure 3.
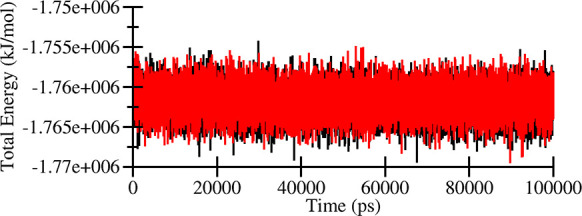
Total energy of Tf (black) and Tf-HupA complex (red).
3.2.1. Assessment of Stability through RMSD and RMSF
The structural movements are crucial for the functionality and existence of proteins inside the living system. The structural deviations of Tf and Tf-HupA were examined within the hydrated atmosphere to check their structural stability while simulating. The RMSD of Tf and its complex with HupA was checked, which remained stable during the simulation trajectories of 100 ns. The RMSD plot for Tf and Tf-HupA complex showed the stability attained just after 20 ns. The RMSD of the docked complex is similar to the apo state of the protein, with minimal increment (Figure 4A, left). Notably, the RMSD fluctuations were less than 2 Å for both systems. Visual inspection of the RMSD values clearly showed that the Tf-HupA complex was stable throughout the trajectory. The complex showed no significant deviation in the RMSD pattern (Figure 4A, right). On the whole, the RMSD spectrum of both systems does not show any significant structural shifts, which indicates the stability of the Tf structure and intensity of HupA binding inside the protein’s active site.
Figure 4.

Conformational dynamics of Tf and Tf-HupA complex. (A) Time-evolution of the RMSD values. (B) RMSF graph depicting the deviation in the residual movement of Tf.
RMSF is essential in getting insights into the residual flexibility of a protein.52 RMSF study of each residue in Tf before and after HupA binding was carried out to see the impact of ligand binding on the local structure of the protein. Like RMSD plots, the RMSF fluctuations deviate from their native position after the ligand binding (Figure 4B, left). The major fluctuations were only seen in the loop and coil regions compared to regions formed by β-sheets and α-helices. This can be correlated with the docking results where sheets and helices accommodated the HupA interactions and got it stayed inside the binding pocket. A reduced residual index window of 480–500 amino acid positions was noticed, indicating pocket residues accelerating ligand binding. The distribution probability plot also indicated that the average fluctuations were similar in both the systems (Figure 4B, right).
3.2.2. Assessment of Compactness and Folding through Rg and SASA
Rg has been a useful parameter to explore in MD simulation studies to evaluate the compactness of the protein and protein–ligand complex. We have computed the Rg of both the systems to measure their shape at each time-point by comparative analysis (Figure 5A). The Rg values were reduced in the ligand-bound Tf’s production phase, indicating its compactness during the simulation. The average Rg values for Tf and Tf-HupA were 2.89 and 2.80 nm, respectively. A minor decrease in average Rg indicated that the Tf structure got compacted after HupA binding. Although, this minor decrease does not appear to cause any significant conformational adjustments in the protein structure. The analysis indicated that the Tf-HupA docked complex was reasonably stable and maintained during the simulation (Figure 5A, right).
Figure 5.

Structural compactness of Tf and Tf-HupA complex during the simulation time. (A) Time evolution of the Rg values. (B) Time evolution of the SASA during the simulation.
To further investigate the folding mechanism of Tf before and after HupA binding in the simulation course, we assessed the surface area of Tf accessible to its adjacent solvent, generally termed SASA. The time evolution of the SASA values was studied for the 100 ns trajectory of both systems (Figure 5B, left). The total SASA values computed for Tf and Tf-HupA were 298.25 and 299.96, respectively. The distribution of SASA was considerably similar in the case of both systems, Tf and Tf-HupA docked complex. It showed a reasonable equilibration throughout the 100 ns simulation without any substantial shift (Figure 5B, right).
3.2.3. Structural Integrity and Complex Stability through Intra-/Intermolecular Hydrogen Bonds
The integrity of a protein structure and complex stability can be assessed by studying the formation and stability of the H-bonding during simulation.53 We have monitored the intramolecular hydrogen bonds in Tf before and after HupA binding. The stability of the Tf structure and its docked complex with HupA is sustained by several intra-/intermolecular interactions such as electrostatic, H-bonding, hydrophobic interactions, etc. The intramolecular H-bonding analysis showed that H-bonding had a significant impact on maintaining the 3D structure of the protein throughout the simulation trajectories (Figure 6). The average number of hydrogen bonds estimated for Tf before and after HupA binding were 500 and 498, respectively. The plot indicated that intramolecular hydrogen bonds in Tf showed steadiness during the simulation time even after binding with HupA. The continual stability of these bonds maintained the geometry of the protein during the simulation.
Figure 6.

Intramolecular H-bonding within the structure of the Tf protein during the simulation.
To examine the stability of intermolecular H-bonds formed between HupA and Tf, we have explored the trajectory for intermolecular H-bonding and plotted it as a function of time (Figure 7). The plot showed that up to six hydrogen bonds were formed between the ligand and protein but with less stability. However, 2–3 hydrogen bonds showed decent stability throughout the simulation (Figure 7, left). The probability distribution plot also indicated that two hydrogen bonds were predominantly formed in the Tf-HupA complex (Figure 7, right). The intermolecular hydrogen bond analysis is highly consistent with the static result from the molecular docking of Tf-HupA, where three hydrogen bonds were involved in complex formation (Figure 2).
Figure 7.

Intermolecular hydrogen bonds between HupA and Tf during the simulation time.
3.3. Principal Component Analysis
Principle component analysis (PCA) is a statistical computation to reduce the complexity of MD trajectories by extracting just the collective motion of Ca backbone atoms. PCA was carried out to measure the space occupied by the conformational sampling and transition dynamics of Tf before and after HupA binding. The 2D projection of the MD trajectory data for principal components (PCs), i.e., PC1 and PC2 for the Tf and Tf-HupA complex, are shown in Figure 8. The PCA plot uncovered that 2D projections of the Tf-HupA complex occupied lesser phase space than the free state of Tf with well-defined clusters (Figure 8A). The projection of eigenvector (EV)-1 and EV-2 was also plotted with respect to time (Figure 8B). The explanations were parallel to the 2D projection of the trajectories where the Tf-HupA complex is more stable than the free state of the protein. The PCA analyses revealed that the HupA binding to Tf reduced the flexibility of the protein structure. The PCA confirms well with the lower flexibility in the docked complex compared to the free state of the protein. This indicates the overall stability of the Tf-HupA complex during the simulation run.
Figure 8.

Principal component analysis. (A) 2D projection plot of the conformation sampling of Tf on EV1 and EV2. (B) Time evolution of conformational projections on EV1 and EV2.
3.4. Free Energy Landscape Analysis
The free energy landscapes (FELs) generated through PCA are a graphical illustration of the protein conformations concerning energy and phase spaces.42 The FEL analysis distinguishes protein or protein–ligand complexes’ kinetic and thermodynamic estates. To evaluate the overall stability and folding mechanism of Tf before and after HupA binding, FELs were generated in discrete rainbow representations (Figure S4). The figure showed the FELs projected onto the PC1 and PC2 of the Tf and Tf-HupA complex. The contour maps showed the size and shape of the global minima (in dark blue), which indicated that the Tf-HupA complex has more stability than the free state of the protein (Figure S4). The reduced and more consolidated blue phase indicated that the corresponding structure is more stable. Overall, FEL analysis suggested that Tf, when bound with HupA, became much more thermodynamically stable and had less flexible dynamics than apo Tf during the simulation (Figure S4B).
3.5. MMPBSA Binding Free Energy
The binding free energy of HupA with Tf was calculated from the MD trajectory of a 10 ns stable region, i.e., between 50 and 60 ns. HupA shows an appreciable binding affinity with Tf, i.e., −108.24 ± 16.82 kJ/mol. The MMPBSA result supported the observation that HupA binds to Tf with an appreciable binding affinity.
3.6. Fluorescence Based Binding
Researchers have used fluorescence-based binding studies to study protein–ligand interactions.54 All the above observations depicted stable and strong binding of HupA to Tf. Thus, a fluorescence-based binding assay was carried out to validate all the in silico observations. The fluorescence-based assay ascertains the actual binding affinity of a ligand with the protein. Figure 9 shows the fluorescence spectra of Tf in the absence and presence of a varying concentration of HupA (0–10 μM). It is apparent that with increasing HupA concentration, there was a visible decrease in Tf’s fluorescence,referred to as fluorescence quenching. This quenching of fluorescence in the presence of varying HupA concentrations reveals that a complex formation occurs between Tf and HupA. Further, this data was mathematically evaluated using a modified Stern–Volmer equation (eq 1) to have an insight into the strength of the binding by finding the binding constant (K) of the Tf-HupA complex.
| 1 |
F0 corresponds to the maximum fluorescence intensity of free hTf. F shows the fluorescence intensity of the complex. K corresponds to the binding constant, while n depicts the binding sites. C refers to the concentration of ligand.
Figure 9.

(A) Fluorescence emission spectra of Tf in the absence and presence of varying HupA concentrations (0–10 μM). (B) Data fitted into modified Stern–Volmer equation for Tf-HupA interaction.
HupA showed excellent binding affinity to Tf with a binding constant of 0.2 × 10⁶ M–1 and is comparable to the binding constant obtained for binding of HupA with HSA.28 Hence, the in silico observations coupled with the fluorescence binding affirm significant binding of HupA to Tf.
3.7. Isothermal Titration Calorimetry (ITC)
After confirming the binding of HupA with Tf through computational approaches and fluorescence binding, ITC was deployed to ascertain the binding energetics of the system and decipher the associated thermodynamic parameters with the binding. ITC reveals the molecular forces that are involved in the binding process. The heat released or absorbed in the sample cell due to the formation or dissociation of the protein–ligand complex is measured with respect to a reference cell filled with buffer. The obtained isotherm (Figure 10) advocates the spontaneous binding of HupA with Tf. The upper panel (each peak in the isotherm) corresponds to a single injection of HupA into Tf solution, while the lower panel depicts the integrated plot of heat released per injection as a function of the molar ratio of ligand to the protein. The number of binding sites (n), binding constant (K), enthalpy change (ΔH), and entropy change (ΔS) were determined directly by curve fitting.34 It is evident from the ITC isotherm that negative heat deflection is obtained, implying the binding to be exothermic. Table 1 gives the associated binding and thermodynamic parameters of the Tf-HupA system.
Figure 10.
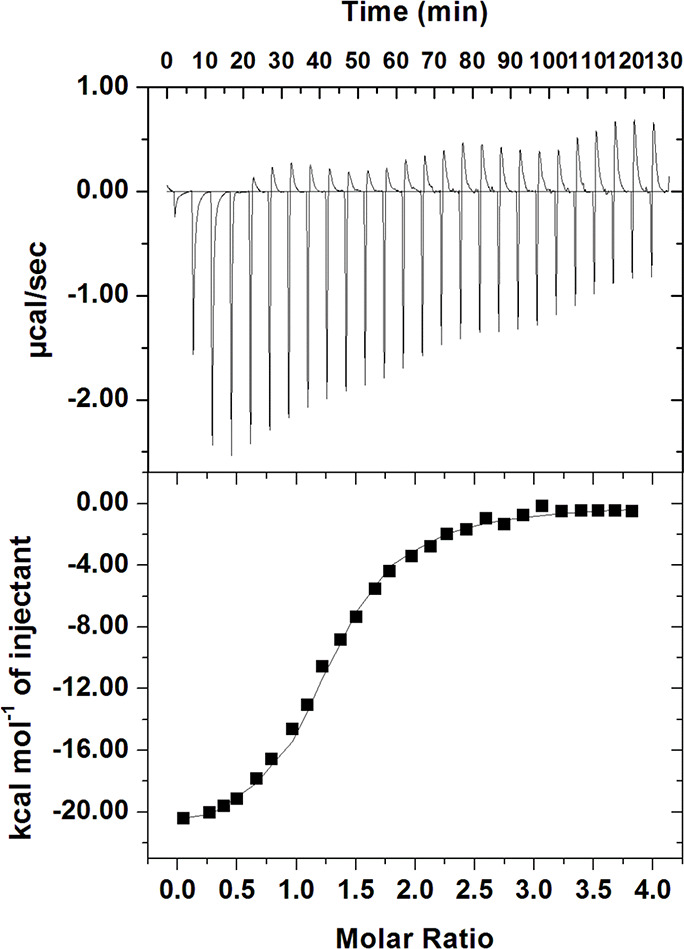
ITC profile of the Tf-HupA system. The sample cell was filled with 20 μM Tf, while the syringe contained 500 μM Hup A.
Table 1. Thermodynamic and Binding Parameters of Tf-HupA System Obtained from ITC.
| Ka (association constant), M–1 | ΔH(enthalpy change), cal/mol | ΔS(cal/mol/deg) |
|---|---|---|
| Ka = 6.90 × 10⁵ ± 7.56 × 10⁵ | ΔH = −2.20 × 10⁴ ± 4341 | ΔS = −47.2 |
4. Conclusions
Exploring natural compounds with well-defined targets allows experimentalists to test their efficacy for therapeutic development. In this study, we explored the plausible binding of HupA with Tf to propose it in anti-AD therapy. An integrated approach of in silico and in vitro experimentations was employed to examine the possible binding of HupA with Tf. The results show that HupA has many drug-like properties, which might be considered a good therapeutic agent in AD management. Moreover, the binding properties of HupA with Tf seem to be excellent in terms of interaction and stability. Fluorescence spectroscopy and ITC ascertained the binding affinity of HupA with Tf, revealing the formation of a stable Tf-HupA complex. The docking study suggested that HupA binds with a proper conformation within the active region of the Tf binding pocket. The simulation study showed a deeper insight into backbone fluctuations and structural stability of the protein–ligand complex. The MD results depict the structural stability of the Tf-HupA docked complex throughout the trajectory. The PCA and FEL analyses showed that the Tf-HupA complex has more stable behavior than the free form of Tf. In conclusion, based on the results from the current study, we can state that HupA can be explored further in improving its efficacy and specificity toward Tf in AD management.
Acknowledgments
The authors are thankful to the Deanship of Scientific Research, King Khalid University, Abha, Saudi Arabia, for financially supporting this work through the Large Research Group Program under grant number (RGP.2/137/1442).
Supporting Information Available
The Supporting Information is available free of charge at https://pubs.acs.org/doi/10.1021/acsomega.2c03185.
(Figure S1) Molecular structure of HupA; (Figure S2) molecular interactions of HupA with AChE; (Figure S3) different docking modes of HupA with Tf in presence of Fe+3 and varying affinity and distances of HupA with Tf; (Figure S4) free energy landscape plots for free Tf and Tf-HupA complex (PDF)
Author Contributions
A.A. did the conceptualization, formal analysis, project administration, writing of the original draft, funding acquisition, writing of the review, and editing. F.A.A. did the visualization, software, writing of the review, and editing. A.S. did the data validation, conceptualization, formal analysis, project administration, and data analysis. A.O. did the editing and data curation. S.A.A. did the methodology and investigation. S.E.S. did the visualization, software, and data validation. W.A.A. did the data validation and software. M.S. did the data curation, supervision, writing of the review, and editing.
The authors are thankful to the Deanship of Scientific Research, King Khalid University, Abha, Saudi Arabia, for financially supporting this work through the Large Research Group Program under grant number (RGP.2/137/1443).
The authors declare no competing financial interest.
Supplementary Material
References
- Lieu P. T.; Heiskala M.; Peterson P. A.; Yang Y. The roles of iron in health and disease. Mol. Aspects Med. 2001, 22, 1–87. 10.1016/S0098-2997(00)00006-6. [DOI] [PubMed] [Google Scholar]
- Eisenstein R. S. Iron regulatory proteins and the molecular control of mammalian iron metabolism. Annu. Rev. Nutr. 2000, 20, 627–662. 10.1146/annurev.nutr.20.1.627. [DOI] [PubMed] [Google Scholar]
- Rouault T. A. Systemic iron metabolism: a review and implications for brain iron metabolism. Pediatr. Neurol. 2001, 25, 130–137. 10.1016/S0887-8994(01)00260-0. [DOI] [PubMed] [Google Scholar]
- D’Sa C. M.; Arthur R. E. Jr.; States J. C.; Kuhn D. M. Tryptophan hydroxylase: cloning and expression of the rat brain enzyme in mammalian cells. J. Neurochem. 1996, 67, 900–906. 10.1046/j.1471-4159.1996.67030900.x. [DOI] [PubMed] [Google Scholar]
- Connor J. R.; Pavlick G.; Karli D.; Menzies S. L.; Palmer C. A histochemical study of iron-positive cells in the developing rat brain. J. Comp. Neurol. 1995, 355, 111–123. 10.1002/cne.903550112. [DOI] [PubMed] [Google Scholar]
- Beal M. F. Mitochondrial dysfunction in neurodegenerative diseases. Biochimica et Biophysica Acta (BBA)-Bioenergetics 1998, 1366, 211–223. 10.1016/S0005-2728(98)00114-5. [DOI] [PubMed] [Google Scholar]
- Sipe J. C.; Lee P.; Beutler E. Brain iron metabolism and neurodegenerative disorders. Dev. Neurosci. 2002, 24, 188–196. 10.1159/000065701. [DOI] [PubMed] [Google Scholar]
- Connor J. R.; Menzies S. L.; Burdo J. R.; Boyer P. J. Iron and iron management proteins in neurobiology. Pediatr. Neurol. 2001, 25, 118–129. 10.1016/S0887-8994(01)00303-4. [DOI] [PubMed] [Google Scholar]
- Wang L.; Yin Y.-L.; Liu X.-Z.; Shen P.; Zheng Y.-G.; Lan X.-R.; Lu C.-B.; Wang J.-Z. Current understanding of metal ions in the pathogenesis of Alzheimer’s disease. Transl. Neurodegener. 2020, 9, 1–13. 10.1186/s40035-020-00189-z. [DOI] [PMC free article] [PubMed] [Google Scholar]
- Thompson K.; Menzies S.; Muckenthaler M.; Torti F. M.; Wood T.; Torti S. V.; Hentze M. W.; Beard J.; Connor J. Mouse brains deficient in H-ferritin have normal iron concentration but a protein profile of iron deficiency and increased evidence of oxidative stress. J. Neurosci. Res. 2003, 71, 46–63. 10.1002/jnr.10463. [DOI] [PubMed] [Google Scholar]
- Shamsi A.; Ahmed A.; Khan M. S.; Husain F. M.; Amani S.; Bano B. Investigating the interaction of anticancer drug temsirolimus with human transferrin: Molecular docking and spectroscopic approach. J. Mol. Recognit. 2018, 31, e2728 10.1002/jmr.2728. [DOI] [PubMed] [Google Scholar]
- Egan T. J.; Zak O.; Aisen P. The anion requirement for iron release from transferrin is preserved in the receptor-transferrin complex. Biochemistry 1993, 32, 8162–8167. 10.1021/bi00083a016. [DOI] [PubMed] [Google Scholar]
- Wally J.; Buchanan S. K. A structural comparison of human serum transferrin and human lactoferrin. BioMetals 2007, 20, 249–262. 10.1007/s10534-006-9062-7. [DOI] [PMC free article] [PubMed] [Google Scholar]
- Selkoe D. J.; Hardy J. The amyloid hypothesis of Alzheimer’s disease at 25 years. EMBO Mol. Med. 2016, 8, 595–608. 10.15252/emmm.201606210. [DOI] [PMC free article] [PubMed] [Google Scholar]
- Grundke-Iqbal I.; Iqbal K.; Tung Y.-C.; Wisniewski H. Alzheimer paired helical filaments: immunochemical identification of polypeptides. Acta Neuropathol. 1984, 62, 259–267. 10.1007/BF00687607. [DOI] [PubMed] [Google Scholar]
- Lu C.-D.; Ma J.-K.; Luo Z.-Y.; Tai Q.-X.; Wang P.; Guan P.-P. Transferrin is responsible for mediating the effects of iron ions on the regulation of anterior pharynx-defective-1α/β and Presenilin 1 expression via PGE2 and PGD2 at the early stage of Alzheimer’s Disease. Aging 2018, 10, 3117. 10.18632/aging.101615. [DOI] [PMC free article] [PubMed] [Google Scholar]
- Nunomura A.; Perry G.; Aliev G.; Hirai K.; Takeda A.; Balraj E. K.; Jones P. K.; Ghanbari H.; Wataya T.; et al. Oxidative damage is the earliest event in Alzheimer disease. J. Neuropathol. Exp. Neurol. 2001, 60, 759–767. 10.1093/jnen/60.8.759. [DOI] [PubMed] [Google Scholar]
- Martins C.; Galetti P. M. Chromosomal localization of 5S rDNA genes in Leporinus fish (Anostomidae, Characiformes). Chromosome Res. 1999, 7, 363–367. 10.1023/A:1009216030316. [DOI] [PubMed] [Google Scholar]
- Levi S.; Finazzi D. Neurodegeneration with brain iron accumulation: update on pathogenic mechanisms. Front. Pharmacol. 2014, 5, 99. 10.3389/fphar.2014.00099. [DOI] [PMC free article] [PubMed] [Google Scholar]
- Liu B.; Moloney A.; Meehan S.; Morris K.; Thomas S. E.; Serpell L. C.; Hider R.; Marciniak S. J.; Lomas D. A.; et al. Iron promotes the toxicity of amyloid β peptide by impeding its ordered aggregation. J. Biol. Chem. 2011, 286, 4248–4256. 10.1074/jbc.M110.158980. [DOI] [PMC free article] [PubMed] [Google Scholar]
- Mallavadhani U. V.; Chandrashekhar M.; Nayak V. L.; Ramakrishna S. Synthesis and anticancer activity of novel fused pyrimidine hybrids of myrrhanone C, a bicyclic triterpene of Commiphora mukul gum resin. Mol. Diversity 2015, 19, 745–757. 10.1007/s11030-015-9621-3. [DOI] [PubMed] [Google Scholar]
- Wang R.; Tang X. C. Neuroprotective effects of huperzine A. Neurosignals 2005, 14, 71–82. 10.1159/000085387. [DOI] [PubMed] [Google Scholar]
- Tang X. C.; Han Y. F. Pharmacological profile of huperzine A, a novel acetylcholinesterase inhibitor from Chinese herb. CNS Drug Rev. 1999, 5, 281–300. 10.1111/j.1527-3458.1999.tb00105.x. [DOI] [Google Scholar]
- Friedli M. J.; Inestrosa N. C. Huperzine A and Its Neuroprotective Molecular Signaling in Alzheimer’s Disease. Molecules 2021, 26, 6531. 10.3390/molecules26216531. [DOI] [PMC free article] [PubMed] [Google Scholar]
- Wang H.; Tang X. Anticholinesterase effects of huperzine A, E2020, and tacrine in rats. Zhongguo yao li xue bao=. Acta Pharmacol. Sin. 1998, 19, 27–30. [PubMed] [Google Scholar]
- Grassi J.; Vigny M.; Massoulié J. Molecular forms of acetylcholinesterase in bovine caudate nucleus and superior cervical ganglion: solubility properties and hydrophobic character. J. Neurochem. 1982, 38, 457–469. 10.1111/j.1471-4159.1982.tb08651.x. [DOI] [PubMed] [Google Scholar]
- Zhao Q.; Tang X. C. Effects of huperzine A on acetylcholinesterase isoforms in vitro: comparison with tacrine, donepezil, rivastigmine and physostigmine. Eur. J. Pharmacol. 2002, 455, 101–107. 10.1016/S0014-2999(02)02589-X. [DOI] [PubMed] [Google Scholar]
- Shamsi A.; Shahwan M.; Khan M. S.; Alhumaydhi F. A.; Alsagaby S. A.; Al A. W.; Abdullaev B.; Yadav D. K. Mechanistic Insight into Binding of Huperzine A with Human Serum Albumin: Computational and Spectroscopic Approaches. Molecules 2022, 27, 797. 10.3390/molecules27030797. [DOI] [PMC free article] [PubMed] [Google Scholar]
- Pymol D. L. W. L. An open-source molecular graphics tool. CCP4 Newsl. Protein Crystallogr. 2002, 40, 82–92. [Google Scholar]
- Guex N.; Peitsch M. C. SWISS-MODEL and the Swiss-Pdb Viewer: an environment for comparative protein modeling. Electrophoresis 1997, 18, 2714–2723. 10.1002/elps.1150181505. [DOI] [PubMed] [Google Scholar]
- Morris G. M.; Huey R.; Olson A. J. Using autodock for ligand-receptor docking. Curr. Protoc. Bioinf. 2008, 24, 8.14. 11–18.14. 40. 10.1002/0471250953.bi0814s24. [DOI] [PubMed] [Google Scholar]
- Oostenbrink C.; Villa A.; Mark A. E.; Van Gunsteren W. F. A biomolecular force field based on the free enthalpy of hydration and solvation: the GROMOS force-field parameter sets 53A5 and 53A6. J. Comput. Chem. 2004, 25, 1656–1676. 10.1002/jcc.20090. [DOI] [PubMed] [Google Scholar]
- Mohammad T.; Mathur Y.; Hassan M. I. InstaDock: A single-click graphical user interface for molecular docking-based virtual high-throughput screening. Briefings Bioinf. 2021, 22, bbaa279 10.1093/bib/bbaa279. [DOI] [PubMed] [Google Scholar]
- Alhumaydhi F. A.; Aljasir M. A.; Aljohani A. S.; Alsagaby S. A.; Alwashmi A. S.; Shahwan M.; Hassan M. I.; Islam A.; Shamsi A. Probing the interaction of memantine, an important Alzheimer’s drug, with human serum albumin: In silico and in vitro approach. J. Mol. Liq. 2021, 340, 116888 10.1016/j.molliq.2021.116888. [DOI] [Google Scholar]
- Shamsi A.; Shahwan M.; Khan M. S.; Husain F. M.; Alhumaydhi F. A.; Aljohani A. S.; Rehman M. T.; Hassan M. I.; Islam A. Elucidating the interaction of human ferritin with quercetin and naringenin: Implication of natural products in neurodegenerative diseases: Molecular docking and dynamics simulation insight. ACS Omega 2021, 6, 7922–7930. 10.1021/acsomega.1c00527. [DOI] [PMC free article] [PubMed] [Google Scholar]
- Biovia D. S.Discovery studio modeling environment. San Diego:Dassault Systèmes; 2015. [Google Scholar]
- Abraham M. J.; Murtola T.; Schulz R.; Páll S.; Smith J. C.; Hess B.; Lindahl E. GROMACS: High performance molecular simulations through multi-level parallelism from laptops to supercomputers. SoftwareX 2015, 1-2, 19–25. 10.1016/j.softx.2015.06.001. [DOI] [Google Scholar]
- Defelipe L. A.; Arcon J. P.; Modenutti C. P.; Marti M. A.; Turjanski A. G.; Barril X. Solvents to fragments to drugs: MD applications in drug design. Molecules 2018, 23, 3269. 10.3390/molecules23123269. [DOI] [PMC free article] [PubMed] [Google Scholar]
- Lopez E. D.; Arcon J. P.; Gauto D. F.; Petruk A. A.; Modenutti C. P.; Dumas V. G.; Marti M. A.; Turjanski A. G. WATCLUST: a tool for improving the design of drugs based on protein-water interactions. Bioinformatics 2015, 31, 3697–3699. 10.1093/bioinformatics/btv411. [DOI] [PubMed] [Google Scholar]
- Schüttelkopf A. W.; Van Aalten D. M. PRODRG: a tool for high-throughput crystallography of protein–ligand complexes. Acta Crystallogr., Sect. D: Biol. Crystallogr. 2004, 60, 1355–1363. 10.1107/S0907444904011679. [DOI] [PubMed] [Google Scholar]
- David C. C.; Jacobs D. J.. Principal component analysis: a method for determining the essential dynamics of proteins. Protein dynamics: Springer, 2014;193–226. [DOI] [PMC free article] [PubMed] [Google Scholar]
- Altis A.; Otten M.; Nguyen P. H.; Hegger R.; Stock G. Construction of the free energy landscape of biomolecules via dihedral angle principal component analysis. J. Chem. Phys. 2008, 128, 06B620. [DOI] [PubMed] [Google Scholar]
- Papaleo E.; Mereghetti P.; Fantucci P.; Grandori R.; De Gioia L. Free-energy landscape, principal component analysis, and structural clustering to identify representative conformations from molecular dynamics simulations: the myoglobin case. J. Mol. Graphics Modell. 2009, 27, 889–899. 10.1016/j.jmgm.2009.01.006. [DOI] [PubMed] [Google Scholar]
- Genheden S.; Ryde U. The MM/PBSA and MM/GBSA methods to estimate ligand-binding affinities. Expert Opin. Drug Discovery 2015, 10, 449–461. 10.1517/17460441.2015.1032936. [DOI] [PMC free article] [PubMed] [Google Scholar]
- Kumari R.; Kumar R.; Consortium O. S. D. D.; Lynn A. g_mmpbsa— A GROMACS tool for high-throughput MM-PBSA calculations. J. Chem. Inf. Model. 2014, 54, 1951–1962. 10.1021/ci500020m. [DOI] [PubMed] [Google Scholar]
- Anwar S.; Mohammad T.; Shamsi A.; Queen A.; Parveen S.; Luqman S.; Hasan G. M.; Alamry K. A.; Azum N.; et al. Discovery of Hordenine as a Potential Inhibitor of Pyruvate Dehydrogenase Kinase 3: Implication in Lung Cancer Therapy. Biomedicines 2020, 8, 119. 10.3390/biomedicines8050119. [DOI] [PMC free article] [PubMed] [Google Scholar]
- Anwar S.; Shamsi A.; Shahbaaz M.; Queen A.; Khan P.; Hasan G. M.; Islam A.; Alajmi M. F.; Hussain A.; et al. Rosmarinic acid exhibits anticancer effects via MARK4 inhibition. Sci. Rep. 2020, 10, 1–13. 10.1038/s41598-020-65648-z. [DOI] [PMC free article] [PubMed] [Google Scholar]
- Shamsi A.; Anwar S.; Mohammad T.; Alajmi M. F.; Hussain A.; Rehman M.; Hasan G. M.; Islam A.; Hassan M. MARK4 inhibited by AChE inhibitors, donepezil and Rivastigmine tartrate: Insights into Alzheimer’s disease therapy. Biomolecules 2020, 10, 789. 10.3390/biom10050789. [DOI] [PMC free article] [PubMed] [Google Scholar]
- Roufegarinejad L.; Amarowicz R.; Jahanban-Esfahlan A. Characterizing the interaction between pyrogallol and human serum albumin by spectroscopic and molecular docking methods. J. Biomol. Struct. Dyn. 2019, 37, 2766–2775. 10.1080/07391102.2018.1496854. [DOI] [PubMed] [Google Scholar]
- Jahanban-Esfahlan A.; Panahi-Azar V. Interaction of glutathione with bovine serum albumin: Spectroscopy and molecular docking. Food Chem. 2016, 202, 426–431. 10.1016/j.foodchem.2016.02.026. [DOI] [PubMed] [Google Scholar]
- Arcon J. P.; Defelipe L. A.; Modenutti C. P.; López E. D.; Alvarez-Garcia D.; Barril X.; Turjanski A. n. G.; Martí M. A. Molecular dynamics in mixed solvents reveals protein–ligand interactions, improves docking, and allows accurate binding free energy predictions. J. Chem. Inf. Model. 2017, 57, 846–863. 10.1021/acs.jcim.6b00678. [DOI] [PubMed] [Google Scholar]
- Mohammad T.; Khan F. I.; Lobb K. A.; Islam A.; Ahmad F.; Hassan M. I. Identification and evaluation of bioactive natural products as potential inhibitors of human microtubule affinity-regulating kinase 4 (MARK4). J. Biomol. Struct. Dyn. 2019, 37, 1813–1829. 10.1080/07391102.2018.1468282. [DOI] [PubMed] [Google Scholar]
- Hubbard R. E.; Kamran Haider M.. Hydrogen Bonds in Proteins: Role and Strength. eLS: John Wiley & Sons, Ltd, 2001. [Google Scholar]
- Jahanban Esfahlan A.; Roufegarinejad L.; Tabibiazar M.; Lorenzo Rodríguez J. M.; Amarowicz R. Exploring the interactions between caffeic acid and human serum albumin using spectroscopic and molecular docking techniques. Pol. J. Food Nutr. Sci. 2021, 69. 10.31883/pjfns/133203. [DOI] [Google Scholar]
Associated Data
This section collects any data citations, data availability statements, or supplementary materials included in this article.