

Abstract

Accurate prediction of the phase inversion point (PIP) of crude oil emulsion (COE) will give important guiding significance to the mixed transportation technology during the crude oil mining process. The influence of water cut of a system on viscosity characteristics of the COE was studied by emulsification experiments with 16 kinds of crude oils having significant differences in physical properties. The results showed that under the condition of low water cut of a system, the crude oils can emulsify all the water to form stable W/O emulsions with apparent viscosities much higher than those of pure crude oils. When the water cut of a system exceeds a certain critical value, the crude oils have no ability to emulsify all water; instead, they are wrapped by a water phase and form unstable O/W emulsions, and their apparent viscosities decrease sharply compared with those of pure crude oils. The critical water cut of a system corresponding to the abrupt change of apparent viscosity of the COE is the PIP of the COE changing from the type of W/O to O/W. Furthermore, the apparent viscosities of stable W/O emulsions decrease with increasing shear rate and temperature and meanwhile increase dramatically with the increasing water cut of a system. The apparent viscosities of unstable O/W emulsions decrease with increasing shear rate, water cut of a system, and temperature and are far lower than those of pure crude oils. Four typical parameters were chose as the representation to describe the crude oil physical properties (COPPs), that is, the content of saturates, the content of aromatics, the content of surfactants, and the crude oil acid number. On the basis of the quantitative description of COPPs, a prediction model for the PIP of the COE was established. The results of model verification showed that the mean relative deviation of prediction results was 2.9%.
1. Introduction
During the exploitation of both offshore and onshore oilfields in the world, crude oil–water mixed transportation technology is widely used, which is an important method for gathering and transportation of the produced fluid. In the mixed transportation pipeline, the crude oil–water two-phase system tends to form an emulsion, which has an apparent effect on the flow characteristics of the multiphase flow.1−3 When the water cut of the system is low, the mixture of crude oil and water is completely emulsified and generally forms a stable W/O emulsion; however, when the water cut of the system exceeds a certain critical value, that is, phase inversion point (PIP), the original stable W/O emulsion will abruptly convert into an unstable O/W emulsion. Thereupon, after the phase inversion of the crude oil emulsion (COE) occurs, the viscosity characteristics of the COE and the hydraulic friction of the mixed transportation pipeline will be greatly reduced, thus affecting the pipeline flow characteristics.4−7
The PIP of the COE is an important parameter which plays a key guiding role in the oilfield exploitation and mixed transportation pipeline.8,9 For heavy oil transportation by the method of water mixing, one needs to accurately grasp the PIP of the heavy oil emulsion. The key of water mixing process design is to make a heavy oil–water system that forms an O/W emulsion so as to reduce viscosity and drag.10−12 In the oilfield gathering and transportation process, the addition of a flow improver can reduce the PIP of the COE so that the expectant O/W emulsion will be obtained even under low water cut of the system, thus reducing the viscosity of the COE and improving the gathering and transportation efficiency.13−16 In the production at an offshore oilfield, the phenomenon of emulsification damage often occurs. That is, when the water cut of a system is lower than the PIP, the viscosity of the stable W/O emulsion formed by the oil–water system increases significantly compared to that of the pure crude oil, which gives rise to an increase of tube lifting and submarine pipeline transportation resistance and thus affects the oilfield productivity.9,17−20 Mastering the phase inversion characteristics of the produced fluid can effectively reduce the productivity loss caused by emulsification problems.21,22 The shutdown and restart characteristics of the liquid produced from heavy oilfields are closely related to the PIP of the COE. Studies23−25 show that when the water cut of a system is lower than the PIP, it is more difficult to restart the pipeline with the water cut of the system increasing, whereas when the water cut of the system exceeds the PIP, the difficulty in pipeline restart decreases significantly. In terms of the dehydration treatment of crude oil, when the water cut of a system is lower than the PIP, water is wrapped by crude oil in the form of tiny droplets, and the system structure is stable, which is not conducive to thermal and electric dehydration, and the dehydration rate is also low; however, when the water cut of the system is higher than the PIP, the system structure becomes loose, and the rate of thermal and electric dehydration increases significantly.26−28
The value of the PIP of the COE is closely related to the crude oil physical properties (COPPs). Generally, the higher content of interfacial active components in crude oil, the stronger the emulsifying ability of crude oil, leading to a larger PIP of the COE.19,29−31 At present, the PIP of an COE is usually determined using experiments according to actual production needs. However, there is no universal prediction model for the PIP of a COE that has been published that is applicable to different crude oil–water systems. In this work, 16 kinds of crude oils having significant differences in physical properties were used to carry out emulsification experiments. The influence of water cut of a system on viscosity characteristics of the COE was studied, and the PIP of the COE was determined according to the abrupt change in viscosity characteristics of the COE. Furthermore, the representative parameters were selected to characterize the COPPs; then, a prediction model for the PIP of the COE on the basis of the quantitative description of COPPs was established.
2. Experimental Section
2.1. Experimental Materials
The emulsification experiments were carried out with 16 kinds of crude oils having significant differences in physical properties from different oilfields in China, which were the same as the crude oils used in our previous work.32 The crude oils are numbered #1–#16, respectively, and the physical properties are listed in Table 1. It should be noted that the content of surfactants in Table 1 refers to the sum of the content of resins, asphaltenes, waxes, and mechanical impurities. In addition, in order to not occupy extra space in the paper, the PIPs of the 16 COEs measured in the following experiments are also listed in Table 1. Herein, the prediction model of the PIP of the COE was established based on the oils #1–#12 as the research object, and oils #13–#16 were used to verify the proposed prediction model.
Table 1. COPPs of 16 Crude Oils.
| crude oils | #1 | #2 | #3 | #4 | #5 | #6 | #7 | #8 |
|---|---|---|---|---|---|---|---|---|
| density at 20 °C (kg/m3) | 856.8 | 868.5 | 891.9 | 882.1 | 889.9 | 879.2 | 870.4 | 861.7 |
| pour point (°C) | 12 | 8 | –5 | 13 | 26 | 6 | 34 | 20 |
| viscosity at 40 °C (mPa·s) | 32.20 | 23.60 | 173.50 | 76.00 | 176.00 | 12.52 | 72.50 | 15.05 |
| saturates (wt %) | 39.76 | 44.58 | 33.92 | 46.43 | 44.66 | 34.27 | 50.60 | 47.35 |
| aromatics (wt %) | 47.55 | 46.61 | 40.49 | 37.22 | 31.26 | 56.08 | 38.30 | 43.22 |
| resins (wt %) | 2.94 | 6.03 | 10.11 | 7.00 | 11.84 | 6.51 | 2.78 | 5.75 |
| asphaltenes (wt %) | 9.75 | 2.78 | 15.48 | 9.34 | 12.25 | 3.13 | 8.32 | 3.67 |
| waxes (wt %) | 3.84 | 8.86 | 2.55 | 5.94 | 11.19 | 2.73 | 10.06 | 5.25 |
| mechanical impurities (wt %) | 0.53 | 0.21 | 0.65 | 0.42 | 0.39 | 0.15 | 0.31 | 0.19 |
| surfactants (wt %) | 17.06 | 17.88 | 28.79 | 22.70 | 35.67 | 12.52 | 21.47 | 14.86 |
| acid number (mg KOH/g) | 0.45 | 0.38 | 0.56 | 0.49 | 0.62 | 0.25 | 0.27 | 0.29 |
| PIPs of COEs | 0.65 | 0.67 | 0.68 | 0.70 | 0.68 | 0.60 | 0.70 | 0.62 |
| crude oils | #9 | #10 | #11 | #12 | #13 | #14 | #15 | #16 |
|---|---|---|---|---|---|---|---|---|
| density at 20 °C (kg/m3) | 859.7 | 842.2 | 892.8 | 853.9 | 850.9 | 883.1 | 858.7 | 870.2 |
| pour point (°C) | 5 | 15 | 23 | 35 | 3 | 11 | 9 | 37 |
| viscosity at 40 °C (mPa·s) | 12.45 | 9.00 | 128.00 | 29.50 | 10.25 | 37.00 | 9.72 | 220.80 |
| saturates (wt %) | 38.09 | 41.30 | 45.83 | 55.96 | 39.34 | 48.12 | 35.14 | 63.42 |
| aromatics (wt %) | 51.45 | 52.92 | 35.39 | 37.50 | 54.35 | 43.60 | 59.34 | 23.72 |
| resins (wt %) | 6.41 | 3.54 | 13.44 | 4.55 | 2.31 | 0.87 | 1.33 | 5.49 |
| asphaltenes (wt %) | 4.05 | 2.24 | 5.33 | 1.99 | 4.00 | 7.41 | 4.19 | 7.37 |
| waxes (wt %) | 3.05 | 4.96 | 7.93 | 14.15 | 2.71 | 7.69 | 1.71 | 20.67 |
| mechanical impurities (wt %) | 0.14 | 0.08 | 0.36 | 0.11 | 0.47 | 0.35 | 0.27 | 0.55 |
| surfactants (wt %) | 13.65 | 10.82 | 27.06 | 20.80 | 9.49 | 16.32 | 7.50 | 34.08 |
| acid number (mg KOH/g) | 0.17 | 0.24 | 0.41 | 0.31 | 0.15 | 0.23 | 0.28 | 0.34 |
| PIPs of COEs | 0.60 | 0.60 | 0.72 | 0.70 | 0.60 | 0.65 | 0.55 | 0.70 |
Among the influences on the emulsification characteristics of the crude oil–water system, the COPPs play an absolutely dominant role, whereas compared with the COPPs, the salinity of the water phase plays a weaker secondary role. Therefore, this work is mainly devoted to investigating the effect of COPPs on the emulsification characteristics and phase inversion of the crude oil–water system. In order to ensure the uniqueness of experimental factors and experimental results are not affected by other factors, water used in the experiments is ultrapure water.
The density, pour point, mechanical impurity content, and acid number of the crude oils were measured according to the standards SY/T 0045-2008, ASTM D5853-17, ASTM D473-07, ASTM D664-11a, respectively. The oil viscosity was measured according to the ASTM D445-09 standard using a rotational rheometer (RheolabQC, Anton Paar, Austria). The contents of saturates, aromatics, resins, asphaltenes (SARA) of the crude oils were measured according to the ASTM D4124-09 standard by the SARA fractionation method. The content of waxes of crude oil was measured according to the ASTMD4419-90 standard by differential scanning calorimetry (DSC).
2.2. Experimental Method
2.2.1. Preparation of the Emulsion
The literature33 shows that when the COE was prepared under the experimental conditions of a stirring speed of 500 rpm, a stirring time of 10 min, and a temperature range of 40–50 °C, the viscosities of COEs prepared in the laboratory were very close to those of COEs sampled in oilfields, and such experimental conditions could be used as the basis for the preparation of the emulsion in the laboratory.
In this work, under the experimental conditions of a stirring speed of 500 rpm, a temperature range of 30–60 °C, and a stirring time of 10 min, an IKA agitator was used to mix the 16 crude oils and ultrapure water at different water cuts of the system to prepare emulsions. The definition of water cut is the volume fraction of the water phase in the crude oil–water system.
2.2.2. Determination of the Viscosity of the Stable W/O Emulsion
At low water cut of a system, crude oil and water will be fully mixed and completely emulsified to form a W/O emulsion with good static stability. The stable W/O emulsion is characterized by crude oil as the outer phase and water as the inner phase, whose stability ensures nonseparation between crude oil and water for a long time. The viscosity of the stable W/O emulsion was measured using a coaxial cylinder rheometer (Rheolab QC, Anton Paar, Austria) according to the ASTM D445-09 standard.
2.2.3. Determination of the Viscosity of the Unstable O/W Emulsion
At high water cut of a system, crude oil does not have the ability to emulsify all the water phase but is wrapped by water and then forms an unstable O/W emulsion. The unstable O/W emulsion is characterized by water as the outer phase and crude oil as the inner phase, whose instability ensures immediate separation of oil and water as soon as the external shear is removed. For this unstable O/W emulsion, the traditional coaxial cylindrical rheometer cannot measure its viscosity.34 In this work, the stirring viscometric method proposed in our previous study was applied to determine the apparent viscosities of unstable O/W emulsions. The details of the stirring viscometric apparatus and method for determining the apparent viscosities of unstable oil–water systems are all presented in our previous work.32 Some brief, necessary, and helpful information is given here.
As shown in Figure 1, the stirring viscometric apparatus includes the following parts: (a) a stirring power unit (IKA); (b) a stirring paddle (IKA); (c) a cylindrical water-jacketed stirring vessel; and (d) a circulating water bath (HAAKE).
Figure 1.
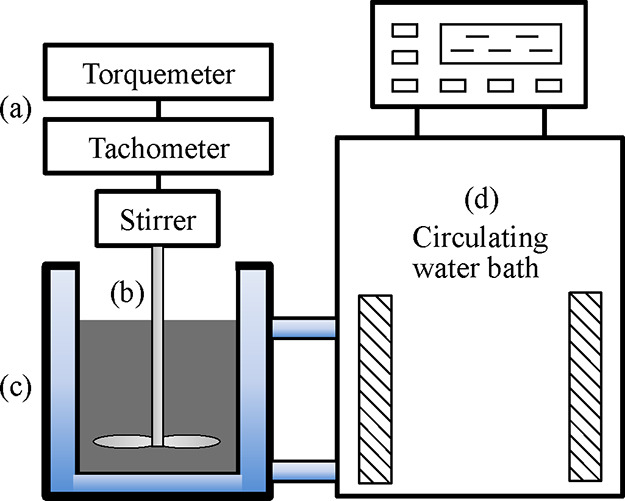
Stirring viscometric apparatus.
The method for determining the apparent viscosity of an unstable oil–water system is listed as follows:
-
(1)
During the stirred flow field, there is a certain functional relationship between the viscosity of the fluid being stirred and torque at a certain speed, that is, μ = f(M). In the equation, μ is the fluid viscosity and M is the stirring shaft torque. The specific function form can be determined by mixing a Newtonian fluid with known a viscosity during the experiment.
-
(2)
A large number of single-phase Newtonian fluids with different viscosities were used to calibrate the stirring viscometric device. First, the stirring torques of these single-phase Newtonian fluids at different stirring speeds were measured, and then, the correlations between the viscosities and stirring torques at different stirring speeds were determined by regression analysis of equation μ = f(M).
-
(3)
The unstable O/W emulsions were stirred at different preset speeds (speed range of 200–700 rpm), and the torque values during the mixing process were recorded. Then, the apparent viscosities of unstable O/W emulsions at corresponding stirring speeds were calculated by the regression equation μ = f(M).
-
(4)
Furthermore, eq 1 was able to calculate the shear rate corresponding to different stirring speeds35−37 so that the change in apparent viscosities of unstable O/W emulsions with the shear rate can be determined.
| 1 |
where  is the average shear rate, s–1; M is the stirring torque, N·m; V is the fluid volume, m3; and N is the
stirring speed, r/s.
is the average shear rate, s–1; M is the stirring torque, N·m; V is the fluid volume, m3; and N is the
stirring speed, r/s.
3. Results and Discussion
3.1. Relationship between Viscosity of COE and Water Cut of the System
With regard to oils #1–#12, the changes in apparent viscosities of COEs with water cuts of the system are shown in Figures 2 and 3.
Figure 2.

Changes in apparent viscosities of COEs with water cuts of the system (oils #1–#6).
Figure 3.

Changes in apparent viscosities of COEs with water cuts of the system (oils #7–#12).
According to Figures 2 and 3, when the water cut of a system is low, the apparent viscosities of the 12 COEs increase as water cut of the system increases, and the apparent viscosities increase more at a lower temperature. When the water cuts of a system exceed certain critical values, the apparent viscosities of the COEs decrease sharply.
Under the condition of low water cut of the system, the crude oils can emulsify all the water to form the stable W/O emulsions with apparent viscosities much higher than those of pure crude oils, which brings great challenges to pipeline flow assurance. However, under the condition of high water cut of the system, the crude oil has no ability to emulsify all the water; instead, it is wrapped by the water phase and forms an unstable O/W emulsion. In this case, crude oil is the internal phase and water is the external phase, accompanied by a sharp decline in the apparent viscosity, which is conducive to pipeline flow assurance.
According to our previous work,32 the apparent viscosity of the COE does not depend on the content of single surfactants such as resins, asphaltenes, waxes, and mechanical impurities but is closely related to the content of combinatorial surfactants, that is, the sum of the contents of resins, asphaltenes, waxes, and mechanical impurities. The apparent viscosity of the COE is affected by the overall synergistic effect of various surfactants in crude oil, that is, the apparent viscosity of the COE increases with the increasing content of combinatorial surfactants.
Obviously, the critical water cut of the system corresponding to the abrupt change in the apparent viscosities of the 12 COEs in Figures 2 and 3 is the PIP of each COE changing from the type of W/O to O/W. Taking oil #1 as an example, in the water cut range of 0.30–0.65, the apparent viscosities of stable W/O emulsions at different temperature increase rapidly as the water cut of the system increases. However, when the water cut of the system exceeds 0.65, the stable W/O emulsions abruptly turn into unstable O/W emulsions, accompanied by a sharp decrease in apparent viscosities. For oil #1, the PIP of the COE is 0.65. In general, for the 12 crude oils in Figures 2 and 3, their emulsions have different PIPs due to their different physical properties.
3.2. PIPs for Different COEs
According to the results of emulsification experiments, the PIPs of the 12 COEs are listed in Table 1. It indicates that there are differences in the PIPs of each COE, which indicates that the PIPs of COEs are closely related to the COPP. With regard to different crude oils, the compositions of saturates, aromatics, asphaltenes, resins, waxes, and so forth are different, resulting in different emulsifying characteristics, which lead to different PIPs of COEs.
3.3. Viscosity Characteristics of a Stable W/O Emulsion
Taking the PIPs as a boundary, the viscosity characteristics of the stable and unstable emulsions were investigated. Oils #1 and #2 and oils #3 and #4 are, respectively, used for illustration, and the changes in apparent viscosities of the stable W/O emulsions with temperature, shear rate, and water cut of the system are shown in Figures 4 and 5.
Figure 4.

Changes in apparent viscosities of stable W/O emulsions with temperature and shear rate.
Figure 5.

Changes in apparent viscosities of stable W/O emulsions with water cut of the system.
When the mixture of crude oil and water is completely emulsified and forms stable W/O emulsion, its viscosity increases significantly compared with that of pure crude oils. Figure 4 shows that the apparent viscosities of stable W/O emulsions under different shear rates decrease gradually with increasing temperature, that is, the apparent viscosities decrease greatly in the range of 30–50 °C, while the decreasing trends become gentle in the range of 50–60 °C. The apparent viscosities of the stable W/O emulsions decrease with increasing shear rate, which shows the feature of shear thinning. The higher content of asphaltenes, resins, waxes, and other interfacial active substances in crude oil will lead to a greater apparent viscosity and a stronger non-Newtonian property of the W/O emulsion, showing a more significant shear thinning effect. This agrees with the results from the previous work.36
Figure 5 shows that the apparent viscosities of stable W/O emulsions under different temperatures increase gradually as water cut of the system increases, that is, the apparent viscosities increase slowly in the lower water cut range of 0.30–0.40, while the increasing trends become significant in the higher water cut range of 0.40–0.60. As the internal phase of the W/O emulsion, a higher water content will produce massive droplets dispersed in crude oil and enhance the flow blocking effect of the emulsion system, resulting in a significant increase in viscosity. Moreover, with increasing temperature, the apparent viscosity–water cut curve gradually tends to be flat, and the increment in apparent viscosity gradually decreases.
3.4. Viscosity Characteristics of an Unstable O/W Emulsion
Oils #5–#10 are used for illustration, and the changes in apparent viscosities of unstable O/W emulsions with shear rate, water cut of the system, and temperature are, respectively, shown in Figures 6–8.
Figure 6.

Changes in apparent viscosities of unstable O/W emulsions with shear rate.
Figure 8.

Changes in apparent viscosities of unstable O/W emulsions with temperature.
When crude oil mixes with water to form an unstable O/W emulsion, water acts as an external phase surrounding all crude oil, resulting in a lower apparent viscosity than that of pure crude oil. Figure 6 shows that the apparent viscosities of unstable O/W emulsions under different water cuts of the system decrease gradually with increasing shear rate, which also presents the feature of shear thinning. Moreover, with the increase in water cut of the system, this shear thinning feature decreases gradually. Figures 7 and 8 show that the apparent viscosities of unstable O/W emulsions under different temperatures and different water cuts decrease as the water cut of the system and temperature increase. Moreover, with an increase in temperature and water cut of the system, the curves of apparent viscosity–water cut and apparent viscosity–temperature become gentle, and the amplitude of variation of the apparent viscosity of the unstable O/W emulsion gradually decreases.
Figure 7.

Changes in apparent viscosities of unstable O/W emulsions with water cut of the system.
4. Modeling of the PIP of the COE
The emulsification characteristics and PIP of the COE are closely related to the COPP. Four parameters affecting the emulsification characteristics were chose to characterize the COPP as follows: (1) the content of saturates (csat) and content of aromatics (caro) are used to characterize the components of hydrocarbons that make up the majority of crude oil; (2) the content of surfactants (csur) refers to the sum of resin content, asphaltene content, wax content, and mechanical impurity content, which is used to characterize various interfacial active substances in crude oil that determine the emulsifying properties; and (3) the crude oil acid number (caci) is used to characterize acidic compounds in crude oil that have an important influence on emulsifying properties.38
Then, the prediction model of the PIP of the COE based on the quantitative analysis of the COPP was established by the mathematical statistics method. The correlation between the PIP of the COE and the representative parameters of the COPP can be shown as follows:
| 2 |
where m0–m4 are regression parameters.
Logarithmic transformation of eq 2 can be obtained
| 3 |
Assuming y = lg φinv, x1 = lg csat, x2 = lg caro, x3 = lg csur, and x4 = lg caci, eq 3 is transformed into
| 4 |
Using the emulsifying experimental data of oils #1–#12, the multiple linear regression performed on eqs 4 and 5 is obtained
| 5 |
After the above correlation is obtained, the test of null hypothesis is carried out to check whether there is an obvious linearity between dependent variable y and independent variable xi (i = 1,2,...,4). According to eq 4, if m1 = m2 = ··· = m4 = 0, there is no linearity between y and xi. Thus, in order to check whether there exists linearity between y and xi, the corresponding null hypothesis is as follows:
In mathematical statistics, the above null hypothesis needs to be verified by the F-test to check whether this hypothesis is valid under the significance level α = 0.05. The statistic expressions are
| 6 |
where
| 7 |
| 8 |
where Sse is the
error sum of squares, Ssr is the regression
sum of squares, nind is the independent
variable number, nsam is the sample size,  is the dependent variable estimated value, yi is the dependent variable
observed value, and y̅ is the dependent variable
average value.
is the dependent variable estimated value, yi is the dependent variable
observed value, and y̅ is the dependent variable
average value.
If  , one should reject H0 or else accept H0.
In this case, there are as follows:
| 9 |
| 10 |
| 11 |
| 12 |
| 13 |
According to the F distribution table,  . Since F > F0.95(4,7), H0 is
rejected,
that is, y and xi (i = 1, 2, ..., 4) has a significant linear
relationship. Therefore, eq 2 has high significance and can be used to describe the relationship
between dependent variables and independent variables.
. Since F > F0.95(4,7), H0 is
rejected,
that is, y and xi (i = 1, 2, ..., 4) has a significant linear
relationship. Therefore, eq 2 has high significance and can be used to describe the relationship
between dependent variables and independent variables.
By mathematical transformation of eq 5, the correlation between the PIP of the COE and the COPP was obtained as follows:
| 14 |
The PIPs of the 12 COEs were calculated by eq 14 and compared with the measured PIPs of each COE, as shown in Figure 9. The relative deviation between the calculated values of PIPs according to eq 14 and the measured values of PIPs is shown in Figure 10. The mean relative deviation (MRD) of regression is 2.3%.
Figure 9.

Comparison between the calculated PIP and measured PIP.
Figure 10.

Relative deviation of the calculated PIP by the proposed model.
According to eq 14, the content of csat, caro, csur, and caci is positively correlated with the PIP of the COE, which indicates that higher values of csat, caro, csur, and caci lead to a larger PIP of the COE. In addition, the values of exponents in eq 14 can be used to qualitatively evaluate the significance of the influence of the independent variables on the dependent variable, with a higher value resulting in a more significant influence. According to the value of exponents in eq 14, it can be deduced that the influence of the four parameters on the PIP of the COE can be ranked as follows: caro > csat > csur > caci.
5. PIP Model Validation
The new oils #13–#16 were used to validate the above-proposed model. The changes in apparent viscosities of COEs for oils #13–#16 with water cuts of the system are shown in Figure 11. The four new crude oils used to validate the proposed model also have different PIPs in their emulsions because of their differentiated physical properties.
Figure 11.

Changes in apparent viscosities of COEs with water cuts of the system (oils #13–#16).
The PIPs of the four new COEs were calculated by the proposed model, that is, eq 14, and compared with the measured PIPs of each COE, as shown in Figure 12, and the detailed results of the model validation are listed in Table 2.
Figure 12.

Comparison between calculated values and measured values of PIPs for #13–#16 COEs.
Table 2. Validation Results of the Proposed PIP Model.
| oils | measured values of PIPs | calculated values of PIPs | relative deviation (%) | MRD (%) |
|---|---|---|---|---|
| #13 | 0.60 | 0.574 | 4.4 | 2.9 |
| #14 | 0.65 | 0.667 | 2.6 | |
| #15 | 0.55 | 0.538 | 2.3 | |
| #16 | 0.70 | 0.715 | 2.1 |
The MRD between the calculated values and measured values of PIPs is 2.9%, showing good predictive accuracy. The proposed PIP model can effectively predict the PIPs of different crude oil–water mixture systems, which can be further applied in the process design for petroleum development.
6. Conclusions
This study draws the following conclusions:
-
(1)
Under the condition of low water cut of the system, crude oils have the ability to emulsify all the water to form the stable W/O emulsions with apparent viscosities much higher than those of pure crude oils. However, when the water cut of the system exceeds a certain critical value, the crude oils have no ability to emulsify all the water; instead, they are wrapped by the water phase and form the unstable O/W emulsions, and their apparent viscosities decrease sharply. The critical water cut of the system corresponding to the abrupt change in apparent viscosity of the COE is the PIP of the COE changing from the type of W/O to O/W.
-
(2)
The apparent viscosity of the COE is affected by the overall synergistic effect of various surfactants in crude oil, that is, the apparent viscosity of the COE increases with the increasing content of combinatorial surfactants (i.e., the sum of the contents of resins, asphaltenes, waxes, and mechanical impurities).
-
(3)
The apparent viscosities of the stable W/O emulsions under the condition of low water cut of the system decrease gradually as the shear rate and temperature increase and increase dramatically as water cut of the system increases. The apparent viscosities of the unstable O/W emulsions at high water cut of system are much lower than those of pure crude oils and decrease as the shear rate, water cut of system, and temperature increase. Both W/O and O/W emulsions show the feature of shear thinning.
-
(4)
The PIP of the COE is closely related to the COPP. Four representative parameters affecting the emulsification characteristics were selected to characterize the COPP, that is, the content of saturates (csat), the content of aromatics (caro), the content of surfactants (csur), and the crude oil acid number (caci).
-
(5)
On the basis of quantitative analysis of the COPP, a prediction model for the PIP of the COE was established. The expression is as follows:
According to the proposed model, the contents of csat, caro, csur, and caci are positively correlated with the PIP of the COE, which indicates that higher values of csat, caro, csur, and caci lead to a larger PIP of the COE. The influence of the four parameters on the PIP of the COE can be ranked as follows: caro > csat > csur > caci. The proposed model can be used to predict PIP values of crude oil–water systems with different COPPs. The validation results of the model showed that the MRD between the calculated and measured values of PIPs is 2.9%, which has a good prediction accuracy.
Acknowledgments
This work presented in this paper was financially supported by the National Natural Science Foundation of China (grant nos. 52004071 and 52174060), the Science and Technology Project of Maoming City (grant nos. 210406224552646 and 220420204551838), and the Talent Scientific Research Fund of Guangdong University of Petrochemical Technology (grant no. 2018rc14).
Glossary
Nomenclature
- PIP
phase inversion point
- COE
crude oil emulsion
- COPPs
crude oil physical properties
- MRD
mean relative deviation
- SARA
saturates, aromatics, resins, asphaltenes
- DSC
differential scanning calorimetry
- μ
fluid viscosity
- M
stirring torque

average shear rate
- V
fluid volume
- N
stirring speed
- csat
content of saturates
- caro
content of aromatics
- csur
content of surfactants
- caci
crude oil acid number
- φinv
the phase inversion point of crude oil emulsion
- m0, m1, m2, m3, m4
undetermined parameters
- x
independent variable
- y
dependent variable
- Sse
error sum of squares
- Ssr
regression sum of squares
- nind
independent variables number
- nsam
sample size

dependent variable estimated value
- yi
dependent variable observed value
- y̅
dependent variable average value
The authors declare no competing financial interest.
References
- Hassanzadeh M.; Tayebi L.; Dezfouli H. Investigation of factors affecting on viscosity reduction of sludge from Iranian crude oil storage tanks. Pet. Sci. 2018, 15, 634–643. 10.1007/s12182-018-0247-9. [DOI] [Google Scholar]
- Muriel D. F.; Katz J. Time evolution and effect of dispersant on the morphology and viscosity of water-in-crude-oil emulsions. Langmuir 2021, 37, 1725–1742. 10.1021/acs.langmuir.0c02986. [DOI] [PubMed] [Google Scholar]
- Wen J.; Luo H.; Ai G. Prediction model between emulsified water fractions and physicochemical properties of crude oil based on the exergy loss rate. ACS Omega 2021, 6, 21586–21594. 10.1021/acsomega.1c02819. [DOI] [PMC free article] [PubMed] [Google Scholar]
- Barrabino A.; Keleşoğlu S.; Sørland G. H.; Simon S.; Sjöblom J. Phase inversion in emulsions studied by low field NMR. Colloids Surf., A 2014, 443, 368–376. 10.1016/j.colsurfa.2013.11.016. [DOI] [Google Scholar]
- Hapanowicz J. Phase inversion in liquid-liquid pipe flow. Flow Meas. Instrum. 2010, 21, 284–291. 10.1016/j.flowmeasinst.2010.03.001. [DOI] [Google Scholar]
- Colmanetti A. R. A.; de Castro M. S.; Barbosa M. C.; Rodriguez O. M. H. Phase inversion phenomena in vertical three-phase flow: Experimental study on the influence of fluids viscosity, duct geometry and gas flow rate. Chem. Eng. Sci. 2018, 189, 245–259. 10.1016/j.ces.2018.05.050. [DOI] [Google Scholar]
- Zhong H.; He Y.; Yang E.; Bi Y.; Yang T. Modeling of microflow during viscoelastic polymer flooding in heterogenous reservoirs of Daqing Oilfield. J. Pet. Sci. Eng. 2022, 210, 110091. 10.1016/j.petrol.2021.110091. [DOI] [Google Scholar]
- Plasencia J.; Pettersen B.; Nydal O. J. Pipe flow of water-in-crude oil emulsions: Effective viscosity, inversion point and droplet size distribution. J. Pet. Sci. Eng. 2013, 101, 35–43. 10.1016/j.petrol.2012.11.009. [DOI] [Google Scholar]
- Wang Z.; Bai Y.; Zhang H.; Liu Y. Investigation on gelation nucleation kinetics of waxy crude oil emulsions by their thermal behavior. J. Pet. Sci. Eng. 2019, 181, 106230. 10.1016/j.petrol.2019.106230. [DOI] [Google Scholar]
- Perazzo A.; Preziosi V.; Guido S. Phase inversion emulsification: Current understanding and applications. Adv. Colloid Interface Sci. 2015, 222, 581–599. 10.1016/j.cis.2015.01.001. [DOI] [PubMed] [Google Scholar]
- Galindo-Alvarez J.; Sadtler V.; Choplin L.; Salager J. L. Viscous oil emulsification by catastrophic phase inversion: influence of oil viscosity and process conditions. Ind. Eng. Chem. Res. 2011, 50, 5575–5583. 10.1021/ie102224k. [DOI] [Google Scholar]
- Tan J.; Luo P.; Vahaji S.; Jing J.; Hu H.; Yu B.; Tu J. Experimental investigation on phase inversion point and flow characteristics of heavy crude oil-water flow. Appl. Therm. Eng. 2020, 180, 115777. 10.1016/j.applthermaleng.2020.115777. [DOI] [Google Scholar]
- Wang X.; Han H. An experimental study of reducing phase inversion point of water cut crude oil using flow improver. Oilfield Chem. 2008, 25, 186–188. [Google Scholar]
- Meriem-Benziane M.; Abdul-Wahab S. A.; Benaicha M.; Belhadri M. Investigating the rheological properties of light crude oil and the characteristics of its emulsions in order to improve pipeline flow. Fuel 2012, 95, 97–107. 10.1016/j.fuel.2011.10.007. [DOI] [Google Scholar]
- Coussirat V.; Amarilla F.; Peruzzo P. J.; Cortizo M. S. Dioctyl fumarate-co-vinyl benzoate copolymers preparation and their performance as flow improvers in waxy crude oils. J. Pet. Sci. Eng. 2019, 182, 106290. 10.1016/j.petrol.2019.106290. [DOI] [Google Scholar]
- Wang Z.; Liu X.; Zhang H.; Wang Y.; Xu Y.; Peng B.; Liu Y. Modeling of kinetic characteristics of alkaline-surfactant-polymer-strengthened foams decay under ultrasonic standing wave. Pet. Sci. 2022, 19, 1825–1839. 10.1016/j.petsci.2022.04.012. [DOI] [Google Scholar]
- Yao Z.; Zhang Y.; Zheng Y.; Xing C.; Hu Y. Enhance flows of waxy crude oil in offshore petroleum pipeline: A review. J. Pet. Sci. Eng. 2022, 208, 109530. 10.1016/j.petrol.2021.109530. [DOI] [Google Scholar]
- Liu J.; Zhong L.; Hao T.; Ren L.; Liu Y. A collaborative emulsification system capable of forming stable small droplets of oil-in-water emulsions for enhancing heavy oil recovery. J. Mol. Liq. 2022, 355, 118970. 10.1016/j.molliq.2022.118970. [DOI] [Google Scholar]
- Kumar S.; Mahto V. Emulsification of Indian heavy crude oil in water for its efficient transportation through offshore pipelines. Chem. Eng. Res. Des. 2016, 115, 34–43. 10.1016/j.cherd.2016.09.017. [DOI] [Google Scholar]
- Wen J.; Luo H.; Long Z. Emulsification behaviors of crude oil-water system and its quantitative relationship with exergy loss rate. J. Pet. Sci. Eng. 2019, 176, 502–508. 10.1016/j.petrol.2019.01.082. [DOI] [Google Scholar]
- Wen J.; Zhang J.; Wei M. Effective viscosity prediction of crude oil-water mixtures with high water fraction. J. Pet. Sci. Eng. 2016, 147, 760–770. 10.1016/j.petrol.2016.09.052. [DOI] [Google Scholar]
- Wen J.; Zhang J.; Wang Z.; Zhang Z.; Zheng F.; Zhu Y.; Han S. Full and partial emulsification of crude oil-water systems as a function of shear intensity, water fraction, and temperature. Ind. Eng. Chem. Res. 2014, 53, 9513–9520. 10.1021/ie501185s. [DOI] [Google Scholar]
- Sun G.; Zhang J.; Ma C.; Wang X. Start-up flow behavior of pipelines transporting waxy crude oil emulsion. J. Pet. Sci. Eng. 2016, 147, 746–755. 10.1016/j.petrol.2016.10.007. [DOI] [Google Scholar]
- Chala G. T.; Sulaiman S. A.; Japper-Jaafar A. Flow start-up and transportation of waxy crude oil in pipelines-A review. J. Non-Newtonian Fluid Mech. 2018, 251, 69–87. 10.1016/j.jnnfm.2017.11.008. [DOI] [Google Scholar]
- Kakitani C.; Marques D. C.; Teixeira A.; Valim L.; Marcelino Neto M. A. M.; Sum A. K.; Morales R. E. Experimental characterization of hydrate formation in non-emulsifying systems upon shut-in and restart conditions. Fuel 2022, 307, 121690. 10.1016/j.fuel.2021.121690. [DOI] [Google Scholar]
- Liu Y.; Lu H.; Li Y.; Xu H.; Pan Z.; Dai P.; Wang H.; Yang Q. A review of treatment technologies for produced water in offshore oil and gas fields. Sci. Total Environ. 2021, 775, 145485. 10.1016/j.scitotenv.2021.145485. [DOI] [PubMed] [Google Scholar]
- Amakiri K. T.; Canon A. R.; Molinari M.; Angelis-Dimakis A. Review of oilfield produced water treatment technologies. Chemosphere 2022, 298, 134064. 10.1016/j.chemosphere.2022.134064. [DOI] [PubMed] [Google Scholar]
- Romanova Y. N.; Maryutina T. A.; Musina N. S.; Spivakov B. Y. Application of ultrasonic treatment for demulsification of stable water-in-oil emulsions. J. Pet. Sci. Eng. 2022, 209, 109977. 10.1016/j.petrol.2021.109977. [DOI] [Google Scholar]
- Pu W.; He M.; Yang X.; Liu R.; Shen C. Experimental study on the key influencing factors of phase inversion and stability of heavy oil emulsion: Asphaltene, resin and petroleum acid. Fuel 2022, 311, 122631. 10.1016/j.fuel.2021.122631. [DOI] [Google Scholar]
- Wang X.; Zhang H.; Liang X.; Shi L.; Chen M.; Wang X.; Liu W.; Ye Z. New amphiphilic macromolecule as viscosity reducer with both asphaltene dispersion and emulsifying capacity for offshore heavy oil. Energy Fuels 2021, 35, 1143–1151. 10.1021/acs.energyfuels.0c03256. [DOI] [Google Scholar]
- Wang Z.; Liu H.; Zhang Z.; Sun B.; Zhang J.; Lou W. Research on the effects of liquid viscosity on droplet size in vertical gas-liquid annular flows. Chem. Eng. Sci. 2020, 220, 115621. 10.1016/j.ces.2020.115621. [DOI] [Google Scholar]
- Luo H.; Wen J.; Lv C.; Wang Z. Modeling of viscosity of unstable crude oil-water mixture by characterization of energy consumption and crude oil physical properties. J. Pet. Sci. Eng. 2022, 212, 110222. 10.1016/j.petrol.2022.110222. [DOI] [Google Scholar]
- Huang Q.; Zhang F.; Zhang J.; Wang M.; Bai D. Research on preparation condition of water emulsion for crude oil. Oil Gas Storage Transp. 2007, 26, 49–51. [Google Scholar]
- Zhao J.; Xi X.; Dong H.; Wang Z.; Zhuo Z. Rheo-microscopy in situ synchronous measurement of shearing thinning behaviors of waxy crude oil. Fuel 2022, 323, 124427. 10.1016/j.fuel.2022.124427. [DOI] [Google Scholar]
- Yang F.; Chen J.; Yao B.; Li C.; Sun G. Effects of EVA additive dosage on rheolegical properties of asphaltenic waxy oils. Acta Pet. Sin. 2021, 37, 572–583. [Google Scholar]
- Wang Z.; Xu Y.; Gan Y.; Han X.; Liu W.; Xin H. Micromechanism of partially hydrolyzed polyacrylamide molecule agglomeration morphology and its impact on the stability of crude oil–water interfacial film. J. Pet. Sci. Eng. 2022, 214, 110492. 10.1016/j.petrol.2022.110492. [DOI] [Google Scholar]
- Zhu C.; Liu X.; Xu Y.; Liu W.; Wang Z. Determination of boundary temperature and intelligent control scheme for heavy oil field gathering and transportation system. J. Pipeline Sci. Eng. 2021, 1, 407–418. 10.1016/j.jpse.2021.09.007. [DOI] [Google Scholar]
- Yang W.; Fu C.; Du Y.; Xu K.; Balhoff M. T.; Weston J.; Lu J. Dynamic contact angle reformulates pore-scale fluid-fluid displacement at ultralow interfacial tension. SPE J. 2021, 26, 1278–1289. 10.2118/204459-pa. [DOI] [Google Scholar]