

Abstract
Nb/starch-doped ZnO quantum dots (QDs) were prepared by a coprecipitation route. A fixed quantity of starch (st) and different concentrations (2 and 4%) of niobium (Nb) were doped in a ZnO lattice. To gain a better understanding of synthesized nanostructures, a systematic study was carried out utilizing several characterization methods. The goal of this research was to undertake methylene blue (MB) dye degradation with a synthetic material and also study its antibacterial properties. The phase structure, morphology, functional groups, optical properties, and elemental compositions of synthesized samples were investigated. Our study showed that ZnO QDs enhanced photocatalytic activity (PCA), resulting in effective MB degradation, in addition to showing good antimicrobial activity against Gram-negative relative to Gram-positive bacteria. Molecular docking study findings were in good agreement with the observed in vitro bactericidal potential and suggested ZnO, st-ZnO, and Nb/st-ZnO as possible inhibitors against dihydrofolate reductase (DHFRE. coli) and DNA gyraseE. coli.
1. Introduction
Due to massive growth in chemical industry, increasingly large amounts of resistant dye effluent are being released in water resources, causing significant ecological issues. Dye-contaminated wastewater not only changes the marine environment and wipes out aquatic life, but it also has a negative impact on people’s well-being and health. Therefore, figuring out how to efficiently degrade dye-polluted wastewater is a huge challenge that draws a lot of interest from researchers worldwide.1 The importance of clean water to mankind cannot be overstated. All industrial, domestic, and commercial operations require water as a basic requirement. Traditional wastewater management (chlorination, filtration, reverse osmosis desalination, etc.) has serious constraints such as inadequate decontamination or high associated expenses.2 Depending on the process, wastewater produced from different processes contains a broad range of pollutants. These effluents are sometimes highly colored and polluted with suspended organic compounds and dissolved salts, in addition to various other recalcitrant compounds.3 Among advanced oxidation processes (AOPs), heterogeneous photocatalysis is a promising method that can degrade various organic contaminants in water/wastewater. Various inorganic semiconductors such as ZnO, TiO2, and WO2, were investigated as photocatalysts.4 Because of its unique features, ZnO recently emerged as a dominant, effective, and promising contender in clean environmental management systems using photocatalysis. It constitutes large free-exciton binding energy (60 meV), powerful oxidizing ability, direct/wider band gap (Eg) 3.37 eV in near-UV spectra region, and excellent photocatalytic activity. ZnO is utilized in ceramic bodies, catalysis, polymer and paint factories, pesticides, and beauty products as an essential semiconductor material due to faster response times, lower detection limits, and more stable sensing signals.5 As ZnO and TiO2 have similar band-gap energies, their photocatalytic capacity should be comparable. Furthermore, TiO2 is more expensive than ZnO, which makes TiO2 unsuitable for large-scale water treatment processes.6 ZnO nanostructures are promising antimicrobial candidates due to their stability and low toxicity, as well as their potent antimicrobial properties.7 To demonstrate good antibacterial activity, dielectric properties, and UV absorbance, ZnO nanostructures have been combined with starch, methylcellulose (MC), acrylic binder, chitosan, alginate, and polyimide.8 Many scientists have focused on starches, which are the most abundant, inexpensive, and easily accessible of these natural materials. Corn, wheat, and rice are the most common sources of starch, which are available in the forms of amylose and amylopectin.9 Amylose is available at levels up to 25% contingent on the source with a low molecular weight that varies between 10,000 and 60,000 g mol–1. Amylopectin is present at levels up to 95% and it has a high molecular weight somewhere in the range of 50,000 and 107 g/mol.10 Since starches are incompatible with many applications, they are adjusted to improve their properties and minimize their flaws.11 Due to its renewability, biodegradability, and low cost, starch has attracted interest in wastewater treatment.12 For doping, elements like aluminum,13 indium,14 copper,15 cobalt,16 and nickel17−19 have been used. It is stated that such doping can boost the properties of ZnO for photocatalytic applications (i.e., band gap, light absorption range, and resistivity). It is worth noting that Nb doping in ZnO has not been studied commonly. Doping of Nb is an appealing choice since the valance difference between Nb5+ and Zn2+ is 3, allowing every Nb atom to donate several electrons to change electrical conductivity.20 Previously, Nb-doped TiO2 nanostructures were reported for their potential to degrade harmful organic molecules in a few papers.21 Only Kruefu et al. claimed that adding Nb increased the photodegradation of phenol by Nb/ZnO powders produced by flame spray pyrolysis.22
Mastitis is an inflammatory disease of the udder evidenced by biochemical, microbiological, and physical variations in milk, as well as pathological processes in the glandular parts of udder.23,24 Mastitis is associated with bacterial, viral, and fungal microorganisms, and among these, bacteria are the most significant. These are classified as primary and secondary etiologies. Primary etiologies include Streptococci, Staphylococcus aureus, Corynebacterium pyogenes, and Escherichia coli, while secondary pathogens include Corynebacterium bovis and coagulase negative Staphylococci.(25) Due to its role as a precursor in the production of nucleic acids and proteins, the DHFR enzyme targets various anticancer and antimicrobial medicines and is of significant interest in medicinal chemistry.26,27 DHFR acts by inhibiting the synthesis of DNA, RNA, and amino acids, hence arresting cell proliferation.28,29 Additionally, DNA gyrase is a class II topoisomerase that facilitates changes in the DNA helix.30 It also contains two chains, GyrA and GyrB, which are required for transiently splitting two DNA strands and introducing a negative superhelical into DNA during replication. Substances that target DNA gyrase exert their antimicrobial action in two ways: by poisoning the gyrase, as Ciprofloxacin does, or by halting the ATP binding site, as Novobiocin does, and due to its previously significant function, it has become a potential target for antimicrobial drug discovery.31 Thus, DHFR and DNA topoisomerases have a track record of demonstrating their use in the treatment of microbial illnesses and cancer.32,33 Additionally, since the microbial DHFR is distinct from the human enzyme, it has been identified as a therapeutic target for blocking DNA synthesis in bacteria specifically.34
Consequently, investigating the effectiveness and tuning of photocatalytic capabilities of ZnO by doping with Nb and determining the optimum quantity for maximum photodegradation efficiency appear to be advantageous. In this study, a coprecipitation technique was employed to create Nb/st-doped ZnO nanostructures with photocatalytic activity. The effects of Nb concentrations on sample surface morphology and photocatalytic response were investigated. To rationalize the mechanism behind the bactericidal potential of synthesized nanocomposites, we performed molecular docking studies against dihydrofolate reductase and DNA gyrase enzyme from E. coli.
2. Materials and Methods
2.1. Materials
Zn(NO3)2·6H2O, 98%; NaOH, 98%; and starch (99.6%) were procured from Sigma-Aldrich. Alfa Aesar supplied niobium (V) chloride (NbCl5, 99%). Analytical-grade chemicals were used in the experiment.
2.2. Synthesis of Nb/st-Doped ZnO
ZnO and Nb/st-ZnO QDs were prepared by Zn(NO3)2·6H2O, starch, NaOH, and NbCl5. To start, 100 mL of distilled water was taken to dissolve Zn(NO3)2·6H2O. In the colloidal solution, a precise concentration of prepared starch was poured. Furthermore, various concentrations of Nb (2 and 4%) were added to the above-mixed solution while it was vigorously stirred. To maintain the pH, 0.5 M NaOH was added drop by drop to the aqueous solution while being stirred continuously at 80 °C for 30 min. The mixture was centrifuged (7000 rpm, 6min) to remove residuals. To obtain fine powder, precipitates were dried at 300 °C for 2 h (Figure S1). Without doping materials (Nb, St), a similar method was used to fabricate pure ZnO nanostructures. Further, a fixed amount of starch and distilled water was poured into a beaker and stirred for 4 h at 300 °C on a hot plate; the internal temperature of the beaker was ∼180 °C as a control sample. Finally, the powdered product was stored in airtight desiccators after drying.
2.3. Evaluation of Photocatalytic Properties
MB was utilized as an organic contaminant in this research. The photocatalytic properties of all synthesized materials were determined in visible light irradiation.35 Under visible light (mercury vapor lamp, 400 W, typically λ = 400–700 nm), photocatalytic potential of ZnO particles was determined by calculating the photocatalytic degradation of MB in water.36 At various visible exposure periods or intervals, the MB solution was aliquoted, and variations in concentration were assessed using UV–visible spectrometry to measure the strength of the MB absorbance peak toward 664 nm.37 To ensure that our data were reliable, we repeated all tests three to five times. The degrading efficiency (% D)17 was computed using the formula below, where C0 represents the starting MB concentration and Ct represents the dye concentration (in a given time interval) after irradiation
| 1 |
2.4. Mechanism of Photocatalysis
When solar radiation with photon energy (hυ) same or larger than excited energy photo-induces ZnO, electrons in the valence band are moved to an unoccupied conduction band. Electron–hole pairs (e–/h+) are formed by this mechanism. e–/h+ pairs have the ability to move to the surface of ZnO and then participate in redox processes where H+ combines with hydroxide ions and water to form hydroxyl radicals, and e interacts with oxygen (O) to form a superoxide radical anion and ultimately hydrogen peroxide. Hydroxyl radicals are formed when hydrogen peroxide reacts with superoxide radicals. The contaminants absorbed on the surface of ZnO are attacked next by these hydroxyl radicals (powerful oxidizing agents), producing intermediary chemicals quickly. The photocatalytic activity was found to be reduced when the concentration of st was introduced. This may be because the st functions as a recombination center, which could induce a decrease in degradation efficiency by delaying the cycle of other reactions; the addition of Nb in st-ZnO again increases the photodegradation efficiency of MB dye by segregating charge carriers (Figure 1). Green molecules like mineral acids, CO2, and H2O will eventually be produced from intermediates. When compared to TiO2, ZnO has been proven to have a higher absorbing rate across a greater portion of solar spectra. A catalyst’s photo activity is determined by its capability to produce photogenerated electron–hole pairs. The fast electron–hole recombining rate of photogenerated e–/h+ pairs, which perturbs photodegradation activity, is the fundamental restriction of ZnO as a photocatalyst. It has also been highlighted that the optical absorption capability of ZnO, which was linked to its wide energy band gap, affects its solar energy conversion performance.38,39
Figure 1.

Photocatalysis mechanism of Nb/st-ZnO nanostructures.
2.5. Radical Scavenging Assay (DPPH)
To assess the free radical active species and antioxidant activity of the products, the standard DPPH scavenging experiment was adopted with certain modifications. Pristine ZnO nanoparticles and Nb/st-doped ZnO nanoparticles (0–500 g/mL) were combined with an equivalent amount of (0.1 mM) DPPH solution. It was vortexed and incubated for 30 min at room temperature in the dark after being prepared. A standard ascorbic acid solution was used as the reference sample since it is a strong antioxidant. The degradation in λmax of the DPPH solution (λ = 517 nm) was employed to calculate the scavenging rate (%) of each sample, eq 2
| 2 |
where A0 and A1 = control absorbance and standard absorbance, respectively.
2.6. Isolation and Identification of Bacteria
Milk (ovine) specimens were collected from several farms and tested with surf field mastitis. Gram-negative (E. coli) and Gram-positive (S. aureus) incubated samples were patterned with MacConkey agar (MA) and Mannitol salt agar (MSA), respectively (pH = 7). Catalase, coagulase tests, and Gram staining analysis were used to identify the characteristic colonies.
2.7. Antibacterial Activity
Employing an agar well diffusion approach, the bactericidal activity of synthesized QDs was tested by wiping (1.5 × 10⁸ CFU/mL) Gram +ve (S. aureus, MSA) and Gram −ve (E. coli, MA) bacteria. On swabbed (MSA, MA) Petri dishes, wells (6 mm) were formed by a sterile borer. Different quantities of Nb/st-ZnO QDs (∼0.5 mg/0.05 mL), (∼1.0 mg/0.05 mL) were employed as least and maximum concentrations in contrast to −ve (deionized (DI) water) 0.05 mL and +ve (ciprofloxacin) 0.005 mg/0.05 mL control, respectively. Furthermore, prepared dosage-contained dishes were invaded for almost 24 h (37 °C), and antibacterial performance of QDs was assessed using a Vernier caliper to measure the inhibitory zone diameter (Figure S2).
2.8. Statistical Analysis
Through SPSS 23, one-way variance analysis (ANOVA-1) was employed to estimate antibacterial efficiency as measured by the diameter of the inhibitory zone (mm).
2.9. Molecular Docking Studies
The synthesized nanocomposites alongside pristine ZnO nanoparticles were evaluated for their binding tendency against selected enzyme targets. The binding capacity of pristine ZnO, st-ZnO NPs, and Nb/st-ZnO NPs were compared with ciprofloxacin (standard antibiotic). Owing to the better bactericidal activity of synthesized NPs against E. coli, here, we selected dihydrofolate reductase (DHFR) and DNA gyrase from E. coli and evaluated the binding potential inside their active pocket. The structural coordinates of selected enzyme targets were obtained from protein data bank having accession codes 2ANQ (Res: 2.13 Å)40 and 6KZX (Res: 2.1 Å)41 for DHFRE. coli and DNA gyraseE. coli, respectively.
Molecular docking studies were performed using ICM version 3.8–7d (Molsoft L.L.C., La Jolla, CA),42 where protein structures were prepared using standard protocol, i.e., (i) energy minimization (using the default force field), (ii) addition of H-atoms and gastegier charges, and (iii) removal of the native ligand and H2O molecules. The three-dimensional (3D) structures of nanocomposites were modeled by modifying the structure retrieved from PubChem using the ligedit tool of ICM and later optimized. The docking position was specified using a grid box with 5 Å vicinity of the native ligand and synthesized nanocomposites were docked into an active pocket. Overall, 10 best-docked conformations were generated in each case (Figure 2a,b).
Figure 2.

(a) 3D-structural representation of synthesized nanocomposites, ciprofloxacin, and native ligand binding inside active pocket of DHFRE. coli. (b) 3D-structural representation of synthesized nanocomposites, ciprofloxacin, and native ligand binding inside active pocket of DNA gyraseE. coli.
ICM was used to visualize the docking data and analyze their surface, while Pymol was utilized to compute the 3D view of ligand–enzyme interactions.
3. Results and Discussion
X-ray diffraction (XRD) was employed to examine the structural characteristics and phase composition of pristine ZnO, st-ZnO, 2% Nb/st-ZnO, and 4% Nb/st-ZnO QDs (Figure 3a). There were seven broad peaks detected at 2θ° of ∼31.7, 34.4, 36.2, 47.5, 56.5, 62.8, and 68.0° corresponding to (100), (002), (101), (102), (110), (103), and (112) that harmonized to the wurtzite hexagonal ZnO pattern (JCPDS card no. 361451).43 Impurities in zinc–carboxyl compounds are shown by two peaks (symbol). These zinc–carboxyl traces may arise due to the Zn precursors reacting with other compounds during the synthesis process.44 XRD spectra of native starch revealed clear diffraction peaks at 2θ° of 10, 12, 18, and 22°, indicating a characteristic pattern of starch.45,46 Due to the chemical composition of starch, no major changes were found in st-ZnO, but there was a slight variation in peak intensity47 and no peaks that corresponded to Nb were found in (2 and 4%) Nb/st-ZnO, implying that ZnO is formed in the pure wurtzite phase.48 The intensity of ZnO peaks decreased with increasing Nb doping, implying that a higher ratio of Nb in samples makes ZnO least crystalline.20 Crystallite size was calculated using Scherer’s equation, which ranged from 11 to 22 nm.49Figure 3c–e presents selected-area electron diffraction (SAED) patterns for ZnO and Nb/st-ZnO. The hexagonal structure of ZnO QDs is confirmed by SAED images with distinct rings of bright spots indexed as (002), (100), (101), (102), and (110) planes, respectively, in agreement with XRD results.
Figure 3.

(a) XRD; (b) Fourier transform infrared (FTIR) spectra; and (c–e) SAED profiles of (c) ZnO, (d) st-ZnO, and (e) (4%) Nb/st-ZnO.
The presence of functional groups, modes of vibration for chemical bonding, and surface chemistry in the concerned samples were investigated with FTIR analysis (Figure 3b). A high peak at ∼3355 cm–1 was associated with hydroxyl groups’ O–H stretching mode because zinc hydroxide preserves some adsorbed water on its surface. Bands appearing between 1000 and 1700 cm–1 were assigned to organic traces (residue). The Zn–O stretching mode represents the characteristic peak ranging from 400 to 900 cm–1.50 The appearance and the shift of peaks in st-ZnO QDs indicate the formation of a bond between starch and ZnO molecules; meanwhile, no covalent bond in ZnO and the st molecule was formed, as validated by earlier research.51 The IR bands detected at 835 and 624 cm–1 were attributed to vibrational modes of the Nb–ZnO structure, demonstrating the integration of Nb into the ZnO lattice.52
The UV–vis spectroscopy technique is widely employed to analyze the optical properties of nanomaterials.53 The obtained absorption spectra of ZnO, st-ZnO, and Nb/st-ZnO are depicted in Figure 4a. The absorbance peak for ZnO is seen at 374 nm,54 while the absorbance of Nb/st-integrated ZnO samples was not significantly different (only minor fluctuations (1–4 nm) in absorption spectra of doped ZnO were observed). Additionally, codoped ZnO samples showed a blue shift when compared to pure ZnO QDs.7,55,56 The quantum confinement effect (QCE) is said to cause a blue shift in the band gap when the size of the particle is decreased in the metal oxide process. However, QCE is not the only reason; doping can disrupt symmetry and result in defects of lattice centers, which changes band architecture and cause major variations in optical characteristics.57 The Tauc equation was plotted to compute the optical band gap (Eg) based on absorbance; here, α = absorption coefficient, hν = photon energy (αhν)2 vs (hν) for ZnO, st, st-ZnO, and Nb/st-ZnO, as shown in Figure 4b. The calculated band-gap energy was found as 3.31 (ZnO), 3.38 (st-ZnO), 3.51 (2% Nb), 3.58 eV (4% Nb), and 4.1 eV (starch). Eg analysis clearly reveals that as Nb concentration increases, Eg increases from 3.31 to 3.58 eV; gradually, the Burstein–Moss effect could also explain the blue shift in optical Eg. As per this concept, doping filled the bottom levels of the conduction band with excess free electrons, leading to an increase in the Fermi level, or in other words, the carrier concentration was proportional to the Eg trend.58,59
Figure 4.

(a) Absorption spectra, (b) calculated Eg, and (c) photoluminescence (PL) spectra of pure and doped ZnO.
By analyzing emission spectra, photoluminescence (PL) analysis is a useful method for learning more about transitions, impurities, and dopants (Figure 4c).60 The emission spectra of ZnO, st-ZnO, and Nb/st-ZnO QDs were studied using PL spectroscopy. Peaks at around 408, 442, 467, and 488 nm for undoped ZnO correspond to blue and violet emissions and are attributed to Zn interstitials. Donor–acceptor pair recombination, which includes various levels of defects in the materials, is responsible for weak emissions at 442, 467, and 488 nm. Electrons (e–) in singly ionized O2 vacancies with holes in the valence band emit at 488 nm.42 We noticed an intriguing broader blue emission spectrum ranging from violet to green at 392–440 nm in st-ZnO QDs, which we ascribed to recombination electrons trapped in random surface vacancies. Because smaller sizes of ZnO QDs are generated at the inner side of the starch matrix, surface passivation quenches near-band-edge and oxygen vacancy-related emission characteristics, resulting in increased blue emission.45 We can see that when Nb is doped into st-ZnO composites, the relative intensity of visible emission fluctuates. When compared to other samples, the intensity of the sample containing Nb (2%) increases drastically. Intensity decreases as the Nb content in the samples increases; such a change of intensities in nanostructures implies the presence of natural defects. As Nb ions are integrated into the ZnO lattice at lower concentrations, vacancies in QDs, particularly oxygen vacancies, increase significantly. Higher Nb incorporation, on the other hand, appears to reduce oxygen vacancies (VO) concentration in the ZnO lattice. For a nominal Nb concentration, VO-related defect concentrations in ZnO lattices can be decreased even further in pristine ZnO. While the fluctuation in intensity due to Nb content present in samples distinctly reveals that Nb inclusion in the ZnO lattice significantly impacts the defect structure, the mechanism appears to be complex, especially in QDs.46,61
A field emission scanning electron microscope (FE-SEM) was used to carry out the morphological characterization of the synthesized samples, as displayed in Figure 5a–d. ZnO QDs were formed in a highly uniform manner in the form of QDs (Figure 5a). A little aggregation was observed upon doping of st into ZnO (Figure 5b st-ZnO). This aggregation was increased when Nb concentration (2 and 4%) was introduced into the sample (Figure 5c,d Nb/st-ZnO). To validate the presence of zinc and oxygen in ZnO nanopowders, energy-dispersive spectrometry (EDS) was deployed to perform elemental analysis (Figure 6a–d). The dopant’s formation was quantitatively confirmed by the average atomic ratio. Au (gold) peaks in spectra turn out because of the coating of gold sprayed on the material to decrease charging effects. The Na peak could have resulted from NaOH used during synthesis to sustain a basic pH. The presence of Na in the sample cannot be ascertained since its peak overlaps with Zn. Furthermore, while there is no carbon in the sample, the occurrence of the only carbon (C) peak at keV is attributable to the tab of carbon employed to retain samples.
Figure 5.

FE-SEM of (a) ZnO, (b) st-ZnO, (c) 2%Nb/st-ZnO, and (d) 4%Nb/st-ZnO.
Figure 6.

EDS investigation of pure (a) ZnO, (b) st-ZnO, and (c, d) Nb/st-ZnO with Nb (2 and 4%), respectively.
Figure 7a–d shows high-resolution transmission electron microscopy (HRTEM) images of doped and undoped ZnO QDs. The ZnO QDs exhibited spherical-shaped stretched particles with minor aggregation, which might be due to the specimens implanted on the Cu-coated grid (Figure 7a). The surface morphology of st-doped QDs was investigated in terms of a cluster-like structure. ZnO QDs are embedded into a polymer-like starch matrix (Figure 7b). Small-scale agglomeration was observed as we added Nb in st-ZnO (Figure 7c), and this agglomeration increased significantly with increasing concentrations of Nb ions in the sample (Figure 7d). Due to its clustered morphology, the calculation of particle size was difficult. To calculate the interlayer spacing, 10 nm images were employed to display lattice fringes for the crystallographic plane identification (Figure 8a′–d′). The computed d-spacings for bare and binary doped ZnO were ∼0.19, 0.16, 0.14, and 0.23 nm, which is comparable with the XRD results of the specimens.
Figure 7.

Micrographs of HRTEM (a) ZnO, (b) st-ZnO, (c) 2% Nb/st-ZnO, and (d) 4% Nb/st-ZnO.
Figure 8.

d-Spacing of (a′) ZnO, (b′) st-ZnO, (c′) 2% Nb/st-ZnO, and (d′) 4% Nb/st-ZnO.
As shown in Figure 9a–c, X-ray photoelectron spectroscopy (XPS) was employed to interpret the chemical composition of Nb/st-ZnO nanostructures to confirm Nb doping. Figure 9a–c depicts high-resolution XPS spectra of O 1s, Zn 2p, and Nb 3d orbitals for Nb/st-ZnO nanostructures. The asymmetric O 1s orbital analysis reveals two signals at 530.7 and 532.3 eV, corresponding to Zn–O bonds62 and surface −OH units of specimens,63 respectively. As shown in Figure 9b, the XPS spectra for Zn 2p reveal two symmetric high peaks centered at 1021.1 and 1044.0 eV, which are attributed toward Zn 2p3/2 and Zn 2p1/2, respectively. The Zn 2p spin modes reveal that Zn in Nb/st-ZnO nanostructures resides exclusively in the divalent oxidation phase.64 The Nb 3d spectra for doped ZnO nanostructures exhibit two high peaks at 206.6 and 209.5 eV, which correspond to 3d5/2 and 3d3/2 constituents, respectively (Figure 9c). The Nb 3d3/2 peak suggests that the oxidation state of Nb is pentavalent.65
Figure 9.

XPS spectra of Nb/st-ZnO nanostructures. (a) C 1s of ZnO, (b) Zn 2p, and (c) Nb 3d.
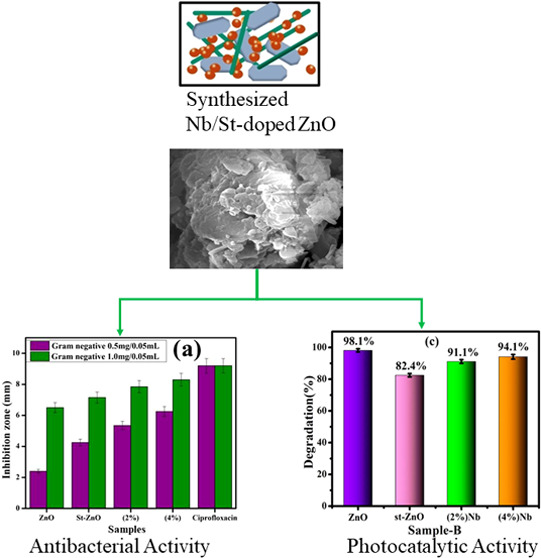
Photocatalytic assays were performed on bare and doped samples, with photocatalytic degradation of MB. ZnO showed a high comparable degrading performance against the dye (MB) of up to 97% at neutral pH (7) because of its strong surface reactivity resulting from a large number of active surface defect states. Degradation reduced to 76% when st was doped into the reference sample. However, degradation was 88 and 89% when Nb was doped as (2 and 4%) Nb/st-ZnO. As shown in Figure 10a, degradation was observed at 98, 82, 91, and 94% in basic pH 12 and 61, 43, 45, and 51% in acidic pH 4 for pristine and incorporated samples, respectively, as shown in Figure 10b,c. Because pure starch’s ability to remove dyestuffs is not satisfactory due to its inability to absorb heavy metals and most dyes, it cannot be utilized directly as an adsorbent; degradation decreased when st was doped into the reference sample.66,67 Upon increasing doping of Nb as 2 and 4%, Nb/st-ZnO resulted in an increase in degradation. From Figure 10, Nb/st-ZnO samples exhibited high photocatalytic performance relative to st-ZnO, and the higher the Nb ratio, the higher the photocatalytic activity. The reason seems to be that Nb/st-ZnO is expected to display lower electron–hole pair recombination and an increase in carrier electronics.20 The surface area of ZnO was determined to be 30.83 m2/g.68 The obtained results were compared with Degussa (Evonik) P25, a biphasic titanium dioxide having very strong photocatalytic activity attributed to its unique biphasic interfacial heterojunction structure.69,70 It has a composition of more than 80% anatase, a trace amount of rutile (15%), and a small quantity of an amorphous phase with a particle size of around 20 nm or smaller.71,72 To increase the photocatalytic activity, interfaces between the rutile and anatase phases allow charge carrier separation and slow down the charge recombination between electron trapping sites within the mixed phase.73−76 P25 was used by Xu et al. to photocatalytically degrade the Rhodamine B (RhB) dye.77 Within 90 min, a concentration decrease of around 30% over P25 was observed. Additionally, a comparison between previous and present study results of photocatalytic activity is shown in Table 1.
Figure 10.

Photocatalysis of ZnO, st-ZnO, and Nb/st-ZnO (2 and 4%) % in (a) neutral, (b) acidic, and (c) basic media.
Table 1. Comparison between Previous and Present Results of Photocatalysis.
Figure 11 depicts MB degradation absorption in a basic medium, revealing that a significant decline in dye concentration was seen under these conditions.
Figure 11.

UV–vis absorption study of MB reduction of bare and doped samples in a basic medium.
A total organic carbon (TOC) assessment of the treated water was conducted to evaluate the degree of mineralization of the dye (MB). At optimal circumstances, the study was performed on st-ZnO and Nb/st-ZnO (2 and 4%) using various time intervals up to 120 min. This analysis (Figure 12a) demonstrated that the TOC of the MB solution treated with Nb/st-ZnO under visible light irradiation reduced continuously with reaction time, and a significant amount of mineralization of the dye was found after 120 min in 4% Nb/st-ZnO. The study also indicates that the dye may be converted into various intermediate forms and that degradation of the dye after 120 min may culminate in its total mineralization. Experiment stability is a critical factor to be considered while evaluating photocatalysts for wastewater treatment. Photocatalyst stability was examined by leaving completed activities uninterrupted for 3 days and obtaining absorption spectra from each sample every 24 h to record any variations in dye degradation. The degradation of the dye was monitored spectrophotometrically every 24 h, and corresponding results are depicted in Figure 12b.
Figure 12.

(a) Variations in the total organic carbon content of the MB solution during photodegradation. (b) Stability comparison of the ZnO sample and Nb/st-ZnO (2 and 4%).
3.1. Scavenging (DPPH) Assay
DPPH scavenging was deployed to analyze active radical species contained in photocatalysts and to measure their antioxidant properties (Figure 13). Compounds’ antioxidant properties are linked to their capability to transfer hydrogen or electrons atoms to DPPH free radicals, resulting in stable diamagnetic compounds. The ability of free radical reduction of this DPPH can be evaluated spectrophotometrically by measuring the degradation in absorbance (517 nm). The antioxidant activity of all prepared samples exhibited a dose-dependent behavior. After 120 min at a concentration of 700 g mL–1, pristine ZnO showed the highest scavenging performance of 50%. The production of highly reactive •OH and •O2– radical species with the ability to bond with the DPPH free radical can cause its degradation. At the same concentration, the antioxidant activity decreased to 38.15 % after the starch addition. When the amount of Nb in the st-ZnO lattice was introduced, the scavenging performance decreased even further. The antioxidant potential of (2%) Nb samples was found to be 35.43%, whereas (4%) Nb samples had a maximum performance of 30.14%. This reduction in photocatalyst antioxidant potential after Nb addition might be associated with an increase in turbidity in the test sample, which generated an antagonistic interaction, resulting in a scavenging activity depletion.82
Figure 13.

DPPH scavenging activities of bare, st-ZnO, and Nb/st-ZnO QDs (2 and 4%).
3.2. Antimicrobial Activity
Figure 14a,b and Table 2 show the in vitro bactericidal activity of dopant-free and Nb/st-ZnO QDs against Gram-negative and positive bacteria. Results describe higher bacterial synergism and action of doped ZnO against E. coli in comparison to S. aureus. E. coli and S. aureus inhibition zones were 2.40–6.25 and 6.55–8.30 mm, 1.45–2.85 to 1.75–3.45 mm, respectively, while at the least concentration, ZnO showed minimal activity for E. coli in contrast to S. aureus. In comparison to DI water (0 mm), ciprofloxacin exhibited an inhibition zone of 9.20 and 4.25 mm against E. coli and S. aureus, respectively. At both concentrations, Nb/st-ZnO showed considerable antibacterial action against Gram-negative compared to Gram-positive due to variations in the bacterial membrane structure.83 QDs can connect to deoxyribonucleic acid molecules and form a disordered helical framework after penetration into the cell.84 The type, size, mass-to-surface ratios, and phenotype of synthesized QDs are all affected by oxidative stress.25,85 Bacterial death occurs when small particles quickly release reactive oxygen species (ROS), which damage the cytoplasmic contents of the bacterial membrane.86
Figure 14.

Comparative in vitro bactericidal performance of pristine, st-ZnO, and Nb/st-ZnO QDs against Gram-negative (a) and positive bacteria (b).
Table 2. Antibacterial Activities of ZnO and Nb/st-ZnO QDs.
| samples | ainhibition zone (mm) (E. coli) | binhibition zone (mm) (S. aureus) | ||
|---|---|---|---|---|
| 0.5 mg/0.05 mL | 1.0 mg/0.05 mL | 0.5 mg/0.05 mL | 1.0 mg/0.05 mL | |
| ZnO | 2.40 ± 0.12 | 6.55 ± 0.325 | 1.45 ± 0.072 | 1.75 ± 0.087 |
| st-ZnO | 4.25 ± 0.212 | 7.15 ± 0.357 | 1.90 ± 0.095 | 2.25 ± 0.112 |
| (2%)Nb/st-ZnO | 5.35 ± 0.267 | 7.85 ± 0.392 | 2.25 ± 0.112 | 2.60 ± 0.13 |
| (4%)Nb/st-ZnO | 6.25 ± 0.312 | 8.30 ± 0.415 | 2.85 ± 0.142 | 3.45 ± 0.172 |
| ciprofloxacin | 9.20 ± 0.46 | 9.20 ± 0.46 | 4.25 ± 0.212 | 4.25 ± 0.212 |
| DIW | 0 ± 0.0 | 0 ± 0.0 | 0 ± 0.0 | 0 ± 0.0 |
Measurements of inhibition zones against Gram-negative bacteria.
Inhibition values (mm) for Gram-positive bacteria.
Computational techniques, especially molecular docking studies, enabled the in-depth study of mechanisms behind various biological activities and have gained much attention over the last few decades. The current study evaluated binding capacity and inhibitory potential of synthesized nanocomposites using a molecular docking study approach to suggest possible inhibitors against selected enzyme targets. The enzymes, i.e., DHFR and DNA gyrase, being essential and vital for bacterial survival and growth have been reported as key targets for antibiotic discovery.87,88 We evaluated docking scores for pristine ZnO, st-ZnO, and Nb/st-ZnO NPs and compared their binding interactions and tendency with ciprofloxacin, i.e., a standard antibiotic used in antibacterial activity assay.
For ZnO nanoparticles, the best-docked conformation revealed H-bonding interaction with Asp27 (2.8 Å) with a binding score of −2.349 kcal/mol. Among these different nanocomposites, st-ZnO showed the highest binding score (−7.836 kcal/mol) and better binding tendency, as shown in Figure 15, where H-bonding was observed with Ile94 (2.2 Å), Asp27 (2.7 Å), Ala7 (1.8 Å), and Ile14 (2.4 Å). The binding score of st-ZnO NPs is comparable to ciprofloxacin (score: −9.830 kcal/mol). On the other hand, Nb/st-ZnO nanocomposites showed H-bonding interaction with Ile94 (2.3 Å) and Ala7 (2.5 Å), having an overall binding score of −6.221 kcal/mol.
Figure 15.

Binding interaction of ZnO, st-ZnO, Nb/st-ZnO, and ciprofloxacin inside the active pocket of DHFRE. coli.
For the case of DNA gyrase, another attractive target for antibiotic discovery, both st-ZnO and Nb/st-ZnO nanocomposites showed a good binding tendency with active site residues having binding scores of −8.593 and −7.774 kcal/mol, respectively, where st-ZnO showed H-bonding with Glu50 (2.3 Å), Gly77 (1.8 Å), and Asp73 (2.3 and 2.4 Å) and ZnO–starch–Nb with Gly77 (1.8 and 2.5 Å), Glu50 (2.2 Å), and Thr165 (1.7 Å). Furthermore, ZnO NPs showed H-bonding interaction with Thr165 (1.6 and 3.4 Å) and Asp73 (2.3 Å), having a binding score of −4.587 kcal/mol, while the binding score observed for ciprofloxacin was −10.882 kcal/mol, and binding patterns are shown in Figure 16.
Figure 16.

Binding interactions of ZnO, st-ZnO, Nb/st-ZnO, and ciprofloxacin inside the active pocket of DNA gyraseE. coli.
In silico findings are comparable to in vitro bactericidal activities and suggest ZnO, st-ZnO, and Nb/st-ZnO as possible inhibitors for DHFR and DNA gyrase from E. coli that needs to be further explored at an advanced level.
4. Conclusions
Here, we report successfully synthesized dopant-free and Nb/st-ZnO QDs using the coprecipitation method to evaluate the photocatalytic activity of bare and Nb/st-ZnO. Elemental composition, optical properties, morphology, and structure of ZnO and Nb/st-ZnO were examined. The crystallite size (11 nm), hexagonal structure of ZnO, and implantation of Nb/St in ZnO were all confirmed using XRD and SEM-EDS. The XRD results verified the interplanar d-spacing and plane orientation found in the HRTEM investigations. The absorption spectra revealed a 3.31 eV peak at 374 nm accompanied by a blue shift, which might be attributed to the addition of Nb/st into ZnO. As a result of this blue shift, an increase in the band gap was observed. Defects related to oxygen vacancies were implicated in emission spectra peaks. In addition, the effect of photocatalytic activity (PCA) was assessed for the synthesized catalyst. Furthermore, it was revealed that the QDs that were prepared were efficient against Gram-negative and positive bacteria. Molecular docking investigations revealed that st-ZnO and Nb/st-ZnO nanocomposites from E. coli might act as potential inhibitors of the DHFR and DNA gyrase enzymes. This research will contribute to developing binary doped heterostructures for degrading dyes and bacterial applications in ongoing studies.
Acknowledgments
The authors acknowledge HEC Pakistan via NRPU -20-17615.
Supporting Information Available
The Supporting Information is available free of charge at https://pubs.acs.org/doi/10.1021/acsomega.2c05569.
Synthesis of Nb/st-ZnO Nanostructures (Figure S1) and Microbial mechanism of Nb/st- ZnO nanostructures (Figure S2) (PDF)
The authors declare no competing financial interest.
Supplementary Material
References
- Tao X.; Liu D.; Cong W.; Huang L. Controllable Synthesis of Starch-Modified ZnMgAl-LDHs for Adsorption Property Improvement. Appl. Surf. Sci. 2018, 457, 572–579. 10.1016/j.apsusc.2018.06.264. [DOI] [Google Scholar]
- Spitaleri L.; Nicotra G.; Zimbone M.; Contino A.; Maccarrone G.; Alberti A.; Gulino A. Fast and Efficient Sun Light Photocatalytic Activity of Au_ZnO Core–Shell Nanoparticles Prepared by a One-Pot Synthesis. ACS Omega 2019, 4, 15061–15066. 10.1021/acsomega.9b01850. [DOI] [PMC free article] [PubMed] [Google Scholar]
- Parvin T.; Keerthiraj N.; Ibrahim I. A.; Phanichphant S.; Byrappa K. Photocatalytic Degradation of Municipal Wastewater and Brilliant Blue Dye Using Hydrothermally Synthesized Surface-Modified Silver-Doped ZnO Designer Particles. Int. J. Photoenergy 2012, 2012, 1–8. 10.1155/2012/670610. [DOI] [Google Scholar]
- Stasinakis A. S. Use of Selected Advanced Oxidation Processes (AOPs) for Wastewater Treatment–a Mini Review. Glob. NEST J. 2013, 10, 376–385. 10.30955/gnj.000598. [DOI] [Google Scholar]
- Wang C.; Yu H.-Y.; Miao Z.; Ge D.; Abdalkarim S. Y. H.; Yao J. Interface Growth of PANI-ZnO Nanohybrids on a Self-Formed Grapefruit Peel Aerogel to Construct a Quick Self-Restored Gas Sensor. ACS Sustainable Chem. Eng. 2022, 10, 6573–6583. 10.1021/acssuschemeng.1c08195. [DOI] [Google Scholar]
- Lee K. M.; Lai C. W.; Ngai K. S.; Juan J. C. Recent Developments of Zinc Oxide Based Photocatalyst in Water Treatment Technology: A Review. Water Res. 2016, 88, 428–448. 10.1016/j.watres.2015.09.045. [DOI] [PubMed] [Google Scholar]
- Ramasami A. K.; Naika H. R.; Nagabhushana H.; Ramakrishnappa T.; Balakrishna G. R.; Nagaraju G. Tapioca Starch: An Efficient Fuel in Gel-Combustion Synthesis of Photocatalytically and Anti-Microbially Active ZnO Nanoparticles. Mater. Charact. 2015, 99, 266–276. 10.1016/j.matchar.2014.11.017. [DOI] [Google Scholar]
- Ma J.; Zhu W.; Tian Y.; Wang Z. Preparation of Zinc Oxide-Starch Nanocomposite and Its Application on Coating. Nanoscale Res. Lett. 2016, 11, 200 10.1186/s11671-016-1404-y. [DOI] [PMC free article] [PubMed] [Google Scholar]
- Iqbal S.; Nadeem S.; Bahadur A.; Javed M.; Ahmad Z.; Ahmad M. N.; Shoaib M.; Liu G.; Mohyuddin A.; Raheel M. The Effect of Ni-Doped ZnO NPs on the Antibacterial Activity and Degradation Rate of Polyacrylic Acid-Modified Starch Nanocomposite. JOM 2021, 73, 380–386. 10.1007/s11837-020-04490-0. [DOI] [Google Scholar]
- Pal S.; Mal D.; Singh R. P. Cationic Starch: An Effective Flocculating Agent. Carbohydr. Polym. 2005, 59, 417–423. 10.1016/j.carbpol.2004.06.047. [DOI] [Google Scholar]
- Shabana S.; Prasansha R.; Kalinina I.; Potoroko I.; Bagale U.; Shirish S. H. Ultrasound Assisted Acid Hydrolyzed Structure Modification and Loading of Antioxidants on Potato Starch Nanoparticles. Ultrason. Sonochem. 2019, 51, 444–450. 10.1016/j.ultsonch.2018.07.023. [DOI] [PubMed] [Google Scholar]
- Teh C. Y.; Wu T. Y.; Juan J. C. Potential Use of Rice Starch in Coagulation–Flocculation Process of Agro-Industrial Wastewater: Treatment Performance and Flocs Characterization. Ecol. Eng. 2014, 71, 509–519. 10.1016/j.ecoleng.2014.07.005. [DOI] [Google Scholar]
- Bizarro M.; Sánchez-Arzate A.; Garduno-Wilches I.; Alonso J. C.; Ortiz A. Synthesis and Characterization of ZnO and ZnO: Al by Spray Pyrolysis with High Photocatalytic Properties. Catal. Today 2011, 166, 129–134. 10.1016/j.cattod.2010.08.005. [DOI] [Google Scholar]
- Nolan M. G.; Hamilton J. A.; O’brien S.; Bruno G.; Pereira L.; Fortunato E.; Martins R.; Povey I. M.; Pemble M. E. The Characterisation of Aerosol Assisted CVD Conducting, Photocatalytic Indium Doped Zinc Oxide Films. J. Photochem. Photobiol., A 2011, 219, 10–15. 10.1016/j.jphotochem.2011.01.010. [DOI] [Google Scholar]
- Jongnavakit P.; Amornpitoksuk P.; Suwanboon S.; Ndiege N. Preparation and Photocatalytic Activity of Cu-Doped ZnO Thin Films Prepared by the Sol–Gel Method. Appl. Surf. Sci. 2012, 258, 8192–8198. 10.1016/j.apsusc.2012.05.021. [DOI] [Google Scholar]
- Lu Y.; Lin Y.; Wang D.; Wang L. L.; Xie T. F.; Jiang T. F. A High Performance Cobalt Doped ZnO Visible Light Photocatalyst and Its Photogenerated Charge Transfer Properties. Nano Res. 2011, 4, 1144–1152. 10.1007/s12274-011-0163-4. [DOI] [Google Scholar]
- Kaneva N. V.; Dimitrov D. T.; Dushkin C. D. Effect of Nickel Doping on the Photocatalytic Activity of ZnO Thin Films under UV and Visible Light. Appl. Surf. Sci. 2011, 257, 8113–8120. 10.1016/j.apsusc.2011.04.119. [DOI] [Google Scholar]
- Dumrongrojthanath P.; Phuruangrat A.; Thongtem S.; Thongtem T. Photocatalysis of Cd-Doped ZnO Synthesized with Precipitation Method. Rare Met. 2021, 40, 537–546. 10.1007/s12598-019-01283-6. [DOI] [Google Scholar]
- Phuruangrat A.; Dumrongrojthanath P.; Yayapao O.; Arin J.; Thongtem S.; Thongtem T. Photocatalytic Activity of La-Doped ZnO Nanostructure Materials Synthesized by Sonochemical Method. Rare Met. 2016, 35, 390–395. 10.1007/s12598-015-0508-3. [DOI] [Google Scholar]
- Yoon H.; Joshi B. N.; Na S.-H.; Choi J.-Y.; Yoon S. S. Photodegradation of Methylene Blue of Niobium-Doped Zinc Oxide Thin Films Produced by Electrostatic Spray Deposition. Ceram. Int. 2014, 40, 7567–7571. 10.1016/j.ceramint.2013.11.041. [DOI] [Google Scholar]
- Yang J.; Zhang X.; Wang C.; Sun P.; Wang L.; Xia B.; Liu Y. Solar Photocatalytic Activities of Porous Nb-Doped TiO2 Microspheres Prepared by Ultrasonic Spray Pyrolysis. Solid State Sci. 2012, 14, 139–144. 10.1016/j.solidstatesciences.2011.11.010. [DOI] [Google Scholar]
- Kruefu V.; Ninsonti H.; Wetchakun N.; Inceesungvorn B.; Pookmanee P.; Phanichphant S. Photocatalytic Degradation of Phenol Using Nb-Loaded ZnO Nanoparticles. Eng. J. 2012, 16, 91–100. 10.4186/ej.2012.16.3.91. [DOI] [Google Scholar]
- Menzies P. I.; Ramanoon S. Z. Mastitis of Sheep and Goats. Vet. Clin. North Am. Food Anim. Pract. 2001, 17, 333–358. 10.1016/S0749-0720(15)30032-3. [DOI] [PubMed] [Google Scholar]
- Haider A.; Ijaz M.; Ali S.; Haider J.; Imran M.; Majeed H.; Shahzadi I.; Ali M. M.; Khan J. A.; Ikram M. Green Synthesized Phytochemically (Zingiber Officinale and Allium Sativum) Reduced Nickel Oxide Nanoparticles Confirmed Bactericidal and Catalytic Potential. Nanoscale Res. Lett. 2020, 15, 50 10.1186/s11671-020-3283-5. [DOI] [PMC free article] [PubMed] [Google Scholar]
- Haider A.; Ijaz M.; Imran M.; Naz M.; Majeed H.; Khan J. A.; Ali M. M.; Ikram M. Enhanced Bactericidal Action and Dye Degradation of Spicy Roots’ Extract-Incorporated Fine-Tuned Metal Oxide Nanoparticles. Appl. Nanosci. 2020, 10, 1095–1104. 10.1007/s13204-019-01188-x. [DOI] [Google Scholar]
- Roth B. Design of Dihydrofolate Reductase Inhibitors from X-Ray Crystal Structures. Fed. Proc. 1986, 45, 2765–2772. [PubMed] [Google Scholar]
- Sirotnak F. M.Folate Antagonists as Therapeutic Agents; Academic Press, 1984; Vol. 2. [Google Scholar]
- Kompis I. M.; Islam K.; Then R. L. DNA and RNA Synthesis: Antifolates. Chem. Rev. 2005, 105, 593–620. 10.1021/cr0301144. [DOI] [PubMed] [Google Scholar]
- Alrohily W. D.; Habib M. E.; El-Messery S. M.; Alqurshi A.; El-Subbagh H.; Habib E.-S. E. Antibacterial, Antibiofilm and Molecular Modeling Study of Some Antitumor Thiazole Based Chalcones as a New Class of DHFR Inhibitors. Microb. Pathog. 2019, 136, 103674 10.1016/j.micpath.2019.103674. [DOI] [PubMed] [Google Scholar]
- Collin F.; Karkare S.; Maxwell A. Exploiting Bacterial DNA Gyrase as a Drug Target: Current State and Perspectives. Appl. Microbiol. Biotechnol. 2011, 92, 479–497. 10.1007/s00253-011-3557-z. [DOI] [PMC free article] [PubMed] [Google Scholar]
- Tiz D. B.; Skok Ž.; Durcik M.; Tomašič T.; Mašič L. P.; Ilaš J.; Zega A.; Draskovits G.; Révész T.; Nyerges Á.; et al. An Optimised Series of Substituted N-Phenylpyrrolamides as DNA Gyrase B Inhibitors. Eur. J. Med. Chem. 2019, 167, 269–290. 10.1016/j.ejmech.2019.02.004. [DOI] [PubMed] [Google Scholar]
- Hevener K.; Verstak T. A.; Lutat K. E.; Riggsbee D. L.; Mooney J. W. Recent Developments in Topoisomerase-Targeted Cancer Chemotherapy. Acta Pharm. Sin. B 2018, 8, 844–861. 10.1016/j.apsb.2018.07.008. [DOI] [PMC free article] [PubMed] [Google Scholar]
- El-Subbagh H. I.; Hassan G. S.; El-Messery S. M.; Al-Rashood S. T.; Al-Omary F. A. M.; Abulfadl Y. S.; Shabayek M. I. Nonclassical Antifolates, Part 5. Benzodiazepine Analogs as a New Class of DHFR Inhibitors: Synthesis, Antitumor Testing and Molecular Modeling Study. Eur. J. Med. Chem. 2014, 74, 234–245. 10.1016/j.ejmech.2014.01.004. [DOI] [PubMed] [Google Scholar]
- Hassan A. S.; Askar A. A.; Naglah A. M.; Almehizia A. A.; Ragab A. Discovery of New Schiff Bases Tethered Pyrazole Moiety: Design, Synthesis, Biological Evaluation, and Molecular Docking Study as Dual Targeting DHFR/DNA Gyrase Inhibitors with Immunomodulatory Activity. Molecules 2020, 25, 2593. 10.3390/molecules25112593. [DOI] [PMC free article] [PubMed] [Google Scholar]
- Jafari H.; Sadeghzadeh S.; Rabbani M.; Rahimi R. Effect of Nb on the Structural, Optical and Photocatalytic Properties of Al-Doped ZnO Thin Films Fabricated by the Sol-Gel Method. Ceram. Int. 2018, 44, 20170–20177. 10.1016/j.ceramint.2018.07.311. [DOI] [Google Scholar]
- Shen W.; Li Z.; Wang H.; Liu Y.; Guo Q.; Zhang Y. Photocatalytic Degradation for Methylene Blue Using Zinc Oxide Prepared by Codeposition and Sol–Gel Methods. J. Hazard. Mater. 2008, 152, 172–175. 10.1016/j.jhazmat.2007.06.082. [DOI] [PubMed] [Google Scholar]
- Ryu J.; Park D.-S.; Hahn B.-D.; Choi J.-J.; Yoon W.-H.; Kim K.-Y.; Yun H.-S. Photocatalytic TiO2 Thin Films by Aerosol-Deposition: From Micron-Sized Particles to Nano-Grained Thin Film at Room Temperature. Appl. Catal., B 2008, 83, 1–7. 10.1016/j.apcatb.2008.01.020. [DOI] [Google Scholar]
- Ikram M.; Asghar R.; Imran M.; Naz M.; Haider A.; Ul-Hamid A.; Haider J.; Shahzadi A.; Nabgan W.; Goumri-Said S.; et al. Experimental and Computational Study of Zr and CNC-Doped MnO2 Nanorods for Photocatalytic and Antibacterial Activity. ACS Omega 2022, 7, 14045–14056. 10.1021/acsomega.2c00583. [DOI] [PMC free article] [PubMed] [Google Scholar] [Retracted]
- Li Y.; Wang H.; Xie J.; Hou J.; Song X.; Dionysiou D. D. Bi2WO6-TiO2/Starch Composite Films with Ag Nanoparticle Irradiated by γ-Ray Used for the Visible Light Photocatalytic Degradation of Ethylene. Chem. Eng. J. 2021, 421, 129986 10.1016/j.cej.2021.129986. [DOI] [Google Scholar]
- Summerfield R. L.; Daigle D. M.; Mayer S.; Mallik D.; Hughes D. W.; Jackson S. G.; Sulek M.; Organ M. G.; Brown E. D.; Junop M. S. A 2.13 Å Structure of E. Coli Dihydrofolate Reductase Bound to a Novel Competitive Inhibitor Reveals a New Binding Surface Involving the M20 Loop Region. J. Med. Chem. 2006, 49, 6977–6986. 10.1021/jm060570v. [DOI] [PubMed] [Google Scholar]
- Ushiyama F.; Amada H.; Takeuchi T.; Tanaka-Yamamoto N.; Kanazawa H.; Nakano K.; Mima M.; Masuko A.; Takata I.; Hitaka K.; et al. Lead Identification of 8-(Methylamino)-2-Oxo-1, 2-Dihydroquinoline Derivatives as DNA Gyrase Inhibitors: Hit-to-Lead Generation Involving Thermodynamic Evaluation. ACS Omega 2020, 5, 10145–10159. 10.1021/acsomega.0c00865. [DOI] [PMC free article] [PubMed] [Google Scholar]
- Abagyan R.; Totrov M. Biased Probability Monte Carlo Conformational Searches and Electrostatic Calculations for Peptides and Proteins. J. Mol. Biol. 1994, 235, 983–1002. 10.1006/jmbi.1994.1052. [DOI] [PubMed] [Google Scholar]
- Wu Y.; Yun J.; Wang L.; Yang X. Structure and Optical Properties of Mg-doped ZnO Nanoparticles by Polyacrylamide Method. Cryst. Res. Technol. 2013, 48, 145–152. 10.1002/crat.201200438. [DOI] [Google Scholar]
- Ikram M.; Aslam S.; Haider A.; Naz S.; Ul-Hamid A.; Shahzadi A.; Ikram M.; Haider J.; Ahmad S. O. A.; Butt A. R. Doping of Mg on ZnO Nanorods Demonstrated Improved Photocatalytic Degradation and Antimicrobial Potential with Molecular Docking Analysis. Nanoscale Res. Lett. 2021, 16, 78 10.1186/s11671-021-03537-8. [DOI] [PMC free article] [PubMed] [Google Scholar]
- Cavalcanti M. T.; Farias N. S.; de Cavalcante A.; da N.; Gonçalves M. C.; Silva A. S.; Candeia R. A. Morphological Structure and Crystallinity of ‘Rainha’ Sweet Potato Starch by Heat–Moisture Treatment. Polímeros 2019, 29, e2019016 10.1590/0104-1428.03917. [DOI] [Google Scholar]
- Gonçalves P. M.; Noreña C. P. Z.; da Silveira N. P.; Brandelli A. Characterization of Starch Nanoparticles Obtained from Araucaria Angustifolia Seeds by Acid Hydrolysis and Ultrasound. LWT--Food Sci. Technol. 2014, 58, 21–27. 10.1016/j.lwt.2014.03.015. [DOI] [Google Scholar]
- Vidhya K.; Saravanan M.; Bhoopathi G.; Devarajan V. P.; Subanya S. Structural and Optical Characterization of Pure and Starch-Capped ZnO Quantum Dots and Their Photocatalytic Activity. Appl. Nanosci. 2015, 5, 235–243. 10.1007/s13204-014-0312-7. [DOI] [Google Scholar]
- Pal U.; Morales-Flores N.; Rubio-Rosas E. Effect of Nb Doping on Morphology, Optical and Magnetic Behaviors of Ultrasonically Grown Zno Nanostructures. Mater. Sci. Res. India 2017, 14, 79–88. 10.13005/msri/140201. [DOI] [Google Scholar]
- Mustapha S.; Ndamitso M. M.; Abdulkareem A. S.; Tijani J. O.; Shuaib D. T.; Mohammed A. K.; Sumaila A. Comparative Study of Crystallite Size Using Williamson-Hall and Debye-Scherrer Plots for ZnO Nanoparticles. Adv. Nat. Sci. Nanosci. Nanotechnol. 2019, 10, 045013. 10.1088/2043-6254/ab52f7. [DOI] [Google Scholar]
- Jan F. A.; Ullah R.; Shah U.; Saleem M.; Ullah N. BAND GAP TUNING OF ZINC OXIDE NANOPARTICLES BY THE ADDITION OF (1-4%) STRONTIUM. SYNTHESIS, CHARACTERIZATION OF THE CATALYST AND ITS USE FOR THE PHOTOCATALYTIC DEGRADATION OF ACID VIOLET-17 DYE IN AQUEOUS SOLUTION. Environ. Eng. Manage. J. 2020, 19, 2039–2048. 10.30638/eemj.2020.193. [DOI] [Google Scholar]
- Vigneshwaran N.; Kumar S.; Kathe A. A.; Varadarajan P. V.; Prasad V. Functional Finishing of Cotton Fabrics Using Zinc Oxide–Soluble Starch Nanocomposites. Nanotechnology 2006, 17, 5087. 10.1088/0957-4484/17/20/008. [DOI] [Google Scholar]
- Naz H.; Ali R. N.; Liu Q.; Yang S.; Xiang B. Niobium Doped Zinc Oxide Nanorods as an Electron Transport Layer for High-Performance Inverted Polymer Solar Cells. J. Colloid Interface Sci. 2018, 512, 548–554. 10.1016/j.jcis.2017.10.041. [DOI] [PubMed] [Google Scholar]
- Talam S.; Karumuri S. R.; Gunnam N. Synthesis, Characterization, and Spectroscopic Properties of ZnO Nanoparticles. ISRN Nanotechnol. 2012, 2012, 1–6. 10.5402/2012/372505. [DOI] [Google Scholar]
- Jay Chithra M.; Sathya M.; Pushpanathan K. Effect of PH on Crystal Size and Photoluminescence Property of ZnO Nanoparticles Prepared by Chemical Precipitation Method. Acta Metall. Sin. 2015, 28, 394–404. 10.1007/s40195-015-0218-8. [DOI] [Google Scholar]
- Pascariu P.; Homocianu M.; Olaru N.; Airinei A.; Ionescu O. New Electrospun ZnO: MoO3 Nanostructures: Preparation, Characterization and Photocatalytic Performance. Nanomaterials 2020, 10, 1476. 10.3390/nano10081476. [DOI] [PMC free article] [PubMed] [Google Scholar]
- Liu Y.; Wang W.; Ma J.; Wang Y.; Ye W.; Zhang C.; Chen J.; Li X.; Du Y. Structure, Optical and Electrical Properties of Nb-Doped ZnO Transparent Conductive Thin Films Prepared by Co-Sputtering Method. J. Adv. Dielectr. 2019, 09, 1950048 10.1142/S2010135X19500486. [DOI] [Google Scholar]
- Özgür Ü.; Alivov Y. I.; Liu C.; Teke A.; Reshchikov M.; Doğan S.; Avrutin V.; Cho S.-J.; Morkoç H. A Comprehensive Review of ZnO Materials and Devices. J. Appl. Phys. 2005, 98, 041301. 10.1063/1.1992666. [DOI] [Google Scholar]
- Burstein E. Anomalous Optical Absorption Limit in InSb. Phys. Rev. 1954, 93, 632. 10.1103/PhysRev.93.632. [DOI] [Google Scholar]
- Moss T. S. The Interpretation of the Properties of Indium Antimonide. Proc. Phys. Soc. Sect. B 1954, 67, 775. 10.1088/0370-1301/67/10/306. [DOI] [Google Scholar]
- MAHROUG A.; Mari B.; Mollar M.; Boudjadar I.; Guerbous L.; Henni A.; Selmi N. Studies on Structural, Surface Morphological, Optical, Luminescence and Uv Photodetection Properties of Sol–Gel Mg-Doped ZnO Thin Films. Surf. Rev. Lett. 2019, 26, 1850167 10.1142/S0218625X18501676. [DOI] [Google Scholar]
- Kim C. O.; Shin D. H.; Choi S.-H. Strongly-Enhanced near-Band-Edge Photoluminescence of Nb-Implanted ZnO Films. J. Cryst. Growth 2011, 326, 42–44. 10.1016/j.jcrysgro.2011.01.048. [DOI] [Google Scholar]
- Teng X. M.; Fan H. T.; Pan S. S.; Ye C.; Li G. H. Influence of Annealing on the Structural and Optical Properties of ZnO: Tb Thin Films. J. Appl. Phys. 2006, 100, 053507. 10.1063/1.2227268. [DOI] [Google Scholar]
- Bai S.; Guo T.; Li D.; Luo R.; Chen A.; Liu C. C. Intrinsic Sensing Properties of the Flower-like ZnO Nanostructures. Sens. Actuators, B 2013, 182, 747–754. 10.1016/j.snb.2013.03.077. [DOI] [Google Scholar]
- Uddin M. T.; Nicolas Y.; Olivier C.; Servant L.; Toupance T.; Li S.; Klein A.; Jaegermann W. Improved Photocatalytic Activity in RuO 2–ZnO Nanoparticulate Heterostructures Due to Inhomogeneous Space Charge Effects. Phys. Chem. Chem. Phys. 2015, 17, 5090–5102. 10.1039/C4CP04780J. [DOI] [PubMed] [Google Scholar]
- Atashbar M. Z.; Sun H. T.; Gong B.; Wlodarski W.; Lamb R. XPS Study of Nb-Doped Oxygen Sensing TiO2 Thin Films Prepared by Sol-Gel Method. Thin Solid Films 1998, 326, 238–244. 10.1016/S0040-6090(98)00534-3. [DOI] [Google Scholar]
- Chen Q.; Yu H.; Wang L.; ul Abdin Z.; Chen Y.; Wang J.; Zhou W.; Yang X.; Khan R. U.; Zhang H.; Chen X. Recent Progress in Chemical Modification of Starch and Its Applications. RSC Adv. 2015, 5, 67459–67474. 10.1039/C5RA10849G. [DOI] [Google Scholar]
- Haroon M.; Wang L.; Yu H.; Abbasi N. M.; Zain-ul-Abdin Z. u. A.; Saleem M.; Khan R. U.; Ullah R. S.; Chen Q.; Wu J. Chemical Modification of Starch and Its Application as an Adsorbent Material. RSC Adv. 2016, 6, 78264–78285. 10.1039/C6RA16795K. [DOI] [Google Scholar]
- Khan M.; Ware P.; Shimpi N. Synthesis of ZnO Nanoparticles Using Peels of Passiflora Foetida and Study of Its Activity as an Efficient Catalyst for the Degradation of Hazardous Organic Dye. SN Appl. Sci. 2021, 3, 528 10.1007/s42452-021-04436-4. [DOI] [Google Scholar]
- Saito K.; Kozeni M.; Sohmiya M.; Komaguchi K.; Ogawa M.; Sugahara Y.; Ide Y. Unprecedentedly Enhanced Solar Photocatalytic Activity of a Layered Titanate Simply Integrated with TiO 2 Nanoparticles. Phys. Chem. Chem. Phys. 2016, 18, 30920–30925. 10.1039/C6CP05635K. [DOI] [PubMed] [Google Scholar]
- Phongamwong T.; Donphai W.; Prasitchoke P.; Rameshan C.; Barrabés N.; Klysubun W.; Rupprechter G.; Chareonpanich M. Novel Visible-Light-Sensitized Chl-Mg/P25 Catalysts for Photocatalytic Degradation of Rhodamine B. Appl. Catal., B 2017, 207, 326–334. 10.1016/j.apcatb.2017.02.042. [DOI] [Google Scholar]
- Rajashekhar K. E.; Devi L. G. Polymorphic Phase Transformation of Degussa P25 TiO2 by the Chelation of Diaminopyridine on TiO62– Octahedron: Correlation of Anatase to Rutile Phase Ratio on the Photocatalytic Activity. J. Mol. Catal. A: Chem. 2013, 374-375, 12–21. 10.1016/j.molcata.2013.02.009. [DOI] [Google Scholar]
- Vijayarangamuthu K.; Han E.; Jeon K.-J. Low Frequency Ultrasonication of Degussa P25 TiO2 and Its Superior Photocatalytic Properties. J. Nanosci. Nanotechnol. 2016, 16, 4399–4404. 10.1166/jnn.2016.10994. [DOI] [PubMed] [Google Scholar]
- Yeredla R. R.; Xu H. An Investigation of Nanostructured Rutile and Anatase Plates for Improving the Photosplitting of Water. Nanotechnology 2008, 19, 055706. 10.1088/0957-4484/19/05/055706. [DOI] [PubMed] [Google Scholar]
- Rui Z.; Wu S.; Peng C.; Ji H. Comparison of TiO2 Degussa P25 with Anatase and Rutile Crystalline Phases for Methane Combustion. Chem. Eng. J. 2014, 243, 254–264. 10.1016/j.cej.2014.01.010. [DOI] [Google Scholar]
- Wang D.; Zhao X. L.; Zhang H.; Guo H. L. Study on Morphological Distribution of Photogenerated Superoxide Radicals Produced by Different Crystal Titanium Dioxide. Chin. J. Anal. Chem. 2017, 45, 1882–1887. 10.11895/j.issn.0253-3820.171378. [DOI] [Google Scholar]
- Jiang X.; Manawan M.; Feng T.; Qian R.; Zhao T.; Zhou G.; Kong F.; Wang Q.; Dai S.; Pan J. H. Anatase and Rutile in Evonik Aeroxide P25: Heterojunctioned or Individual Nanoparticles?. Catal. Today 2018, 300, 12–17. 10.1016/j.cattod.2017.06.010. [DOI] [Google Scholar]
- Xu N.; Huang H.; Ouyang H.; Wang H. Preparation of the Heterojunction Catalyst N-Doping Carbon Quantum Dots/P25 and Its Visible Light Photocatalytic Activity. Sci. Rep. 2019, 9, 9971 10.1038/s41598-019-46277-7. [DOI] [PMC free article] [PubMed] [Google Scholar]
- Isai K. A.; Shrivastava V. S. Photocatalytic Degradation of Methylene Blue Using ZnO and 2% Fe–ZnO Semiconductor Nanomaterials Synthesized by Sol–Gel Method: A Comparative Study. SN Appl. Sci. 2019, 1, 1247 10.1007/s42452-019-1279-5. [DOI] [Google Scholar]
- Azarang M.; Shuhaimi A.; Yousefi R.; Jahromi S. P. One-Pot Sol–Gel Synthesis of Reduced Graphene Oxide Uniformly Decorated Zinc Oxide Nanoparticles in Starch Environment for Highly Efficient Photodegradation of Methylene Blue. RSC Adv. 2015, 5, 21888–21896. 10.1039/C4RA16767H. [DOI] [PMC free article] [PubMed] [Google Scholar]
- Ikram M.; Mahmood A.; Haider A.; Naz S.; Ul-Hamid A.; Nabgan W.; Shahzadi I.; Haider J.; Ahmad I.; Ali S. Dye Degradation, Antibacterial and in-Silico Analysis of Mg/Cellulose-Doped ZnO Nanoparticles. Int. J. Biol. Macromol. 2021, 185, 153–164. 10.1016/j.ijbiomac.2021.06.101. [DOI] [PubMed] [Google Scholar]
- Satheesan M. K.; Baiju K. V.; Kumar V. Influence of Defects on the Photocatalytic Activity of Niobium-Doped ZnO Nanoparticles. J. Mater. Sci.: Mater. Electron. 2017, 28, 4719–4724. 10.1007/s10854-016-6114-9. [DOI] [Google Scholar]
- Ali Ahmad S. O.; Ikram M.; Imran M.; Naz S.; Ul-Hamid A.; Haider A.; Shahzadi A.; Haider J. Novel Prism Shaped C3N4-Doped Fe@Co3O4nanocomposites and Their Dye Degradation and Bactericidal Potential with Molecular Docking Study. RSC Adv. 2021, 11, 23330–23344. 10.1039/d1ra03949k. [DOI] [PMC free article] [PubMed] [Google Scholar]
- Zarrindokht E.-K.; Pegah C. Antibacterial Activity of ZnO Nanoparticle on Gram-Positive and Gram-Negative Bacteria. Afr. J. Microbiol. Res. 2011, 5, 1368–1373. 10.5897/AJMR10.159. [DOI] [Google Scholar]
- Sharmila G.; Pradeep R. S.; Sandiya K.; Santhiya S.; Muthukumaran C.; Jeyanthi J.; Kumar N. M.; Thirumarimurugan M. Biogenic Synthesis of CuO Nanoparticles Using Bauhinia Tomentosa Leaves Extract: Characterization and Its Antibacterial Application. J. Mol. Struct. 2018, 1165, 288–292. 10.1016/j.molstruc.2018.04.011. [DOI] [Google Scholar]
- Ahmed B.; Solanki B.; Zaidi A.; Khan M. S.; Musarrat J. Bacterial Toxicity of Biomimetic Green Zinc Oxide Nanoantibiotic: Insights into ZnONP Uptake and Nanocolloid–Bacteria Interface. Toxicol. Res. 2019, 8, 246–261. 10.1039/C8TX00267C. [DOI] [PMC free article] [PubMed] [Google Scholar]
- Imani S.International Journal of Nano Dimension Determining the Antibacterial Effect of ZnO Nanoparticle against the Pathogenic Bacterium, Shigella Dysenteriae (Type 1). 2011, 1 ( (4), ), 279–285.
- Dale G. E.; Broger C.; D’Arcy A.; Hartman P. G.; DeHoogt R.; Jolidon S.; Kompis I.; Labhardt A. M.; Langen H.; Locher H. A Single Amino Acid Substitution in Staphylococcus Aureus Dihydrofolate Reductase Determines Trimethoprim Resistance. J. Mol. Biol. 1997, 266, 23–30. 10.1006/jmbi.1996.0770. [DOI] [PubMed] [Google Scholar]
- McAuley S.; Huynh A.; Howells A.; Walpole C.; Maxwell A.; Nodwell J. R. Discovery of a Novel DNA Gyrase-Targeting Antibiotic through the Chemical Perturbation of Streptomyces Venezuelae Sporulation. Cell Chem. Biol. 2019, 26, 1274–1282. 10.1016/j.chembiol.2019.06.002. [DOI] [PMC free article] [PubMed] [Google Scholar]
Associated Data
This section collects any data citations, data availability statements, or supplementary materials included in this article.