

Abstract
The hydrothermal dissolution-recrystallization process is a key step in the crystal structure of titania-based nanotubes and their composition. This work systematically studies the hydrothermal conditions for directly synthesizing anatase TiO2 nanotubes (ATNTs), which have not been deeply discussed elsewhere. It has been well-known that ATNTs can be synthesized by the calcination of titanate nanotubes. Herein, we found the ATNTs can be directly synthesized by optimizing the reaction temperature and time rather than calcination of titanate nanotubes, where at each temperature, there is a range of reaction times in which ATNTs can be prepared. The effect of NaOH/TiO2 ratio and starting materials was explored, and it was found that ATNTs can be prepared only if the precursor is anatase TiO2, using rutile TiO2 leads to forming titanate nanotubes. As a result, ATNTs produced directly without calcination have excellent photocatalytic CO2 reduction than titanate nanotubes and ATNTs prepared by titanate calcination.
1. Introduction
Industrial activities are escalating day by day, and the carbon dioxide (CO2) level is rising more rapidly than ever, causing the greatest ecological concern for atmospheric pollution and magnifying the natural greenhouse effect on the earth. This necessitates the development of sustainable technology with minimal environmental impact. Such a technique could minimize CO2 emissions and be used in the chemical process industries and fuels. Photocatalytic CO2 reduction is an excellent green chemistry technology for directly converting CO2 by natural sunlight into fuels such as CO, CH4, CH3OH, etc.1,2 It is known that the CO2 photocatalysis efficiency of photocatalyst depends on its physicochemical properties, the position of the conduction band (CB), the ability for light absorption, photon energy, light intensity, surface catalytic active sites, e–/h+ separation, and adsorption and desorption of reactants and intermediates.2−4 However, semiconductors are promising photocatalysts,5−8 in specific TiO2 nanoparticles, due to their stability, abundance, cost-effectiveness, and corrosion resistance. The only barrier for TiO2 is its wide bandgap which can be enhanced by doping with other nonmetals, metals, or their oxides.9−12
Morphology tuning is a potential approach to enhance photocatalytic activity. Among various morphologies, nanotubes (NTs) are preferable due to their large surface area, low recombination rate, and charge separation.13,14 Therefore, considerable attention has been paid to studying the mechanism and the conditions of preparing the TiO2 nanotubes (TNTs); because of that, TNTs not only have an extensive surface area for appropriate photon absorption compared to the conventional materials but also have channels to improve the electron transfer, thereby significantly increasing the electrolytic and photocatalytic efficiencies.15 In addition, purity, crystallinity, and stability at high temperatures are essential for all of these applications.15 TNTs can be derived with different phases such as sodium titanate (Na2Ti3O7), hydrogen titanate (H2Ti3O7), and anatase TiO2 nanotubes (ATNTs), but ATNTs show higher photocatalytic activity than titanates.16 This was confirmed by studying the significant impact of sodium ions on the photocatalytic performance of titanate NTs during the photocatalytic reaction.17−20 Moreover, the protonation of titanate NTs to remove the sodium ions leads to luminescence quenching, assuring that sodium sites are associated with the radiative recombination centers.21 This refers to that Na+ impurity works as a recombination source which significantly decreases the photocatalytic performance of TNTs. Hence, the preparation of pure TNTs is required to improve the catalytic activities. ATNT is best suited for photocatalysis due to its high purity, crystallinity, stability, higher specific area, and efficiency compared to the other titanate phases and rutile form.1,22,23
To the best of our knowledge, no reports have accomplished the conditions to synthesize ATNTs, whereas massive discussions have taken place on the mechanism formation of TNTs in general. In their innovative research, Li et al. reported that the anatase phase was formed, suggesting that the reaction is incomplete because the anatase precursor is large in size. In addition, they are unsystematically extending the reaction time to 168 h, resulting in the phase transition from anatase to sodium titanate. Moreover, when the precursor is rutile, only the rutile phase is detected, and the reaction is also incomplete.24 Poudel et al. used anatase nanopowder and micropowder as precursors and proposed that the hydrothermal (HT) synthesis of pure crystalline anatase TNTs involves optimization of the volume filling of the autoclave and the concentration of the acid during the process of washing as well. However, it is clear that the conditions are accurate only if the addition of TiO2/NaOH > 0.3.15 Suzuki et al. also started with anatase TiO2 powder, where they obtained hydrogen titanate after the acidic washing process. The reason is that the ratio TiO2/NaOH is minimal;25 a similar result and cause were observed by Sun et al.26 Further reviewing the literature, we concluded that no ATNTs were reported when the starting materials were not pure anatase or the reaction time range to obtain anatase TiO2 decreases with increasing the hydrothermal temperature.27,28
In this research work, we found that by adding 3 g of anatase TiO2 to 100 mL of 10 M NaOH, we obtained anatase TiO2 with a 50% filling fraction. This study investigated the phase transitions from titania NTs to titanate NTs and vice versa at various temperatures, reaction time intervals, NaOH/TiO2 ratios, precursors, and thermal behavior of ATNTs produced by a simple hydrothermal process. This phase transition cycle is crucial since some of the earlier transitions were reported at random conditions. Moreover, the photocatalytic CO2 reduction performance of prepared ATNT by optimizing the hydrothermal recrystallization process (NC-ATNT), Na2Ti3O7 NTs, and ATNT prepared by calcination of Na2Ti3O7 (C-ATNT) were also compared.
2. Experimental Section
2.1. Materials
Titanium(IV) oxide, −325 mesh (>99%), sodium hydroxide (≥98%), and hydrochloric acid (37%) were purchased from Sigma-Aldrich. The materials were used without any further purification, and nanopure water was used during the experiments.
2.2. TNTs Preparation
This study aims to solve the argumentative preparation of TNTs in a straightforward step with the hydrothermal method. Titanate products were prepared by a typical reaction with different conditions like reaction temperature and/or time, NaOH/TiO2 ratio, and various precursors. Typically, 1.5 g of titanium(IV) oxide (anatase phase) was stirred with 50 mL of NaOH solution (10 M) for 30 min at 80 °C (400 rpm), followed by sonication for 30 min. The suspension was transferred into a 100 mL sealed Teflon container (50% filled), and the reactions were performed at 130 °C for 24, 30, 36, 42, 54, 60, and 96 h, also at 110 °C for 24, 48, 72, and 96 h, and at 150 °C for 24, 48, and 72 h. Similarly, the reactions were performed at 130 °C for 24 with 0.5 g and 1 g amounts of titanium(IV) oxide to explore the TNT phase at different NaOH/TiO2 ratios. Moreover, the reaction was performed with the rutile phase as precursors following the same preparation conditions of the sample of 130 °C for 24 h. The prepared powder was washed with HCl (1 M) twice and seven times with nanopure water until the pH reached 5. As a result, the TNT phase transformation was studied without any temperature annealing, and the produced ATNT was controlled. The configuration mechanism of HT-derived TiO2 anatase depends on the selection of precursors and the reaction conditions. Finally, for the photocatalytic efficiency comparison, a conventional synthesis of pure ATNT was performed by the calcination of the prepared Na2Ti3O7 (at 110 °C for 96 h) sample at 400 °C for 5 h. The obtained TNTs powder was stored in clean and dried viles for further studies.
2.3. Photocatalytic CO2 Reduction
The CO2 conversion was carried out in an offline quartz reactor (150 mL) under simulator solar light (300 W xenon lamp). The reactor was filled with 10 mL of nanopure water and mixed with 50 mg of the prepared NT. The mixture was sonicated for 20 min and dried for 10 h at 70 °C in a hot air oven, forming a thin layer of film at the bottom of the reactor.2 0.12 g of NaHCO3 (Alfa Aesar, 99.7%) was inserted into the reactor before sealing with a rubber septum. Prior to the illumination, the reactor was purged with Ar gas for 20 min to attain anaerobic conditions and injected with 0.35 M HCl aqueous solution for in situ generations of CO2 gas and H2O vapor. After 1 h of illumination, an offline 250 μL injection was withdrawn from the reactor and detected via a GC-2014C Shimadzu gas chromatograph equipped with a flame ionization detector and a methanizer. The stability of the samples was investigated by continuing the photoreaction for a further 4 h of irradiation. The apparent quantum yield (AQY) of NC-ATNT was quantified for the photoreaction at a 365 nm band-pass filter, and the photocatalytic products (CH4) were calculated using eqs 1 and 2:
| 1 |
where Nph is the number of incident photons and calculated using the following equation:
| 2 |
where I is the intensity of incident light, A is the light illumination area, t is the illumination time, ℏ is Planck’s constant, c is the speed of light, and NA is Avogadro’s constant (6.022 × 10²³ mol–1).
CO2 conversion is calculated using eq 3:
| 3 |
3. Results and Discussion
3.1. Effect of Reaction Time
Figure 1a shows the XRD patterns and the phase transformation of TNTs prepared at 130 °C with different reaction times. It can be seen that the crystallinity and the TNTs phase are dependent on the preparation time duration with a constant temperature. Pure ATNTs (JCPDS card no. 21-1272) were obtained for the reaction durations of 24, 30, 36, and 42 h. Beyond the 42 h reaction time (54 h), a mixture phase of TiO2 (anatase and sodium titanate) was observed, where the anatase phase transforms to Na2Ti3O7 NTs. Further increasing the reaction time (60 h, 96 h), ATNTs are entirely converted to pure Na2Ti3O7 NTs (JCPDS no. 31-1329). The purity of the TNTs was further confirmed through an energy dispersive X-ray spectrometer (EDX). Figure S1a displays the EDX spectrum of ATNTs, verifying product purity and only confirming the existence of Ti and O. Similarly, Figure S1b shows the purity of Na2Ti3O7 NTs and indicates only the presence of Ti, Na, and O components. Fourier transform infrared (FTIR) spectroscopy was performed to analyze the different functional groups in the TNTs. Figure 1b shows FTIR spectra of TNTs prepared at 130 °C for 24, 36, 54, and 96 h. A wide fingerprint centered at 600 cm–1 is attributed to the bending vibration (Ti–O–Ti) bonds in the TNTs lattice.29 The intermolecular interaction of OH group for H2O molecule with TiO2 surface assigned to the wideband centered at 3400 cm–1.29 The fingerprint at 1640 cm–1 corresponds to the characteristic OH– group bending vibration. It is evident that the ATNTs phase has wider fingerprints than Na2Ti3O7 NTs. Usually, the OH group in the TNTs decreases with increasing the temperature or time reaction30 or can be reduced to a constant value,31 which implies the NTs might be in the form of titanates rather than titania30 and could disappear at high-temperature calcination.32 However, the longer reaction time (>54 h) could break the Ti–O bonds and form titanate NTs by intercalating Na+ and OH– ions into the structure.31,33 Therefore, the stronger intensity of the OH group in the sample of synthetic time 96 h could be due to the intercalation of the free OH– ions into the structure of the Na2Ti3O7 NTs. This result is also observed in the X-ray photoelectron spectroscopy (XPS) analysis (Figure 7f), which showed the presence of OH and H–O–H at a higher concentration than in other TNTs, indicating the intercalation of OH– in the structure of the Na2Ti3O7 NTs. FTIR results confirm the high purity of prepared TNTs.
Figure 1.

(a) XRD patterns of TNTs, (b) FTIR spectra, and (c) Raman spectra of TNTs prepared at 130 °C for different reaction times.
Figure 7.

HRXPS spectra of Ti 2p and O 1s core levels of (a,b) NC-ATNT, (c,d) C-ATNT, and (e,f) Na2Ti3O7 NTs.
The prepared TNTs were further investigated by Raman spectroscopy to study the structural origin of the products. Figure 1c shows the Raman spectra of the TNTs prepared at 130 °C for 24, 36, 54, and 96 h. Raman peaks of the products synthesized for 24 and 36 h located at 135, 385, 511, and 632 cm–1 can be classified, respectively, to the Eg, B1g, A1g, and Eg vibration modes of ATNTs. The vibrational frequencies’ intensity ratios confirm the ATNTs phase’s purity.34 On the other hand, the NTs at reaction times for 54 and 96 h exhibit characteristic vibrational frequencies at 195 cm–1, corresponding to the Na–O–Ti lattice modes, whereas the Raman peaks at 275, 439, and 686 cm–1 correspond to the Ti–O–Ti stretching in edge-shared TiO6.35 The wideband at 890 cm–1 is accredited to the stretch vibration of the short bonds of Ti–O, whose O2 atoms are not shared among the distorted TiO6 units.35 However, the TNTs prepared for 54 h show an extra Raman peak located at 135 cm–1 attributed to ATNTs. These results agreed well with the XRD pattern for the prepared TNTs, where the pure ATNTs phase was found for the TNTs prepared for 24 and 36 h, mixture phase of anatase and sodium titanate NTs for the reaction held at 54 h, and pure sodium titanate phase for the TNTs prepared for more than 54 h at 130 °C. Overall, the Raman study confirms the phase’s transformation proven by XRD results.
The morphology and tubular structure investigation for prepared TNTs were confirmed by field emission scanning electron microscopy (FE-SEM) and transmission electron microscopy (TEM). Figure 2 depicts FE-SEM images of synthesized TNTs, demonstrating the growth of numerous fiber-like TNs. Lower magnification images (Figure 2a,c,e,g) show that the growing TNTs had homogeneous and uniform morphologies for all reaction periods of prepared TNTs. The well-dispersed TNTs and tubular structure are confirmed by higher magnification images (Figure 2b,d,f,h). Moreover, FE-SEM images show that the high-yield NTs can reach a length of up to a few millimeters, and the density of the TNs decreases with increasing the reaction period. In other words, the mixture phase TNTs and the pure sodium titanate NTs show agglomeration of NTs with large voids and open tubes forming 2D sheets (Figure 2g,h). In short, the ATNTs’ growth is highly developed with excellent tubular structure, suggesting a higher photocatalytic efficiency and structural stability.
Figure 2.

FE-SEM images of the prepared TNTs at 130 °C for (a, b) 24 h, (c, d) 36 h, (e, f) 54 h, and (g, h) 96 h reaction time.
The tubular structure of the prepared TNTs was confirmed by TEM imaging analysis. Figure 3 clearly shows that TNTs are highly crystallized with large outer wall morphology and multiwall NTs with a diameter of approximately 6 nm. The pure ATNTs phase (Figure 3a,b) shows lengthier NTs and is more uniform than sodium titanate NTs (Figure 3c,d), which is consent with FE-SEM images.
Figure 3.

TEM images of the prepared TNTs at 130 °C for (a) 24 h, (b) 36 h, (c) 54 h, and (d) 96 h reaction time.
3.2. Correlation between Reaction Time and Temperature
To investigate the energy and time required to prepare highly crystalline ATNTs as well as the influence of temperature and preparation time on the crystallinity and purity of ATNTs, the growth of TNTs was carried out at 110 and 150 °C for different time durations. At 110 °C, the crystal structure of the NTs was anatase TiO2 even after 72 h reaction time. Further increase in the reaction beyond 72 h, the phase transferred to sodium titanate NTs (Figure 4a). At 150 °C, the crystal structure quickly turned from the TiO2 anatase phase to TiO2 sodium titanate phase NTs beyond 24 h of reaction time (Figure 4b). Hence, by increasing the reaction temperature, the time range to produce pure ATNTs significantly decreased. Figures 1a and 4a,b show the required time range in which we can produce ATNTs decreases with an increase in the reaction temperature. The tubular morphology of the prepared TNTs at 110 °C (24, 72, 96 h) and 150 °C (24, 72 h) was confirmed by FE-SEM imaging analysis and is shown in Figure 4c–l. Similar to the finding of the TNTs produced at 130 °C, FE-SEM images demonstrate that high-yield NTs have a length of up to a few millimeters and the agglomeration of the TNTs reduced by prolonging the reaction duration. ATNTs show dense aggregation of NTs (Figure 4c–f,i,j), whereas the sodium titanate NTs displayed aggregation of NTs with large voids (Figure 4g,h,k,l). In comparison between Figures 2 and 4, the voids decrease with increasing the reaction temperature.
Figure 4.

XRD patterns of TNTs prepared at (a) 110 °C and (b) 150 °C with different reaction times. FE-SEM images of the prepared TNTs at 110 °C for (c,d) 24 h, (e,f) 72 h, and (g,h) 96 h reaction time and at 150 °C for (i,j) 24 h and (k,l) 72 h reaction time.
3.3. The Effect of NaOH/TiO2 Ratio and Precursors
Alkaline hydrothermal synthesis is a typical method of fabricating very small TNTs, as small as 6 nm (TEM images (Figure 3)), with enhanced crystallinity; different crystal structures could be derived apart from ATNTs with different NaOH:TiO2 ratios. Figure 5a shows the XRD results of the TNTs prepared with different NaOH/TiO2 ratios at 130 °C for 24 h. For the ratio of 0.5 g of the starting material (anatase TiO2) in 50 mL NaOH (10 M), the crystal structure is sodium titanate NTs. By increasing the starting material loading from 0.5 g to 1 g, the crystal structure changes from sodium titanate to mixture phases of anatase TiO2 and sodium titanate NTs, and further increasing to 1.5 g, the crystal structure of the obtained TNTs was pure ATNTs with increased crystallinity. Consequently, the precursor loading greatly influenced the phase transition, purity, and crystallinity of the growing TNTs. The morphology and tubular structure of the synthesized samples were examined, and the results are depicted in Figure 5b–e for 0.5 g and 1 g loading samples and Figure 2a,b for 1.5 g loading sample. As can be observed, the density of the NTs aggregation increases as the precursor concentration increases, and the voids reduce as the precursor amount increases. Fundamentally, NTs can be obtained by the hydrothermal method with different starting materials;36,37 the structural properties of the TNTs are highly dependent on the starting TiO2 materials. Various research groups suggested synthesizing TNTs with the anatase phase was the favored phase for higher surface area, verified based on the crystalline properties.38−40 The crystallinity of the TNTs was stated to be slightly better using the anatase TiO2 phase as a precursor.15 In this work, we have used rutile and anatase as precursors; the reactions were carried out at 130 °C for 24 h. The TiO2 anatase phase was obtained when anatase was used as a precursor, whereas the sodium titanate phase was obtained when using rutile as a precursor (Figure 5f). It is clear that the starting material has to be anatase TiO2 to obtain ATNTs. The morphology structure of the obtained sodium titanate NTs shows a mixture of nanoparticles and NTs (Figure 5g,h), indicating nonhomogeneous TNTs growth with rutile as precursors.
Figure 5.

XRD patterns of TNTs prepared (a) with different NaOH/TiO2 ratios at 130 °C for 24 h. FE-SEM images of prepared TNTs with NaOH:TiO2 ratios (b,c) 0.5 g, (d,e) 1 g of anatase precursor. XRD patterns of TNTs prepared (f) with different precursors at 130 °C for 24 h. (g,h) FE-SEM images of prepared TNTs with rutile as a precursor.
3.4. Calcination Effect
In most reported studies, ATNTs can be formed after calcination treatment of titanate.27,28,41−45 The prepared Na2Ti3O7 (at 110 °C for 96 h) was calcinated at 400 °C for 5 h, resulting in a pure phase ATNT (C-ATNT) (JCPDS card no. 21-1272), as shown in Figure 6a. The structure shows lower crystallinity and missing crystal planes than ATNTs prepared by optimizing the reaction temperature and hydrothermal dissolution-recrystallization process (NC-ATNT) (Figure 1a). The crystallinity would be enhanced with a higher temperature of calcination, but the tubular morphology tends to be destroyed beyond 400 °C of calcination,28 converting to a nanorod shape at 500–600 °C and then nanoparticles at >600 °C.27,41,44,45Figure 6b,c depicts the FE-SEM images of prepared C-ATNT and shows a shorter tubular structure than the NC-ATNT (Figure 2a,b). Therefore, optimizing the hydrothermal dissolution–recrystallization process is a novel procedure for preparing efficient and crystalline ATNTs with uniform and lengthier tubular structures than the conventional process of calcination treatment of titanate.
Figure 6.

(a) XRD patterns of TNTs prepared with calcination of titanate at 400 °C for 5 h. (b,c) FE-SEM images of prepared C-ATNT.
3.5. X-ray Photoelectron Spectroscopy Study
XPS investigation was executed to explore the TNTs composition, chemical state, and to understand the active sits in the prepared NC-ATNT, C-ATNT, and Na2Ti3O7 NTs. Figure 7a shows the high-resolution XPS (HR-XPS) of the Ti 2p core level of the NC-ATNT, two strong peaks located at 459 and 464.8 eV, which are ascribed to Ti 2p3/2 and Ti 2p1/2, respectively, arise from spin–orbit splitting. These peaks suggest the existence of Ti in the form of a Ti4+ state, which would be the only active site in photocatalytic CO2 reduction. In the case of C-ATNT, the Ti 2p core levels elaborated into two-component peaks with binding energies of 458.4 and 460.4 eV for Ti 2p3/2 and 464.2 eV and 466.2 for Ti 2p1/2 (Figure 7c). The minor shakeup satellites located at 460.4 and 466.2 eV are attributed to the Ti3+ state. The reduction of the Ti4+ to Ti3+ state results in the formation of oxygen vacancies (Vos) on the surface of the TNT.46 Therefore, the presence of Ti3+/Vos act as an additional active site in the photocatalytic CO2 reduction.47 Similarly, the Ti 2p core level of Na2Ti3O7 NTs elaborated into two-component peaks with binding energies of 457.9 and 458.4 eV for Ti 2p3/2 and 463.6 and 466 eV for Ti 2p1/2 (Figure 7e). Herein, the concentration of Ti3+ is higher than of the C-ATNT, which dramatically could increase the selectivity in the photocatalytic CO2 reduction. Figure S2 depicts the Na 1s XPS spectrum located at 1072.9 eV, which can be ascribed to the attached sodium in the lattice in a valence state of +1.48 This indicates that the prepared TNT is a sodium titanate (Na2Ti3O7) NT. However, the concentration of Na can play a key role in the selectivity of photocatalytic CO2 reduction.49 Finally, Figure 7b,d,f shows the O 1s XPS spectra of the prepared NC-ATNT, C-ATNT, and Na2Ti3O7 NTs. It is revealed that there is a difference in the amount of adsorbed water molecules (H2Oads) and hydroxyl (OH–) on the surface of the TNTs. Differently, the Na2Ti3O7 shows a higher concentration of OH– and H–O–H groups, which would indicate the intercalation of OH– in the structure of the Na2Ti3O7 NTs. These findings match with FTIR analysis.
4. Photocatalytic CO2 Reduction
To study the advantages of the developed products, CO2 photocatalytic reduction was compared for noncalcinated ATNT (NC-ATNT), which was prepared by optimizing the hydrothermal recrystallization process (ATNT at 130 °C for 24 h), Na2Ti3O7 NTs, and ATNT prepared by calcination of Na2Ti3O7 (C-ATNT) under simulator solar light (300 W xenon lamp) for 1 h. However, an effective photocatalytic CO2 reduction would be achieved if an appropriate photocatalyst has a large surface-active site, maximal light absorption, a low e–/h+ recombination rate, and excellent e–/h+ separation and mobility.50−52 Nitrogen adsorption was used to determine the BET surface area of the investigated NTs.8,50Figure 8a depicts the measured surface areas of NC-ATNT, Na2Ti3O7 NTs, and C-ATNT samples, which are 118.1, 109.6, and 21.9 m2/g, respectively. The NC-ATNT has the most surface area, implying more active sites and better light harvesting. UV–vis DRS determined the light-harvesting ability of the prepared samples. The UV–vis absorption spectra of NC-ATNT, Na2Ti3O7, and C-ATNT samples are depicted in Figure 8b. NC-ATNT harvests the maximal light in the UV region and extends into the visible light region. TiO2 is an indirect bandgap energy (Eg) semiconductor;53,54 the estimated Eg values for NC-ATNT, Na2Ti3O7, and C-ATNT are 3.1, 3.27, and 3.2 eV, respectively, determined from Tauc’s plot55 as shown in Figure 7b. NC-ATNT has a narrower bandgap, which results in increased light-harvesting, leading to improved photocatalytic performance. The recombination rate, separation, and mobility of the carrier were explored. PL spectroscopy is a powerful technique for determining the rate of electron and hole recombination, where the recombination rate is proportional to the intensity of the PL spectra.56 The PL spectra of the examined samples are shown in Figure 8c; the NC-ATNT sample shows the lower PL spectrum, indicating the lower charge’s recombination rate of the sample. This suggests that NC-ATNT has improved charge separation and mobility. Time-resolved photoluminescence (TR-PL) spectra gave additional evidence of the higher performance. Examining the corresponding PL decay curves revealed information regarding the lifetime of photogenerated charge carriers and interfacial charge-transfer kinetics. Due to direct exciton recombination, the PL intensity of NC-ATNT is much lower than that of C-ATNT and Na2Ti3O7. In addition, the lifespan of electrons and holes is extended, as demonstrated by the lower fraction of NC-ATNT (Figure S4). Consequently, the prolonged recombination efficiency of the charge carriers in the NC-ATNT favors the improved photocatalytic activity. The charge separation efficiency is correlated with the photocurrent transient as well.7,55,57Figure 8d shows the photocurrent densities of the representative samples under simulated solar light. Compared to Na2Ti3O7 NT and C-ATNT, the NC-ATNT exhibit the highest photocurrent density, reflecting the role of the highest surface area and the excellent light-harvesting of NC-ATNT in improving the charge separation.
Figure 8.

(a) Nitrogen adsorption and desorption isotherms. (b) DRS UV–vis spectra and the Tauc’s plot. (c) PL spectra and (d) photocurrent response of NC-ATNT, Na2Ti3O7, and C-ATNT samples.
The high surface area, excellent light-harvesting, lowest e/h recombination rate, and highest photocurrent density obtained by the NC-ATNT sample are the key reasons behind its higher photocatalytic CO2 reduction than Na2Ti3O7 NTs and C-ATNTs (Figure 9a). Gas chromatography confirms that, in the presence of NC-ATNT, 48 μmol g–1 h–1 of CH4 and a neglectable amount of CO (0.12 μmol g–1 h–1) are released (Figure 9a), while in the presence of C-ATNT, 17 μmol g–1 h–1 of CH4 and 0.8 μmol g–1 h–1 of CO are generated. However, in the presence of Na2Ti3O7, 8.5 μmol g–1 h–1 of CO, 3.1 μmol g–1 h–1 of CH3OH, and 1.2 μmol g–1 h–1 of CH4 are released (Figure 9a). The different selectivity of the CO2 reduction by prepared NC-ATNT, C-ATNT, and Na2Ti3O7 NTs is due to the different active sites of each TNT. For the NC-ATNT, the Ti4+ state would be the only active site in the photocatalytic CO2 reduction for the selective production of CH4. In the case of C-ATNT, the reduction of the Ti4+ to Ti3+ state results in the formation of oxygen vacancies (Vos) on the surface of the TNT.46 Therefore, the presence of Ti3+/Vos acts as an additional active site and is selective for the production of CO.47 Similarly, the concentration of Ti3+ in Na2Ti3O7 NTs is higher than of the C-ATNT, and the selectivity of the production of CO would be dramatically increased. Moreover, the concentration of Na is a key role in the selectivity of the production of CH3OH.49
Figure 9.

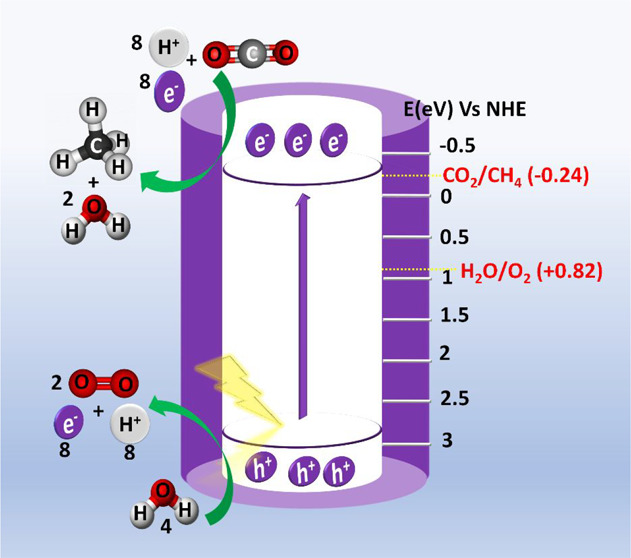
(a) Photocatalytic CO2 reduction of prepared NC-ATNT, Na2Ti3O7, C-ATNT samples, and commercial P25, anatase, and rutile TiO2 nanoparticles. (b) Stability of NC-ATNT under solar light. (c) Proposed photocatalytic mechanism of CO2 reduction by NC-ATNT.
The photocatalytic activity of the commercial P25, anatase TiO2, and rutile TiO2 before hydrothermal treatments were carried out and compared with prepared TNTs (Figure 9a). The photoreactions were performed in the absence of the catalyst and/or the absence of light. No products were recorded (Figure 9a), indicating that the produced products are photocatalytic CO2 reduction products. Besides, the average efficiency after 4 h of photoreaction for NC-ATNT is 188.4 μmol g–1 for CH4 (Figure 9b). This reflects the stability of the developed ATNTs. For comparison, the photocatalytic CO2 reduction performance of ATNTs synthesized at different temperatures or times has been carried out under the same conditions. Figure S5 shows that the prepared TNTs at 130 °C have superiority in terms of efficiency and selectivity compared to TNTs prepared at 110 and 150 °C. It was noticed that the prepared TNT at 54 h has increased photocatalytic CO2 reduction efficiency. This could be due to the homojunction between the titanate and titania. The photocatalytic CO2 reduction of the NC-ATNTs was carried out upon light irradiation of different wavelengths, exactly at 385 and 400 nm; the obtained CH4 is 37.2 and 6.1 μmol g–1 h–1, respectively. The corresponding AQY was calculated and is shown in Figure S6. The AQY of the NC-ATNT is significantly greater than any other pure TNTs and many other TNT-based composites prepared using various methods. The CO2 conversion has been calculated by measuring the CO2 production in the absence of the NC-ATNT; it was found to be 1293 μmol g–1 h–1. From eq 3, the CO2 conversion was calculated to be 3.7%. Table 1 compares the photocatalytic CO2 reduction performance to existing literature. To understand the photocatalytic mechanism of CO2 reduction to CH4, the CB position (Ec) and the valence band position (Ev) of the TNTs have been determined using eqs 4–6:
| 4 |
| 5 |
| 6 |
where χ is the electronegativity of the TiO2 and has the value of 5.8 eV.58E(NHE) is energy in a normal hydrogen electrode scale. Using eqs 4–6, Ec was found to be −0.25, −0.326, and −0.3 V, and Ev was 2.85, 2.944, and 2.9 V for NC-ATNT, Na2Ti3O7, and C-ATNT, respectively. The Mott–Schottky measurement was conducted to further confirm the band diagrams of the prepared NC-ATNT, C-ATNT, and Na2Ti3O7. Figure S3 shows that all the samples have a positive slope, indicating that they are n-type semiconducting materials, and the flat band potentials (Efb) of the NC-ATNT, C-NTNT, and Na2Ti3O7 have values of −0.11, −0.13, and −0.16 V, respectively. The Efb level is virtually nearly the same as the Fermi level, and a 0.2 eV empirical difference exists between the CB and the Fermi level in n-type semiconductors.59,60 However, proton-assisted CO2 reduction by multiple electrons (e–) and protons (H+) is an effective technique for progressing photocatalytic CO2 reduction at lower reduction potentials. For example, −0.24 V reduction potential, eight electrons, and eight protons are required for photocatalytic conversion of CO2 to CH4 (vs NHE at pH 7). To provide a sufficient supply of e– and H+, H2O steam must be oxidized to oxygen (O2) in order to generate the e–s and H+s required for CO2 photoreduction.61 Thus, for successful CO2 photoreduction to methane, the photocatalyst’s CB has to be more negative than the CO2/CH4 reduction potential (−0.24 V vs NHE at pH 7), whereas the valence band’s position needs to be more positive than H2O’s oxidation potential (H2O/O2 + 0.82 V vs NHE at pH 7). As shown above, the positions of the Ec and Ev of all studied samples are efficient in achieving CO2 reduction and water splitting. In the presence of H2O vapor and CO2 gas, photoreduction is anticipated to begin with the adsorption of the reactants (CO2 and H2O) on the surface of TiO2 and then by photocatalytic activation via electron and hole transfer, respectively.62
Table 1. Major CO2 Reduction Products and Their Respective Titania Photocatalysts.
| Various TiO2 catalyst | Photoreactor condition | Product and yield (μmol g–1h–1) | Key Parameters for improved performance | ref |
|---|---|---|---|---|
| TiO2 anatase particles | 8 W Hg lamp | CH4: 3.9 | Optimal particle size (14 nm) resultant the highest yield | (66) |
| CH3OH: 0.5 | ||||
| H2: 58.3 | ||||
| CO: 0.5 | ||||
| TiO2 pellets | UV irradiation | CH4: 6.2 | (67) | |
| H2: 3 | ||||
| TiO2 (anatase, rutile, brookite) | 90 mW/cm2 solar simulator | CH4: 3.16 | The yield takes the order brookite > anatase > rutile; the enhancement was ascribed to the formation of oxygen vacancies and Ti3+ on the surface of brookite | (47) |
| CO: 2.8 | ||||
| TiO2 | UV irradiation | CH4: 4.11 | (68) | |
| CO: 0.14 | ||||
| C2H6: 0.1 | ||||
| TiO2 pellets (80% anatase) | Three UVC lamps | CH4: 4.16 | Three UV lamps at 253.7 (nm) | (69) |
| TiO2 pellets | UVC lamp | CH4: 0.25 | (70) | |
| H2: 0.16 | ||||
| Ultrathin TiO2 flakes | 300 W Hg lamp | CHOO: 1.9 | Ultralarge surface area | (71) |
| Anatase TiO2 by coexposed {001} and {101} facets | 300 W simulated solar Xenon arc lamp | CH4: 1.35 | Anatase TiO2 single crystals worked as heterojunction between the existences of facets | (72) |
| Anatase TiO2 nanosheets with exposed 95% facet | 300 W xenon arc lamp | CH4: 6 | Exposing a higher percentage of active facets of the TiO2 photocatalyst | (73) |
| Mesoporous TiO2 nanofibers | 300 W xenon arc lamp with UV–vis light irradiation | CH4: 19.55 | Solvothermal treatment enhanced the charge separation and the released adsorption sites | (74) |
| Hollow anatase TiO2 | 300 W xenon arc lamp | CH4: 1.7 | (75) | |
| Bicrystalline TiO2 (anatase– brookite) | 150 W solar simulator | CO: 2.1 | The interfaces between anatase and brookite nanocrystals enhanced the charge transfer and electron–hole separation | (76) |
| CH4: 0.05 | ||||
| Cubic anatase TiO2 | 300 W xenon lamp | CH4: 4.56 | High crystallinity and the band position of coexposed facets {100} and {001} are more negative | (77) |
| CH3OH: 1.48 | ||||
| TiO2 nanosheets with exposed {001} facet | Two 18 W Hg lamps | CH4: 0.204 | High-energy exposed {001} facets facilitate the charge separation and lower recombination rate of the carriers | (78) |
| CO: 0.106 | ||||
| CH3OH: 0.18 | ||||
| CH2O: 0.063 | ||||
| H2: 0.105 | ||||
| TiO2 nanoparticles | 500 W high-pressure xenon lamp | CH3OH: 0.48 | (79) | |
| Photosensitized TiO2 nanotubes | 500 W xenon lamp | CH3OH: 131.1 | Nanotubes with high specific surface area and high-intensity light source | (80) |
| CH4: 0.96 | ||||
| H2: 17.2 | ||||
| TiO2 (P25) | 500 W xenon lamp | CH3OH: 32.2 | ||
| CH4: 0.62 | ||||
| H2: 7.4 | ||||
| Anatase TiO2prepared by optimizing the hydrothermal recrystallization process | 300 W xenon lamp | CH4: 48 | This Work |
Due to the tubular morphology (wall-thickness ∼ carrier diffusion length), the generated charge carriers separated, and the h+ in the valence band of TiO2 dissolved H2O into H+s and OH– (eqs 7 and 8). The protons are transformed into atomic hydrogen (H*) after receiving an e– from the CB (eq 9), whereas adsorbed CO2 is activated to •CO2– by e– transfer from TiO2. After successive cycles of activated •CO2– with multiple H*, CH4 was produced as the final product. (eqs 10 and 11).63 The detection of CO as a minor byproduct suggests the carbene pathway as the mechanistic route for CO2 photoreduction in the C-ATNT sample.61,64 The absence of byproducts such as methanol, carboxylates (HCOO–, CO3–, HCO3–, etc.), and formaldehyde leads to the more selective formation of CH4. The enhanced CH4 yield and its selectivity strongly support the methanation of CO2 followed by the carbene pathway in the presence of H* atoms, leading to a formation of active surface carbon (C*) (eq 10), which is converted into CH4 (eq 11).64 Moreover, the less negative reduction potential of CO2/CH4 (−0.24 V vs NHE at pH 7) in comparison to CO2/CO (−0.53) is the obstacle in the formation of CO.2Figure 9c depicts the proposed photocatalytic mechanism of CO2 reduction by NC-ATNT.
| 7 |
| 8 |
| 9 |
| 10 |
| 11 |
The synergetic improvement of photocatalytic and CH4 selectivity of the NC-ATNT sample is a result of the anatase phase’s high surface area, light-harvesting ability, and low e/h recombination rate. However, the CO2 hydrogenation in the presence of Na2Ti3O7 exhibited 66 and 24% selectivity toward CO and CH3OH evolution, respectively; this finding is in line with prior research.49,65
5. Conclusion
Controlled hydrothermal synthesis for phase transitions from titania NTs to titanate NTs and vice versa was carried out with different conditions. For the first time, the ATNTs were obtained directly without further washing and calcination treatment of sodium titanate at a higher temperature range. Optimizing the hydrothermal reaction temperature and time, NaOH/TiO2 ratio, and the starting materials played a vital role in determining the purity of the titania phase. XRD, Raman, FTIR, and EDAX analyses confirm the crystal structure, crystallinity, and composition of the synthesized TNTs. SEM and TEM images verified the tubular morphology with a diameter of approximately 6 nm. Surface area, optical properties, and photocurrent density of NC-ATNT, ATNT, and Na2Ti3O7 NT samples were investigated. The NC-ATNT sample shows the highest surface area, most light-harvesting, and lowest e/h recombination rate. These properties enhanced the photocatalytic CO2 reduction of NC-ATNT and excellent selectivity toward CH4 production of an amount of 48 μmol g–1 h–1 and 0.95% AQY at 365 nm.
Acknowledgments
The authors are grateful to the DST National Single Crystal Diffractometer Facility Laboratory, DoS in Physics, DST-FIST (SR/FST/PSI-119/2019), CPEPA, DST-PURSE and IOE, Vijnana Bhavan, University of Mysore, Mysuru, for providing instrumentation facilities. The authors extend their appreciation to the Researchers Supporting Project number (RSP-2021/396), King Saud University, Riyadh, Saudi Arabia.
Supporting Information Available
The Supporting Information is available free of charge at https://pubs.acs.org/doi/10.1021/acsomega.2c04211.
Material characterization techniques and data (EDX, HR-XPS, M-S measurement, TR-PL, and photocatalytic CO2 reduction experiments) for the prepared TNTs (PDF)
Author Contributions
K. Alkanad: Conceptualization, data curation, writing original draft, investigation, methodology, editing, discussion, and formal analysis. A. Hezam: Conceptualization, writing original draft, methodology, investigation, formal analysis, methodology, and discussion. N. Al-Zaqri: Discussion, and funding acquisition. M. A. Bajiri: editing, methodology, formal analysis, investigation, and discussion. G. Alnaggar: Methodology, discussion, investigation, and editing. Q. A. Drmosh: Methodology, discussion, and investigation. H. A. Almukhlifi: Discussion and investigation. L. Neratur Krishnappagowda: Investigation, methodology, discussion, editing, and supervision.
The authors declare no competing financial interest.
Supplementary Material
References
- Indrakanti V. P.; Kubicki J. D.; Schobert H. H. Photoinduced activation of CO2 on Ti-based heterogeneous catalysts: Current state, chemical physics-based insights and outlook. Energy Environ. Sci. 2009, 2, 745–758. 10.1039/b822176f. [DOI] [Google Scholar]
- Alkanad K.; Hezam A.; Drmosh Q. A.; Sujay Shekar G. C.; AlObaid A. A.; Warad I.; Bajiri M. A.; Neratur Krishnappagowda L. Construction of Bi2S3/TiO2/MoS2 S-Scheme Heterostructure with a Switchable Charge Migration Pathway for Selective CO2 Reduction. Sol. RRL 2021, 5, 2100501. 10.1002/solr.202100501. [DOI] [Google Scholar]
- Xiong Z.; Lei Z.; Li Y.; Dong L.; Zhao Y.; Zhang J. A review on modification of facet-engineered TiO2 for photocatalytic CO2 reduction. J. Photochem. Photobiol. C: Photochem. Rev. 2018, 36, 24–47. 10.1016/j.jphotochemrev.2018.07.002. [DOI] [Google Scholar]
- Gong H.; Wang L.; Zhou K.; Zhang D.; Zhang Y.; Adamaki V.; Sergejevs A.; Bowen C. Improved photocatalytic performance of gradient reduced TiO2 ceramics with aligned pore channels. Adv. Powder Technol. 2022, 1, 100025. 10.1016/j.apmate.2021.11.011. [DOI] [Google Scholar]
- Marszewski M.; Cao S.; Yu J.; Jaroniec M. Semiconductor-based photocatalytic CO2 conversion. Mater. Horiz. 2015, 2, 261–278. 10.1039/C4MH00176A. [DOI] [Google Scholar]
- Alnaggar G.; Hezam A.; Drmosh Q.; Ananda S. Sunlight-driven activation of peroxymonosulfate by microwave synthesized ternary MoO3/Bi2O3/g-C3N4 heterostructures for boosting tetracycline hydrochloride degradation. Chemosphere 2021, 272, 129807. 10.1016/j.chemosphere.2021.129807. [DOI] [PubMed] [Google Scholar]
- Hezam A.; Namratha K.; Ponnamma D.; Drmosh Q. A.; Saeed A. M. N.; Cheng C.; Byrappa K. Direct Z-scheme Cs2O–Bi2O3–ZnO heterostructures as efficient sunlight-driven photocatalysts. ACS Omega 2018, 3, 12260–12269. 10.1021/acsomega.8b01449. [DOI] [PMC free article] [PubMed] [Google Scholar]
- Sujay Shekar G. C.; Alkanad K.; Alnaggar G.; Zaqri N. A.; Bajiri M. A.; Thejaswini B.; Dhileepan M.; Neppolian B.; Lokanath N. K. Surface defect engineered CeO2-x by ultrasound treatment for superior photocatalytic H2 production and water treatment. Catal. Sci. Technol. 2022, 12, 2071–2083. 10.1039/D1CY01940F. [DOI] [Google Scholar]
- Murakami N.; Saruwatari D.; Tsubota T.; Ohno T. Photocatalytic reduction of carbon dioxide over shape-controlled titanium (IV) oxide nanoparticles with co-catalyst loading. Curr. Org. Chem. 2013, 17, 2449–2453. 10.2174/13852728113179990058. [DOI] [Google Scholar]
- Zhang Q.; Li Y.; Ackerman E. A.; Gajdardziska-Josifovska M.; Li H. Visible light responsive iodine-doped TiO2 for photocatalytic reduction of CO2 to fuels. Appl. Catal. A: Gen. 2011, 400, 195–202. 10.1016/j.apcata.2011.04.032. [DOI] [Google Scholar]
- Qin Y.; Guo Y.; Liang Z.; Xue Y.; Zhang X.; Yang L.; Tian J. Au nanorods decorated TiO2 nanobelts with enhanced full solar spectrum photocatalytic antibacterial activity and the sterilization file cabinet application. Chin. Chem. Lett. 2021, 32, 1523–1526. 10.1016/j.cclet.2020.10.020. [DOI] [Google Scholar]
- Qian Y.; Wei Y.; Sun M.; Han Y.; Zhang X.; Tian J.; Shao M. Heterostructuring 2D TiO2 nanosheets in situ grown on Ti3C2Tx MXene to improve the electrocatalytic nitrogen reduction. Chin. J. Catal. 2022, 43, 1937–1944. 10.1016/S1872-2067(21)64020-2. [DOI] [Google Scholar]
- Pugazhenthiran N.; Murugesan S.; Anandan S. High surface area Ag-TiO2 nanotubes for solar/visible-light photocatalytic degradation of ceftiofur sodium. J. Hazard. Mater. 2013, 263, 541–549. 10.1016/j.jhazmat.2013.10.011. [DOI] [PubMed] [Google Scholar]
- Adán C.; Marugán J.; Sánchez E.; Pablos C.; Van Grieken R. Understanding the effect of morphology on the photocatalytic activity of TiO2 nanotube array electrodes. Electrochim. Acta 2016, 191, 521–529. 10.1016/j.electacta.2016.01.088. [DOI] [Google Scholar]
- Poudel B.; Wang W. Z.; Dames C.; Huang J. Y.; Kunwar S.; Wang D. Z.; Banerjee D.; Chen G.; Ren Z. F. Formation of crystallized titania nanotubes and their transformation into nanowires. Nanotechnology 2005, 16, 1935–1940. 10.1088/0957-4484/16/9/086. [DOI] [Google Scholar]
- Aphairaj D.; Wirunmongkol T.; Niyomwas S.; Pavasupree S.; Limsuwan P. Synthesis of anatase TiO2 nanotubes derived from a natural leucoxene mineral by the hydrothermal method. Ceram. Int. 2014, 40, 9241–9247. 10.1016/j.ceramint.2014.01.145. [DOI] [Google Scholar]
- Bavykin D. V.; Walsh F. C.. Titanate and Titania Nanotubes: Synthesis Properties and Applications; The Royal Society of Chemistry: Cambridge, UK, 2010. [Google Scholar]
- Fujishima A.; Hashimoto K.; Watanabe T.. TiO2 Photocatalysis Fundamentals and Applications; BKC, Inc.: Tokyo, Japan, 1999. [Google Scholar]
- Qamar M.; Yoon C.; Oh H.; Lee N.; Park K.; Kim D.; Lee K.; Lee W.; Kim S. Preparation and photocatalytic activity of nanotubes obtained from titanium dioxide. Catal. Today. 2008, 131, 3–14. 10.1016/j.cattod.2007.10.015. [DOI] [Google Scholar]
- Turki A.; Kochkar H.; Guillard C.; Berhault G.; Ghorbel A. Effect of Na content and thermal treatment of titanate nanotubes on the photocatalytic degradation of formic acid. Appl. Catal. B: Environ. 2013, 138, 401–415. 10.1016/j.apcatb.2013.03.020. [DOI] [Google Scholar]
- Riss A.; Berger T.; Grothe H.; Bernardi J.; Diwald O.; Knözinger E. Chemical control of photoexcited states in titanate nanostructures. Nano Lett. 2007, 7, 433–438. 10.1021/nl062699y. [DOI] [PubMed] [Google Scholar]
- Ola O.; Maroto-Valer M. M. Review of material design and reactor engineering on TiO2 photocatalysis for CO2 reduction. J. Photochem. Photobiol. 2015, 24, 16–42. 10.1016/j.jphotochemrev.2015.06.001. [DOI] [Google Scholar]
- Puma G. L.; Bono A.; Krishnaiah D.; Collin J. G. Preparation of titanium dioxide photocatalyst loaded onto activated carbon support using chemical vapor deposition: a review paper. J. Hazard. Mater. 2008, 157, 209–219. 10.1016/j.jhazmat.2008.01.040. [DOI] [PubMed] [Google Scholar]
- Li M. J.; Chi Z. Y.; Wu Y. C. Morphology, chemical composition and phase transformation of hydrothermal derived sodium titanate. J. Am. Ceram. Soc. 2012, 95, 3297–3304. 10.1111/j.1551-2916.2012.05330.x. [DOI] [Google Scholar]
- Suzuki Y.; Yoshikawa S. Synthesis and thermal analyses of TiO2-derived nanotubes prepared by the hydrothermal method. J. Mater. Res. 2004, 19, 982–985. 10.1557/JMR.2004.0128. [DOI] [Google Scholar]
- Sun X.; Li Y. Synthesis and characterization of ion-exchangeable titanate nanotubes. Chem.—Eur. J. 2003, 9, 2229–2238. 10.1002/chem.200204394. [DOI] [PubMed] [Google Scholar]
- Wong C. L.; Tan Y. N.; Mohamed A. R. A review on the formation of titania nanotube photocatalysts by hydrothermal treatment. J. Environ. Manage. 2011, 92, 1669–1680. 10.1016/j.jenvman.2011.03.006. [DOI] [PubMed] [Google Scholar]
- Ou H.; Lo S. Review of titania nanotubes synthesized via the hydrothermal treatment: Fabrication, modification, and application. Sep. Purif. Technol. 2007, 58, 179–191. 10.1016/j.seppur.2007.07.017. [DOI] [Google Scholar]
- Gohari G.; Mohammadi A.; Akbari A.; Panahirad S.; Dadpour M. R.; Fotopoulos V.; Kimura S. Titanium dioxide nanoparticles (TiO2 NPs) promote growth and ameliorate salinity stress effects on essential oil profile and biochemical attributes of Dracocephalum moldavica. Sci. rep. 2020, 10, 912. 10.1038/s41598-020-57794-1. [DOI] [PMC free article] [PubMed] [Google Scholar]
- Yuan Z. Y.; Su B. L. Titanium oxide nanotubes, nanofibers and nanowires. Colloids Surf. A Physicochem. Eng. Aps. 2004, 241, 173–183. 10.1016/j.colsurfa.2004.04.030. [DOI] [Google Scholar]
- Yang J.; Jin Z.; Wang X.; Li W.; Zhang J.; Zhang S.; Guo X.; Zhang Z. Study on composition, structure and formation process of nanotube Na2Ti2O4(OH)2. Dalton Trans. 2003, 20, 3898–3901. 10.1039/b305585j. [DOI] [Google Scholar]
- Wang Y. M.; Liu H. Preparation and Characterizations of Na2Ti3O7, H2Ti3O7 and TiO2 Nanobelts. Adv. Mater. Res. 2011, 306, 1233–1237. 10.4028/www.scientific.net/AMR.306-307.1233. [DOI] [Google Scholar]
- Milanović M.; Stijepović I.; Nikolić L. M. Preparation and photocatalytic activity of the layered titanates. Process. Appl. Ceram. 2010, 4, 69–73. 10.2298/PAC1002069M. [DOI] [Google Scholar]
- Challagulla S.; Tarafder K.; Ganesan R.; Roy S. Structure sensitive photocatalytic reduction of nitroarenes over TiO2. Sci. rep. 2017, 7, 8783. 10.1038/s41598-017-08599-2. [DOI] [PMC free article] [PubMed] [Google Scholar]
- Barrocas B.; Silvestre A. J.; Rolo A. G.; Monteiro O. The effect of ionic Co presence on the structural, optical and photocatalytic properties of modified cobalt–titanate nanotubes. Phys. Chem. Chem. Phys. 2016, 18, 18081–18093. 10.1039/C6CP01889K. [DOI] [PubMed] [Google Scholar]
- Saponjic Z. V.; Dimitrijevic N. M.; Tiede D. M.; Goshe A. J.; Zuo X.; Chen L. X.; Barnard A. S.; Zapol P.; Curtiss L.; Rajh T. Shaping Nanometer-Scale Architecture Through Surface Chemistry. Adv. Mater. 2005, 17, 965–971. 10.1002/adma.200401041. [DOI] [Google Scholar]
- Wang B.; Xue D.; Shi Y.; Xue F.. Titania 1D nanostructured materials: synthesis, properties and applications; New Nova Science Publishers Inc.: New York: 2008; pp 163–201. [Google Scholar]
- Khan M. A.; Jung H.-T.; Yang O.-B. Synthesis and characterization of ultrahigh crystalline TiO2 nanotubes. J. Phys. Chem. B 2006, 110, 6626–6630. 10.1021/jp057119k. [DOI] [PubMed] [Google Scholar]
- Tsai C.-C.; Teng H. Regulation of the physical characteristics of titania nanotube aggregates synthesized from hydrothermal treatment. Chem. Mater. 2004, 16, 4352–4358. 10.1021/cm049643u. [DOI] [Google Scholar]
- Seo D.-S.; Lee J.-K.; Kim H. Preparation of nanotube-shaped TiO2 powder. J. Cryst. Growth. 2001, 229, 428–432. 10.1016/S0022-0248(01)01196-4. [DOI] [Google Scholar]
- Qu J.; Gao X.; Li G.; Jiang Q.; Yan T. Structure transformation and photoelectrochemical properties of TiO2 nanomaterials calcined from titanate nanotubes. J. Phys. Chem. C 2009, 113, 3359–3363. 10.1021/jp810692t. [DOI] [Google Scholar]
- Gao X.; Lan Y.; Zhu H.; Liu J.; Ge Y.; Wu F.; Song D. Electrochemical performance of anatase nanotubes converted from protonated titanate hydrate nanotubes. ECS Solid State Lett. 2005, 8, A26. 10.1149/1.1833632. [DOI] [Google Scholar]
- Xiao N.; Li Z.; Liu J.; Gao Y. Effects of calcination temperature on the morphology, structure and photocatalytic activity of titanate nanotube thin films. Thin Solid Films. 2010, 519, 541–548. 10.1016/j.tsf.2010.07.120. [DOI] [Google Scholar]
- Vijayan B.; Dimitrijevic N. M.; Rajh T.; Gray K. Effect of calcination temperature on the photocatalytic reduction and oxidation processes of hydrothermally synthesized titania nanotubes. J. Phys. Chem. C 2010, 114, 12994–13002. 10.1021/jp104345h. [DOI] [Google Scholar]
- Zhang L.; Lin H.; Wang N.; Lin C.; Li J. The evolution of morphology and crystal form of titanate nanotubes under calcination and its mechanism. J. Alloys Compd. 2007, 431, 230–235. 10.1016/j.jallcom.2006.05.065. [DOI] [Google Scholar]
- Bharti B.; Kumar S.; Lee H. N.; Kumar R. Formation of oxygen vacancies and Ti3+ state in TiO2 thin film and enhanced optical properties by air plasma treatment. Sci. Rep. 2016, 6, 32355. 10.1038/srep32355. [DOI] [PMC free article] [PubMed] [Google Scholar]
- Liu L.; Zhao H.; Andino L. M.; Li Y. Photocatalytic CO2 reduction with H2O on TiO2 nanocrystals: Comparison of anatase, rutile, and brookite polymorphs and exploration of surface chemistry. ACS Catal. 2012, 2, 1817–1828. 10.1021/cs300273q. [DOI] [Google Scholar]
- Li P.; Wang W.; Gong S.; Lv F.; Huang H.; Luo M.; Yang Y.; Yang C.; Zhou J.; Qian C.; et al. Hydrogenated Na2Ti3O7 epitaxially grown on flexible N-doped carbon sponge for potassium-ion batteries. ACS Appl. Mater. Interfaces. 2018, 10, 37974–37980. 10.1021/acsami.8b11354. [DOI] [PubMed] [Google Scholar]
- Díaz de León J. N.; Rodríguez J.; Rojas R. J.; Esqueda-Barrón Y.; Cardenas L.; Ramesh Kumar C.; Alonso-Nuñez G.; Fuentes-Moyado S. New insight on the formation of sodium titanates 1D nanostructures and its application on CO2 hydrogenation. Front. Chem. 2019, 7, 750–762. 10.3389/fchem.2019.00750. [DOI] [PMC free article] [PubMed] [Google Scholar]
- Alnaggar G.; Alkanad K.; Sujay Shekar G. C.; Bajiri M. A.; Drmosh Q. A.; Lokanath N. K.; Ananda S. Rational design of a 2D TiO2–MoO3 step-scheme heterostructure for boosted photocatalytic overall water splitting. New J. Chem. 2022, 46, 9629–9640. 10.1039/D2NJ00173J. [DOI] [Google Scholar]
- Drmosh Q.; Alade I. O.; Alkanad K.; Alnaggar G.; Khan A.; Khan M. Y.; Elsayed K. A.; Manda A. A.; Hossain M. K. WO3/BP/g-C3N4–based cauliflower nanocomposite fabricated by pulsed laser ablation for overall water splitting. Opt. Laser Technol. 2022, 151, 108014. 10.1016/j.optlastec.2022.108014. [DOI] [Google Scholar]
- Sujay Shekar G. C.; Alkanad K.; Hezam A.; Alsalme A.; Al-Zaqri N.; Lokanath N. K. Enhanced photo-Fenton activity over a sunlight-driven ignition synthesized α-Fe2O3-Fe3O4/CeO2 heterojunction catalyst enriched with oxygen vacancies. J. Mol. Liq. 2021, 335, 116186. 10.1016/j.molliq.2021.116186. [DOI] [Google Scholar]
- Drmosh Q.; Alade I. O.; Alkanad K.; Alnaggar G.; Khan A.; Khan M. Y.; Elsayed K. A.; Manda A. A.; Onaizi S. A. Fabrication of Z-scheme TiO2/BP/g-C3N4 nanocomposite via pulsed laser ablation in liquid for photocatalytic overall water splitting. Opt. Mater. 2022, 128, 112428. 10.1016/j.optmat.2022.112428. [DOI] [Google Scholar]
- Ge M.; Cao C.; Li S.; Zhang S.; Deng S.; Huang J.; Li Q.; Zhang K.; Al-Deyab S. S.; Lai Y. Enhanced photocatalytic performances of n-TiO2 nanotubes by uniform creation of p–n heterojunctions with p-Bi2 O3 quantum dots. Nanoscale 2015, 7, 11552–11560. 10.1039/C5NR02468D. [DOI] [PubMed] [Google Scholar]
- Hezam A.; Namratha K.; Drmosh Q.; Ponnamma D.; Saeed A. M. N.; Ganesh V.; Neppolian B.; Byrappa K. Direct Z-scheme Cs2O–Bi2O3–ZnO heterostructures for photocatalytic overall water splitting. J. Mater. Chem. A 2018, 6, 21379–21388. 10.1039/C8TA08033J. [DOI] [Google Scholar]
- Alkanad K.; Hezam A.; Sujay Shekar G. C.; Drmosh Q.; Kala A. A.; AL-Gunaid M. Q.; Lokanath N. Magnetic recyclable α-Fe2O3–Fe3O4/Co3O4–CoO nanocomposite with a dual Z-scheme charge transfer pathway for quick photo-Fenton degradation of organic pollutants. Catal. Sci. Technol. 2021, 11, 3084–3097. 10.1039/D0CY02280B. [DOI] [Google Scholar]
- Drmosh Q.; Hezam A.; Hendi A.; Qamar M.; Yamani Z.; Byrappa K. Ternary Bi2S3/MoS2/TiO2 with double Z-scheme configuration as high performance photocatalyst. Appl. Sur. Sci. 2020, 499, 143938. 10.1016/j.apsusc.2019.143938. [DOI] [Google Scholar]
- Xu Y.; Schoonen M. A. The absolute energy positions of conduction and valence bands of selected semiconducting minerals. Am. Mineral. 2000, 85, 543–556. 10.2138/am-2000-0416. [DOI] [Google Scholar]
- Murali A.; Sarswat P. K.; Free M. L. Minimizing electron-hole pair recombination through band-gap engineering in novel ZnO-CeO2-rGO ternary nanocomposite for photoelectrochemical and photocatalytic applications. Environ. Sci. Pollut. 2020, 27, 25042–25056. 10.1007/s11356-020-08990-z. [DOI] [PubMed] [Google Scholar]
- Sun Y.; Lei F.; Gao S.; Pan B.; Zhou J.; Xie Y. Atomically thin tin dioxide sheets for efficient catalytic oxidation of carbon monoxide. Angew. Chem. 2013, 125, 10763–10766. 10.1002/ange.201305530. [DOI] [PubMed] [Google Scholar]
- Dimitrijevic N. M.; Vijayan B. K.; Poluektov O. G.; Rajh T.; Gray K. A.; He H.; Zapol P. Role of water and carbonates in photocatalytic transformation of CO2 to CH4 on titania. J. Am. Chem. Soc. 2011, 133, 3964–3971. 10.1021/ja108791u. [DOI] [PubMed] [Google Scholar]
- Neaţu S. t.; Maciá-Agulló J. A.; Concepción P.; Garcia H. Gold–copper nanoalloys supported on TiO2 as photocatalysts for CO2 reduction by water. J. Am. Chem. Soc. 2014, 136, 15969–15976. 10.1021/ja506433k. [DOI] [PubMed] [Google Scholar]
- Liu L.; Li Y. Understanding the reaction mechanism of photocatalytic reduction of CO2 with H2O on TiO2-based photocatalysts: a review. Aerosol Air Qual Res. 2014, 14, 453–469. 10.4209/aaqr.2013.06.0186. [DOI] [Google Scholar]
- Yin W.-J.; Krack M.; Wen B.; Ma S.-Y.; Liu L.-M. CO2 capture and conversion on rutile TiO2 (110) in the water environment: insight by first-principles calculations. J. Phys. Chem. Lett. 2015, 6, 2538–2545. 10.1021/acs.jpclett.5b00798. [DOI] [PubMed] [Google Scholar]
- Guzmán-Cruz M. A.; Ramesh-Kumar C.; Acosta-Alejandro M.; Frías-Márquez D. M.; Domiguez D.; Zepeda T. A.; Fuentes-Moyado S.; Díaz de León J. N. Synthesis of aluminium doped Na-titanate nanorods and its application as potential CO2 hydrogenation catalysts. Catal. Lett. 2019, 149, 3361–9. 10.1007/s10562-019-02902-8. [DOI] [Google Scholar]
- Kočí K.; Obalová L.; Matějová L.; Plachá D.; Lacný Z.; Jirkovský J.; Šolcová O. Effect of TiO2 particle size on the photocatalytic reduction of CO2. Appl. Catal. B: Environ 2009, 89, 494–502. 10.1016/j.apcatb.2009.01.010. [DOI] [Google Scholar]
- Tan S. S.; Zou L.; Hu E. Kinetic modelling for photosynthesis of hydrogen and methane through catalytic reduction of carbon dioxide with water vapour. Catal. Today 2008, 131, 125–129. 10.1016/j.cattod.2007.10.011. [DOI] [Google Scholar]
- Lo C.-C.; Hung C.-H.; Yuan C.-S.; Wu J.-F. Photoreduction of carbon dioxide with H2 and H2O over TiO2 and ZrO2 in a circulated photocatalytic reactor. Sol. Energy Mater. Sol. Cells 2007, 91, 1765–1774. 10.1016/j.solmat.2007.06.003. [DOI] [Google Scholar]
- Tan S. S.; Zou L.; Hu E. Kinetic modelling for photosynthesis of hydrogen and methane through catalytic reduction of carbon dioxide with water vapour. Catal. Today 2008, 131, 125–129. 10.1016/j.cattod.2007.10.011. [DOI] [Google Scholar]
- Tan S. S.; Zou L.; Hu E. Photosynthesis of hydrogen and methane as key components for clean energy system. Sci. Technol. Adv.Mater. 2007, 8, 89. 10.1016/j.stam.2006.11.004. [DOI] [Google Scholar]
- Qamar S.; Lei F.; Liang L.; Gao S.; Liu K.; Sun Y.; Ni W.; Xie Y. Ultrathin TiO2 flakes optimizing solar light driven CO2 reduction. Nano Energy 2016, 26, 692–698. 10.1016/j.nanoen.2016.06.029. [DOI] [Google Scholar]
- Yu J.; Low J.; Xiao W.; Zhou P.; Jaroniec M. Enhanced photocatalytic CO2-reduction activity of anatase TiO2 by coexposed {001} and {101} facets. J. Am. Chem. Soc. 2014, 136, 8839–8842. 10.1021/ja5044787. [DOI] [PubMed] [Google Scholar]
- Xu H.; Ouyang S.; Li P.; Kako T.; Ye J. High-active anatase TiO2 nanosheets exposed with 95%{100} facets toward efficient H2 evolution and CO2 photoreduction. ACS Appl. Mater. Interfaces 2013, 5, 1348–1354. 10.1021/am302631b. [DOI] [PubMed] [Google Scholar]
- Fu J.; Cao S.; Yu J.; Low J.; Lei Y. Enhanced photocatalytic CO2-reduction activity of electrospun mesoporous TiO2 nanofibers by solvothermal treatment. Dalton Trans. 2014, 43, 9158–9165. 10.1039/c4dt00181h. [DOI] [PubMed] [Google Scholar]
- Jiao W.; Wang L.; Liu G.; Lu G. Q.; Cheng H.-M. Hollow anatase TiO2 single crystals and mesocrystals with dominant {101} facets for improved photocatalysis activity and tuned reaction preference. ACS Catal. 2012, 2, 1854–1859. 10.1021/cs300229e. [DOI] [Google Scholar]
- Zhao H.; Liu L.; Andino J. M.; Li Y. Bicrystalline TiO2 with controllable anatase–brookite phase content for enhanced CO2 photoreduction to fuels. J. Mater. Chem. A 2013, 1, 8209–8216. 10.1039/c3ta11226h. [DOI] [Google Scholar]
- Xu Q.; Yu J.; Zhang J.; Zhang J.; Liu G. Cubic anatase TiO 2 nanocrystals with enhanced photocatalytic CO 2 reduction activity. Chem. Commun. 2015, 51, 7950–7953. 10.1039/C5CC01087J. [DOI] [PubMed] [Google Scholar]
- He Z.; Wen L.; Wang D.; Xue Y.; Lu Q.; Wu C.; Chen J.; Song S. Photocatalytic reduction of CO2 in aqueous solution on surface-fluorinated anatase TiO2 nanosheets with exposed {001} facets. Energy Fuels 2014, 28, 3982–3993. 10.1021/ef500648k. [DOI] [Google Scholar]
- Truong Q. D.; Le T. H.; Liu J.-Y.; Chung C.-C.; Ling Y.-C. Synthesis of TiO2 nanoparticles using novel titanium oxalate complex towards visible light-driven photocatalytic reduction of CO2 to CH3OH. Appl. Catal. A: Gen. 2012, 437, 28–35. 10.1016/j.apcata.2012.06.009. [DOI] [Google Scholar]
- Wang C.; Ma X.-X.; Li J.; Xu L.; Zhang F.-x. Reduction of CO2 aqueous solution by using photosensitized-TiO2 nanotube catalysts modified by supramolecular metalloporphyrins-ruthenium (II) polypyridyl complexes. J. Mol. Catal. A Chem. 2012, 363, 108–114. 10.1016/j.molcata.2012.05.023. [DOI] [Google Scholar]
Associated Data
This section collects any data citations, data availability statements, or supplementary materials included in this article.