Abstract
Entomopathogenic nematodes are widely used as biopesticides1,2. Their insecticidal activity depends on symbiotic bacteria such as Photorhabdus luminescens, which produces toxin complex (Tc) toxins as major virulence factors3–6. No protein receptors are known for any Tc toxins, limiting our understanding of their specificity and pathogenesis. Here, we use genome-wide CRISPR-Cas9-mediated knockout screening in Drosophila melanogaster S2R+ cells and identify Visgun (Vsg) as a receptor for an archetypal P. luminescens Tc toxin (pTc), which recognizes the extracellular O-glycosylated mucin-like domain of Vsg containing high density repeats of proline, threonine, and serine (HD-PTS). Vsg orthologs in mosquitoes and beetles contain HD-PTS and can function as pTc receptors, whereas orthologs without HD-PTS such as moth and human versions are not pTc receptors. Vsg is expressed in immune cells including hemocytes and fat body cells. Hemocytes from Vsg knockout (KO) Drosophila are resistant to pTc and maintain phagocytosis in the presence of pTc, and their sensitivity to pTc is restored by transgenic expression of mosquito Vsg. Lastly, Vsg KO Drosophila showed reduced bacterial loads and lethality from P. luminescens infection. Our findings identify a proteinaceous Tc toxin receptor, reveal how Tc toxins contribute to P. luminescens pathogenesis, and establish a genome-wide CRISPR screening approach for investigating insecticidal toxins and pathogens.
Introduction
Tc toxin family members were initially identified in P. luminescens3. These bacteria live in the gut of entomopathogenic nematodes which search for and colonize a wide range of insect larvae in the soil6,7. Once the nematode enters the larval body cavity, P. luminescens is released by regurgitation to disarm the insect’s immune system, proliferate, and subsequently kill the larvae. After converting the interior of the insect cadaver into P. luminescens biomass, the bacterium itself then serves as the food source for the nematode in a mutualistic relationship6,7. Among an array of toxins and virulence factors released by P. luminescens, Tc toxins play a key role3,6. Growing numbers of Tc and Tc-like toxins have been identified in both entomopathogenic bacteria and human pathogens4,8–11.
Tc toxins are extremely large protein complexes formed by three subunits named TcA, TcB, and TcC (also known as A, B, and C subunits)4,6,12. TcA assembles into a homo-pentamer, with a total molecular weight of ~1.4 mega-Dalton (MDa)8,13–15, which is responsible for receptor-binding and membrane translocation of the cargo protein. TcB and TcC together form a ~ 250 kDa cocoon, with the cytotoxic C-terminal hypervariable region (HVR, ~30 kDa) of TcC autoproteolytically cleaved and encapsulated inside this cocoon14,16,17. The TcA pentamer and the cocoon assemble into a heterotrimeric holotoxin, with the HVR enzyme as the cargo protein pre-loaded into the TcA translocation channel17.
Tc toxins target and enter cells through receptor-mediated endocytosis. The low pH in endosomes induces conformational changes in TcA that lead to the insertion of the α-helical channel into the endosomal membrane like the needle of a syringe4,13,14,18,19. Subsequently, the HVR translocates through this channel into the cytosol of cells17,18, where it covalently modifies its cellular targets. For instance, TccC3 and TccC5, two TcCs found in P. luminescens, contain HVRs that encode ADP-ribosyl transferases, with TccC3 causing cytoskeletal clustering by ADP-ribosylation of actin and TccC5 targeting and modifying small Rho GTPases20.
Our understanding of the cell tropism and species selectivity of Tc toxins remains limited. Recent studies using glycan array screening revealed that negatively charged sulfated glycosaminoglycans (sGAG), such as heparan sulfates, as well as N-linked glycans act as a common receptor for various Tc toxins21. In addition, TcdA1 from the P. luminescens subsp. akhurstii strain recognizes various Lewis oligosaccharides, albeit with low affinity21,22, and the Tc toxin from Y. entomophaga can interact broadly with various glycans15. The contribution of N-linked glycans and sGAGs have been further confirmed using CRISPR-Cas9 mediated genetic screens in the human cell lines23.
Genome-wide CRISPR-Cas9-mediated knockout (KO) screening in mammalian cells is a powerful approach for identifying host factors targeted by pathogens and toxins24–26. However, it has been challenging to perform similar screens on insect cells because the delivery of genome-wide libraries encoding single guide RNAs (sgRNAs) relies on lentiviral transduction, a technique which is inefficient in insect cells. We recently overcame this obstacle by developing plasmid-mediated transfection of sgRNA libraries that achieve stable integration through site-specific recombination, thus enabling genome-wide CRISPR-Cas9-mediated knockout screening in D. melanogaster S2R+ (S2) cells27. Here, we utilized this approach and carried out genome-wide screens for an archetypal P. luminescens Tc toxin (designated pTc), which identified the mucin-like protein Visgun (Vsg) as its receptor.
Results
Genome-wide CRISPR screens in S2 cells
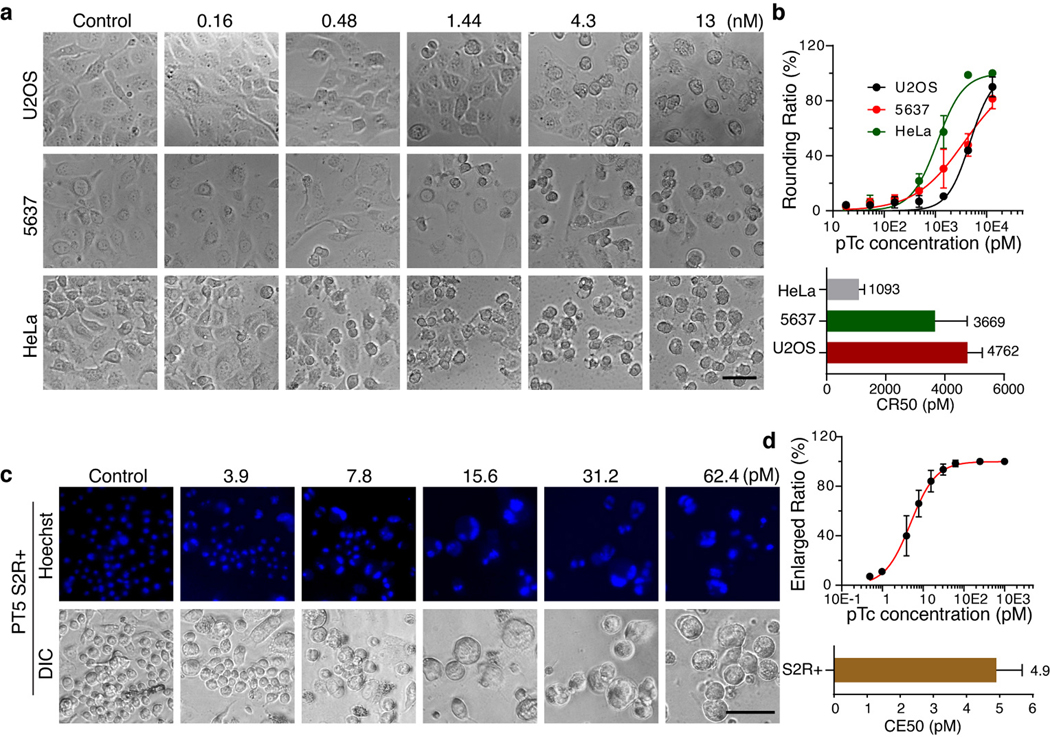
pTc (also known as PTC3) is assembled from one set of TcA (TcdA1), TcB (TcdB2), and TcC (TccC3) subunits from P. luminescens20. TccC3-HVR ADP-ribosylates actin, causing actin clustering and leading to cell-rounding and eventual cell death in mammalian cells (Extended Data Fig. 1a)20. The sensitivity to pTc of three human cell lines, HeLa (a cervical carcinoma cell line), U2OS (a bone osteosarcoma cell line), and 5637 (a bladder carcinoma cell line), was assessed and revealed that toxin concentrations that induced 50% of the cells to become round (defined as CR50) range from 1 to 5 nM (Extended Data Fig. 1a-b). In contrast to mammalian cells, actin clustering does not result in cell death in S2 cells but disrupts cell division, leading to enlarged multinucleated cells (Extended Data Fig. 1c). A toxin concentration of ~5 pM induced 50% of the cells to become enlarged (defined as CE50) (Extended Data Fig. 1d).
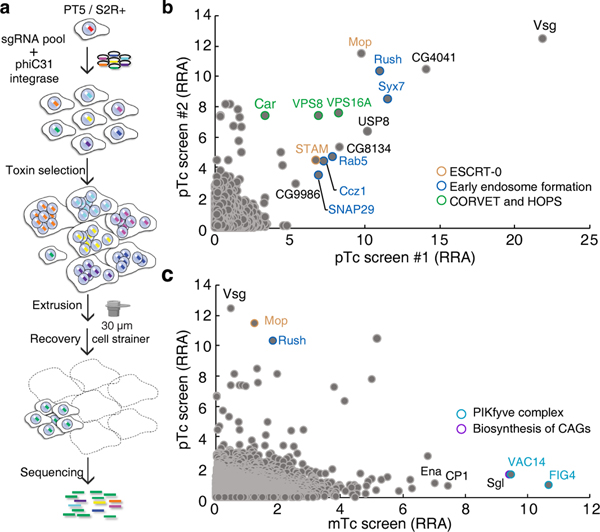
S2 cells stably expressing Cas9 endonuclease were transfected with a genome-wide library of sgRNA plasmids targeting 13,685 D. melanogaster genes (6–8 sgRNA per gene, 84,563 sgRNA in total). A plasmid encoding phiC31 integrase was co-transfected to induce site-specific recombination (Fig. 1a). Cells were then treated with pTc, and resistant cells were separated from enlarged cells using cell strainers (30 μm filtration size), which allow normal S2 cells but not enlarged ones to pass through. Following selection, resistant cells were harvested, and target genes identified by next generation sequencing (Fig. 1a).
Fig. 1. Genome-wide CRISPR–Cas9-mediated screen identifies host factors for pTc and mTc.
a, Schematic of the pooled screen using pTc or mTc toxins in the D. melanogaster PT5/S2R+ cell line.
b, Genes identified in two independent pTc screens (screen #1-high and screen #2 as described in Methods and Source Data) ranked based on the robust rank aggregation (RRA) score (analyzed with MAGeCK)41. The top-ranking genes were color-coded and grouped.
c, Comparison of the genes identified in the pTc and mTc screens.
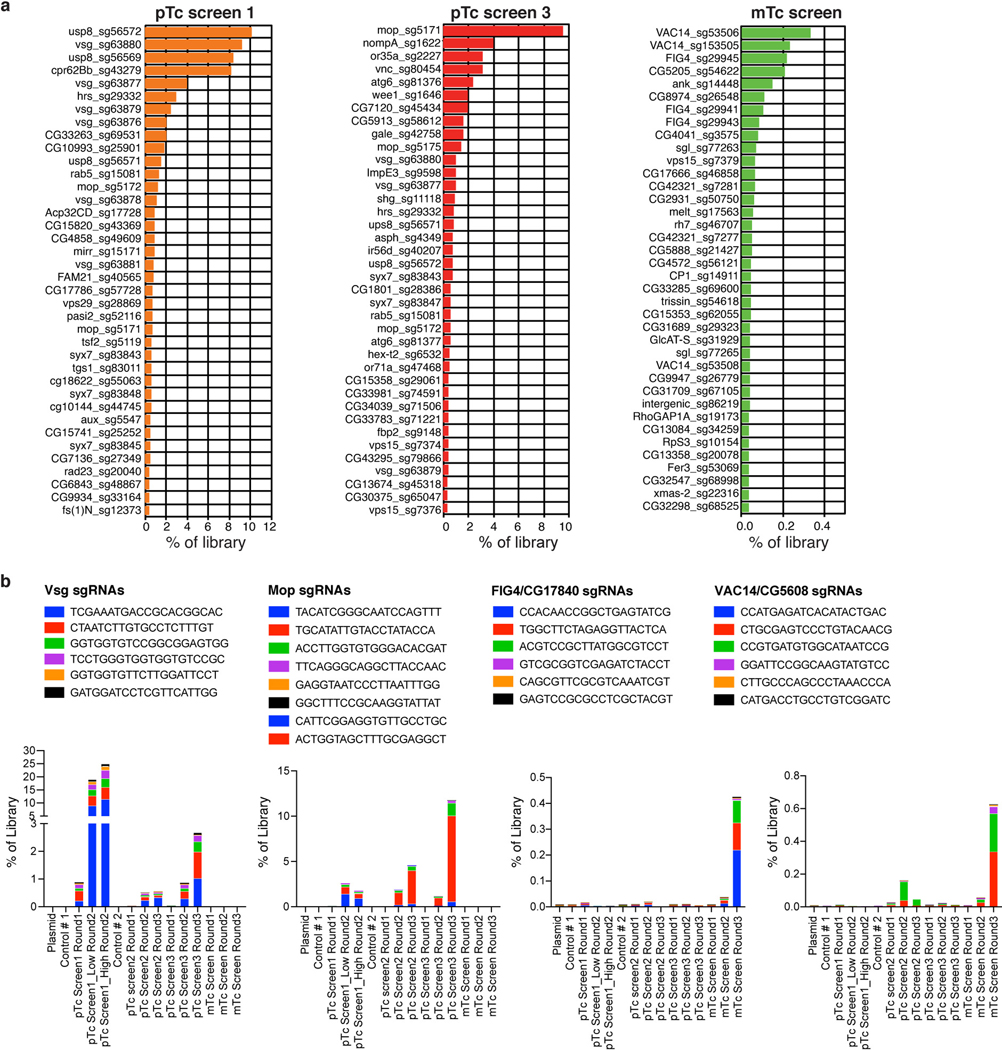
Multiple independent screens were carried out for pTc, which yielded overlapping top hits (Fig. 1b, Extended Data Fig. 2a-b, Source Data for Fig. 1b and Extended Data Fig. 2). The strongest hit is the gene encoding Vsg, a small single-pass membrane protein. Other top hits include genes encoding subunits of protein complexes that are involved in endosomal trafficking, such as ESCRT-0, HOPS, and CORVET (Fig. 1b). We then utilized the RNA interference (RNAi) approach and evaluated 29 genes within the top hits (Extended Data Fig. 3a). The sensitivity of S2 cells to pTc was estimated by the cell size or Hoechst signal using flow cytometry (Extended Data Fig. 3b-e). The majority of the top hits were validated as their knock-down reduced S2 cell sensitivity to pTc.
We also carried out a parallel screen with another Tc toxin (designated mTc), assembled with the same TcdB2-TccC3 as in pTc but with a distinct TcA (TcdA4 from the human pathogen Morganella morganii)8. The top hits from the mTc screen include sugarless (sgl, Fig. 1c, Extended Data Fig. 2a-b), which encodes a homolog of human UDP-glucose 6-dehydrogenase (UGDH) involved in sGAG biosynthesis28. Other top hits are genes coding for components of the PIKfyve complex, which is associated with endosomal trafficking. The top hits are clearly different between pTc and mTc (Fig. 1c), suggesting that different TcA subunits utilize distinct receptors.
Vsg mediates binding and entry of pTc
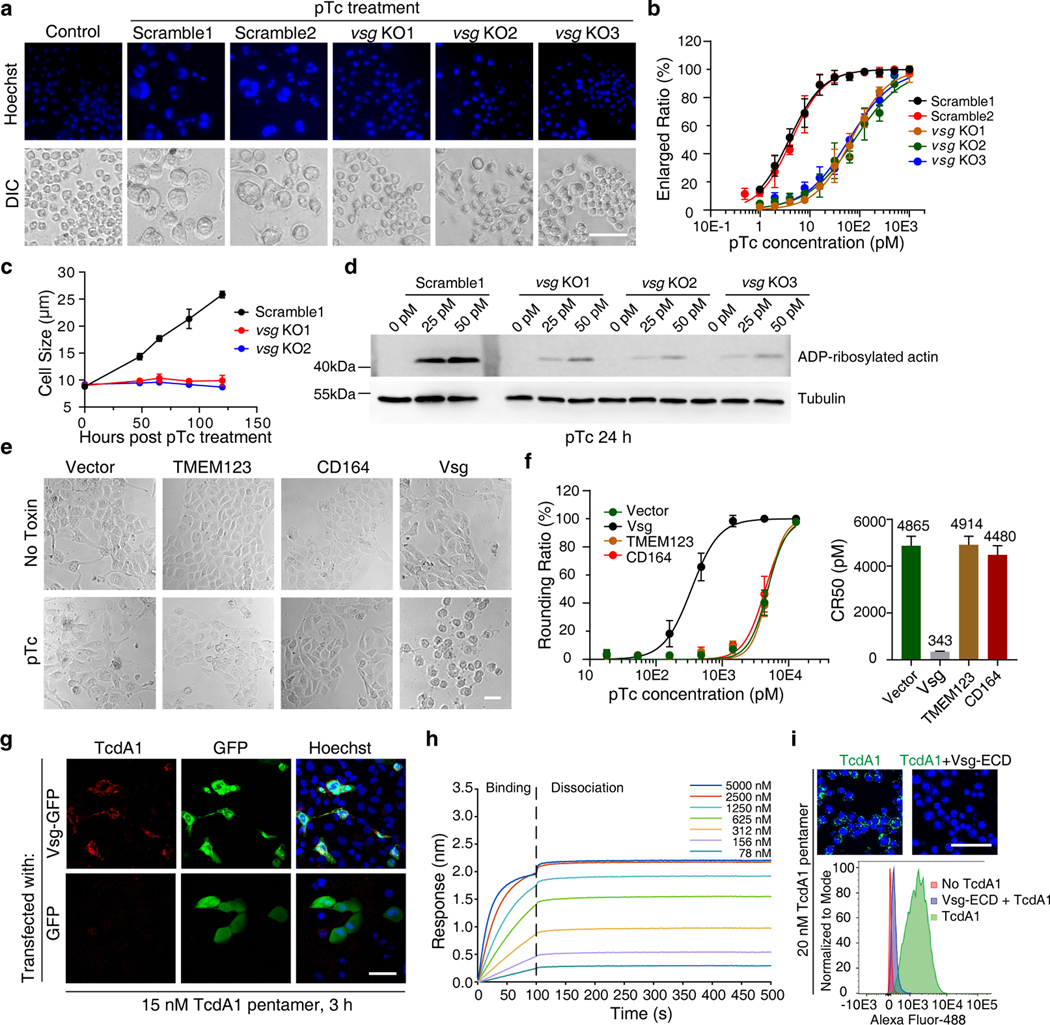
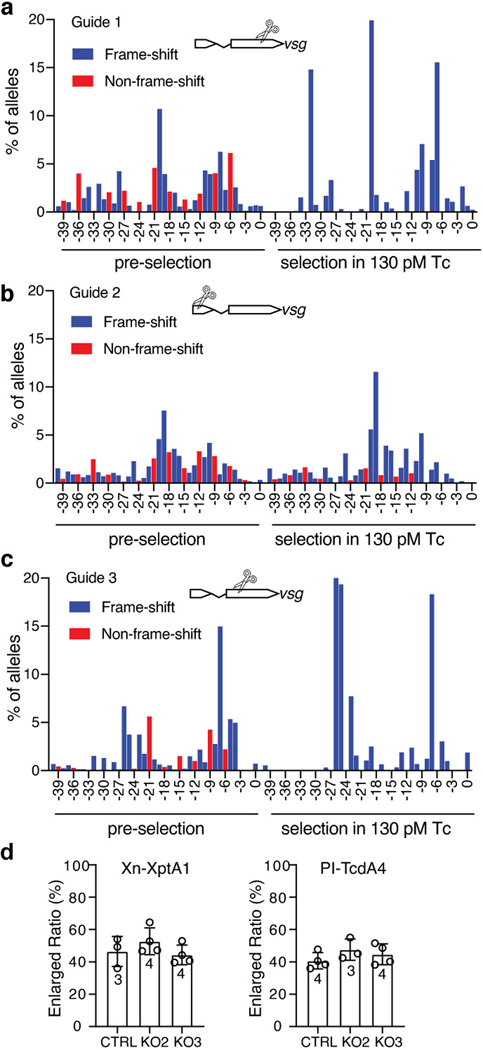
We next focused on the top hit, Vsg, as a candidate receptor. Three stable Vsg KO S2 cell lines were generated using the CRISPR-Cas9 approach (Extended Data Fig. 4a-c). They showed reduction in sensitivity (CE50) to pTc compared with S2 cells expressing scrambled sgRNAs (Fig. 2a-b), and they showed no change in cell size over 5 days after exposure to pTc (30 pM), whereas S2 cells expressing scrambled sgRNAs showed enlarging cell size over time (Fig. 2c). Consistently, S2 cells expressing scrambled sgRNAs showed robust actin ADP-ribosylation after exposure to pTc20,29, whereas Vsg KO cells showed much reduced actin ADP-ribosylation (Fig. 2d). We further tested two additional Tc toxins: both contain the same TcdB2-TccC3 as in pTc but utilize a distinct TcA subunits (XptA1 from Xenorhabdus nematophila and TcdA4 from P. luminescens). Both toxins induced cell enlargement on Vsg KO cells and showed no difference in potency on control cells versus Vsg KO cells (Extended Data Fig. 4d).
Fig. 2. Vsg is a receptor for pTc.
a-b, The sensitivity to pTc of vsg KO S2 cell lines or control S2 cell lines expressing scrambled sgRNAs were assessed by exposure to a titration of pTc for 4 days. Representative images with 15.6 pM pTc treatment were shown in (a), cell nuclei were marked with Hoechst dye (blue). The percentages of enlarged cells were quantified and plotted over pTc concentrations in (b).
c, Cell sizes were recorded and plotted over time after exposure to pTc (30 pM) for Vsg KO S2 cells versus the control S2 cells expressing a scrambled sgRNA.
d, Cells were incubated with pTc and ADP-ribosylation of actin was detected by immunoblot analysis of cell lysates. Tubulin served as a loading control. For gel source data, see Supplementary Figure 1.
e-f, Sensitivity of U2OS cell lines expressing TMEM123, CD164, or Vsg to pTc were assessed by exposure to a titration of pTc for 24 h. Representative images with 1.44 nM pTc treatment are shown in (e). The percentages of rounded cells were quantified and plotted (f). The toxin concentration resulting in 50% cell rounding is defined as CR50.
g, Ectopic expression of Vsg-GFP fusion proteins in U2OS cells via transient transfection mediated binding of TcdA1 to transfected cells (~96% TcdA1-bound cells are GFP positive, n=165). Biotinylated TcdA1 was labeled with Alexa Fluor 555-conjugated streptavidin. Cells transfected with GFP served as a control.
h, Characterization of TcdA1 binding to immobilized biotin-conjugated Vsg-ECD using BLI.
i, Preincubation of Alexa Fluor-488-conjugated TcdA1 (pentamer, 20 nM) with Vsg-ECD (1 μM) for 2 h in 4 °C reduced TcdA1 binding to S2 cells, detected by confocal microscopy (upper panel; cells were labeled with Hoechst in blue, TcdA1: green) or flow cytometry (lower panel).
Representative images and sensorgrams were from one of three independent experiments. Data were analyzed from the total number of images indicated in the Source data from three experiments and shown as mean ± SD, CR50 in panel (f) displayed as the best-fit value ± 95% confidence interval (CI)). Scale bars = 50 μm.
Vsg is composed of an N-terminal signal peptide, a mucin-like extracellular domain (residues 41–134), a transmembrane domain, and a short cytoplasmic domain. Its ortholog in humans, known as endolyn or CD164, is a mucin-like protein localized predominantly on endosomes and also traffic onto the cell membrane30,31. We next applied gain-of-function approaches by stably expressing D. melanogaster Vsg in U2OS cells via lentiviral transduction, which renders U2OS cells to become ~ 14-fold more sensitive to pTc (Fig. 2e-f). In contrast, over-expression of human CD164 or TMEM123, another potential ortholog of Vsg, did not change the sensitivity of U2OS cells (Fig. 2e-f). Consistently, transient transfection of a Vsg-GFP fusion protein in U2OS cells mediated the binding of fluorescently labeled TcdA1 (Fig. 2g). Over-expression of Vsg in S2 cells also increased binding of TcdA1 to cells (Extended Data Fig. 5a).
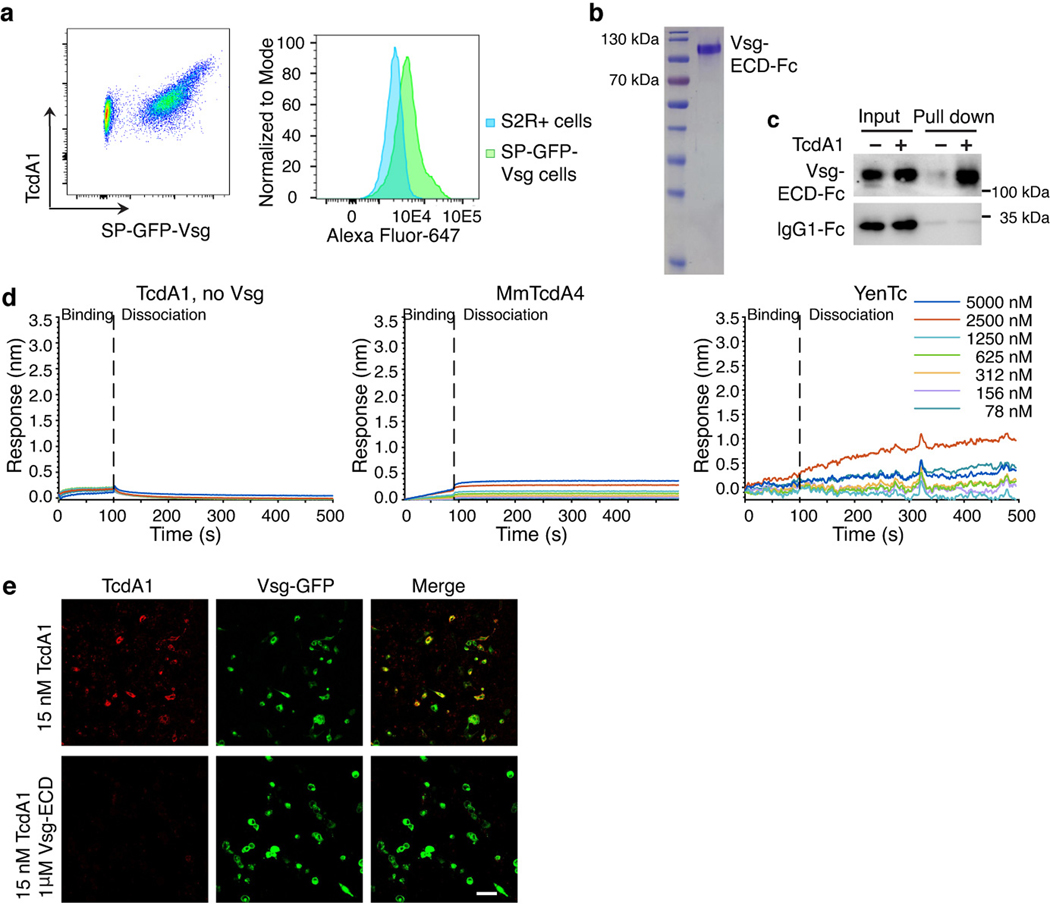
We next expressed and purified the Fc-tagged extracellular domain of Vsg (Vsg-ECD) using S2 cells (Extended Data Fig. 5b). Biotinylated TcdA1 pulled down Vsg-ECD-Fc, but not the control IgG1-Fc (Extended Data Fig. 5c). Biolayer interferometry (BLI) analysis with biotinylated Vsg-ECD-Fc immobilized on the probe further detected binding of TcdA1 (Fig. 2h). As controls, TcdA1 did not bind to empty probes, and TcdA4 from mTc and a Tc toxin from Yersinia entomophaga (YenTc)8 did not show binding to Vsg-ECD in BLI analysis (Extended Data Fig. 5d). Consistently, pre-incubation of TcdA1 with Vsg-ECD reduced its binding to both U2OS cells transfected with Vsg (Extended Data Fig. 5e) and to S2 cells (Fig. 2i).
pTc recognizes mosquito and beetle Vsg
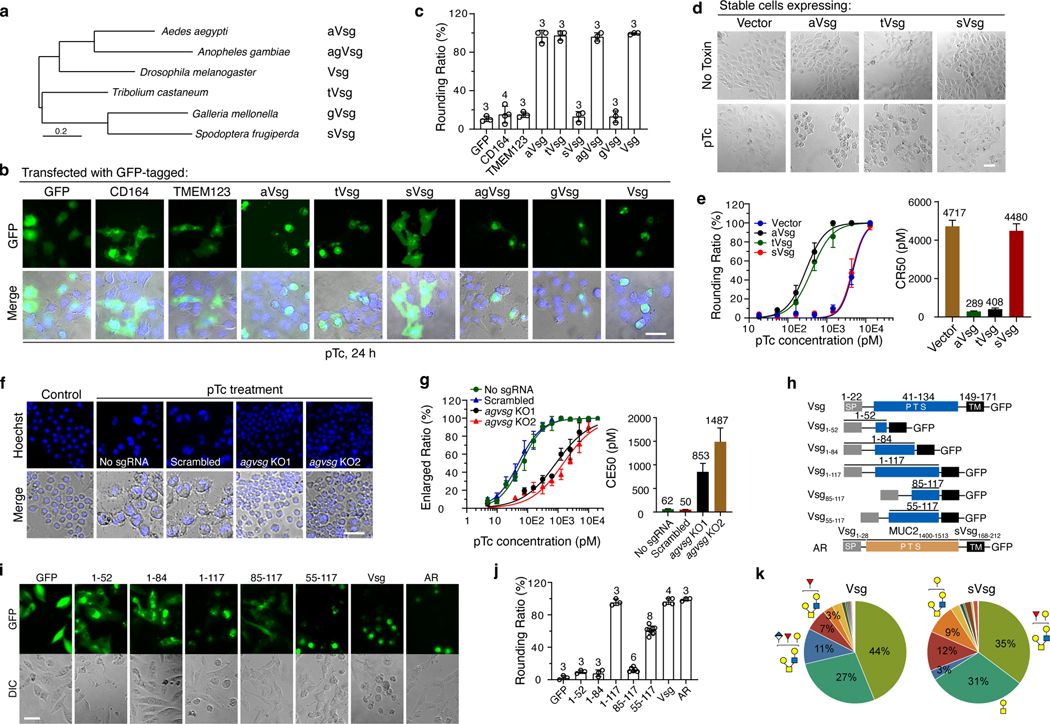
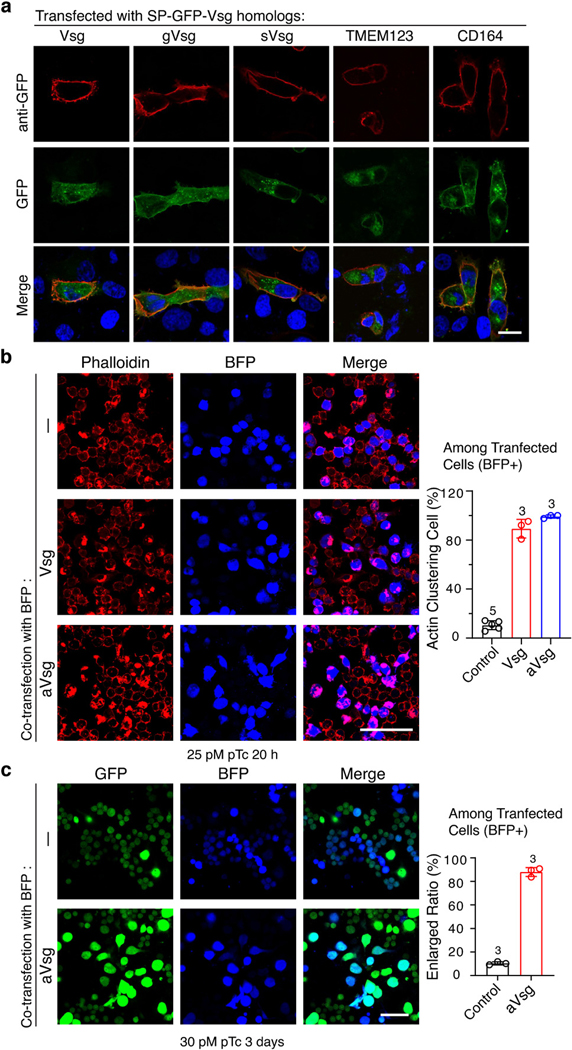
We next compared Vsg orthologs in several insect pest species, including two different mosquitoes (Aedes aegypti, aVsg, and Anopheles gambiae, agVsg), a beetle (Tribolium castaneum, tVsg), and two moth species (Galleria mellonella, gVsg, and Spodoptera frugiperda, sVsg) (Fig. 3a, Extended Data Fig. 6a). Their ability to mediate functional entry of pTc was first analyzed by transient expression with a GFP tag in U2OS cells (Fig. 3b). Mosquito and beetle orthologs (aVsg, agVsg, and tVsg) facilitated pTc entry into U2OS cells. Moth orthologs (gVsg and sVsg), as well as human CD164 and TMEM123, did not sensitize U2OS cells to pTc (Fig. 3b-c), despite that they are expressed on the surface of cells (Extended Data Fig. 7a). Consistently, U2OS cells that stably express aVsg or tVsg become more sensitive to pTc than control cells, whereas U2OS cells stably expressing sVsg showed a sensitivity similar to control cells (Fig. 3d-e). Transfection of aVsg in Vsg KO S2 cells also restored sensitivity to pTc, similar to transfection with Vsg (Extended Data Fig. 7b-c).
Fig. 3. Vsg orthologues from mosquitos and beetles can serve as pTc receptors.
a, The Maximum-likelihood tree of Vsg orthologs in the indicated insect species.
b-c, Vsg and the indicated Vsg orthologs, each fused with GFP, were expressed in U2OS cells via transient transfection. Cells were exposed to 2.5 nM pTc for 24 h (b). The percentage of rounded GFP-positive cells was quantified and plotted in (c).
d-e, U2OS cells stably expressing aVsg, tVsg, or sVsg through lentiviral transduction were exposed to pTc. Representative images with exposure to 1.44 nM pTc (d). Percentage of rounded cells was recorded and plotted in (e) together with CR50 values.
f-g, Two agVsg KO mosquito Sua5B cell lines and the control Sua5B cell line expressing a scrambled sgRNA were exposed to pTc. Representative images with exposure to 312.5 pM pTc (f). The percentage of enlarged cells was quantified and plotted in (g) together with CE50 values.
h, Schematic drawing of Vsg truncation mutants.
i-j, The indicated Vsg mutants fused with GFP were expressed in U2OS cells. Cells were exposed to pTc (2.5 nM) and representative images were collected (i). Quantification of the percentage of rounded cells among transfected cells was shown in (j).
k, O-glycan moieties in Vsg-ECD and sVsg-ECD identified by mass spectrometry analysis were shown as relatively profile intensity in a pie chart.
Representative images were from one of three independent experiments. Data were analyzed from the total number of images indicated in the Source data or bar graphs from three experiments and shown as mean ± SD or the best-fit value ± 95% CI. Scale bar = 50 μm.
To further confirm the role of Vsg orthologs in mosquitoes, we generated two independent agVsg KO cell lines using the Anopheles gambiae cell line Sua5B using the CRISPR-Cas9 approach (Fig. 3f). Exposure of Sua5B to pTc resulted in enlarged multinucleated cells. The two agVsg KO cell lines showed ~29-fold reduction in sensitivity to pTc compared with the control cells that express scrambled sgRNA (Fig. 3f-g).
pTc recognizes the HD-PTS region of Vsg
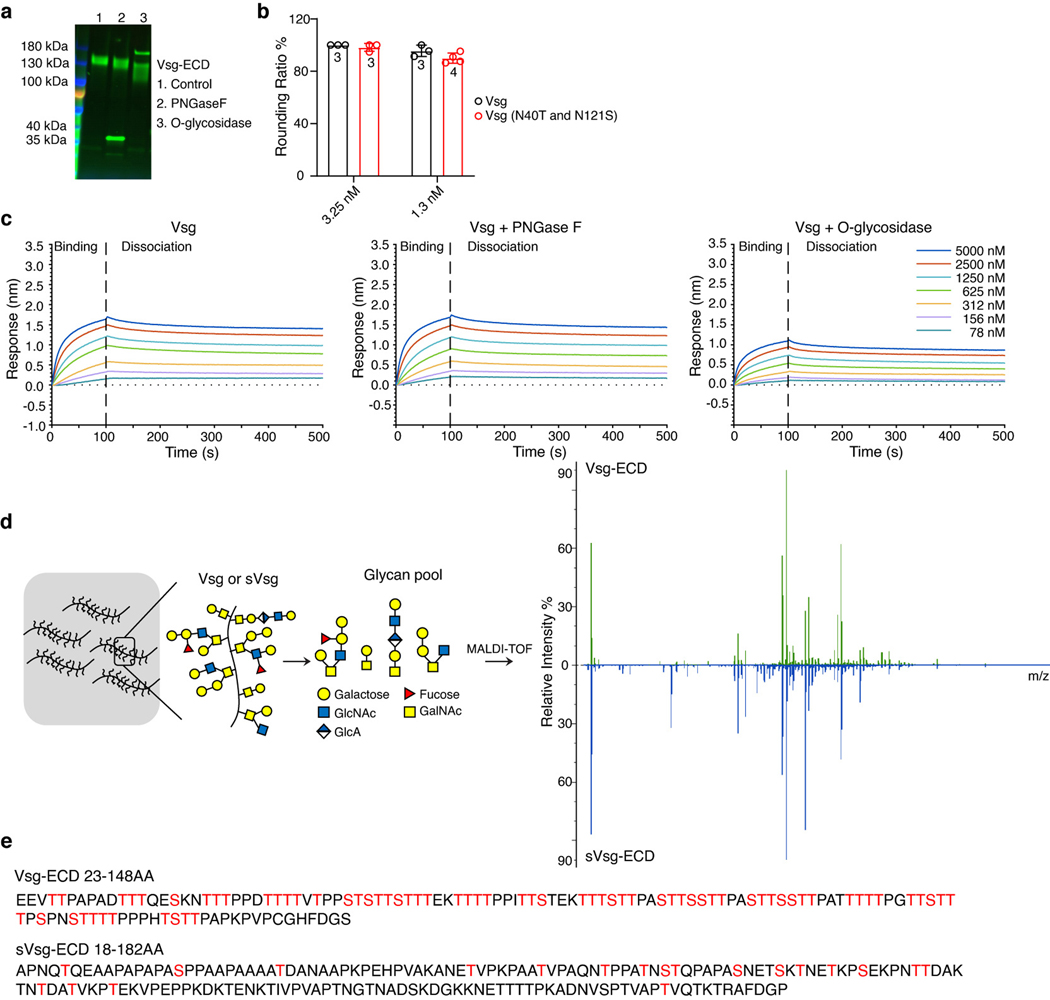
We next constructed a series of GFP tagged truncation mutants of Vsg and expressed them in U2OS cells (Fig. 3h). Residues 118–148 may not be important for pTc binding as a mutant containing 1–117 of Vsg-ECD can still function as a receptor (Fig. 3h-j). A Vsg truncation mutant containing residues 55–117 of its ECD can still partially mediate pTc entry into U2OS cells (Fig. 3h-i). The 55–117 region is within the mucin domain enriched with repeated proline, threonine, and serine (PTS, Extended Data Fig. 6a). As with other mucin-like proteins, O-glycosidase treatment reduced but did not eliminate O-glycans from Vsg-ECD, possibly because many sites are masked by dense O-glycans (Extended Data Fig. 8a). Vsg also contains two potential N-glycosylation sites but mutating these two sites did not affect its function as a pTc receptor (Extended Data Fig. 8b). Consistently, reducing N-glycosylation with PNGase F did not affect TcdA1 binding to Vsg-ECD, whereas O-glycosidase treatment reduced TcdA1 binding to Vsg-ECD (Extended Data Fig. 8c). We further profiled and compared glycan moieties in Vsg-ECD versus sVsg-ECD using mass spectrometry analysis (Extended Data Fig. 8d). Typical insect O-glycan moieties were readily identified and there were no major differences in O-glycan moieties between Vsg-ECD that binds to pTc and sVsg-ECD that does not mediate pTc binding (Fig. 3k, Supplementary Data 1). Thus, although O-glycans are involved in interactions, Vsg does not contain specialized glycan moieties that cause it to function as a receptor.
A comparison of the PTS region (residues 41–134) among Vsg orthologs suggests that only Vsg proteins with an extremely high density of threonine and serine residues, designated HD-PTS, can function as pTc receptors (Extended Data Fig. 6b). The mucin regions in CD164, gVsg, and sVsg only contain 23% to 35% of threonine and serine residues (Extended Data Fig. 6b). Consistently, Vsg is predicted to contain 70 O-glycosylation sites, whereas sVsg contains only 20 such sites (Extended Data Fig. 8e).
The HD-PTS region is expected to form a rigid string saturated with densely packed O-glycans, suggesting that pTc recognition may require highly occupied O-glycosylation sites spatially configured by the HD-PTS sequences. To test this hypothesis, we designed an artificial receptor (AR) composed of a HD-PTS segment derived from a mucin protein, human Mucin2 (GenBank: AAB95295.1, residues 1400–1513, with 56% T/S residues) fused with the transmembrane and cytoplasmic domain of sVsg (Fig. 3h, Extended Data Fig. 6a). The AR mediated entry of pTc when expressed in U2OS cells (Fig. 3h-j).
pTc targets hemocytes via Vsg
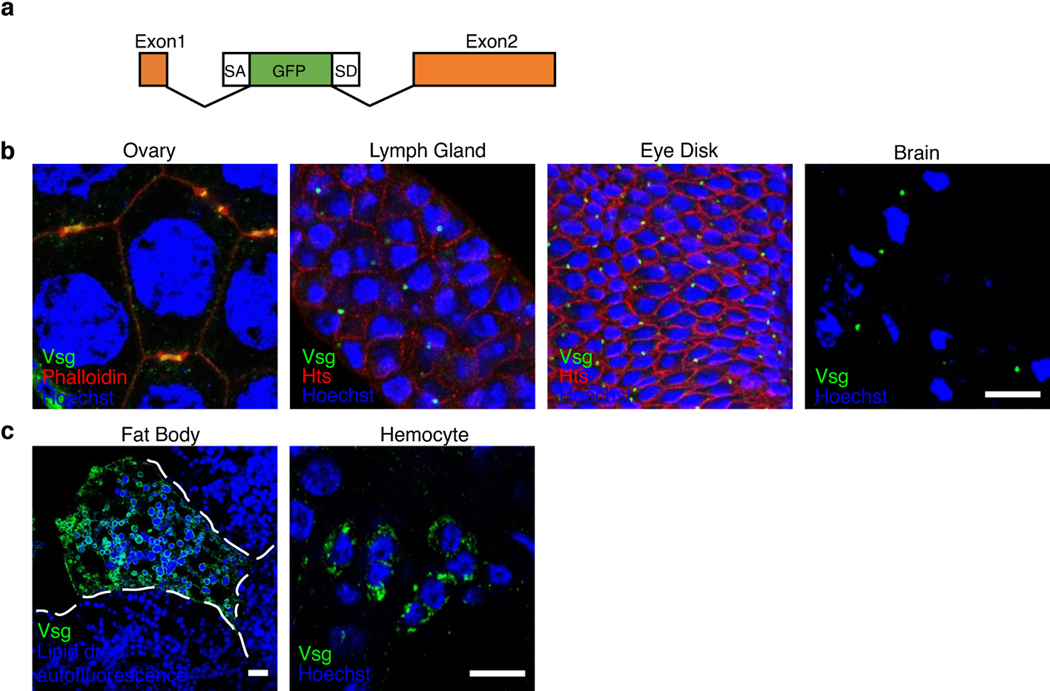
We next examined Vsg expression in Drosophila larvae, taking advantage of a transgenic fly line that expresses GFP-Vsg (Extended Data Fig. 9a). Previous studies using this line reported that Vsg is expressed and clustered around cell surface ring canal structures in germline, follicle and imaginal disc cells32,33. We found GFP-Vsg as bright puncta on cell membranes between adjacent cells, likely around ring canals, in ovarian tissues, eye discs, brain, and lymph glands (Extended Data Fig. 9b). Besides ring canals, GFP-Vsg can be found in hemocytes and fat body cells (Extended Data Fig. 9c), two major cell types responsible for innate immunity: hemocytes, which clear invading bacteria and parasites through phagocytosis and nodule formation, and fat body cells, which produce anti-microbial peptides34,35.
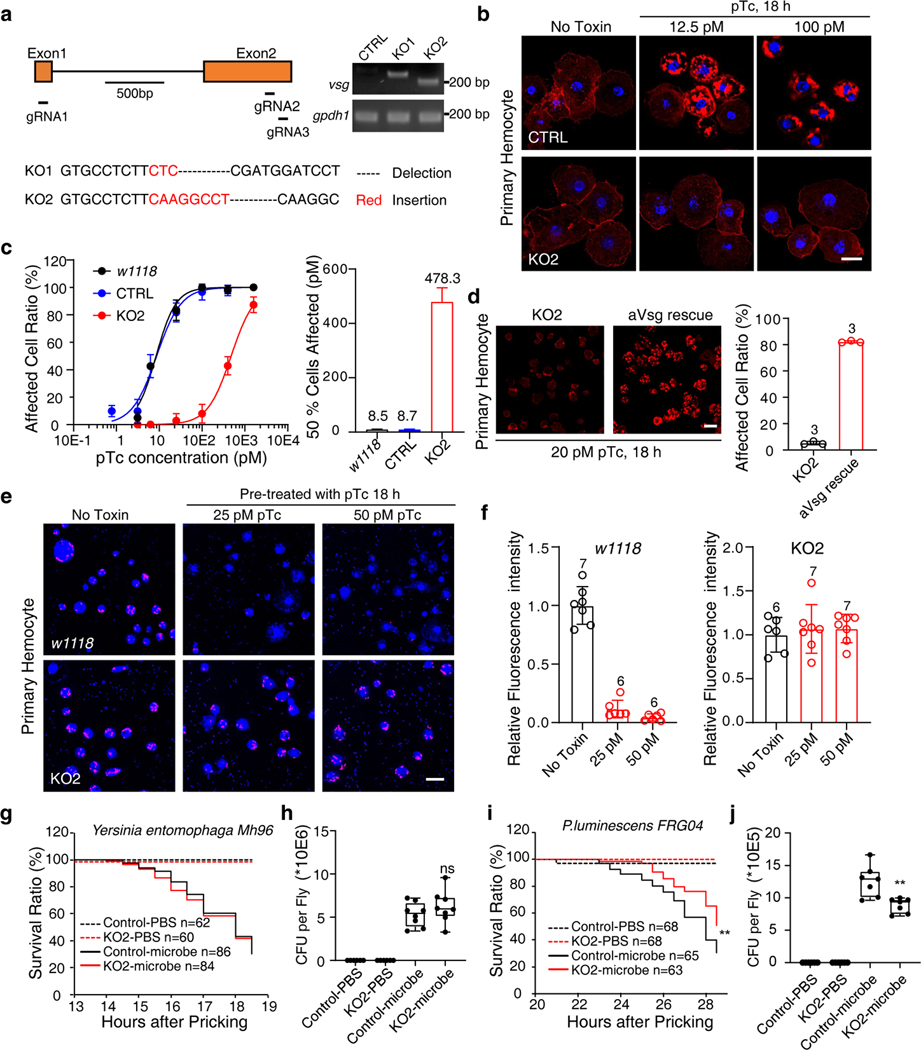
We then generated two Vsg KO D. melanogaster lines using the CRISPR-Cas9 approach (Fig. 4a), and isolated primary hemocytes from control and KO lines. These hemocytes were exposed to pTc, and toxin-induced actin clustering was detected using phalloidin staining (Fig. 4b). Vsg KO hemocytes showed ~55-fold reduction in sensitivity to pTc compared with control hemocytes (Fig. 4b-c, Extended Data Fig. 10a-b). We further generated a rescue fly line that expresses aVsg in hemocytes based on our Vsg KO fly line. Expression of aVsg in Vsg KO hemocytes restored their sensitivity to pTc (Fig. 4d, Extended Data Fig. 10c-d).
Fig. 4. Vsg KO flies show reduced sensitivity to pTc and P. luminescens infection.
a, Schematic illustration of vsg knock out strategy and the genotyping results of two different vsg KO strains. Representative images were from one of three independent experiments.
b-c, Hemocytes from control (CTRL, nos-Cas9;attP2), vsg KO, or a wild-type strain (w1118) of D. melanogaster were exposed to the indicated concentrations of pTc for 18 h. Cells were fixed and stained with phalloidin (red) and Hoechst dye (blue). Representative images were shown in (b), and percentages of cells with actin clustering were quantified and plotted in (c). Scale bar = 10 μm.
d, Hemocytes from a vsg KO fly line (Hml-Gal4,UAS-EGFP; KO2) and a rescue line that expresses aVsg in hemocytes (Hml-Gal4,UAS-EGFP/UAS-avsg;KO2) were exposed to 20 pM pTc for 18 h. Cells were fixed and stained with phalloidin (red). Scale bar = 20 μm.
e-f, Hemocytes from control (w1118) or vsg KO2 D. melanogaster were treated with pTc (25 pM or 50 pM, 18 h) and then co-incubated with pHrodo™ Red labeled E. coli bioparticles (red) for 30 min. Cells were then washed, stained with Hoechst (blue), and imaged (e). Internalized E. coli fluorescence intensity per cell was counted and plotted (f). Scale bar = 20 μm.
g-h, Control (nos-Cas9;attP2) and vsg KO D. melanogaster were infected with the control bacterium, Yersinia entomophaga, through pricking with an insect pin. Survival curves shown in (g). Flies were collected and homogenized, and bacterial loads (colony formation units) were assessed by serial dilution plating (h).
i-j, Control (nos-Cas9;attP2) and vsg KO D. melanogaster were infected with P. luminescens through pin prick. Survival curves (i) and bacterial loads (j) were shown.
Data in (c), (d) and (f) were analyzed from the total number of images indicated in the Source data or bar graphs from three experiments and shown as mean ± SD or the best-fit value ± 95% CI. Data in (h) and (j) were analyzed from the total number of flies indicated in the Methods section. Center values represent the median. The box plots in (h) and (j) show all points. The bounds are minimum to maximum values, 25th and 75th percentiles, respectively.
Two-tailed test was used for comparing between Control-microbe and vsg KO-microbe group in (h) and (j). Log-rank (Mantel-Cox) test was used for comparing between Control-microbe group and vsg KO-microbe group in (i). p = 0.29 (h), p = 0.008 (i) and p = 0.003 (j). **p < 0.01
To further assess the impact of pTc on phagocytosis of hemocytes, we utilized pHrodo™ Red-labeled E. coli bioparticles, which show elevated fluorescent signals under low pH in endosomes. Incubation with pTc blocked phagocytosis of E. coli bioparticles in control hemocytes. In contrast, phagocytosis in Vsg KO hemocytes was not affected by pTc, with internalized E. coli bioparticles similar to that in cells not exposed to pTc both in fluorescence intensity and in the number of particles (Fig. 4e-f, Extended Data Fig. 10e-f).
P. luminescens infection in Vsg KO flies
Finally, we assessed the role of Vsg during P. luminescens infection in vivo using adult D. melanogaster, which has been widely utilized as a model for bacterial infection36. The flies were pricked with an insect pin that had been dipped in a bacterial suspension. Pricking with the control bacterium, the insect pathogen Yersinia entomophaga, showed no difference between Vsg KO and control flies (Fig. 4g-h). In contrast, Vsg KO flies showed reduced lethality compared with control flies when pricked with P. luminescens subsp. akhurstii (Fig. 4i). Quantification of P. luminescens colony forming units in homogenized flies showed that bacterial loads in Vsg KO flies were reduced by 30% compared to control flies (Fig. 4j). P. luminescens subsp. akhurstii possesses many other insecticidal toxins and virulence factors6, which may contribute to the remaining lethality in Vsg KO flies.
Discussion
Here, we identified Vsg as a receptor for a prototypical Tc toxin and revealed how Tc toxin contributes to P. luminescens pathogenesis. Our findings suggest that pTc recognition requires densely packed sites of O-glycosylation along an HD-PTS region in Vsg. However, the precise molecular mechanism for pTc-Vsg interactions remains to be established, which would require future studies resolving a high-resolution structure of the pTc-Vsg complex.
Our findings also reveal a previously underappreciated insect species specificity of pTc. This finding may explain why previous studies of pTc using cells from moth models often required use of nanomolar pTc concentrations, similar to the potency on mammalian cells: pTc binding to those cell types is likely mediated by lower affinity interactions with sGAGs, N-glycans and other carbohydrate moieties rather than by a particular receptor protein21–23. Thus, instead of being a nondiscriminatory weapon, pTc is a precision instrument used to subdue a specific subset of insects. This insight may explain diversification of Tc toxins within P. luminescens, which may target different receptors and act on distinct cell types and/or insect species4. The selectivity of Tc toxins also offers the opportunity to engineer tailor-made biopesticides targeting only certain harmful insect species.
The diversification of TcA subunits suggests that their key role in P. luminescens infection cannot be satisfied with more commonly presented cell surface glycan moieties. This possibly reflects the selective pressure to maximize their potency toward the insect immune system at the early stage of infection, and that high potency can only be achieved by evolving the capability to bind highly specific receptors. Vsg is expressed in hemocytes and fat body cells, both representing key components of the insect innate immune system. Interestingly, CD164 has been recently identified as an essential entry factor for lymphocytic choriomeningitis virus37,38. It will be interesting to investigate whether Vsg may serve as a receptor for additional insect toxins and pathogens.
Suppression of the immune system allows rapid replication of P. luminescens, reported to reach 109 per larvae within 48 hours39,40. With the increased toxin concentrations in the later stage of infection, various Tc toxins and other toxins/virulence factors in P. luminescens may then work synergistically and attack a broad range of cells via their interactions with common cell surface glycans, which could be another factor for the remaining lethality of P. luminescens in Vsg KO flies. Diversification also occurs for the cytotoxic TcC HVR moieties, which may target a variety of cellular functions beyond phagocytosis.
Genome-wide CRISPR-Cas9 mediated pooled screens in mammalian cells have been widely used, but this approach has remained challenging in insect cells due to the inefficient transduction of such systems by typically used lentiviruses. With the present study, we set a successful example in carrying out genome-wide CRISPR-Cas9 screens in insect cells for characterizing insect-targeting toxins and pathogens relevant to agriculture and vector-borne infectious diseases.
Methods
Cell lines and fly strains
Drosophila melanogaster S2R+ cells and Anopheles gambiae Sua5B cells were provided by the Drosophila RNAi Screening Center (Harvard Medical School). A subline of S2R+ cells and Sua5B cells expressing SpCas9 and containing an attP integration site, S2R+/NPT005/MT-Cas9 (PT5/Cas9) and Sua5B-IE8-Cas9, were described previously and are available at the Drosophila Genomics Resource Center27,42. All cells were grown in Schneider’s Media (21720–024, Thermo Fisher Scientific) containing 10% fetal bovine serum (16140–071, Thermo Fisher Scientific) and 1X Pen/Strep (15070063, Thermo Fisher Scientific). To maintain Cas9 transgene, PT5/Cas9 cells were grown in 200 ng/mL hygromycin (40051, Calbiochem) and Sua5B/Cas9 cells were grown in 500 μg/mL Geneticin (11811031, Thermo Fisher Scientific). HeLa, 5637, and U2OS cells were obtained from ATCC. nos-Cas9;attP2 flies are a gift of J. Ni at Tsinghua University, Beijing, China. The w1118 strain is from the Perrimon lab. The UAS-avsg strain was constructed by inserting Aedes aegypti Vsg coding sequence (XM_021852319.1) into EcoRI-XbaI-digested pWalium10-moe (1470, DGRC). Transgenic flies were generated using PhiC31 integration by injecting the pWalium10-moe-avsg plasmid into flies carrying an attP docking site on chromosome II (attP40). The w1118; P{Hml-GAL4.Δ}2, P{UAS-2xEGFP}AH2 (30140) and y1 w*; P{PTT-GA}vsgCA07004 (50812) strains were obtained from the Bloomington Drosophila Stock Center.
Antibodies
Goat anti-human IgG Fc secondary antibody (A18817, Invitrogen), mouse anti-Hts antibody (1B1, DSHB), rabbit anti-GFP antibody (A11122, Invitrogen), anti-pan-ADP-ribose binding reagent (MABE1016, Millipore), donkey anti-rabbit lgG (H+L) Alexa Fluor-488 (R37118, Invitrogen), donkey anti-mouse lgG (H+L) Alexa Fluor-568 (A10042, Invitrogen), Alexa Fluor 555-conjugated phalloidin (8953S, Cell Signaling), Alexa Fluor-488-conjugated phalloidin (A12379, Thermo Fisher Scientific), Alexa Fluor 647-conjugated phalloidin (A22287, Invitrogen), anti-alpha-tubulin (T5168, Sigma-Aldrich), HRP-conjugated goat anti-Rabbit IgG (H+L) secondary antibody (31460, Thermo Fisher), and HRP-conjugated goat anti-Mouse IgG (H+L) secondary antibody (31430, Thermo Fisher) were purchased from the indicated vendors.
Tc toxin production
P. luminescens TcdA1 and M. morganii TcdA4 were produced as described previously8. Expression was carried out in E. coli BL21 CodonPlus(DE3) RIPL cells (Agilent) using a pET-19b vector (Novagen) with the toxin genes cloned in frame with an N-terminal 6xHis-tag and a PreScission protease cleavage site. After transformation and growth to OD600=0.6 in 10 L of LB medium, protein production was induced with 25 μM IPTG. Protein expression was carried out at 20 °C for 20 h, and cells were lysed in 50 mM Tris-HCl pH 8.0, 300 mM NaCl, 0.05% Tween-20 supplemented with benzonase endonuclease and AEBSF using a pre-chilled microfluidizer. Cell debris was spun down at 167000 g using a Type 45 Ti rotor (Beckman Coulter Life Sciences) for 30 minutes at 4 °C. 25 mM imidazole pH 8.0 was supplemented to the supernatant, which was subsequently loaded onto an equilibrated 5 mL HisTrap HP column (Cytiva). After washing until the baseline was stable, the bound protein was eluted via a linear gradient of 25 – 500 mM imidazole. The elution fractions of the Tc toxins were pooled, concentrated and further purified by a Sephacryl S400 size exclusion column (Cytiva) equilibrated in 20 mM HEPES pH 8.0, 100 mM NaCl, 0.05% Tween-20. The purified protein was pooled, concentrated and stored at −80 °C once supplemented with 40% glycerol. Production and purification of YenTc from Yersinia entomophaga was performed as described previously43. P. luminescens TcdB2-TccC3 was produced in E. coli BL21 CodonPlus(DE3) RIPL as described previously17 using pET-28a with the tcdB2 and tccC3 genes cloned as a fusion protein in frame with an N-terminal 6xHis-tag and a thrombin cleavage site.
Biotinylation and de-glycosylation of Vsg-ECD
To prepare biotinylated Vsg-ECD-Fc, it was first desalted into 20 mM HEPES pH 8.0, 100 mM NaCl, 0.05% Tween-20. A 6-fold molar excess of EZ-Link NHS-PEG12-biotin (Thermo Fisher Scientific) was added and the mixture was incubated at 4 °C for 14 h. Excess biotin was removed by desalting the biotinylated protein into 20 mM HEPES pH 8.0, 100 mM NaCl, 0.05% Tween-20 (when no deglycosylation was performed) or 20 mM MES pH=6.5, 150 mM NaCl (when deglycosylation was performed). When needed, Vsg-ECD-Fc was deglycosylated for 14 h at 4 °C by addition of 500 U PNGase F (New England Biolabs), 40000 U O-glycosidase (New England Biolabs) per 30 μL of 7.5 μM biotinylated Vsg. This was followed by desalting into 20 mM HEPES pH 8.0, 100 mM NaCl, 0.05% Tween-20 and dilution to 3.1 μg/mL.
Biolayer interferometry (BLI) assay
Biotinylated Vsg-ECD-Fc protein was immobilized on the surface of streptavidin sensors. In reference experiments, TcdA1, TcdA4, or YenTc were used as ligands against an independent set of streptavidin sensors not exposed to biotinylated Vsg-ECD-Fc. To obtain referenced data that corrects for TcdA1 binding to streptavidin sensors, the values of reference wells were first subtracted from the original data. The values from the Vsg-free reference sensors were then subtracted from those of the Vsg-bound sensors. BSA from a 100x stock was added to both Vsg and the Tc toxins before use, to a final concentration of 0.3 mg/mL. The buffer used for the relevant BLI washing steps and for preparing Tc toxin dilutions was 20 mM HEPES pH 8.0, 100 mM NaCl, 0.05% Tween-20, 0.3 mg/mL BSA. A dilution series of the toxins (5000 – 78 nM, plus a toxin-free condition for use as a reference) were prepared directly before measurement. BLI sensorgrams were acquired at 25 °C with an initial 30 s sensor check step, followed by 300 s loading time, a 300 s baseline step, 100 s association and 400 s dissociation time.
Genome-wide CRISPR–Cas9 screening with pTc or mTc
The Drosophila CRISPR genome-wide knockout library was previously described and is available from Addgene (134582–4)27. In brief, 1×10⁸ PT5/S2R+ cells were transfected with an equal-parts mixture of pLib6.4 containing a genome-wide library (84,563 sgRNAs targeting 13,685 Drosophila genes) as well as pBS130 (26290, Addgene) using Effetene (301427, Qiagen) following the manufacturer’s instructions. After 4 days, the transfected cell library was selected with 5 μg/mL puromycin (540411, Calbiochem) for 12 additional days, subculturing every 4 days. After the stable sgRNA-expressing cell library was established, 2×10⁷ cells were plated onto four 15-cm cell culture dishes to ensure sufficient sgRNA coverage, with each sgRNA being represented around 1000 times. These cells were exposed to pTc for one week. Cells were then filtered by 30 μm cell strainers, only collecting the cells passing through the strainer. The collected cells were further cultured in toxin-free medium to ultra-confluence and then subjected to subsequent rounds of screening with higher concentrations of toxins. Three independent screens were performed for pTc with the following conditions (pM): screen#1: 6, 12 (sequenced as Round1), followed with either 100 (screen#1-Low, Round2) or 125 (screen#1-High, Round2); screen#2: 12.5, 12.5 (Round1), 20 (Round2), 40 (Round3); screen3: 10, 10 (Round1), 25 (Round2), 50 (Round3), and for mTc (550, 1100, 3600 pM). Aliquots of cell libraries following each selection round were collected and their genomic DNA was extracted using the Zymo Quick-gDNA Miniprep kit (D3025, Zymo Research). DNA fragments containing the sgRNA sequences were amplified by PCR using at least 1000 genomes per sgRNA as template for each sample. PCR fragments were in-line barcoded using a previously described approach. Next Generation Sequencing (Illumina NextSeq) was performed at Biopolymers Facility at Harvard Medical School. Fastq sequence files were demultiplexed using in-line barcodes as sequence tags, generating a distinct file for each treatment sample. All further processing used MAGeCK (version 0.5.4 or 0.5.9.4) to generate readcount files and perform Robust rank aggregation (RRA) analysis directly on the generated readcount files using default parameters.
Secondary screening by RNAi
All pre-synthesized dsRNAs templates for the top genes from genome-wide pTc CRISPR screen # 1 were obtained from the Drosophila RNAi Screening Center and in vitro transcribed to produce dsRNAs using the T7 Megascript kit (Thermo Fisher Scientific). Template sequences can be obtained by searching sequence identifiers at https://www.flyrnai.org/up-torr/. S2R+ cells were washed into serum-free media and 10,000 cells were transferred to each well of 384-well dishes containing 25 ng dsRNA for 35 min followed by outgrowth in serum-containing media for 3 days. Then, cells were subjected to 100 pM pTc for 2 days and expanded to 96-well dishes and grown further for 7 days. Live cells were stained with 10 mM Hoechst 33342 (B2261, Sigma) for 15 min before being subjected to flow cytometry using an LSRII with a 96-well autoloader. Data analysis was carried out using the FlowJo version 10.8.1 software. FACSDiva version 9.0 software was used for data collection in all flow cytometry experiments. The percentage of all events passing through a gate corresponding to the BV-421 intensity of most (>86%) of untreated cells was measured. Note that for the Hoechst analysis, because pTc alters cell size, we did not carry out prior gating using forward/side scatter profile. For a separate analysis of cell size, the percentage of all events passing through a gate corresponding to an enlarged forward scatter/side scatter profile (larger than >89% of untreated cells) was measured.
Plasmid construction
avsg (Protein ID: XP_021708011.1), rvsg (XP_972460.1), svsg (KAF9794377.1), vsg (NP_729535.1), agvsg (XP_001688320.1), gvsg (XP_026748881.1), TMEM123 (NP_443164.2), and CD164 (NP_006007.2) were synthesized by Twist Bio. Their entire coding sequences, excluding the final 15 bp, were cloned into pEGFP-N1 vector between the sites NheI and BamHI to build the Vsg-GFP fusion constructs for mammalian cells transient expression. For all the pCMV-SP-GFP-Vsgs, GFP was inserted immediately following the signal peptide of Vsgs and amplified SP-GFP-Vsgs were inserted into the pEGFP-N1 vector between the sites NheI and XbaI. The entire coding sequences of avsg, rvsg, svsg, vsg, TMEM123 and CD164 were subcloned into the sites BamHI and XbaI in vector pLenti CMV/TO Hygro empty (w214–1) (17484, Addgene) for establishing stable cell lines. For S2 cell-based rescue experiments, entire coding sequences of avsg and vsg were subcloned into the sites EcoRI and XhoI in vector Ac5-stable2-Neo (32426, Addgene). To build Vsg-ECD-Fc expression construct, two fragments vsg (67–444bp) or sVsg-ECD (52–546bp) and human Fc-his were amplified from vsgs and pHL-FcHis vector (99846, Addgene) respectively and cloned into the vector pMT-Bip-GFP:V5:KDEL (69917, Addgene) between the KpnI and PmelI sites through Gibson assembly (E2621, NEB).
Vsg-ECD protein purification
PMT-Bip-Vsgs-ECD-Fc-his plasmids were transfected into S2R+ cells through the PolyJet™ in vitro DNA transfection reagent (SL100688, SignaGen). Cells were selected with 2 μg/mL puromycin (A1113803, Gibco) for 2 weeks to establish stable cell lines. Cells were seeded into 6 × 15 cm plates with 60% confluency, and kept in serum free Schneider’s medium (21720024, Gibco) with 500 μM Cu2+ for 5 days. Cell medium was harvested, and proteins were then purified through immobilized metal ion affinity chromatography (17-0575-01, GE Healthcare).
ADP-ribosylation detection
Vsg KO cells and control cells were seeded to 6-well plates with ~ 20% confluency, and incubated with 0, 25 or 50 pM pTc for 24 h at 25°C. Cells were harvested, washed by PBS and harvested in 100 μL lysis buffer (pH = 7.4, 20 mM Tris-HCl, 150 mM NaCl, 0.5% Triton X-100 and 0.5% SDS) for 10 min on ice. 10 μL of each sample was subjected to SDS-PAGE and immunoblot analysis with 1: 1000 anti-pan-ADP-ribose binding reagent and 1: 1000 anti-alpha-tubulin as the primary antibody and 1: 5000 HRP-conjugated goat anti-Rabbit IgG or goat anti-Mouse IgG as the secondary antibody.
Pull-down experiments
Dynabeads® M-280 Streptavidin beads (50 μL) were equilibrated in wash buffer (0.1% Triton X-100, 20 mM Tris-HCl, 150 mM NaCl, pH=7.5). Biotinylated TcdA1 (10 μg) and equilibrated beads were added to 300 μL wash buffer, and incubated at 4 °C for 2 h, and then Vsg-ECD-Fc (3 μg) or human IgG1-Fc (10702-HNAH, Sino biological) was added to the buffer and further incubated overnight. Beads were washed, collected, boiled, and subjected to SDS-PAGE and immunoblot analysis.
Generating Vsg KO cell lines
CRISPR knockouts in Drosophila melanogaster PT5/Cas9 or Anopheles gambiae Sua5B cells were carried out by transfecting cells with pLibAgam containing the following sgRNAs: Dmel_vsg1: 5’-TCGAAATGACCGCACGGCAC-3’; Dmel_vsg2: 5’-CTAATCTTGTGCCTCTTTGT-3’; Dmel_vsg3: 5’-GTGGTGTCCGGCGGAGTGG-3’). Acol_vsg1: 5’-GTAGTAGTATTAGAACTTG-3’; Acol_vsg2: 5’- CGACGTCGTAGGCGTAGCTG-3’ along with equal parts pBS130 using Effectene and selected in 5 μg/mL puromycin. Control sgRNAs for PT5/Cas9 cells were: scrambled1: 5’- GATCATGCACGTGGTCAATA-3’; scrambled2: 5’- GCTCTACAACCGACCGCTGC-3’; scrambled3: 5’- AGTCAGTGGTCCGTTACAGG-3’. Control sgRNA for Sua5B cells: 5’- CTAGACTCACTAGAGGGCAC-3’.
Generating Vsg KO flies
The vsgKO1 and vsgKO2 allele were generated using the CRISPR-Cas9 approach. Three recognition sequences of guide RNA to the vsg locus were designed. sgRNA1: 5’-CTAATCTTGTGCCTCTTTGT-3’; sgRNA2: 5’-GTGCCGTGCGGTCATTTCGA-3’; sgRNA3: 5’-AGTGGCCTACAAGTTCTACA-3’. These were cloned into the U6b-sgRNA-short vector, and pU6-sgRNA1 and pU6-sgRNA2 were used to generate the vsgKO1 flies, while pU6-sgRNA1 and pU6-sgRNA3 were used for vsgKO2 flies. Briefly, plasmids were co-injected into the embryos of (nos-Cas9) attP2 flies, then the F1 progeny were screened by PCR to identify the corresponding deletion using the following primers: pF: 5’-CCACTTCGCAAACGTATTTTCTT-3’ and pR: 5’-AGCTCCGGCTGCCGCATTGAA-3’. We used primers targeting gpdh1 as genotyping control primers: pF: 5’-GTCACCTGAAGGCAAGTCAG-3’ and pR: 5’- CTTGCCATACTTCTTGTCCGT-3’
Cytopathic cell-rounding and cell-enlargement assays
The cytopathic effect of pTc in mammalian cells was analyzed using a standard cell-rounding assay. In brief, cells were exposed to pTc for 24 h, and phase-contrast images of cells were recorded (Olympus Ix51, 20x objective). The numbers of normal and round shaped cells were counted manually from at least 3 pictures (30 – 150 cells per picture) from 3 repeats. The percentage of round-shaped cells was plotted and analyzed using GraphPad Prism7.
For insect cells, the cytopathic effect of pTc was analyzed based on the enlargement phenotype. Cells were exposed to pTc for 4 days, and phase-contrast images of cells were recorded (Olympus Ix51, 20x objective). The numbers of normal and enlarged cells were counted manually from at least 3 pictures (30 – 500 cells per picture) from 3 repeats. The percentage of enlarged cells was plotted and analyzed using GraphPad Prism7.
Whole mount staining of fly tissues
Fly tissues were dissected in Schneider’s medium, fixed in 4% PFA for 30 min and blocked in PBST (0.3% Triton X-100) with 5% goat serum for 1 h. Tissues were then incubated with primary antibodies (1:200) in PBST (0.1% Triton X-100) with 5% goat serum at 4 °C overnight. After washing with PBST six times, tissues were incubated with secondary antibodies (1:500) for 1 h at room temperature, then washed with PBST six additional times. Samples were mounted in the antifade mounting buffer (H-1000, VECTOR). Images were recorded with a Zeiss LSM880 Upright Confocal System and processed in ImageJ bundled with 64-bit Java 1.8.0_172.
Actin immunostaining in primary hemocytes
Briefly, L3 larvae were washed with PBS three times, and then dissected in Schneider’s medium plus 10% FBS, which allowed the release of hemocytes from the larval body cavity. Corpses and debris were carefully removed, and then the Schneider’s medium containing hemocytes was seeded into a glass bottom 96-well plate (P96–1.5H-N, Cellvis). After hemocytes attached to the plate, the medium was replaced with Schneider’s medium plus 10% FBS containing different concentrations of pTc for 18 h in a 25°C insect cell incubator. Cells were then fixed with 4% PFA and stained with Alexa Fluor 555-conjugated phalloidin (8953S, Cell Signaling) for 20 min. Red fluorescence images of cells were recorded (Zeiss LSM880, 20x objective and 63x oil objective). The numbers of normal cells and cells with bright actin clustering were counted manually from at least 3 pictures from 3 repeats for each concentration of pTc. The percentage of cells with bright actin clustering was analyzed using GraphPad Prism7.
Phagocytosis assay
Primary hemocytes from larvae were collected and seeded into glass bottom 96-well plates. After hemocytes attached to the plate, the medium was replaced with Schneider’s medium plus 10% FBS containing 0 pM, 25 pM, or 50 pM pTc for 18 h. The medium was then changed into serum-free Schneider’s medium with 40 μg/mL E. coli (K-12 strain) bio-particles (pHrodo™ Red E. coli BioParticles™ P35361, Invitrogen) for 30 min.
After incubation, the cell monolayer was washed 3 times with serum containing medium with the final wash containing Hoechst dye. Cells were then directly imaged to detect pHrodo™ Red E. coli BioParticles, or hemocytes were fixed with 4% PFA for 15 min and stained with Alexa Fluor-488-conjugated phalloidin (A12379, Thermo Fisher Scientific) for 20 min to reveal F-actin. Fluorescence images of cells were recorded (Zeiss LSM880, 20x objective and 63x oil objective). The integrated fluorescent intensity was quantified in ImageJ.
Bacterial infection in flies
Yersinia entomophaga was recovered from a frozen stock and incubated in BHI medium (53286, Millipore) at 28 °C overnight. When the OD600 reached 1.2, the bacteria were harvested and diluted 10-fold for pricking. P. luminescens subsp. akhurstii was recovered from a frozen stock and incubated in BHI medium at 30 °C overnight. When the OD600 reached 1.2, bacteria were harvested and concentrated 17-fold for pricking. 3 to 5-day-old D. melanogaster with the sex ratio 1: 1 were collected and anesthetized by CO2, pricked with a 0.1 mm stainless steel insect pin (26002–10, Austerlitz), and transferred to a 24°C incubator for survival tracking.
Colony forming units (CFU) were quantified in independent batches of infections. Flies were raised in a 16 °C fly incubator (3990FL, Thermo Fisher) prior to infection. After approximately seventy percent of the flies were dead in the Control-microbe group, all flies were collected and homogenized. For the microbe-treatment groups, 7 groups of 14 flies were collected and quantified for both KO and Control in P. luminescens subsp. Akhurstii infections, and 8 groups of 10 flies were collected and quantified for Yersinia entomophaga infections. For the PBS groups, 6 groups of 14 flies were collected and quantified in P. luminescens subsp. Akhurstii infection and 6 groups of 10 flies were collected and quantified in Yersinia entomophaga infection. Briefly, the homogenates were serially diluted and then deposited in 5 microliter spots on NBTA agar plates. Plates were incubated for 19–24 hours at 30°C (before Drosophila gut microbiota colonies appear). For CFU estimation, dilutions were chosen in which approximately 5–30 colonies were present in the microbe group. Under the chosen dilution, we found zero colonies in both PBS-groups.
Isolation of Vsg glycan
Approximately 300 μg of purified Vsg-ECD and sVsg-ECD were suspended in 0.1M NaOH solution prior to addition of NaBH4 to a final concentration of 55 mg/mL, and then the samples were incubated at 45 ºC for 45–55 h to release the oligosaccharides. The reaction was terminated by drop-wise addition of pure acetic acid, and the samples were then loaded onto a Amberchrom 50WX8 column with a mesh size of 200–400 (217514, Sigma-Aldrich) which was equilibrated with 5% acetic acid. The column was then washed with 5% acetic acid. Flow through and wash fractions were collected, pooled and lyophilized. Residual salts in the preparation were removed by co-evaporation with 3 × 1 mL of 9:1 methanol: acetic acid solution under a stream of nitrogen. Subsequent dry samples were purified on a 200 mg C18 Sep-Pak column (WAT054945, Waters) by washing with 3 mL of 5% acetic acid. The flow through and wash fractions were combined and lyophilized for further analysis.
MALDI-TOF analysis of Vsg glycans
β-eliminated glycans were permethylated, lyophilized and then redissolved in 10 μL of 75% methanol, from which 1 μL was mixed with 1 μL 2,5-dihydroxybenzoic acid (DHB) (5 mg/mL in 50% acetonitrile with 0.1% trifluoroacetic acid) and spotted on a MALDI polished steel target plate (Bruker Daltonics). MS data from each spot was then acquired on a Bruker UltraFlex II MALDI-TOF Mass Spectrometer (Bruker Daltonics). Reflective positive mode was used, and data were recorded between m/z 300 and m/z 4000. For each MS O-glycan profile, an aggregation of 20,000 laser shots or more were collected for data extraction. Mass signals of a signal/noise ratio of at least 4 were considered. Once acquired, the data were manually analyzed, and possible O-glycan compositions were annotated based on previously reported insect core structures.
Extended Data
Extended Data Fig. 1. Characterizing pTc toxicity in mammalian and insect cells.
a-b, U2OS, 5637, and HeLa cells were exposed to pTc for 24 h. Representative images were from one of three independent experiments and shown in (a). The percentage of rounded cells and CR50 values was quantified and plotted in (b).
c-d, S2 cells were treated with the indicated dose of pTc for 4 days. Representative images were from one of three independent experiments and shown in (c). The percentage of enlarged cells and CE50 values was quantified and plotted in (d).
Data were analyzed from the total number of images indicated in the Source data from three experiments and shown as mean ± SD or the best-fit value ± 95% CI. Scale bar = 50 μm.
Extended Data Fig. 2. Top-ranked genes identified in genome-wide CRISPR screens.
a, List of most prevalent 38 sgRNAs following the last round of selection with pTc or mTc.
b, Prevalence of all sgRNAs targeting Vsg, Mop, FIG4, or VAC14 across three rounds of pTc or mTc screens were quantified and plotted according to their corresponding gRNA abundances.
Extended Data Fig. 3. RNAi knock-down validation of top hits from CRISPR screens.
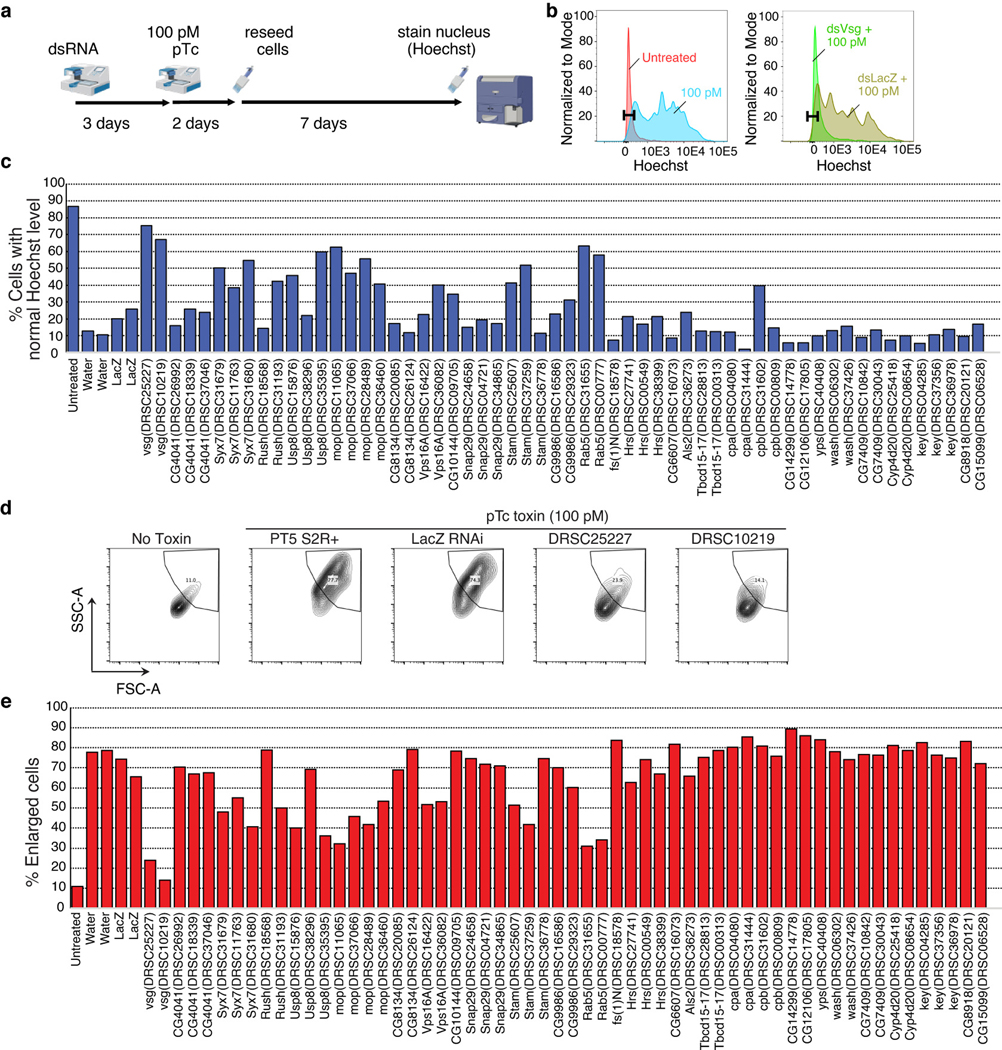
a, Schematic of the experimental steps. Briefly, S2 cells were bathed in 50 nM dsRNAs targeting the top hits from pTc CRISPR screen # 1 round 1 and allowed to recover for 3 days. Next, cells were treated with 100 pM pTc for 2 days, re-seeded and grown for an additional 7 days. DNA was stained by Hoechst dye and cells were analyzed by flow cytometry.
b, Comparison of untreated cells (red) versus those treated with 100 pM pTc (blue) revealed an increase in DNA content after pTc treatment (left). Comparison of pTc treatment following bathing in vsg dsRNA (green) versus LacZ control dsRNA (gold) showed that vsg dsRNA pre-bathing abrogated pTc-induced increase in DNA content. Gate representing DNA content of 80–90% of untreated cells was set. There was no pre-gating on cell sizes as pTc treatment causes changes in cell sizes and shapes.
c, The indicated top hits from pTc CRISPR screens were knocked down in S2 cells using dsRNA and then exposed to pTc as described in (a). Percentage of cells with normal Hoechst levels were plotted.
d, Comparison of untreated cells (No Toxin) versus those treated with 100 pM pTc revealed increase in cell size (quantified using the forward scatter/side scatter profile, SSC-A versus FSC-A). Comparison of pTc treatment following bathing in vsg dsRNA (DRSC25227 and DRSC10219) versus LacZ control dsRNA showed that vsg dsRNA pre-bathing abrogated pTc-induced cell size enlargement.
e, The indicated top hits from pTc CRISPR screens were knocked down in S2 cells using dsRNA and then exposed to pTc as described in (a). The percentage of enlarged cells was plotted, which gave similar results to DNA-content measurement in (c).
Extended Data Fig. 4. Characterization of Vsg KO S2 cells.
a-c, S2 cells expressing one of the three indicated sgRNAs before or after treatment with 130 pM pTc for 2 weeks were harvested with the sequence at the gRNA targeting sites analyzed by deep sequencing. The frequency of deletions of the indicated size were plotted (insertions represented less than 1% and were ignored). Non-frame-shift mutations (potentially retaining Vsg receptor activity, red) versus frameshift mutations (blue) are shown.
d, Vsg KO2, Vsg KO3, and the control S2 cells expressing scrambled sgRNA were exposed to two Tc toxins (Xn-XptA1, 3.5 nM; PI-TcdA4, 3 nM) for 4 days. Both contain the same TcdB2-TccC3 as pTc but utilize distinct A subunits (XptA1 from X. nematophila and TcdA4 from P. luminescens, respectively). Both toxins induced cell enlargement on Vsg KO cells and showed no difference on potency on control cells versus Vsg KO cells.
Data were analyzed from the total number of images indicated in the bar graphs from three experiments and shown as mean ± SD.
Extended Data Fig. 5. TcdA1 binds to Vsg-ECD and Vsg-ECD can reduce binding of TcdA1 to cells.
a, S2 cells stably expressing GFP-Vsg (GFP was inserted after Vsg signal peptide, SP-GFP-Vsg cells) were mixed with the control S2 cells. Cells were incubated with Alexa Fluor-647-conjugated TcdA1 (pentamer, 25 nM) at room temperature for 1 h and then subjected to flow cytometry analysis. S2 cells that express GFP-Vsg showed elevated binding of TcdA1 compared with the control S2 cells.
b, Vsg-ECD-Fc produced in S2 cells shown in SDS-PAGE gels with Coomassie blue staining, which showed an apparent molecular weight of ~ 130 kDa, much larger than its predicted molecular weight, indicating that the protein is heavily glycosylated. Representative images were from one of three independent experiments.
c, Biotinylated TcdA1 interacted with purified Fc-tagged Vsg-ECD, but not the control IgG1-Fc. For gel source data, see Supplementary Figure 1. Representative images were from one of three independent experiments.
d, BLI analysis showing that TcdA1 did not bind to empty probes, and Morganella morganii TcdA4 from mTc and a Tc toxin (YenTc) from Yersinia entomophaga showed no binding to immobilized Vsg-ECD-Fc.
e, Pre-incubation of 15 nM TcdA1 pentamer with 1 μM Vsg-ECD for 2 h in 4 °C reduced TcdA1 binding to U2OS cells transfected with Vsg. Representative images were from one of three independent experiments. Scale bar = 100 μm.
Extended Data Fig. 6. Alignment of Vsg, Vsg orthologs, and an artificial receptor.
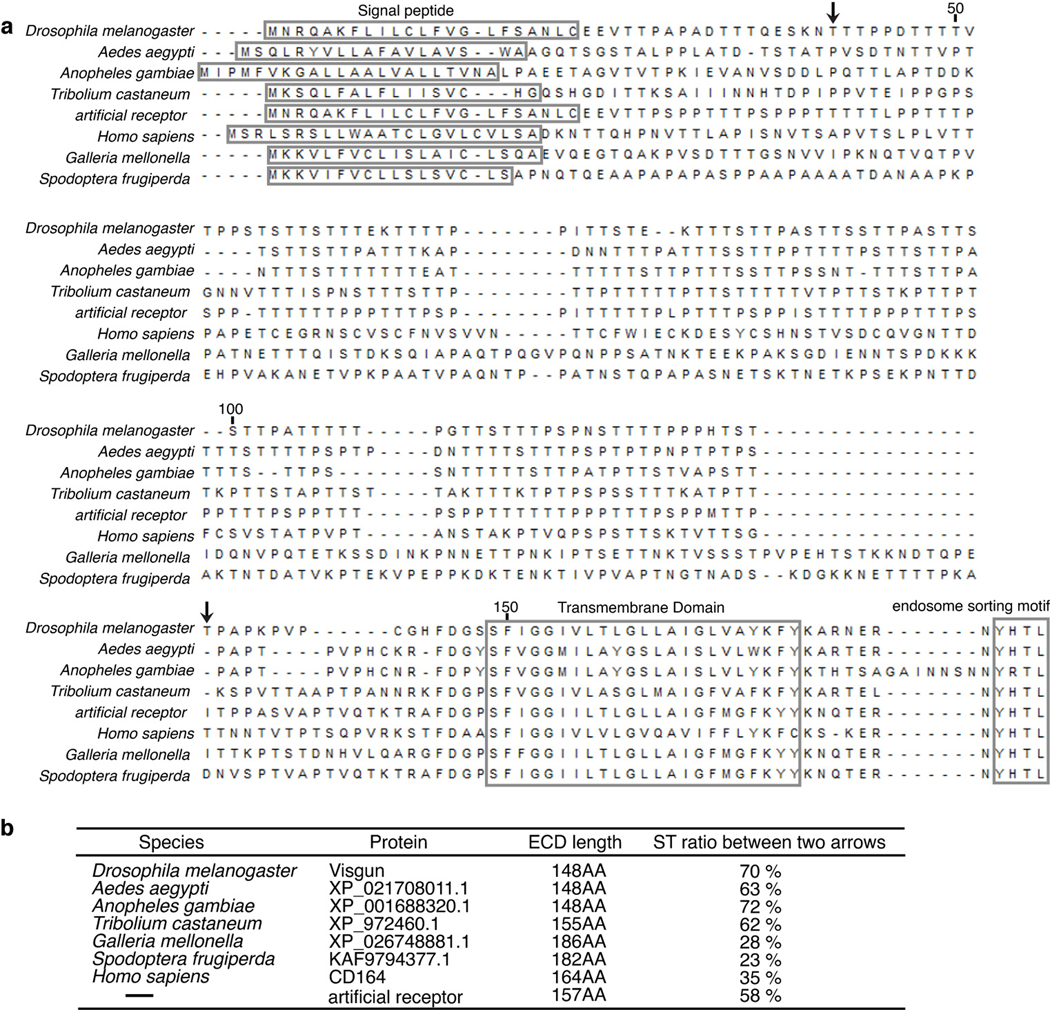
a, The protein sequences of the indicated Vsg orthologs were aligned in Mega-X through the CLUSTWS method (Drosophila melanogaster: NP_729535.1; Aedes aegypti: XP_021708011.1; Anopheles gambiae: XP_001688320.1; Tribolium castaneum: XP_972460.1; Homo sapiens: NP_006007.2; Galleria mellonella: XP_026748881.1; Spodoptera frugiperda: KAF9794377.1).
b, Percentages of T/S residues within the PTS region in Vsg (residues 41–134 in D. melanogaster Vsg, between two arrows) and the corresponding region in other Vsg homologs and the artificial receptor were counted and listed.
Extended Data Fig. 7. Expression of Vsg orthologs in U2OS cells and rescue of Vsg KO S2 cells with Vsg and aVsg.
a, GFP fused Vsg, gVsg, sVsg, TMEM123, or CD164 were transfected into U2OS cells (GFP was inserted after the signal peptide of Vsgs). Cells were fixed and immunostaining was carried out using an anti-GFP antibody without permeabilization of cell membranes. Representative images from one of three independent experiments were shown. Scale bar = 20 μm.
b, Vsg KO2 S2 cells were transiently transfected with plasmids encoding blue fluorescent protein (BFP) or BFP plus Vsg or agVsg. Cells were then incubated with 25 pM pTc for 20 h, fixed, and stained with Alexa Fluor-647-conjugated phalloidin. BFP marked transfected cells. The percentages of transfected cells with toxin-induced actin clustering phenotype were plotted. Representative images from one of three independent experiments were shown. Scale bar = 50 μm.
c, Vsg KO2 S2 cells (expressing GFP from the Vsg gRNA plasmid) were transiently transfected with BFP or BFP + agVsg plasmids, then treated with 30 pM pTc for 3 days. Cells were recorded directly under confocal. The percentages of transfected cells to become enlarged were plotted.
Representative images from one of three independent experiments were shown. Scale bar = 50 μm. Data were analyzed from the total number of images indicated in the bar graphs from three experiments and shown as mean ± SD.
Extended Data Fig. 8. O-glycosylation contributes to pTc binding and mass spectrometry analysis of O-glycans on Vsg and sVsg.
a, Vsg-ECD treated with O-glycosidase and PNGase F showed reduced molecular weight.
b, Rounding of U2OS cells transiently expressing Vsg-GFP fusion proteins and Vsg-GFP with two N-glycan site mutations (N40T and N121S) via transient transfection. Cells were exposed to pTc for 24 h. The percentage of rounded GFP-positive cells was quantified and plotted. Data were analyzed from the total number of images indicated in the bar graphs from three experiments and shown as mean ± SD.
c, Characterization of TcdA1 binding to equal amounts of immobilized Vsg-ECD, Vsg-ECD treated with PNGase F, and Vsg-ECD treated with O-glycosidase, using the BLI assay.
d, Vsg-ECD and sVsg-ECD were purified as Fc-tagged proteins in S2 cells. β-eliminated glycans were permethylated and analyzed using mass spectrometry. Mass peaks were manually assigned to the indicated O-glycan moieties.
e, The O-glycosylaton sites in Vsg-ECD and sVsg-ECD were predicted using NetOGlyc (http://www.cbs.dtu.dk/services/NetOGlyc/) and marked in red.
Extended Data Fig. 9. Vsg expression in D. melanogaster tissues.
a, Schematic illustration of the GFP-Vsg gene fusion in fly strain 50812. The protein-trap constructs P{PTT-GA} carry an Avic\GFP vital fluorescent protein-trap marker. GFP is inserted into the first intron of vsg, resulting in a fusion of GFP between residues 24 and 25 of Vsg.
b, GFP-Vsg (green) was detected in larval ovary tissue and co-localized with phalloidin labeled ring canal structures (red). It was also detected in ring canals across the cell membrane marked by Hts staining (red) in larval lymph gland, eye disks and brain tissues. Hoechst dye marks the nuclei (blue). Scale bar = 10 μm.
c, GFP-Vsg was detected in hemocytes and fat body cells. Hoechst dye marks the nuclei (blue). The edge of a fat body cell is marked. Scale bar = 10 μm.
Representative images were from one of three independent experiments.
Extended Data Fig. 10. Hemocytes from Vsg KO1 fly are resistant to pTc.
a-b, Hemocytes from the control strain (nos-Cas9;attP2) or Vsg KO1 D. melanogaster were exposed to the indicated concentrations of pTc for 18 h. Cells were fixed and stained with phalloidin (red) and Hoechst (blue). Representative images (a), and quantification of the percentage of cells with actin clustering phenotype were shown in (b). Scale bar = 10 μm.
c-d, Hemocytes from a Vsg KO fly line (Hml-Gal4,UAS-EGFP; KO2) and a rescue line that expresses aVsg in hemocytes (Hml-Gal4,UAS-EGFP/UAS-avsg; KO2) were exposed to 100 pM pTc for 18h. Cells were fixed and stained with phalloidin (red). Representative images (c), and quantification of the percentage of cells with actin clustering were shown in (d). Scale bar = 20 μm.
e-f, Hemocytes from Control or Vsg KO2 D. melanogaster were treated with pTc (25 pM, 18 h) and then co-incubated with fluorescently labelled E. coli bioparticles (red) for 30 min. Cells were then fixed and stained with Alexa Fluor-488-conjugated phalloidin (green) (e). E. coli bioparticles per cell were counted and plotted in (f). Scale bar = 10 μm.
Data were analyzed from the total number of images indicated in the bar graphs from three experiments and shown as mean ± SD.
Supplementary Material
Acknowledgments
We thank K. Vogel-Bachmayr for technical assistance, and Reed Stubbendieck for suggestions on the phylogenetic tree of Vsgs. This study was partially supported by grants from National Institute of Health (NIH) (R01NS080833, R01NS117626, R01AI132387, and R01AI139087 to M.D.; R01AI170835 to M.D. and N.P.), Intelligence Advanced Research Projects Activity (IARPA) (grant number W911NF-17-2-0089 to M.D.), NIH NIGMS P41 GM132087 (to N.P.), and from the Max Planck Society (to S.R.). M.D. acknowledge support from the NIH-funded Harvard Digestive Disease Center (P30DK034854) and Boston Children’s Hospital Intellectual and Developmental Disabilities Research Center (P30HD18655). M.D. holds the Investigator in the Pathogenesis of Infectious Disease award from the Burroughs Wellcome Fund. N.P. is an investigator of Howard Hughes Medical Institute.
Footnotes
Additional Information
Supplementary Information is available for this paper. Reprints and permissions information is available at www.nature.com/reprints.
Competing Interests
The authors declare no conflicts of interest.
Data and material availability statement
All data generated or analyzed during this study are included in this published article (and its supplementary data and source data files). All biological materials are available upon requests from the co-corresponding authors.
References
- 1.Lacey LA et al. Insect pathogens as biological control agents: Back to the future. J Invertebr Pathol 132, 1–41 (2015). [DOI] [PubMed] [Google Scholar]
- 2.Labaude S & Griffin CT Transmission Success of Entomopathogenic Nematodes Used in Pest Control. Insects 9 (2018). [DOI] [PMC free article] [PubMed] [Google Scholar]
- 3.Bowen D et al. Insecticidal toxins from the bacterium Photorhabdus luminescens. Science 280, 2129–2132 (1998). [DOI] [PubMed] [Google Scholar]
- 4.Roderer D & Raunser S Tc Toxin Complexes: Assembly, Membrane Permeation, and Protein Translocation. Annu Rev Microbiol 73, 247–265 (2019). [DOI] [PubMed] [Google Scholar]
- 5.Waterfield NR, Bowen DJ, Fetherston JD, Perry RD & ffrench-Constant RH The tc genes of Photorhabdus: a growing family. Trends Microbiol 9, 185–191 (2001). [DOI] [PubMed] [Google Scholar]
- 6.Waterfield NR, Ciche T & Clarke D Photorhabdus and a host of hosts. Annu Rev Microbiol 63, 557–574 (2009). [DOI] [PubMed] [Google Scholar]
- 7.Clarke DJ Photorhabdus: a tale of contrasting interactions. Microbiology (Reading) 166, 335–348 (2020). [DOI] [PubMed] [Google Scholar]
- 8.Leidreiter F et al. Common architecture of Tc toxins from human and insect pathogenic bacteria. Sci Adv 5, eaax6497 (2019). [DOI] [PMC free article] [PubMed] [Google Scholar]
- 9.Hares MC et al. The Yersinia pseudotuberculosis and Yersinia pestis toxin complex is active against cultured mammalian cells. Microbiology (Reading) 154, 3503–3517 (2008). [DOI] [PubMed] [Google Scholar]
- 10.Landsberg MJ et al. 3D structure of the Yersinia entomophaga toxin complex and implications for insecticidal activity. Proc Natl Acad Sci U S A 108, 20544–20549 (2011). [DOI] [PMC free article] [PubMed] [Google Scholar]
- 11.Song N et al. Genome-wide dissection reveals diverse pathogenic roles of bacterial Tc toxins. PLoS Pathog 17, e1009102 (2021). [DOI] [PMC free article] [PubMed] [Google Scholar]
- 12.Waterfield N, Hares M, Yang G, Dowling A & ffrench-Constant R Potentiation and cellular phenotypes of the insecticidal Toxin complexes of Photorhabdus bacteria. Cell Microbiol 7, 373–382 (2005). [DOI] [PubMed] [Google Scholar]
- 13.Gatsogiannis C et al. A syringe-like injection mechanism in Photorhabdus luminescens toxins. Nature 495, 520–523 (2013). [DOI] [PubMed] [Google Scholar]
- 14.Meusch D et al. Mechanism of Tc toxin action revealed in molecular detail. Nature 508, 61–65 (2014). [DOI] [PubMed] [Google Scholar]
- 15.Piper SJ et al. Cryo-EM structures of the pore-forming A subunit from the Yersinia entomophaga ABC toxin. Nat Commun 10, 1952 (2019). [DOI] [PMC free article] [PubMed] [Google Scholar]
- 16.Busby JN, Panjikar S, Landsberg MJ, Hurst MR & Lott JS The BC component of ABC toxins is an RHS-repeat-containing protein encapsulation device. Nature 501, 547–550 (2013). [DOI] [PubMed] [Google Scholar]
- 17.Gatsogiannis C et al. Tc toxin activation requires unfolding and refolding of a beta-propeller. Nature 563, 209–213 (2018). [DOI] [PubMed] [Google Scholar]
- 18.Roderer D, Hofnagel O, Benz R & Raunser S Structure of a Tc holotoxin pore provides insights into the translocation mechanism. Proc Natl Acad Sci U S A 116, 23083–23090 (2019). [DOI] [PMC free article] [PubMed] [Google Scholar]
- 19.Gatsogiannis C et al. Membrane insertion of a Tc toxin in near-atomic detail. Nat Struct Mol Biol 23, 884–890 (2016). [DOI] [PubMed] [Google Scholar]
- 20.Lang AE et al. Photorhabdus luminescens toxins ADP-ribosylate actin and RhoA to force actin clustering. Science 327, 1139–1142 (2010). [DOI] [PubMed] [Google Scholar]
- 21.Roderer D et al. Glycan-dependent cell adhesion mechanism of Tc toxins. Nat Commun 11, 2694 (2020). [DOI] [PMC free article] [PubMed] [Google Scholar]
- 22.Ng’ang’a PN et al. Involvement of N-glycans in binding of Photorhabdus luminescens Tc toxin. Cell Microbiol 23, e13326 (2021). [DOI] [PubMed] [Google Scholar]
- 23.Song N et al. N-Glycans and sulfated glycosaminoglycans contribute to the action of diverse Tc toxins on mammalian cells. PLoS Pathog 17, e1009244 (2021). [DOI] [PMC free article] [PubMed] [Google Scholar]
- 24.Shalem O et al. Genome-scale CRISPR-Cas9 knockout screening in human cells. Science 343, 84–87 (2014). [DOI] [PMC free article] [PubMed] [Google Scholar]
- 25.Tao L et al. Frizzled proteins are colonic epithelial receptors for C. difficile toxin B. Nature 538, 350–355 (2016). [DOI] [PMC free article] [PubMed] [Google Scholar]
- 26.Zhou Y et al. High-throughput screening of a CRISPR/Cas9 library for functional genomics in human cells. Nature 509, 487–491 (2014). [DOI] [PubMed] [Google Scholar]
- 27.Viswanatha R, Li Z, Hu Y & Perrimon N Pooled genome-wide CRISPR screening for basal and context-specific fitness gene essentiality in Drosophila cells. Elife 7, e36333 (2018). [DOI] [PMC free article] [PubMed] [Google Scholar]
- 28.Hacker U, Lin X & Perrimon N The Drosophila sugarless gene modulates Wingless signaling and encodes an enzyme involved in polysaccharide biosynthesis. Development 124, 3565–3573 (1997). [DOI] [PubMed] [Google Scholar]
- 29.Kaiser E et al. Membrane translocation of binary actin-ADP-ribosylating toxins from Clostridium difficile and Clostridium perfringens is facilitated by cyclophilin A and Hsp90. Infect Immun 79, 3913–3921 (2011). [DOI] [PMC free article] [PubMed] [Google Scholar]
- 30.Zhou GQ et al. The Drosophila ortholog of the endolysosomal membrane protein, endolyn, regulates cell proliferation. J Cell Biochem 99, 1380–1396 (2006). [DOI] [PubMed] [Google Scholar]
- 31.Watt SM, Buhring HJ, Simmons PJ & Zannettino AWC The stem cell revolution: on the role of CD164 as a human stem cell marker. NPJ Regen Med 6, 33 (2021). [DOI] [PMC free article] [PubMed] [Google Scholar]
- 32.Buszczak M et al. The carnegie protein trap library: a versatile tool for Drosophila developmental studies. Genetics 175, 1505–1531 (2007). [DOI] [PMC free article] [PubMed] [Google Scholar]
- 33.Airoldi SJ, McLean PF, Shimada Y & Cooley L Intercellular protein movement in syncytial Drosophila follicle cells. J Cell Sci 124, 4077–4086 (2011). [DOI] [PMC free article] [PubMed] [Google Scholar]
- 34.Hoffmann JA & Reichhart JM Drosophila innate immunity: an evolutionary perspective. Nat Immunol 3, 121–126 (2002). [DOI] [PubMed] [Google Scholar]
- 35.Kounatidis I & Ligoxygakis P Drosophila as a model system to unravel the layers of innate immunity to infection. Open Biol 2, 120075 (2012). [DOI] [PMC free article] [PubMed] [Google Scholar]
- 36.Boman HG, Nilsson I & Rasmuson B Inducible antibacterial defence system in Drosophila. Nature 237, 232–235 (1972). [DOI] [PubMed] [Google Scholar]
- 37.Bakkers MJG et al. CD164 is a host factor for lymphocytic choriomeningitis virus entry. Proc Natl Acad Sci U S A 119, e2119676119 (2022). [DOI] [PMC free article] [PubMed] [Google Scholar]
- 38.Liu J et al. Genome-Wide Knockout Screen Identifies Human Sialomucin CD164 as an Essential Entry Factor for Lymphocytic Choriomeningitis Virus. mBio 13, e0020522 (2022). [DOI] [PMC free article] [PubMed] [Google Scholar]
- 39.Daborn PJ, Waterfield N, Blight MA & Ffrench-Constant RH Measuring virulence factor expression by the pathogenic bacterium Photorhabdus luminescens in culture and during insect infection. J Bacteriol 183, 5834–5839 (2001). [DOI] [PMC free article] [PubMed] [Google Scholar]
- 40.Silva CP et al. Bacterial infection of a model insect: Photorhabdus luminescens and Manduca sexta. Cell Microbiol 4, 329–339 (2002). [DOI] [PubMed] [Google Scholar]
Additional References
- 41.Li W et al. MAGeCK enables robust identification of essential genes from genome-scale CRISPR/Cas9 knockout screens. Genome Biol 15, 554 (2014). [DOI] [PMC free article] [PubMed] [Google Scholar]
- 42.Viswanatha R et al. Bioinformatic and cell-based tools for pooled CRISPR knockout screening in mosquitos. Nat Commun 12, 6825 (2021). [DOI] [PMC free article] [PubMed] [Google Scholar]
- 43.Jones SA & Hurst MR Purification of the Yersinia entomophaga Yen-TC Toxin Complex Using Size Exclusion Chromatography. Methods Mol Biol 1477, 39–48 (2016). [DOI] [PubMed] [Google Scholar]
Associated Data
This section collects any data citations, data availability statements, or supplementary materials included in this article.
Supplementary Materials
Data Availability Statement
All data generated or analyzed during this study are included in this published article (and its supplementary data and source data files). All biological materials are available upon requests from the co-corresponding authors.


