

Abstract
Background: Although current immunotherapies have achieved some successes for hepatocellular carcinoma (HCC) patients, their benefits are limited for most HCC patients. Therefore, the identification of biomarkers for promoting immunotherapeutic responses in HCC is urgently needed.
Methods: Using the TCGA HCC cohort, we investigated correlations of various molecular features with antitumor immune signatures (CD8+ T cell infiltration and cytolytic activity) and an immunosuppressive signature (PD-L1 expression) in HCC. These molecular features included mRNAs, microRNAs (miRNAs), long non-coding RNAs (lncRNAs), proteins, and pathways.
Results: We found that the mutations of several oncogenes and tumor suppressor genes significantly correlated with reduced antitumor immune signatures, including TTN, CTNNB1, RB1, ZFHX4, and TP53. It indicates that these genes’ mutations may inhibit antitumor immune responses in HCC. Four proteins (Syk, Lck, STAT5, and Caspase-7) had significant positive expression correlations with CD8+ T cell enrichment, cytolytic activity, and PD-L1 expression in HCC. It suggests that these proteins’ expression could be useful biomarkers for the response to immune checkpoint inhibitors Similiarly, we identified other types of biomarkers potentially useful for predicting the response to ICIs, including miRNAs (hsa-miR-511-5p, 150-3p, 342-3p, 181a-3p, 625-5p, 4772-3p, 155-3p, 142-5p, 142-3p, 155-5p, 625-3p, 1976, 7702), many lncRNAs, and pathways (apoptosis, cytokine-cytokine receptor interaction, Jak-STAT signaling, MAPK signaling, PI3K-AKT signaling, HIF-1 signaling, ECM receptor interaction, focal adhesion, and estrogen signaling). Further, tumor mutation burden showed no significant correlation with antitumor immunity, while tumor aneuploidy levels showed a significant negative correlation with antitumor immunity.
Conclusion: The molecular features significantly associated with HCC immunity could be predictive biomarkers for immunotherapeutic responses in HCC patients. They could also be potential intervention targets for boosting antitumor immunity and immunotherapeutic responses in HCC.
Keywords: hepatocellular carcinoma, antitumor immunity, cancer immunotherapy, multi-omics analysis, biomarker
Introduction
Hepatocellular carcinoma (HCC) is a primary malignancy of the liver and accounts for around 90% of cases (Villanueva, 2019). Traditional therapeutic strategies, such as surgical interventions, radiotherapy, transarterial therapies, chemotherapy, and targeted therapy, are common approaches to HCC treatment. Although these therapies have substantially improved the survival of HCC patients, median survival times for early, intermediate, and advanced HCC are around 36, 16, and 6 months, respectively (Llovet et al., 2021). Recently, immunotherapies have demonstrated successes in treating various malignancies, including HCC (Yau et al., 2020). In 2020, the combination of atezolizumab (anti-PD-L1 antibody) and bevacizumab (anti-VEGF antibody) was approved as first-line therapy for HCC. It indicates clinical benefit of immunotherapies for HCC patients. Nevertheless, only a subset of cancer patients currently benefit from immunotherapies (Braun et al., 2016). The mechanisms of response and resistance to immunotherapies remains unclear, and potential predictive biomarkers remain to be uncovered. To this end, certain genetic or genomic markers for cancer immunotherapeutic responses have been identified, such as PD-L1 expression (Taube et al., 2014), tumor mutation burden (TMB) (Goodman et al., 2017), and mismatch repair deficiency (Le et al., 2015). Besides, the tumor immune microenvironment (TIME) is a key regulator of immunotherapeutic responses (Murciano-Goroff et al., 2020). In general, the “hot” tumors infiltrated by ample tumor-infiltrating lymphocytes (TILs) respond better to immunotherapies, compared to the “cold” tumors with sparse TILs (Haanen, 2017).
Based on large-scale cancer genomics data, such as TCGA (https://portal.gdc.cancer.gov/) and ICGC (https://dcc.icgc.org/), many studies have explored the TIME in HCC (Sia et al., 2017; Farha et al., 2020; Gao et al., 2020). For example, Gao et al. identified four immune-related subtypes of HCC based on the abundances of 13 tumor microenvironment (TME)-associated signatures, which displayed significantly different molecular and clinical characteristics (Gao et al., 2020). Sia et al. identified an immune-specific subclass of HCC by analysis of gene expression profiles in tumor, stromal, and immune cells, which constituted approximately 25% of HCC cases (Sia et al., 2017). Farha et al. identified two immune clusters of HCC based on the enrichment of immune cell subpopulations, of which the M0 macrophage-enriched cluster had a poor prognosis (Farha et al., 2020).
Despite these prior investigations (Sia et al., 2017; Farha et al., 2020; Gao et al., 2020), a comprehensive identification of molecular features significantly associated with the TIME in HCC is worth further investigation, because these molecular features could be predictive biomarkers for the response to immunotherapy in HCC. In this study, by multi-omics analysis, we explored the associations of various molecule types with HCC immunity in the TCGA HCC cohort. These molecule types included genes (DNA and mRNA), microRNAs (miRNAs), long non-coding RNAs (lncRNAs), proteins, and pathways. We identified the molecular features showing significant correlations with antitumor immune signatures (such as CD8+ T cell infiltration and cytolytic activity) and immunosuppressive signatures (such as PD-L1 expression) in HCC. This study aimed to discover novel predictive biomarkers for the immunotherapeutic response in HCC that have potential clinical values.
Methods
Dataset
We downloaded multi-omics (somatic mutations, mRNA expression, protein expression, miRNA expression, and lncRNA expression) and clinical data for the TCGA HCC cohort from the GDC data portal (https://portal.gdc.cancer.gov/). All expression values (RSEM normalized) were transformed by log2 (x+1) before subsequent analyses, except protein expression values which were normalized in TCGA generated by the reverse phase protein array (RPPA). In addition, we obtained cancer-associated pathways and their gene sets from KEGG (Kanehisa et al., 2017).
Quantification of immune signature enrichment in tumors
The enrichment level of an immune signature in a tumor was defined as the mean expression level of its marker genes. A total of three immune signatures were analyzed, including CD8+ T cells, cytolytic activity, and PD-L1 expression. The marker genes of these immune signatures are shown in Table 1.
TABLE 1.
The marker genes of the three immune signatures analyzed in this study.
| Immune signature | Marker genes |
|---|---|
| CD8+ T cells | CD2, CD247, CD28, CD3D, CD3E, CD3G, CD8A, ICAM1, ITGAL, ITGB2, PTPRC, THY1 |
| Cytolytic activity | PRF1, GZMA |
| PD-L1 | PD-L1 |
Correlations between immune signature enrichment and molecular features in hepatocellular carcinoma
We identified the genes whose mutations were significantly correlated with immune signature enrichment in HCC using Student’s t tests. Pearson correlation tests were utilized to identify the genes, proteins, miRNAs, and lncRNAs having significant expression correlations with immune signature enrichment in HCC. We quantified a pathway’s activity in a tumor by the single-sample gene-set enrichment analysis (ssGSEA) (Hanzelmann et al., 2013). The ssGSEA algorithm evaluated a pathway’s activity, namely ssGSEA score, in a sample based on the expression profiles of the pathway gene set. The R package “GSVA” was utilized to perform the ssGSEA algorithm. Spearman correlation tests were used to identify the cancer-associated pathways whose activity significantly correlated with immune signature enrichment in HCC. The false discovery rate (FDR) (Benjamini and Hochberg, 1995) was used to correct for p-values in multiple tests.
Gene-set enrichment analysis
We used GSEA (Subramanian et al., 2005) to identify the KEGG (Kanehisa et al., 2017) pathways that were significantly associated with the genes having an important expression correlation with immune signature enrichment with a threshold of FDR <0.05. Given an a priori defined set of genes S, GSEA will predict pathways, biological function, and other phenotypes significantly associated with S, according to whether the members of S are randomly distributed throughout the entire ranked list L or primarily found at the top or bottom.
Quantification of TMB and tumor aneuploidy level (TAL)
We defined a tumor’s TMB as the total somatic mutation count in the tumor. A tumor’s TAL was its tumor ploidy score calculated by absolute (Carter et al., 2012), which estimates the tumor ploidy score based on its somatic copy number alterations with the input of segmented copy number data.
Survival analysis
We compared the overall survival rate between gene-mutated and gene-wildtype cancers in the TCGA HCC cohort. We used Kaplan-Meier survival curves to show the survival time differences and the log-rank test to assess the significance of survival time differences.
Results
Identification of genes whose mutations correlate with antitumor immune responses in hepatocellular carcinoma
We found four genes whose mutations showed significant correlations with reduced CD8+ T cell enrichment levels or cytolytic activity in HCC (Mann-Whitney U test, FDR <0.05), including TTN, CTNNB1, RB1, and ZFHX4 (Figure 1A). Also, TP53 mutations were associated with reduced cytolytic activity in HCC (Mann-Whitney U test, p = 0.001). These results indicate that these genes’ mutations may inhibit antitumor immune responses in HCC. CTNNB1 encodes a protein that functions on regulating cell growth and adhesion between cells and is a regulator of the WNT signaling pathway (He and Tang, 2020). CTNNB1 (catenin beta 1) mutations are involved in development of various cancers, including colorectal cancer (Akyol et al., 2019), lung cancer (Zhou et al., 2021), HCC (Kalasekar et al., 2019), ovarian and endometrial endometrioid cancer (Liu et al., 2014), Wilms tumors (Li et al., 2004), and medulloblastoma (Fattet et al., 2009). The Wnt/β-catenin pathway is involved in modulating antitumor immune responses (Pai et al., 2017), supporting our findings. TP53 (tumor protein p53) is a well-known tumor suppressor gene and is mutated in a wide variety of human cancers (Wang and Sun, 2017). This gene is the second most frequently mutated genes, next to TTN, with a mutation rate of more than 30% in HCC (Sun et al., 2018). The association between TP53 mutations and decreased antitumor immune responses has been uncovered in many cancers, such as head and neck squamous cell cancer (Lyu et al., 2019), gastric cancer (Jiang et al., 2018), and colon cancer (Li et al., 2020a). It is consistent with the finding in this study. ZFHX4 (zinc finger homeobox 4) has a mutation rate of around 6% in HCC, and its mutations are associated with unfavorable overall survival in HCC (Sun et al., 2018). Although this gene is mutated in various cancer types, such as lung cancer, melanoma, gastrointestinal cancer, and bladder cancer (Sun et al., 2018), few studies have reported the association between its mutations and antitumor immunity. RB1 (RB transcriptional corepressor 1) is another tumor suppressor gene, with a mutation rate of nearly 6% in HCC (Sun et al., 2018). A previous study has shown that co-mutations of RB1 and TP53 were associated with increased antitumor immune responses in bladder cancer (Manzano et al., 2021), contrast with the findings in this study. It indicates the cancer type-dependent association between their mutations and antitumor immune responses, as reported in a previous study (Li et al., 2020a). Among the four genes, mutations of RB1 and ZFHX4 were associated with a lower overall survival rate in HCC (Figure 1B). It is justified since their mutations are associated with reduced antitumor immune responses.
FIGURE 1.

Four genes whose mutations have significant correlations with reduced antitumor immune responses in HCC. (A) Four genes whose mutations are correlated with reduced CD8+ T cell enrichment levels or cytolytic activity in HCC. (B) Kaplan-Meier curves showing two of the four genes whose mutations are correlated with better overall survival in HCC.
Identification of genes whose expression correlates with antitumor immune responses in hepatocellular carcinoma
We found 140 genes having strong positive expression correlations with the enrichment levels of CD8+ T cells in HCC (Pearson correlation coefficient r > 0.8) (Supplementary Table S1). Among them, nine genes showed the strongest positive expression correlations with the enrichment levels of CD8+ T cells in HCC (r > 0.9), including SLAMF6, COR O 1A, CD6, SIT1, SASH3, CD2, PTPN7, CD3E, and LCK (Figure 2A). As expected, all these genes are involved in the regulation of T cell activation (Chetty and Gatter, 1994; Marie-Cardine et al., 1999; Beer et al., 2001; Palacios and Weiss, 2004; Mueller et al., 2008; Stanford et al., 2012; Santos et al., 2016; Dragovich et al., 2019; Zurli et al., 2020). GSEA (Subramanian et al., 2005) identified 43 KEGG (Kanehisa et al., 2017) pathways significantly correlated with the 140 genes (Figure 2B). As expected, most of these pathways are involved in immune regulation, such as T cell receptor signaling, natural killer cell-mediated cytotoxicity, chemokine signaling, cytokine-cytokine receptor interaction, cell adhesion molecules, Jak-STAT signaling, antigen processing and presentation, cytosolic DNA-sensing, and Toll-like receptor signaling. In addition, the 43 pathways included certain stromal and oncogenic pathways, including regulation of actin cytoskeleton, focal adhesion, tight junction, VEGF, MAPK, and ErbB signaling pathways. Besides, we found 15 genes showing strong positive expression correlations with cytolytic activity in HCC (r > 0.8) (Figure 2C). These genes included KLRD1, CD8B, SLAMF6, TBX21, CD8A, GZMB, PTPRCAP, CD247, GZMH, KLRK1, CCL5, CST7, GZMA, PRF1, and NKG7. Again, all these genes are involved in immune regulation. Furthermore, we did not found genes whose expression had strong positive correlations with PD-L1 expression (r < 0.7). The genes with the strongest positive expression correlations with PD-L1 included CD84, PDCD1LG2, and JAK2 (0.6 < r < 0.7). CD84 (CD84 molecule) encodes a membrane glycoprotein belonging to the signaling lymphocyte activation molecule (SLAM) family. Prior studies have shown that CD84 can upregulate PD-L1 expression in cancer (Lewinsky et al., 2018). Like PD-L1, PDCD1LG2 (programmed cell death 1 ligand 2) encodes a ligand of PD-1 (programmed cell death 1). It is reasonable that this gene has a significant positive expression correlation with PD-L1. JAK2 (Janus kinase 2) encodes a non-receptor tyrosine kinase having a pivotal role in cytokine and growth factor signaling. This gene has been shown to be co-upregulated with PD-L1 in cancer (Ikeda et al., 2016). On the other hand, although there were significant negative correlations between numerous genes’ expression and CD8+ T cell enrichment or cytolytic activity in HCC, these correlations were not strong (FDR <0.05; r > −0.4).
FIGURE 2.
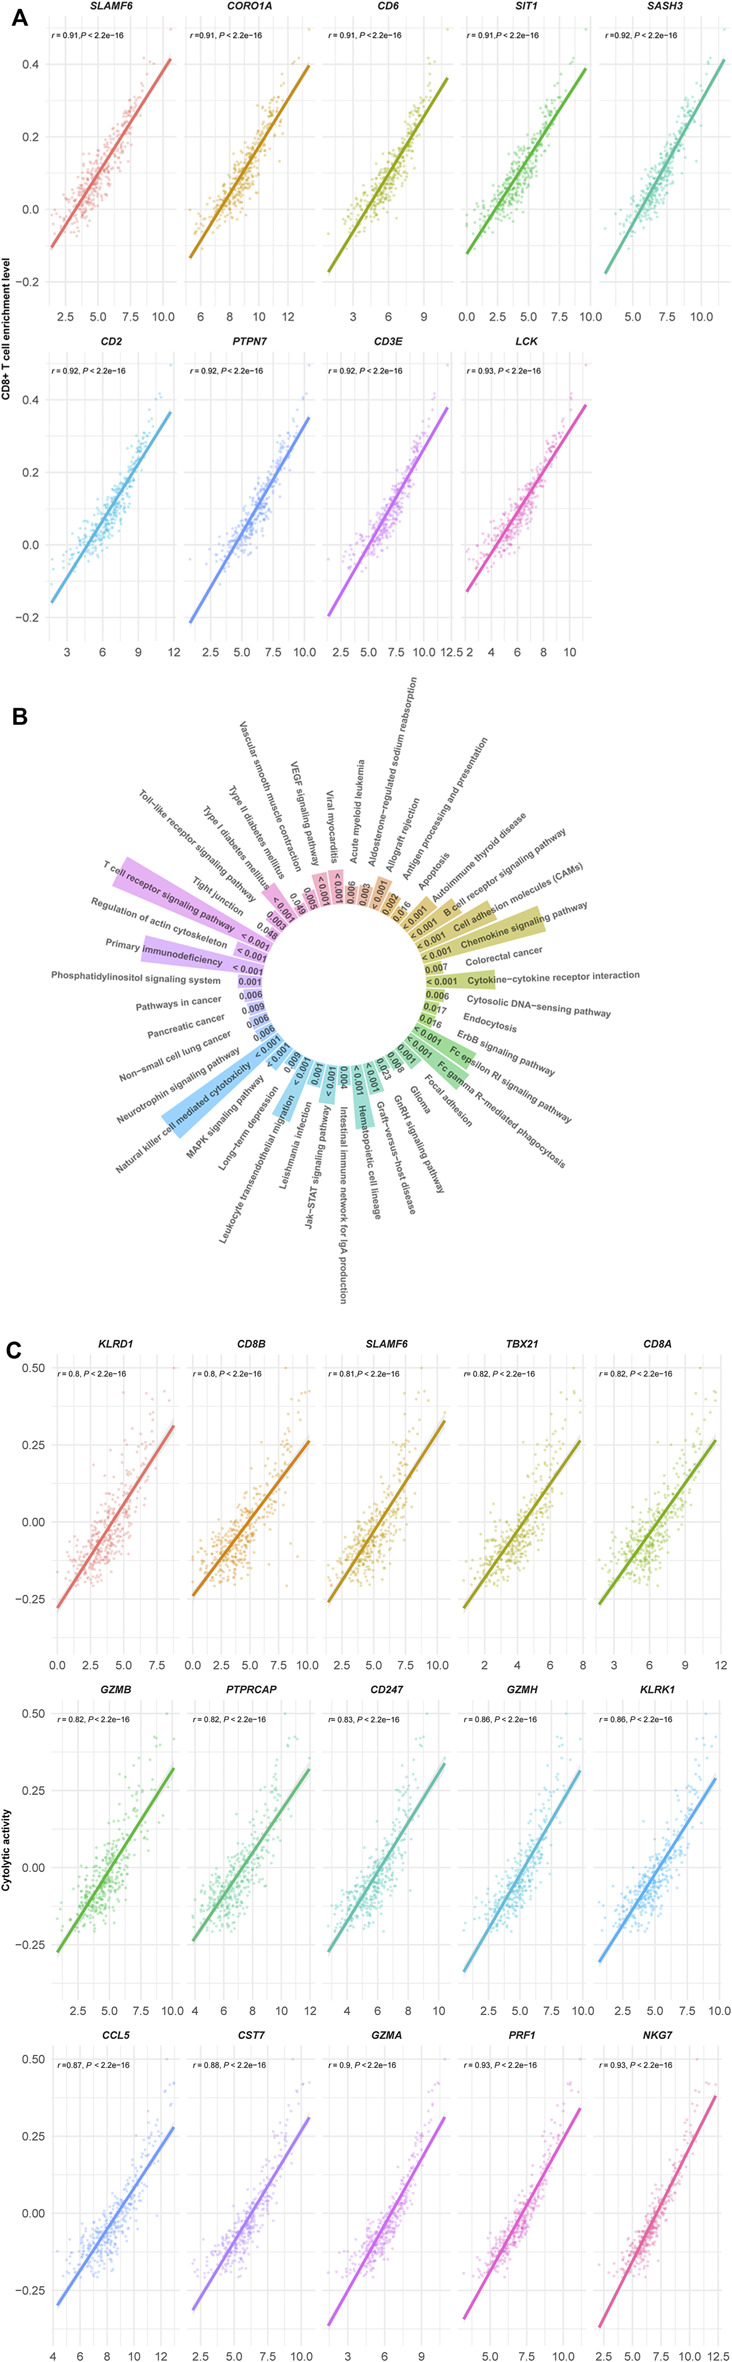
(Continued).
Identification of proteins whose expression correlates with antitumor immune responses in hepatocellular carcinoma
We found five proteins showing significant positive expression correlations with the enrichment levels of CD8+ T cells in HCC (r > 0.3) (Figure 3). These proteins included ATM, STAT5, Caspase-7, Syk, and Lck. There were six proteins whose expression correlated significantly and positively with cytolytic activity (r > 0.3) (Figure 3), including Syk, PREX1, p27, STAT5, Lck, and Caspase-7. Caspase-7 is involved in the regulation of apoptosis (Lamkanfi and Kanneganti, 2010) that is positively associated with antitumor immune responses (Jiang et al., 2019). PREX1 is a guanine nucleotide exchange factor for the RHO family of small GTP-binding proteins (RACs), which are involved in the modulation of antitumor immune responses (Li et al., 2020b). Lck is a key signaling molecule regulating T cell development, which is able to promote antitumor immune responses (Duan et al., 2021). p27 is a member of the family of KIP1 inhibitors, which plays a role in tumor suppression by inhibiting cell cycle and promoting apoptosis (Lloyd et al., 1999). Again, it is justified that p27 has a significant positive correlation with antitumor immune responses for its role in inciting apoptosis. Like p27, ATM also play a role in promoting apoptosis and suppressing tumor development (Pusapati et al., 2006). Syk is as well a tumor suppressor and play an important role in tumor immune regulation (Krisenko and Geahlen, 2015). STAT5 has also been shown to promote antitumor immunity (Ding et al., 2020).
FIGURE 3.

Proteins having significant expression correlations with CD8+ T cell enrichment, cytolytic activity, or PD-L1 expression in HCC (|r| > 0.3). The Pearson correlation coefficients (r) are shown.
We found four proteins whose expression had significant negative correlations with CD8+ T cell enrichment and/or cytolytic activity in HCC (r < −0.3), including IRS1, E-Cadherin, EPPK1, and β-Catenin (Figure 3). It indicates that the upregulation of these protein may inhibit antitumor immune responses in HCC. In fact, previous studies have demonstrated their oncogenic and antitumor immunosuppressive roles (Bouameur et al., 2014; Jinesh et al., 2017; Wang et al., 2020; Hong et al., 2021).
In addition, we found five proteins showing significant positive expression correlations with PD-L1 in HCC, including Syk, Lck, MEK1, STAT5, and Caspase-7 (r > 0.3) (Figure 3). Interestingly, four of the five proteins (Syk, Lck, STAT5, and Caspase-7) also had significant positive expression correlations with CD8+ T cell enrichment and cytolytic activity in HCC. Because both PD-L1 expression (Taube et al., 2014) and TIL abundance (Haanen, 2017) are positive predictors for the response to immune checkpoint inhibitors (ICIs), the upregulation of Syk, Lck, STAT5, and Caspase-7 could indicate a better immunotherapeutic response in HCC patients.
Identification of miRNAs whose expression correlates with antitumor immune responses in hepatocellular carcinoma
We found 47 and 20 miRNAs whose expression levels had significant positive correlations with CD8+ T cell enrichment and cytolytic activity in HCC, respectively (r > 0.3) (Figure 4). Among them, 19 miRNAs displayed significant positive expression correlations with both CD8+ T cell enrichment and cytolytic activity in HCC, including hsa-miR-6731-5p, 625-5p, 511-5p, 4772-5p, 1976, 181a-3p, 342-5p, 342-3p, 4491, 150-3p, 146a-5p, 625-3p, 155-3p, 4772-3p, 150-5p, 142-3p, 142-5p, 7702, 155-5p. Of note, hsa-miR-155-5p had the highest positive expression correlation with CD8+ T cell enrichment (r = 0.83) and with cytolytic activity (r = 0.64). This miRNA gene has been shown to be capable of boosting antitumor immune responses (Michaille et al., 2019), thus consistent with our results. The hsa-miR-142 genes hsa-miR-142-5p and hsa-miR-142-3p had the second and third highest positive expression correlations with CD8+ T cell enrichment in HCC (r = 0.79 and 0.78, respectively), and the third and fourth highest positive expression correlations with cytolytic activity (both r = 0.56). Previous studies have shown that hsa-miR-142 has a role in promoting antitumor immune responses (Jia et al., 2017; Berrien-Elliott et al., 2019), in line with our results. The miRNA gene hsa-miR-150-5p displayed significant positive expression correlations with both CD8+ T cell enrichment and cytolytic activity in HCC (r > 0.5). Again, this is consistent with previous reports showing that hsa-miR-150 has a strong association with antitumor immune responses (Enerly et al., 2011).
FIGURE 4.

MicroRNAs (miRNAs) having significant expression correlations with CD8+ T cell enrichment, cytolytic activity, or PD-L1 expression in HCC (|r| > 0.3). The Pearson correlation coefficients (r) are shown.
We found 20 miRNAs having significant expression correlations with PD-L1 in HCC (|r| > 0.3), with 18 positive and 2 negative correlations, respectively (Figure 4). Interestingly, 13 of the 18 miRNAs were also significantly and positively correlated with CD8+ T cell enrichment and cytolytic activity in HCC. These miRNAs included hsa-miR-511-5p, 150-3p, 342-3p, 181a-3p, 625-5p, 4772-3p, 155-3p, 142-5p, 142-3p, 155-5p, 625-3p, 1976, 7702. Again, these miRNAs could be potentially useful biomarkers for immunotherapeutic responses in HCC patients.
Identification of LncRNAs whose expression levels are associated with antitumor immune responses in hepatocellular carcinoma
LncRNAs have been shown to be important in immune regulation and antitumor immunity (Heward and Lindsay, 2014; Geng and Tan, 2016; Denaro et al., 2019). We identified 209 and 19 lncRNAs showing significant positive and negative expression correlations with the enrichment of CD8+ T cells in HCC, respectively (|r| > 0.3) (Supplementary Table S2). Among them, LINC01871 had the strongest expression correlation with CD8+ T cell enrichment (r = 0.78) and also the strongest expression correlation with cytolytic activity in HCC (r = 0.82) (Figure 5A). Further, we found 148 and 2 lncRNAs having significant positive and negative expression correlations with cytolytic activity in HCC, respectively (|r| > 0.3) (Supplementary Table S2). Among them, 131 lncRNAs also had significant positive expression correlations with the enrichment of CD8+ T cells in HCC, and 1 lncRNA (UGDH-AS1) showed a significant negative expression correlation with CD8+ T cell enrichment. Moreover, we found 197 and 12 lncRNAs whose expression was positively and negatively correlated with PD-L1 expression in HCC, respectively (|r| > 0.3) (Supplementary Table S2). 85 of the 197 lncRNAs also had significant positive expression correlations with CD8+ T cell enrichment and cytolytic activity in HCC (Figure 5B). Again, it indicates that these lncRNAs could be potentially useful biomarkers for immunotherapeutic responses in HCC patients.
FIGURE 5.

Long non-coding RNAs (lncRNAs) having significant expression correlations with CD8+ T cell enrichment, cytolytic activity, or PD-L1 expression in HCC (|r| > 0.3). (A) LINC01871 showing the strongest expression correlations with both CD8+ T cell enrichment and cytolytic activity in HCC. The Pearson correlation coefficients (r) and p-values are shown. (B) Heatmap showing 85 lncRNAs with significant positive expression correlations with CD8+ T cell enrichment, cytolytic activity, and PD-L1 expression in HCC (r > 0.3).
Identification of cancer-associated pathways correlated with antitumor immune responses in hepatocellular carcinoma
We identified 10 cancer-associated pathways whose enrichment was positively correlated with CD8+ T cell enrichment in HCC (Spearman correlation coefficient (ρ) > 0.3) (Figure 6A). These pathways included apoptosis, cytokine-cytokine receptor interaction, Jak-STAT signaling, MAPK signaling, VEGF signaling, PI3K-AKT signaling, HIF-1 signaling, ECM receptor interaction, focal adhesion, and estrogen signaling. In these pathways, apoptosis, cytokine-cytokine receptor interaction, and Jak-STAT signaling are immune relevant. The HIF-1 signaling pathway is upregulated in diverse cancers and may activate tumor‐associated immune signatures (Balamurugan, 2016). Moreover, a previous study (Jiang et al., 2019) showed that tumor glycolysis correlated positively with antitumor immune signatures in various cancers, supporting that the glycolysis-stimulating HIF-1 signaling correlated positively with antitumor immune responses in HCC. The positive correlation between the other pathways (focal adhesion, MAPK signaling, VEGF signaling, PI3K-AKT signaling, ECM receptor interaction, and estrogen signaling) and antitumor immune responses has been revealed in previous studies (Jiang et al., 2018; Lyu et al., 2019). In addition, we found 2 cancer-associated pathways whose enrichment was positively correlated with cytolytic activity in HCC (ρ > 0.3), including cytokine-cytokine receptor interaction and Jak-STAT signaling (Figure 6B). There were 13 pathways whose enrichment was significantly and positively correlated with PD-L1 expression (ρ > 0.3) (Figure 6C). These pathways included Jak-STAT signaling, HIF-1 signaling, apoptosis, cytokine-cytokine receptor interaction, mTOR signaling, PI3K-AKT signaling, MAPK signaling, estrogen signaling, focal adhesion, calcium signaling, ECM receptor interaction, adherens junction, and cAMP signaling. Interestingly, many of these pathways also had significant positive correlations with CD8+ T cell enrichment, such as apoptosis, cytokine-cytokine receptor interaction, Jak-STAT signaling, MAPK signaling, PI3K-AKT signaling, HIF-1 signaling, ECM receptor interaction, focal adhesion, and estrogen signaling. It indicates that these pathways’ upregulation could be associated with a better immunotherapeutic response in HCC patients.
FIGURE 6.

Cancer-associated pathways whose enrichment is significantly correlated with CD8+ T cell enrichment, cytolytic activity, or PD-L1 expression in HCC. The cancer-associated pathways having significant positive correlations of their enrichment with CD8+ T cell enrichment (A), cytolytic activity (B), and PD-L1 expression (C) in HCC (r > 0.3).
Associations of TMB and TALs with antitumor immune responses in hepatocellular carcinoma
TMB has been shown to have a positive association with antitumor immunity and immunotherapy response (Samstein et al., 2019). In contrast, TALs often have an inverse correlation with them (Davoli et al., 2017). We found that TALs had significant negative correlations with both CD8+ T cell enrichment and cytolytic activity in HCC (Spearman correlation, p < 0.03) (Figure 7), supporting previous findings (Davoli et al., 2017). However, we did not observe significant positive correlation between TMB and CD8+ T cell enrichment or cytolytic activity in HCC (p > 0.05) (Figure 7). It supports previous findings that the association between TMB and antitumor immunity is cancer type dependent (Wang and Li, 2019). Interestingly, we found that both TMB and TALs correlated negatively with PD-L1 expression in HCC (Figure 7). This analysis indicates that TMB could not be a good predictor for the response to anti-PD-1/PD-L1 immunotherapies. This indication conforms to a previous report that high TMB fails to predict the response to ICIs across all cancer types (McGrail et al., 2021).
FIGURE 7.
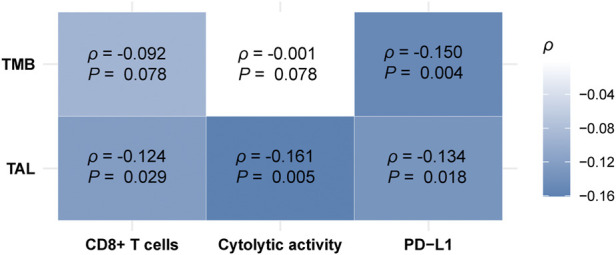
Correlations of tumor mutation burden (TMB) and tumor aneuploidy levels (TALs) with CD8+ T cell enrichment, cytolytic activity, and PD-L1 expression in HCC. Heatmap showing that TALs have significant negative correlations with CD8+ T cell enrichment, cytolytic activity, and PD-L1 expression, and TALs have a significant negative correlation with PD-L1 expression in HCC. The Spearman correlation coefficients (p) and p-values are shown.
Discussion
In this study, we identified numerous genes, miRNAs, lncRNAs, proteins, and pathways having mutation, expression, or enrichment correlations with antitumor immunity in HCC. We found several oncogenes or tumor suppressor genes whose mutations were associated with reduced antitumor immunity in HCC, including TTN, TP53, CTNNB1, RB1, and ZFHX4. Among them, TP53 and RB1 are famed tumor suppressor genes (Sherr and McCormick, 2002). Our analysis suggests that the loss of TP53 or RB1 function may result in antitumor immunosuppression in HCC, consistent with the findings shown in other cancers (Jiang et al., 2018; Xiao et al., 2018; Lyu et al., 2019). CTNNB1 is an oncogene whose hyperactivation is associated tumor progression in HCC (Rebouissou et al., 2016). Our analysis suggests that CTNNB1 mutations may inhibit antitumor immune responses and that the upregulation of the Wnt/β-catenin pathway can compromise antitumor immunity. To our best knowledge, for the first time, we uncovered that ZFHX4 mutations are associated with an immunosuppressive TME in HCC. This finding is noteworthy since ZFHX4 is frequently mutated in multiple cancer types (Sun et al., 2018) and the association between its mutations and antitumor immunity in other cancer types is worthy of investigation.
We found four proteins (Syk, Lck, STAT5, and Caspase-7) whose expression correlated positively with CD8+ T cell enrichment, cytolytic activity, and PD-L1 expression in HCC. It suggests that these proteins’ expression could be useful biomarkers for the response to ICIs since both PD-L1 expression (Taube et al., 2014) and TIL abundance (Haanen, 2017) are positively associated with the response to ICIs. Similiarly, we identified other types of biomarkers potentially useful for predicting the response to ICIs, including miRNAs (hsa-miR-511-5p, 150-3p, 342-3p, 181a-3p, 625-5p, 4772-3p, 155-3p, 142-5p, 142-3p, 155-5p, 625-3p, 1976, 7702), many lncRNAs, as well as pathways (apoptosis, cytokine-cytokine receptor interaction, Jak-STAT signaling, MAPK signaling, PI3K-AKT signaling, HIF-1 signaling, ECM receptor interaction, focal adhesion, and estrogen signaling).
PD-L1 is expressed on the surface of immune and cancer cells and inhibits proliferation and function of T cells by binding to its receptor PD-1 (Chen et al., 2019). PD-L1 expression is deemed to be a predictive biomarker for immunotherapeutic responses in cancer (Davis and Patel, 2019). Evidences have confirmed that some miRNAs can directly or indirectly regulate the expression of PD-L1. For example, miR-200 and miR-34a directly inhibit the PD-L1 expression in non-small cell lung cancer (NSCLC) (Chen et al., 2014; Cortez et al., 2016). In contrast, miR-20b, miR-21, and miR-130b have been associated with PTEN repression in colorectal cancer, which in turn promotes PD-L1 upregulation (Zhu et al., 2014). Additionally, there are some evidences showing that miRNA can regulate CTLA-4 and PD-1 to influence the antitumor immune responses (Romano and Kwong, 2018). Furthermore, some studies have shown that miRNAs are useful in predicting the response to ICIs. For example, Rajakumar et al. defined a 5-miRNA risk score which outperformed the tissue-based PD-L1 staining in predicting overall survival following immunotherapy in advanced NSCLC (Rajakumar et al., 2022). Fan et al. found that in NSCLC treated with anti-PD-1 antibody, miR-93, miR-138-5p, miR-200, miR-27a, miR-424, miR-34a, miR-28, miR-106b, miR-193a-3p, and miR-181a were significantly upregulated in responders versus non-responders (Fan et al., 2020). It indicates that the alterations in circulating miRNAs are associated with the response to ICIs. Although the application of miRNAs and lncRNAs in predicting the response to ICIs in HCC remains unclear, evidences have demonstrated that various miRNAs and lncRNAs are associated with the invasion, metastasis and chemosensitivity of HCC (Gupta et al., 2020). Meanwhile, the important role of miRNAs and lncRNAs in immune regulation and antitumor immunity indicates their potential in predicting the response to ICIs in HCC.
Thus, considering that current immunotherapies for HCC have achieved some but limited successes (Liu et al., 2021), these candidate biomarkers may provide important clinical values. However, further experimental and clinical investigations are must to validate the current findings.
Conclusion
This analysis uncovered various types of molecular features (genes, miRNAs, lncRNAs, proteins, and pathways) whose expression or mutations had significant correlations with HCC immunity. These molecular features could be predictive biomarkers for immunotherapeutic responses in HCC patients. They could also be potential intervention targets for boosting antitumor immunity and immunotherapeutic responses in HCC. Our data provide new insights into the tumor biology of HCC and potential clinical implications for the management of this disease.
Data availability statement
The original contributions presented in the study are included in the article/Supplementary Material, further inquiries can be directed to the corresponding author.
Author contributions
QS performed data analyses and visualization. YH performed data analyses and visualization. JQ performed data analyses and visualization. SL performed data analyses. XW conceived of the research, designed the methods, and wrote the manuscript. All the authors read and approved the final manuscript.
Funding
This work was supported by the China Pharmaceutical University (grant number 3150120001 to XW) and Natural Science Foundation of Zhejiang Province (grant number LY18C050003 to JQ).
Conflict of interest
The authors declare that the research was conducted in the absence of any commercial or financial relationships that could be construed as a potential conflict of interest.
Publisher’s note
All claims expressed in this article are solely those of the authors and do not necessarily represent those of their affiliated organizations, or those of the publisher, the editors and the reviewers. Any product that may be evaluated in this article, or claim that may be made by its manufacturer, is not guaranteed or endorsed by the publisher.
Supplementary material
The Supplementary Material for this article can be found online at: https://www.frontiersin.org/articles/10.3389/fmolb.2022.960457/full#supplementary-material
References
- Akyol A., Guner G., Ozseker H. S., Isik A., Atci O., Uzun S., et al. (2019). An immunohistochemical approach to detect oncogenic CTNNB1 mutations in primary neoplastic tissues. Lab. Invest. 99 (1), 128–137. 10.1038/s41374-018-0121-9 [DOI] [PubMed] [Google Scholar]
- Balamurugan K. (2016). HIF-1 at the crossroads of hypoxia, inflammation, and cancer. Int. J. Cancer 138 (5), 1058–1066. 10.1002/ijc.29519 [DOI] [PMC free article] [PubMed] [Google Scholar]
- Beer S., Simins A. B., Schuster A., Holzmann B. (2001). Molecular cloning and characterization of a novel SH3 protein (SLY) preferentially expressed in lymphoid cells. Biochim. Biophys. Acta 1520 (1), 89–93. 10.1016/s0167-4781(01)00242-1 [DOI] [PubMed] [Google Scholar]
- Benjamini Y., Hochberg Y. (1995). Controlling the false discovery rate: A practical and powerful approach to multiple testing. J. R. Stat. Soc. Ser. B 57, 289–300. 10.1111/j.2517-6161.1995.tb02031.x [DOI] [Google Scholar]
- Berrien-Elliott M. M., Sun Y., Neal C., Ireland A., Trissal M. C., Sullivan R. P., et al. (2019). MicroRNA-142 is critical for the homeostasis and function of type 1 innate lymphoid cells. Immunity 51 (3), 479–490. 10.1016/j.immuni.2019.06.016 [DOI] [PMC free article] [PubMed] [Google Scholar]
- Bouameur J. E., Favre B., Borradori L. (2014). Plakins, a versatile family of cytolinkers: Roles in skin integrity and in human diseases. J. Invest. Dermatol. 134 (4), 885–894. 10.1038/jid.2013.498 [DOI] [PubMed] [Google Scholar]
- Braun D. A., Burke K. P., Van Allen E. M. (2016). Genomic approaches to understanding response and resistance to immunotherapy. Clin. Cancer Res. 22 (23), 5642–5650. 10.1158/1078-0432.CCR-16-0066 [DOI] [PMC free article] [PubMed] [Google Scholar]
- Carter S. L., Cibulskis K., Helman E., McKenna A., Shen H., Zack T., et al. (2012). Absolute quantification of somatic DNA alterations in human cancer. Nat. Biotechnol. 30 (5), 413–421. 10.1038/nbt.2203 [DOI] [PMC free article] [PubMed] [Google Scholar]
- Chen L., Gibbons D. L., Goswami S., Cortez M. A., Ahn Y. H., Byers L. A., et al. (2014). Metastasis is regulated via microRNA-200/ZEB1 axis control of tumour cell PD-L1 expression and intratumoral immunosuppression. Nat. Commun. 5, 5241. 10.1038/ncomms6241 [DOI] [PMC free article] [PubMed] [Google Scholar]
- Chen S., Crabill G. A., Pritchard T. S., McMiller T. L., Wei P., Pardoll D. M., et al. (2019). Mechanisms regulating PD-L1 expression on tumor and immune cells. J. Immunother. Cancer 7 (1), 305. 10.1186/s40425-019-0770-2 [DOI] [PMC free article] [PubMed] [Google Scholar]
- Chetty R., Gatter K. (1994). CD3: Structure, function, and role of immunostaining in clinical practice. J. Pathol. 173 (4), 303–307. 10.1002/path.1711730404 [DOI] [PubMed] [Google Scholar]
- Cortez M. A., Ivan C., Valdecanas D., Wang X., Peltier H. J., Ye Y., et al. (2016). PDL1 Regulation by p53 via miR-34. J. Natl. Cancer Inst. 108 (1), djv303. 10.1093/jnci/djv303 [DOI] [PMC free article] [PubMed] [Google Scholar]
- Davis A. A., Patel V. G. (2019). The role of PD-L1 expression as a predictive biomarker: An analysis of all US food and drug administration (FDA) approvals of immune checkpoint inhibitors. J. Immunother. Cancer 7 (1), 278. 10.1186/s40425-019-0768-9 [DOI] [PMC free article] [PubMed] [Google Scholar]
- Davoli T., Uno H., Wooten E. C., Elledge S. J. (2017). Tumor aneuploidy correlates with markers of immune evasion and with reduced response to immunotherapy. Science 355 (6322), eaaf8399. 10.1126/science.aaf8399 [DOI] [PMC free article] [PubMed] [Google Scholar]
- Denaro N., Merlano M. C., Lo Nigro C. (2019). Long noncoding RNAs as regulators of cancer immunity. Mol. Oncol. 13 (1), 61–73. 10.1002/1878-0261.12413 [DOI] [PMC free article] [PubMed] [Google Scholar]
- Ding Z. C., Shi H., Aboelella N. S., Fesenkova K., Park E. J., Liu Z., et al. (2020). Persistent STAT5 activation reprograms the epigenetic landscape in CD4(+) T cells to drive polyfunctionality and antitumor immunity. Sci. Immunol. 5 (52), eaba5962. 10.1126/sciimmunol.aba5962 [DOI] [PMC free article] [PubMed] [Google Scholar]
- Dragovich M. A., Adam K., Strazza M., Tocheva A. S., Peled M., Mor A. (2019). SLAMF6 clustering is required to augment T cell activation. PLoS One 14 (6), e0218109. 10.1371/journal.pone.0218109 [DOI] [PMC free article] [PubMed] [Google Scholar]
- Duan H., Jing L., Jiang X., Ma Y., Wang D., Xiang J., et al. (2021). CD146 bound to LCK promotes T cell receptor signaling and antitumor immune responses in mice. J. Clin. Invest. 131 (21), e148568. 10.1172/JCI148568 [DOI] [PMC free article] [PubMed] [Google Scholar]
- Enerly E., Steinfeld I., Kleivi K., Leivonen S. K., Aure M. R., Russnes H. G., et al. (2011). miRNA-mRNA integrated analysis reveals roles for miRNAs in primary breast tumors. PLoS One 6 (2), e16915. 10.1371/journal.pone.0016915 [DOI] [PMC free article] [PubMed] [Google Scholar]
- Fan J., Yin Z., Xu J., Wu F., Huang Q., Yang L., et al. (2020). Circulating microRNAs predict the response to anti-PD-1 therapy in non-small cell lung cancer. Genomics 112 (2), 2063–2071. 10.1016/j.ygeno.2019.11.019 [DOI] [PubMed] [Google Scholar]
- Farha M., Jairath N. K., Lawrence T. S., El Naqa I. (2020). Characterization of the tumor immune microenvironment identifies M0 macrophage-enriched cluster as a poor prognostic factor in hepatocellular carcinoma. JCO Clin. Cancer Inf. 4, 1002–1013. 10.1200/CCI.20.00077 [DOI] [PMC free article] [PubMed] [Google Scholar]
- Fattet S., Haberler C., Legoix P., Varlet P., Lellouch-Tubiana A., Lair S., et al. (2009). Beta-catenin status in paediatric medulloblastomas: Correlation of immunohistochemical expression with mutational status, genetic profiles, and clinical characteristics. J. Pathol. 218 (1), 86–94. 10.1002/path.2514 [DOI] [PubMed] [Google Scholar]
- Gao X., Huang H., Wang Y., Pan C., Yin S., Zhou L., et al. (2020). Tumor immune microenvironment characterization in hepatocellular carcinoma identifies four prognostic and immunotherapeutically relevant subclasses. Front. Oncol. 10, 610513. 10.3389/fonc.2020.610513 [DOI] [PMC free article] [PubMed] [Google Scholar]
- Geng H., Tan X. D. (2016). Functional diversity of long non-coding RNAs in immune regulation. Genes Dis. 3 (1), 72–81. 10.1016/j.gendis.2016.01.004 [DOI] [PMC free article] [PubMed] [Google Scholar]
- Goodman A. M., Kato S., Bazhenova L., Patel S. P., Frampton G. M., Miller V., et al. (2017). Tumor mutational burden as an independent predictor of response to immunotherapy in diverse cancers. Mol. Cancer Ther. 16 (11), 2598–2608. 10.1158/1535-7163.MCT-17-0386 [DOI] [PMC free article] [PubMed] [Google Scholar]
- Gupta M., Chandan K., Sarwat M. (2020). Role of microRNA and long non-coding RNA in hepatocellular carcinoma. Curr. Pharm. Des. 26 (4), 415–428. 10.2174/1381612826666200115093835 [DOI] [PMC free article] [PubMed] [Google Scholar]
- Haanen J. (2017). Converting cold into hot tumors by combining immunotherapies. Cell 170 (6), 1055–1056. 10.1016/j.cell.2017.08.031 [DOI] [PubMed] [Google Scholar]
- Hanzelmann S., Castelo R., Guinney J. (2013). Gsva: Gene set variation analysis for microarray and RNA-seq data. BMC Bioinforma. 14, 7. 10.1186/1471-2105-14-7 [DOI] [PMC free article] [PubMed] [Google Scholar]
- He S., Tang S. (2020). WNT/β-catenin signaling in the development of liver cancers. Biomed. Pharmacother. 132, 110851. 10.1016/j.biopha.2020.110851 [DOI] [PubMed] [Google Scholar]
- Heward J. A., Lindsay M. A. (2014). Long non-coding RNAs in the regulation of the immune response. Trends Immunol. 35 (9), 408–419. 10.1016/j.it.2014.07.005 [DOI] [PMC free article] [PubMed] [Google Scholar]
- Hong L., Pu X., Gan H., Weng L., Zheng Q. (2021). YTHDF2 inhibit the tumorigenicity of endometrial cancer via downregulating the expression of IRS1 methylated with m(6)A. J. Cancer 12 (13), 3809–3818. 10.7150/jca.54527 [DOI] [PMC free article] [PubMed] [Google Scholar]
- Ikeda S., Okamoto T., Okano S., Umemoto Y., Tagawa T., Morodomi Y., et al. (2016). PD-L1 is upregulated by simultaneous amplification of the PD-L1 and JAK2 genes in non-small cell lung cancer. J. Thorac. Oncol. 11 (1), 62–71. 10.1016/j.jtho.2015.09.010 [DOI] [PubMed] [Google Scholar]
- Jia L., Xi Q., Wang H., Zhang Z., Liu H., Cheng Y., et al. (2017). miR-142-5p regulates tumor cell PD-L1 expression and enhances anti-tumor immunity. Biochem. Biophys. Res. Commun. 488 (2), 425–431. 10.1016/j.bbrc.2017.05.074 [DOI] [PubMed] [Google Scholar]
- Jiang Z., Liu Z., Chen C., Wang X. (2018). Immunogenomics analysis reveals that TP53 mutations inhibit tumor immunity in gastric cancer. Transl. Oncol. 11 (5), 1171–1187. 10.1016/j.tranon.2018.07.012 [DOI] [PMC free article] [PubMed] [Google Scholar]
- Jiang Z., Liu Z., Li M., Chen C., Wang X. (2019). Increased glycolysis correlates with elevated immune activity in tumor immune microenvironment. EBioMedicine 42, 431–442. 10.1016/j.ebiom.2019.03.068 [DOI] [PMC free article] [PubMed] [Google Scholar]
- Jinesh G. G., Manyam G. C., Mmeje C. O., Baggerly K. A., Kamat A. M. (2017). Surface PD-L1, E-cadherin, CD24, and VEGFR2 as markers of epithelial cancer stem cells associated with rapid tumorigenesis. Sci. Rep. 7 (1), 9602. 10.1038/s41598-017-08796-z [DOI] [PMC free article] [PubMed] [Google Scholar]
- Kalasekar S. M., Kotiyal S., Conley C., Phan C., Young A., Evason K. J. (2019). Heterogeneous beta-catenin activation is sufficient to cause hepatocellular carcinoma in zebrafish. Biol. Open 8 (10), bio047829. 10.1242/bio.047829 [DOI] [PMC free article] [PubMed] [Google Scholar]
- Kanehisa M., Furumichi M., Tanabe M., Sato Y., Morishima K. (2017). Kegg: New perspectives on genomes, pathways, diseases and drugs. Nucleic Acids Res. 45 (1), D353–D361. 10.1093/nar/gkw1092 [DOI] [PMC free article] [PubMed] [Google Scholar]
- Krisenko M. O., Geahlen R. L. (2015). Calling in SYK: SYK's dual role as a tumor promoter and tumor suppressor in cancer. Biochim. Biophys. Acta 1853 (1), 254–263. 10.1016/j.bbamcr.2014.10.022 [DOI] [PMC free article] [PubMed] [Google Scholar]
- Lamkanfi M., Kanneganti T. D. (2010). Caspase-7: A protease involved in apoptosis and inflammation. Int. J. Biochem. Cell Biol. 42 (1), 21–24. 10.1016/j.biocel.2009.09.013 [DOI] [PMC free article] [PubMed] [Google Scholar]
- Le D. T., Uram J. N., Wang H., Bartlett B. R., Kemberling H., Eyring A. D., et al. (2015). PD-1 blockade in tumors with mismatch-repair deficiency. N. Engl. J. Med. 372 (26), 2509–2520. 10.1056/NEJMoa1500596 [DOI] [PMC free article] [PubMed] [Google Scholar]
- Lewinsky H., Barak A. F., Huber V., Kramer M. P., Radomir L., Sever L., et al. (2018). CD84 regulates PD-1/PD-L1 expression and function in chronic lymphocytic leukemia. J. Clin. Invest. 128 (12), 5465–5478. 10.1172/JCI96610 [DOI] [PMC free article] [PubMed] [Google Scholar]
- Li C. M., Kim C. E., Margolin A. A., Guo M., Zhu J., Mason J. M., et al. (2004). CTNNB1 mutations and overexpression of Wnt/beta-catenin target genes in WT1-mutant Wilms' tumors. Am. J. Pathol. 165 (6), 1943–1953. 10.1016/s0002-9440(10)63246-4 [DOI] [PMC free article] [PubMed] [Google Scholar]
- Li L., Li M. Y., Wang X. S. (2020). Cancer type-dependent correlations between TP53 mutations and antitumor immunity. DNA Repair 88, 102785. 10.1016/j.dnarep.2020.102785 [DOI] [PubMed] [Google Scholar]
- Li M., Ma Y., Zhong Y., Liu Q., Chen C., Qiang L., et al. (2020). KALRN mutations promote antitumor immunity and immunotherapy response in cancer. J. Immunother. Cancer 8 (2), e000293. 10.1136/jitc-2019-000293 [DOI] [PMC free article] [PubMed] [Google Scholar]
- Liu Y., Patel L., Mills G. B., Lu K. H., Sood A. K., Ding L., et al. (2014). Clinical significance of CTNNB1 mutation and Wnt pathway activation in endometrioid endometrial carcinoma. J. Natl. Cancer Inst. 106 (9), dju245. 10.1093/jnci/dju245 [DOI] [PMC free article] [PubMed] [Google Scholar]
- Liu Z., Liu X., Liang J., Liu Y., Hou X., Zhang M., et al. (2021). Immunotherapy for hepatocellular carcinoma: Current status and future prospects. Front. Immunol. 12, 765101. 10.3389/fimmu.2021.765101 [DOI] [PMC free article] [PubMed] [Google Scholar]
- Llovet J. M., Kelley R. K., Villanueva A., Singal A. G., Pikarsky E., Roayaie S., et al. (2021). Hepatocellular carcinoma. Nat. Rev. Dis. Prim. 7 (1), 6. 10.1038/s41572-020-00240-3 [DOI] [PubMed] [Google Scholar]
- Lloyd R. V., Erickson L. A., Jin L., Kulig E., Qian X., Cheville J. C., et al. (1999). p27kip1: a multifunctional cyclin-dependent kinase inhibitor with prognostic significance in human cancers. Am. J. Pathol. 154 (2), 313–323. 10.1016/S0002-9440(10)65277-7 [DOI] [PMC free article] [PubMed] [Google Scholar]
- Lyu H., Li M., Jiang Z., Liu Z., Wang X. (2019). Correlate the TP53 mutation and the HRAS mutation with immune signatures in head and neck squamous cell cancer. Comput. Struct. Biotechnol. J. 17, 1020–1030. 10.1016/j.csbj.2019.07.009 [DOI] [PMC free article] [PubMed] [Google Scholar]
- Manzano R. G., Catalan-Latorre A., Brugarolas A. (2021). RB1 and TP53 co-mutations correlate strongly with genomic biomarkers of response to immunity checkpoint inhibitors in urothelial bladder cancer. BMC Cancer 21 (1), 432. 10.1186/s12885-021-08078-y [DOI] [PMC free article] [PubMed] [Google Scholar]
- Marie-Cardine A., Bruyns E., Shevchenko A., Mann M., Autschbach F., Ratnofsky S., et al. (1999). SHP2-interacting transmembrane adaptor protein (SIT), a novel disulfide-linked dimer regulating human T cell activation. J. Exp. Med. 189 (8), 1181–1194. 10.1084/jem.189.8.1181 [DOI] [PMC free article] [PubMed] [Google Scholar]
- McGrail D. J., Pilie P. G., Rashid N. U., Voorwerk L., Slagter M., Kok M., et al. (2021). High tumor mutation burden fails to predict immune checkpoint blockade response across all cancer types. Ann. Oncol. 32 (5), 661–672. 10.1016/j.annonc.2021.02.006 [DOI] [PMC free article] [PubMed] [Google Scholar]
- Michaille J. J., Awad H., Fortman E. C., Efanov A. A., Tili E. (2019). miR-155 expression in antitumor immunity: The higher the better? Genes Chromosom. Cancer 58 (4), 208–218. 10.1002/gcc.22698 [DOI] [PubMed] [Google Scholar]
- Mueller P., Massner J., Jayachandran R., Combaluzier B., Albrecht I., Gatfield J., et al. (2008). Regulation of T cell survival through coronin-1-mediated generation of inositol-1, 4, 5-trisphosphate and calcium mobilization after T cell receptor triggering. Nat. Immunol. 9 (4), 424–431. 10.1038/ni1570 [DOI] [PubMed] [Google Scholar]
- Murciano-Goroff Y. R., Warner A. B., Wolchok J. D. (2020). The future of cancer immunotherapy: Microenvironment-targeting combinations. Cell Res. 30 (6), 507–519. 10.1038/s41422-020-0337-2 [DOI] [PMC free article] [PubMed] [Google Scholar]
- Pai S. G., Carneiro B. A., Mota J. M., Costa R., Leite C. A., Barroso-Sousa R., et al. (2017). Wnt/beta-catenin pathway: Modulating anticancer immune response. J. Hematol. Oncol. 10 (1), 101. 10.1186/s13045-017-0471-6 [DOI] [PMC free article] [PubMed] [Google Scholar]
- Palacios E. H., Weiss A. (2004). Function of the src-family kinases, Lck and fyn, in T-cell development and activation. Oncogene 23 (48), 7990–8000. 10.1038/sj.onc.1208074 [DOI] [PubMed] [Google Scholar]
- Pusapati R. V., Rounbehler R. J., Hong S., Powers J. T., Yan M., Kiguchi K., et al. (2006). ATM promotes apoptosis and suppresses tumorigenesis in response to Myc. Proc. Natl. Acad. Sci. U. S. A. 103 (5), 1446–1451. 10.1073/pnas.0507367103 [DOI] [PMC free article] [PubMed] [Google Scholar]
- Rajakumar T., Horos R., Jehn J., Schenz J., Muley T., Pelea O., et al. (2022). A blood-based miRNA signature with prognostic value for overall survival in advanced stage non-small cell lung cancer treated with immunotherapy. NPJ Precis. Oncol. 6 (1), 19. 10.1038/s41698-022-00262-y [DOI] [PMC free article] [PubMed] [Google Scholar]
- Rebouissou S., Franconi A., Calderaro J., Letouze E., Imbeaud S., Pilati C., et al. (2016). Genotype-phenotype correlation of CTNNB1 mutations reveals different ß-catenin activity associated with liver tumor progression. Hepatology 64 (6), 2047–2061. 10.1002/hep.28638 [DOI] [PubMed] [Google Scholar]
- Romano G., Kwong L. N. (2018). Diagnostic and therapeutic applications of miRNA-based strategies to cancer immunotherapy. Cancer Metastasis Rev. 37 (1), 45–53. 10.1007/s10555-017-9716-7 [DOI] [PubMed] [Google Scholar]
- Samstein R. M., Lee C. H., Shoushtari A. N., Hellmann M. D., Shen R., Janjigian Y. Y., et al. (2019). Tumor mutational load predicts survival after immunotherapy across multiple cancer types. Nat. Genet. 51 (2), 202–206. 10.1038/s41588-018-0312-8 [DOI] [PMC free article] [PubMed] [Google Scholar]
- Santos R. F., Oliveira L., Carmo A. M. (2016). Tuning T cell activation: The function of CD6 at the immunological synapse and in T cell responses. Curr. Drug Targets 17 (6), 630–639. 10.2174/1389450116666150531152439 [DOI] [PubMed] [Google Scholar]
- Sherr C. J., McCormick F. (2002). The RB and p53 pathways in cancer. Cancer Cell 2 (2), 103–112. 10.1016/s1535-6108(02)00102-2 [DOI] [PubMed] [Google Scholar]
- Sia D., Jiao Y., Martinez-Quetglas I., Kuchuk O., Villacorta-Martin C., Castro de Moura M., et al. (2017). Identification of an immune-specific class of hepatocellular carcinoma, based on molecular features. Gastroenterology 153 (3), 812–826. 10.1053/j.gastro.2017.06.007 [DOI] [PMC free article] [PubMed] [Google Scholar]
- Stanford S. M., Rapini N., Bottini N. (2012). Regulation of TCR signalling by tyrosine phosphatases: From immune homeostasis to autoimmunity. Immunology 137 (1), 1–19. 10.1111/j.1365-2567.2012.03591.x [DOI] [PMC free article] [PubMed] [Google Scholar]
- Subramanian A., Tamayo P., Mootha V. K., Mukherjee S., Ebert B. L., Gillette M. A., et al. (2005). Gene set enrichment analysis: A knowledge-based approach for interpreting genome-wide expression profiles. Proc. Natl. Acad. Sci. U. S. A. 102 (43), 15545–15550. 10.1073/pnas.0506580102 [DOI] [PMC free article] [PubMed] [Google Scholar]
- Sun Q., Li M., Wang X. (2018). The cancer omics atlas: An integrative resource for cancer omics annotations. BMC Med. Genomics 11 (1), 63. 10.1186/s12920-018-0381-7 [DOI] [PMC free article] [PubMed] [Google Scholar]
- Taube J. M., Klein A., Brahmer J. R., Xu H., Pan X., Kim J. H., et al. (2014). Association of PD-1, PD-1 ligands, and other features of the tumor immune microenvironment with response to anti-PD-1 therapy. Clin. Cancer Res. 20 (19), 5064–5074. 10.1158/1078-0432.CCR-13-3271 [DOI] [PMC free article] [PubMed] [Google Scholar]
- Villanueva A. (2019). Hepatocellular carcinoma. N. Engl. J. Med. 380 (15), 1450–1462. 10.1056/NEJMra1713263 [DOI] [PubMed] [Google Scholar]
- Wang C., Yan J., Gui L., Ji L., Ma B., Yin P., et al. (2020). β-Catenin inhibition shapes tumor immunity and synergizes with immunotherapy in colorectal cancer. Oncoimmunology 9 (1), 1809947. 10.1080/2162402X.2020.1809947 [DOI] [PMC free article] [PubMed] [Google Scholar]
- Wang X., Li M. (2019). Correlate tumor mutation burden with immune signatures in human cancers. BMC Immunol. 20 (1), 4. 10.1186/s12865-018-0285-5 [DOI] [PMC free article] [PubMed] [Google Scholar]
- Wang X., Sun Q. (2017). TP53 mutations, expression and interaction networks in human cancers. Oncotarget 8 (1), 624–643. 10.18632/oncotarget.13483 [DOI] [PMC free article] [PubMed] [Google Scholar]
- Xiao W., Du N., Huang T., Guo J., Mo X., Yuan T., et al. (2018). TP53 mutation as potential negative predictor for response of anti-CTLA-4 therapy in metastatic melanoma. EBioMedicine 32, 119–124. 10.1016/j.ebiom.2018.05.019 [DOI] [PMC free article] [PubMed] [Google Scholar]
- Yau T., Kang Y. K., Kim T. Y., El-Khoueiry A. B., Santoro A., Sangro B., et al. (2020). Efficacy and safety of nivolumab plus ipilimumab in patients with advanced hepatocellular carcinoma previously treated with sorafenib: The CheckMate 040 randomized clinical trial. JAMA Oncol. 6 (11), e204564. 10.1001/jamaoncol.2020.4564 [DOI] [PMC free article] [PubMed] [Google Scholar]
- Zhou C., Jin H., Li W., Zhao R., Chen C. (2021). CTNNB1 S37C mutation causing cells proliferation and migration coupled with molecular mechanisms in lung adenocarcinoma. Ann. Transl. Med. 9 (8), 681. 10.21037/atm-21-1146 [DOI] [PMC free article] [PubMed] [Google Scholar]
- Zhu J., Chen L., Zou L., Yang P., Wu R., Mao Y., et al. (2014). MiR-20b, -21, and -130b inhibit PTEN expression resulting in B7-H1 over-expression in advanced colorectal cancer. Hum. Immunol. 75 (4), 348–353. 10.1016/j.humimm.2014.01.006 [DOI] [PubMed] [Google Scholar]
- Zurli V., Montecchi T., Heilig R., Poschke I., Volkmar M., Wimmer G., et al. (2020). Phosphoproteomics of CD2 signaling reveals AMPK-dependent regulation of lytic granule polarization in cytotoxic T cells. Sci. Signal. 13 (631), eaaz1965. 10.1126/scisignal.aaz1965 [DOI] [PubMed] [Google Scholar]
Associated Data
This section collects any data citations, data availability statements, or supplementary materials included in this article.
Supplementary Materials
Data Availability Statement
The original contributions presented in the study are included in the article/Supplementary Material, further inquiries can be directed to the corresponding author.