

Abstract
Muscle fatigue is common among humans and also a crucial indicator of many muscular diseases such as muscular dystrophy and disorders. Timely evaluation of muscle fatigue, hence, is important to track disease progress and avoid disease exacerbations. However, convenient tools for evaluating muscle fatigue out of clinic are still missing. In this paper, we present a new technique that uses commodity smartphones to evaluate muscle fatigue through simple and daily muscle exercises. The basic idea of our technique is to mimic an active sonar system with the smartphone’s built-in microphone and speaker, and use this sonar system to evaluate muscle fatigue from the muscle’s surface characteristics that can be measured from the transmitted acoustic signal. More specifically, our technique first measures the acoustic channel disturbances caused by fatigue-induced muscle tremor via channel estimation, and then derives quantitative fatigue levels from the variation of acoustic channel estimation. By using the arm bicep muscle as our primary target, we designed the exercise protocol and implemented a smartphone app for fatigue evaluation. Experiment results verified that our technique can precisely evaluate the speed of muscle fatigue accumulation, as well as identifying the actual fatigue occurrence. This technique, hence, could be used in practical home settings for effective fatigue evaluation on a daily basis.
1. Introduction
Muscles are essential to humans since they are responsible for body mobility and posture maintenance. The overuse of muscle may cause feelings of soreness, trembling, and cramping, which are major symptoms of muscle fatigue. Muscle fatigability measures how fast and easily the muscle gets fatigued, and is crucial for diagnosing many muscular diseases such as muscular disorders and dystrophy that influence 1 in every 3500 males but has no cure so far (Muscular dystrophy statistics; Angelini & Tasca, 2012). During clinical visits, the muscle fatigability can be evaluated by lactic acid accumulation using a blood test (Sahlin, 1986) or myoelectric signals using electromyography (EMG) (Cifrek et al., 2009), but frequent daily evaluation of muscle fatigue out of clinic is usually preferred in most of muscular disease diagnosis for long-term tracking of disease progress and medication efficacy (Ciafaloni et al., 2009). Unfortunately, effective methods for such out-of-clinic evaluation are currently missing, and patients instead are only asked to self report their feelings of fatigue by completing certain questionnaires (Christodoulou, 2005, pp. 19–35). This method is quite inaccurate because different individuals may have subjective definitions of fatigue feeling, which makes the evaluation of muscle fatigue unreliable. The key to accurate evaluation, on the other hand, calls for an objective biomarker that reliably indicates the fatigue level under normal daily circumstances out of clinic.
To address this challenge, in this paper we present a new technique that uses commodity smartphones for objective muscle evaluation out of clinic. This technique is built on the physiological fact that human muscles will unconsciously tremble or shake when getting fatigued and such tremor proportionates to the level of muscle fatigue (Lippold, 1981). Since this muscle tremor can produce shape changes on the muscle surface, we could measure the muscle fatigue from such changes which affect the acoustic signal being transmitted between the smartphone’s built-in speaker and microphone, as shown in Fig. 1. More specifically, the smartphone transmits acoustic signals towards the muscle piece being monitored and receives reflected signals by its microphone. This signal flight path forms a propagation channel, in which any physical change of the nearby muscle objects disturb the channel and can hence be captured from the channel estimation.
Fig. 1.
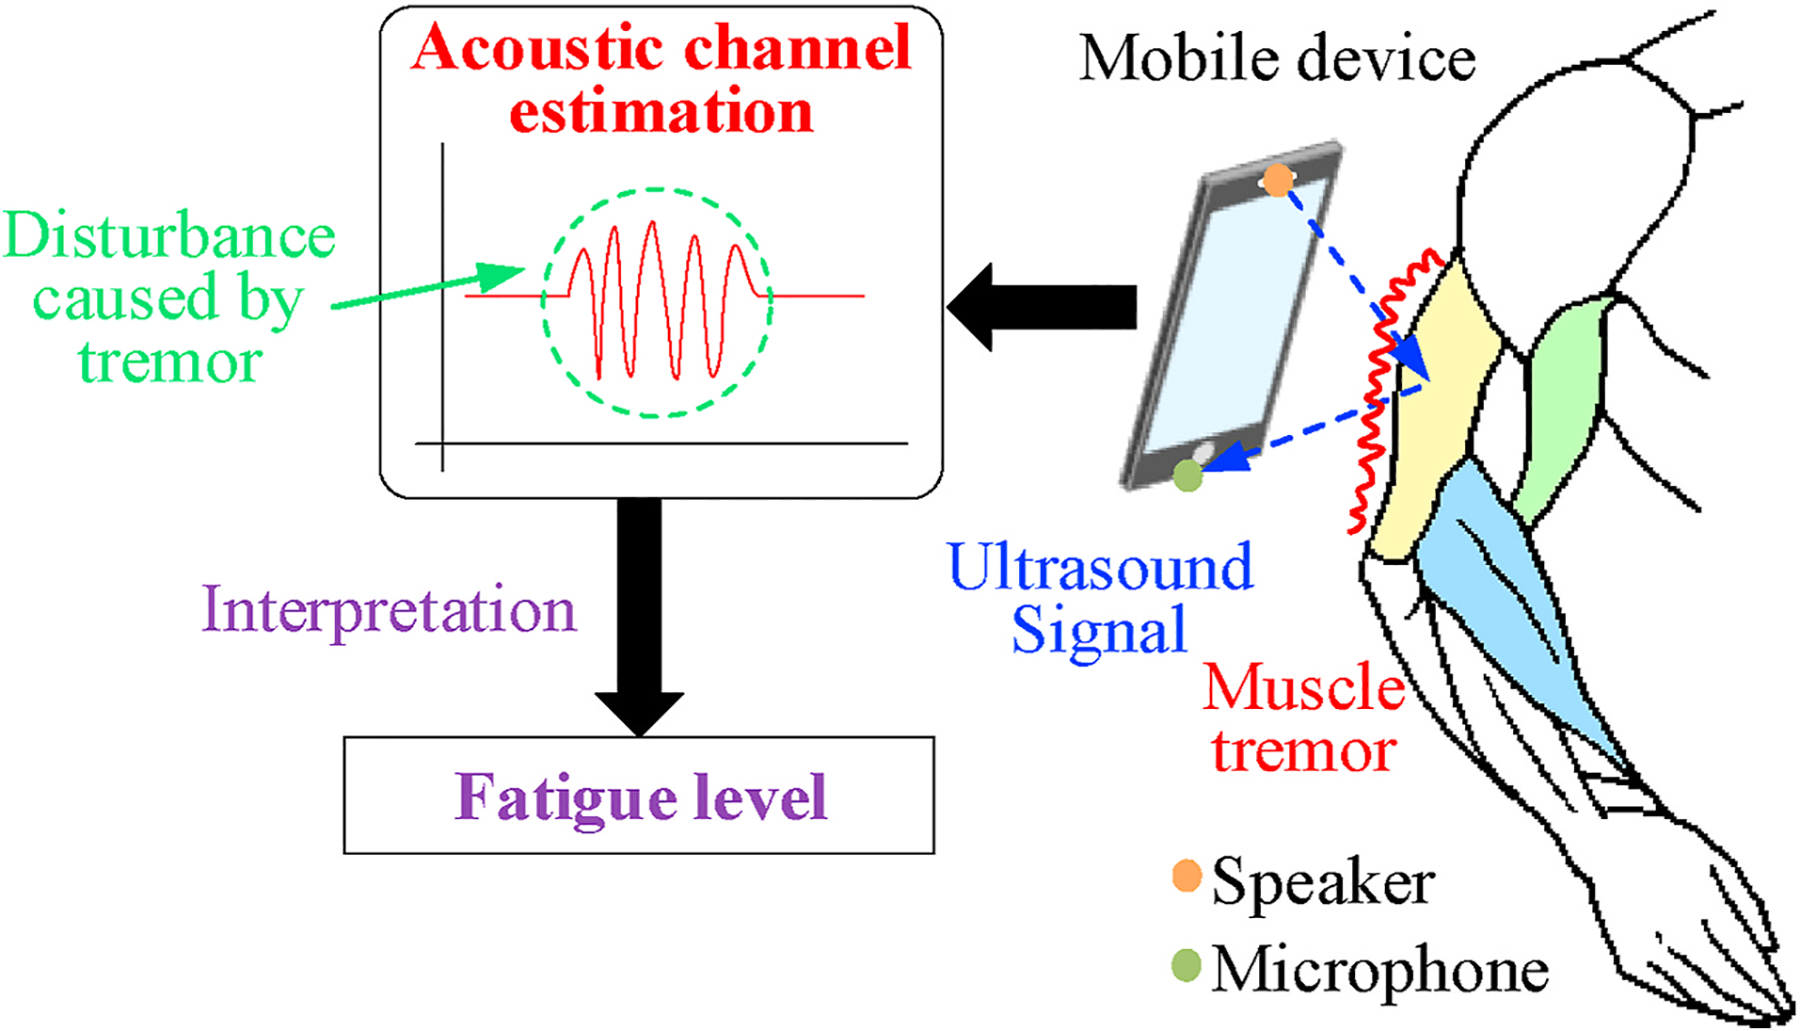
Our technique measuring channel disturbance caused by muscle tremor.
In practice, to ensure the accuracy and reliability of evaluating muscle fatigue, our design aims to address the following three technical challenges:
As the built-in speakers of commodity smartphones are usually omnidirectional, the transmitted acoustic channel is significantly affected by the motions of other parts of the human body (e.g., head and hands).
We need to appropriately interpret the disturbances on the acoustic channel into quantified levels of muscle fatigue, so that we have numerical metrics of fatigue level for fatigability analysis.
We lack quantifiable ground truth of muscle fatigue, and we must find ways to prove that our measurements are consistent with fatigue practices.
To exclude signal reflections from irrelevant body chunks and ensure that only channel disturbances caused by the muscle tremor are being measured, we modulate the transmitted signal with a pre-defined codeword, so that we can differentiate reflections from objects located at different distances. In this way, the entire channel estimations can be divided into results at different distance ranges. Then, we only need to extract the signal characteristics related to the actual location of the muscle.
Furthermore, we interpret channel disturbances into fatigue using the variations of channel estimation during the time that the muscle generates force and trembles. Multiple features from the estimated channel response are chosen to represent such variation and they will then serve as quantitative biomarkers of the fatigue level. When we analyze the change of fatigue level over a group of muscle efforts, though with no ground truth to compare, we can demonstrate the effectiveness of such evaluation from two aspects. 1) Our evaluation can reflect the speed of fatigue accumulation during bicep workouts with different weights. 2) Our evaluation can detect the occurrence of fatigue and demonstrate the consistency when the subject has initial muscle tiredness.
By addressing these challenges, our technique has several important characteristics. First, it is completely contactless and non-invasive, and its operation does not require any professional training or guidance. Hence, it could be easily operated by the patients themselves out of clinic on a daily basis. Second, it is highly adaptive and capable of efficiently removing the impact of different environmental factors and human dynamics. Third, it builds on commodity smartphones and does not require any extra hardware. Based on these characteristics, our technique is fully capable of being applied to various practical scenarios for daily evaluation of muscle fatigue and muscular disease diagnosis.
By collaborating with orthopaedic doctors, we devised a protocol of monitoring biceps brachii fatigue. The protocol is instructed by a fully automated smartphone app with voice guidance. We conducted experiments over five student volunteers with more than 200 groups of workouts in total. 70% of the data can exhibit the expected results and consistency of fatigue evaluation. Our preliminary exploration of the technique paves the way for further clinical investigation and validation, which could be a potentially beneficial tool for patients with muscle myopathy and disorders.
2. Background and motivation
Before introducing our technical design, we first describe the clinical background of muscle fatigue, including the basic mechanism of human muscular system and how the fatigue correlates to muscle tremor that motivates our technique.
2.1. The human muscular system
The basic component of human muscular system is the motor unit (MU), which consists of motor neuron and muscle fibers. As shown in Fig. 2 (Sa-Ngiamsak), the motor neurons lie in the neuron pool located at spinal cord and each of them controls and innervates a set of muscle fibers. The muscle fibers constitute different types of muscle all over the human body and they are connected to a specific motor neuron by muscle nerve. The communication between the motor neuron and muscle fibers is achieved by myoelectric signals, which is also the principle of clinical EMG diagnosis (Gandevia, 2001). The number of MUs per muscle varies from 100 (e.g., hand muscle) to 1000 or more (e.g., limb muscle), but the relationship is one-to-one that each MU is only responsible for one particular muscle (Warburton et al., 1999).
Fig. 2.
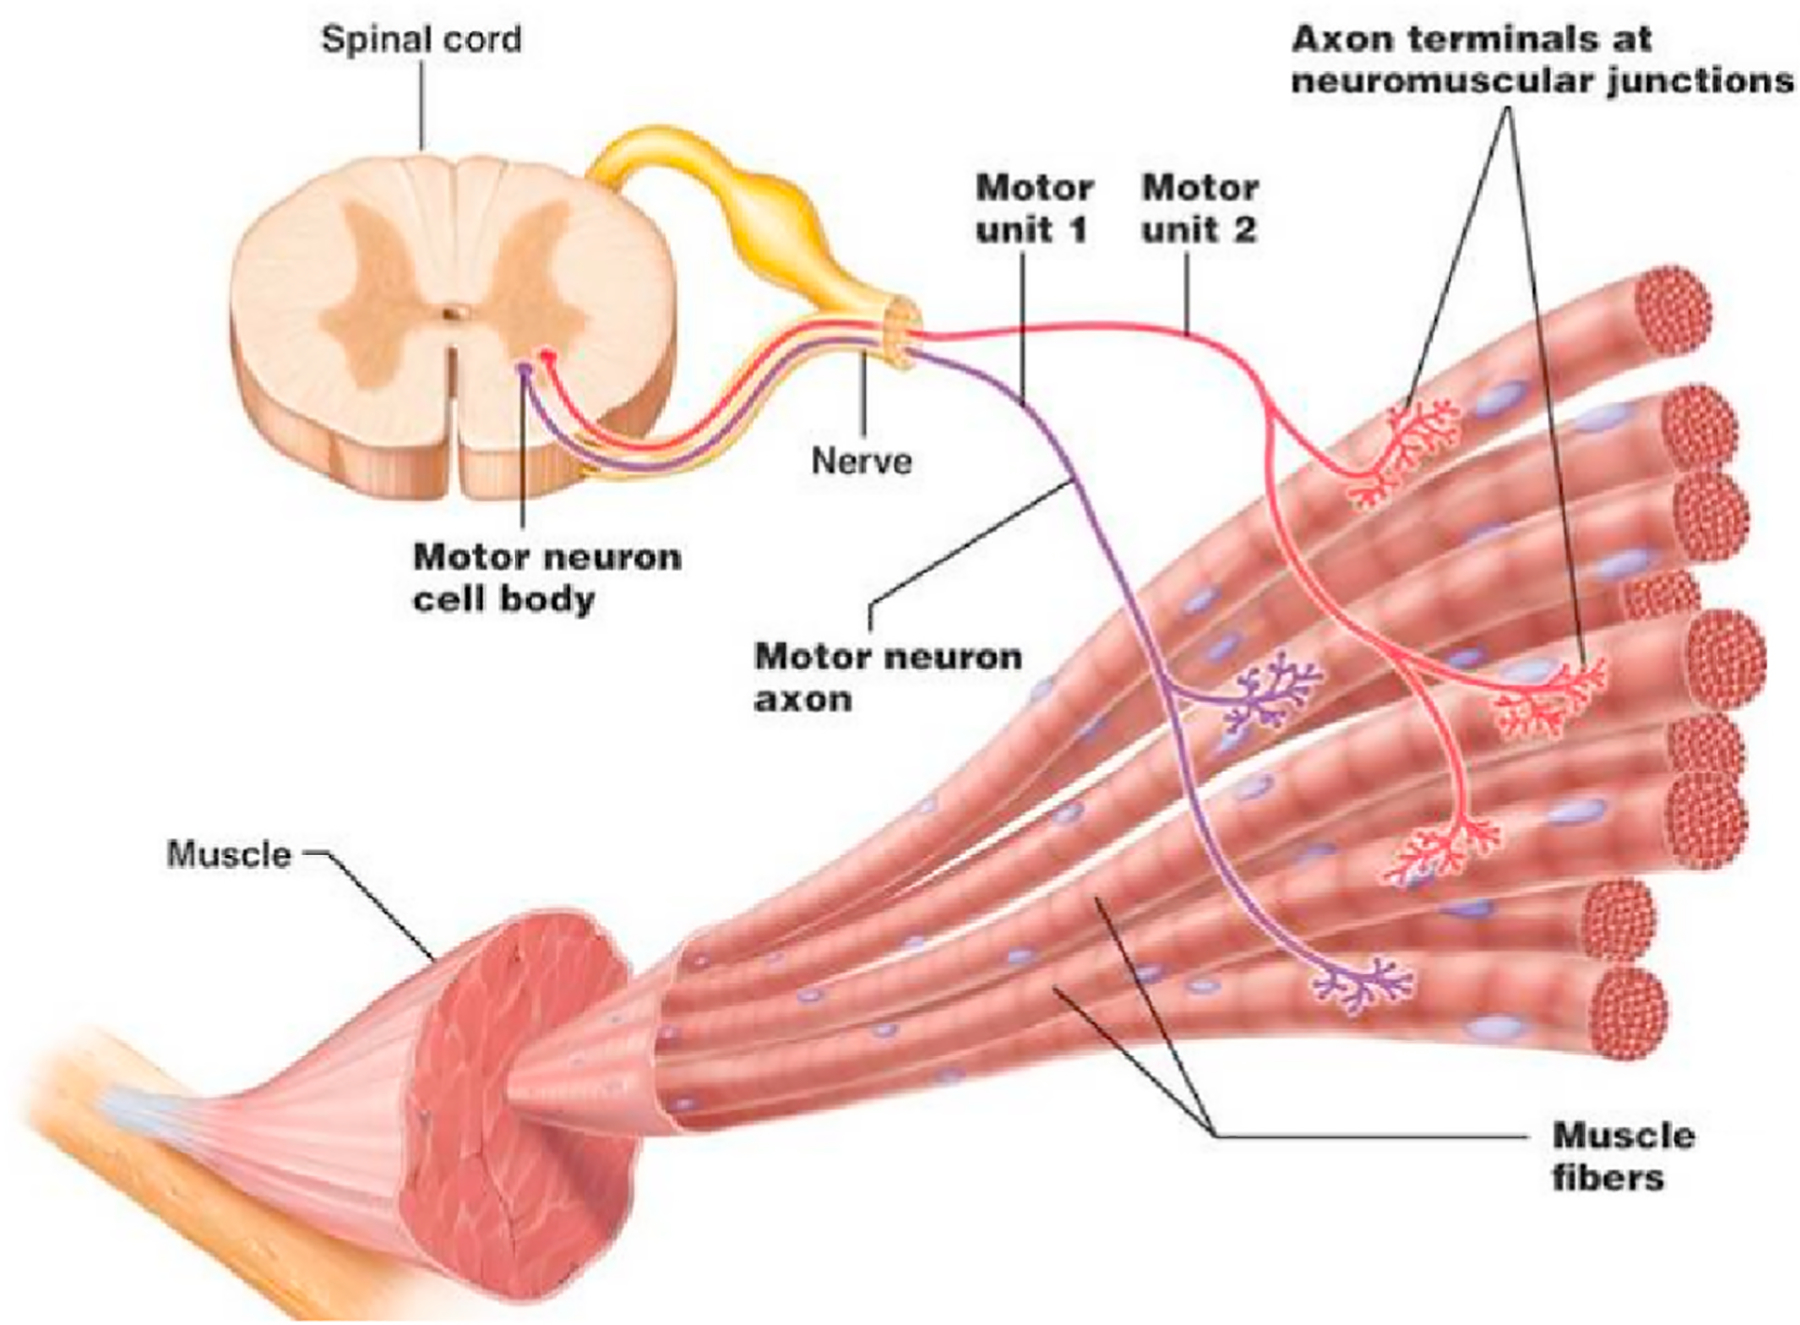
The basic component of human muscular system: motor unit (MU) (Neuroscience).
Fig. 3 describes how the force is generated under the collaboration between human brain cortex and MUs via electrical signal. The signal originates from the brain and transmits through spinal cord to specific motor units (Merletti & Parker, 2004). Then based on how much force is needed, the MU recruitment starts. The more force being generated, the more muscle fibers are required to get involved, so the more MUs need to be recruited. When enough MUs are ready to trigger the contraction of muscle, a new process begins as the so-called MU firing. The firing makes every motor neuron innervates their corresponding muscle fibers and generates the final force as what we feel during muscle exercises (Neuroscience.L https:/).
Fig. 3.
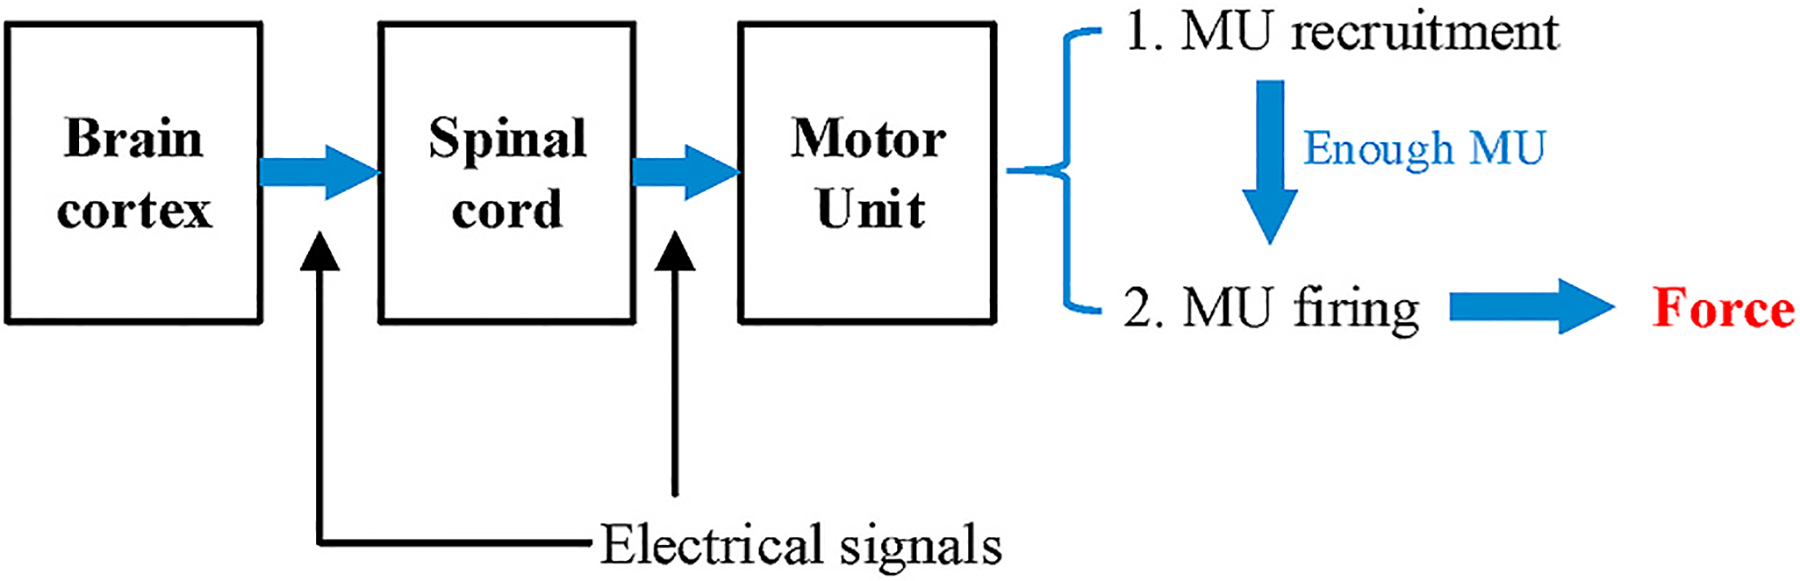
The process of how force is generated.
2.2. Muscle tremor and fatigue
Tremor is one of common consequences of muscle fatigue and the cause of tremor can be explained from the physiological aspect. As described in Section 2.1, during MU firing, each MU triggers the muscle with an impulse signal (Allum et al., 1978). As shown in Fig. 4, when the muscle has not been fatigued, all the MUs functions normally so that the combinational results of many MUs lead to a smooth contraction of the muscle. However, after overusing the muscle, the lactic acid starts accumulating in the muscle and reduces the intracellular pH. This phenomenon will decrease the conduction velocity of muscle fibers so that some of the MUs exhaust to maintain the force (Morrison et al., 2005). The exhaustion of these MUs will cause the fatigue that we feel, and in the meantime, the contraction becomes less consistent and produces the tremor that we observe (Gandevia, 2001).
Fig. 4.
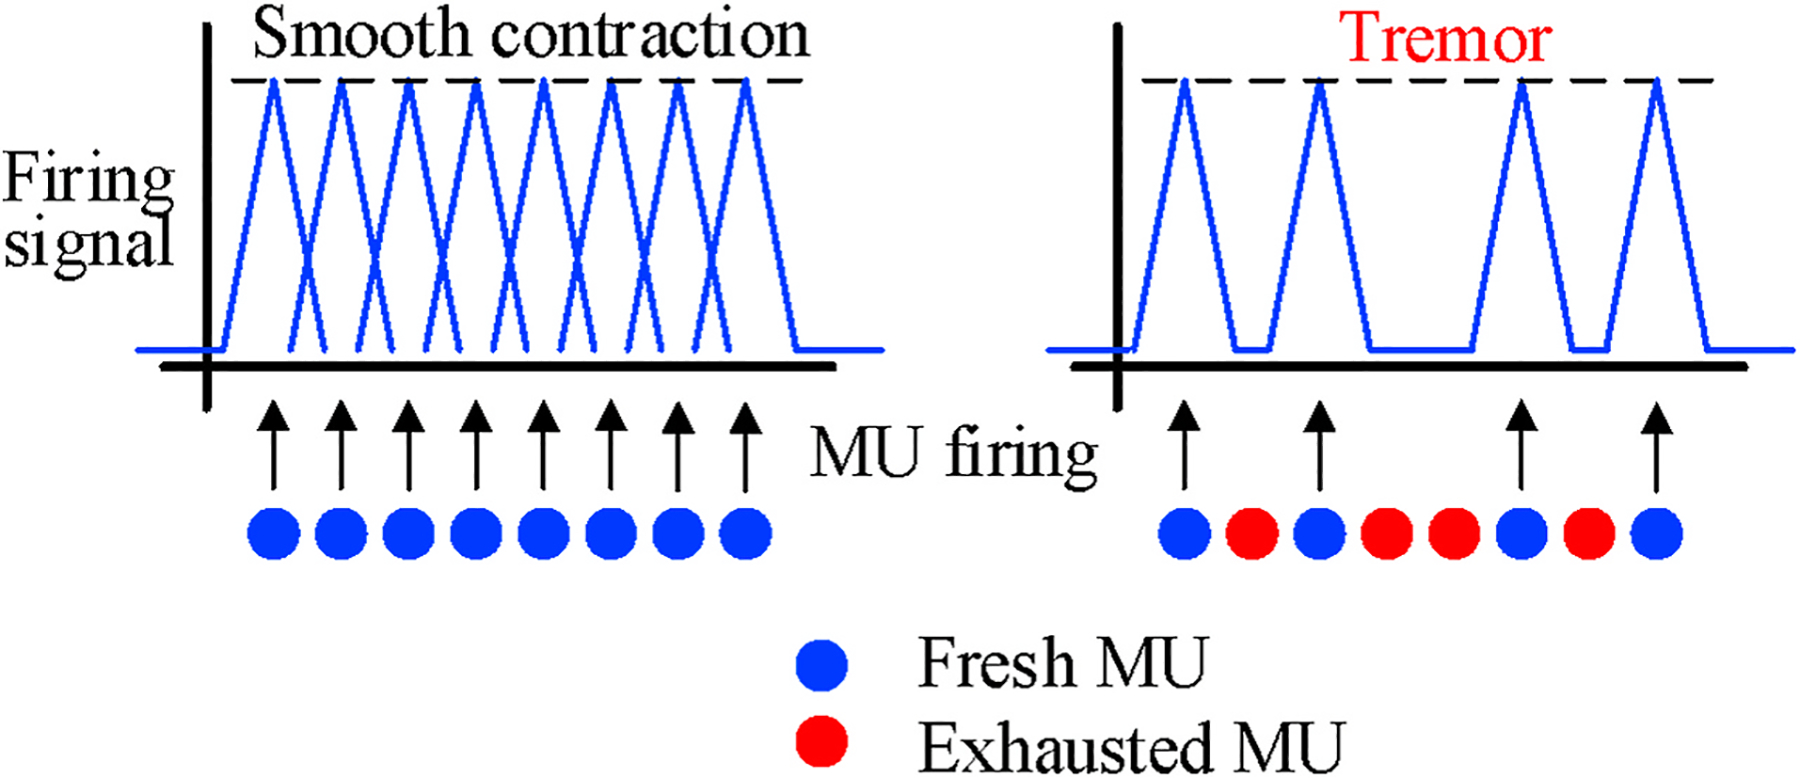
The cause of fatigue-induced muscle tremor.
Clinical study also showed that the amplitude of muscle tremor proportionates to the level of muscle fatigue (Gajewski, 2006). As shown in Fig. 5, the subjects in this research were asked to contract their muscle before and after exercises with great intensity. From the readings reported by accelerometers placed on the muscle, it is observed that the average amplitude of tremor increases when the muscle gets fatigued. Motivated by such correlation between muscle tremor and fatigue, we design our technique that measures the muscle tremor externally as the physical disturbance caused in an acoustic signal channel and further use such tremor to evaluate the actual muscle fatigue.
Fig. 5.
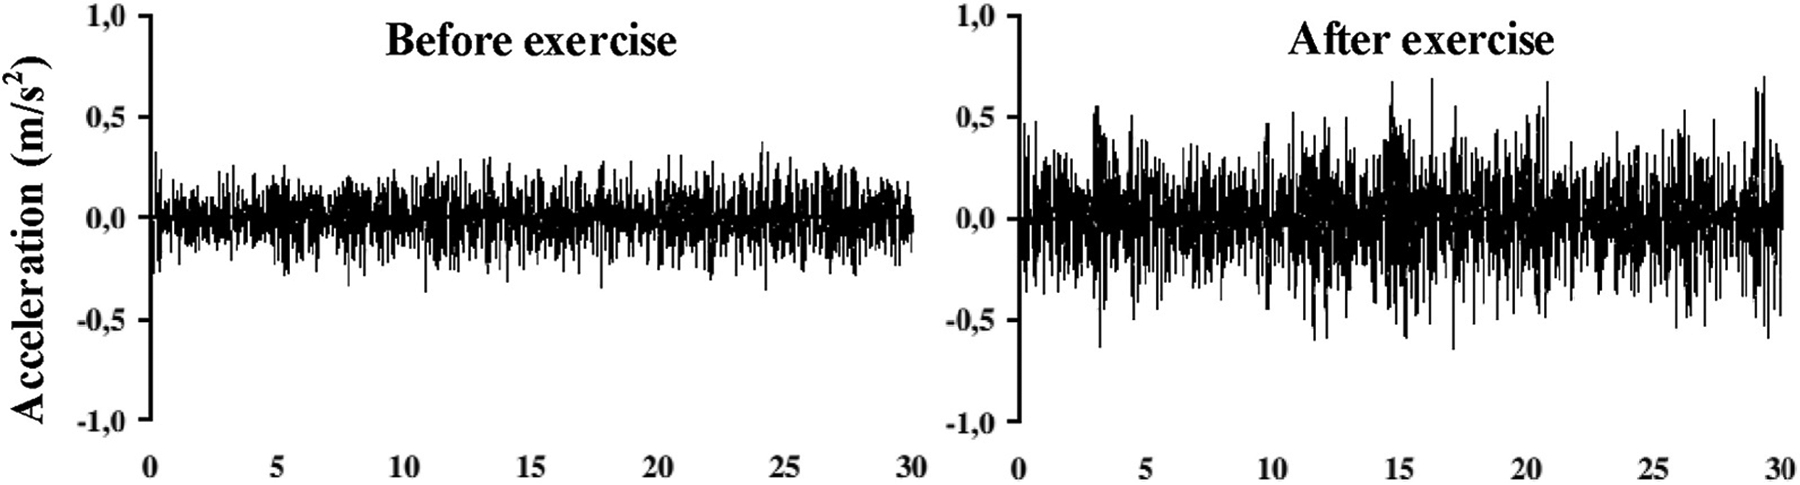
Clinical evidence of the tremor and fatigue (Gajewski, 2006).
2.3. Muscle contraction phases
Muscle contraction can be categorized as isometric and isotonic contractions (Muscle physiology). Though both two phases can generate force, isometric contractions do not change the length of muscle while isotonic contractions require lengthening or shortening the muscle. Taking common bicep exercises as an example, isometric contraction happens when we attempt to hold the dumbbell with no arm movements and the isotonic contraction happens when we lift up (down) the dumbbell by moving the lower arm. Moreover, the upper arm shows more evident geometrical change (bigger) during isotonic than isometric contractions. Fatigue induced tremor exhibits over both isometric and isotonic phases (Tarata et al., 2001), but based on the rationale of our technique that monitoring channel disturbances caused by physical change, tremor can be monitored with more confidence if no body motion or muscle geometrical change exhibits during isometric contractions. Since we target on bicep muscles in this paper, differentiating different phases of muscle contraction is also essential in our design.
3. Overview
As shown in Fig. 6, our technique of muscle fatigue evaluation consists of three consecutive modules. First, the channel estimation module converts the received ultrasound signal samples into an estimation matrix that represents the acoustic channel variation over time. To exclude irrelevant signal reflections, we specifically modulate the transmitted signal with a known codeword sequence. Such operation can divide the acoustic channel into different distance ranges (sub-channels), and we only need to extract the channel information corresponding to the range where muscle is placed. Section 4.1 describes the signal design and channel estimation in detail.
Fig. 6.
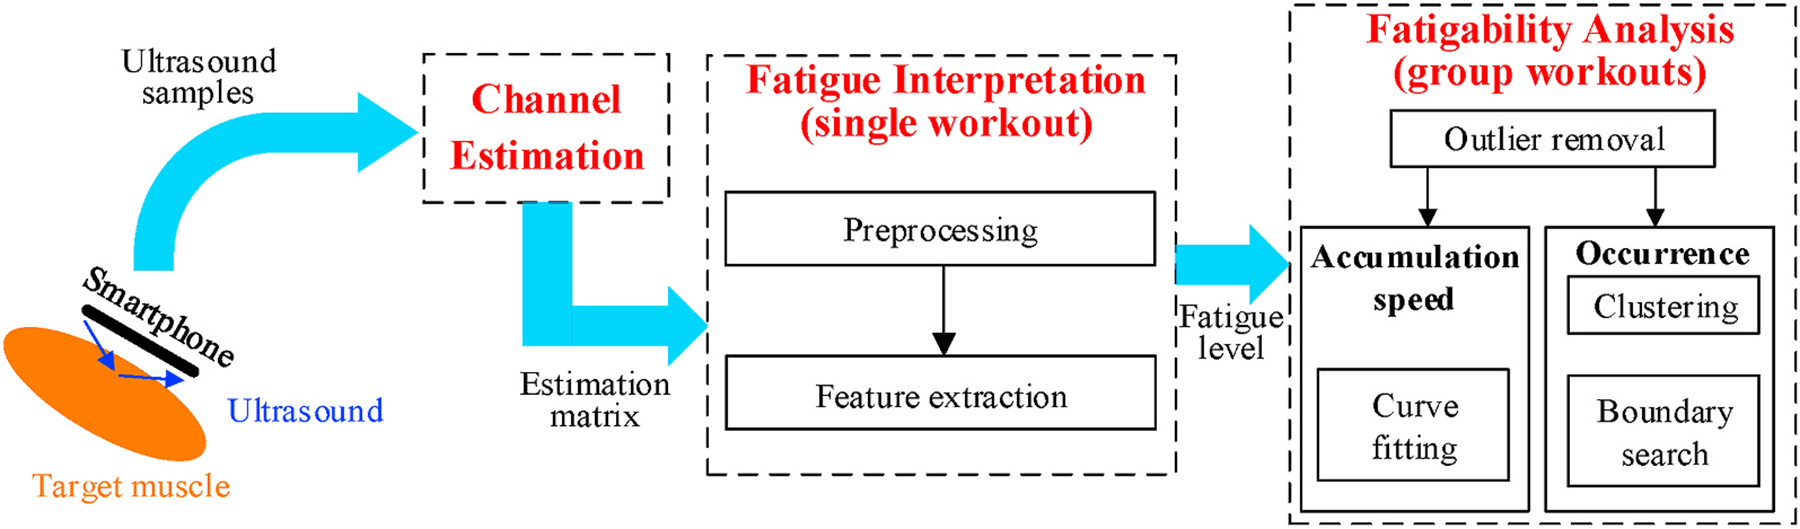
Design overview.
Second, in every single workout, we interpret the result of the above channel estimation into the corresponding fatigue level using the fatigue interpretation module. For the bicep muscle, this module identifies the muscle contraction phases and keeps only data during isometric contraction because it does not involve any body motion or geometrical change of muscle that creates extra disturbances on the acoustic channel. Then, we extract specific features from the channel estimation matrix to quantify the fatigue level. These features will be the raw inputs for further fatigability analysis. Details about these features are described in Section 4.2.
Third, the fatigability analysis module evaluates the muscle condition using all fatigue level quantifications in a group of workouts. Since muscle fatigue should monotonically increase over consecutive workouts, we first remove certain outlier workouts that exhibit abnormal fatigue values. Then, we investigate the fatigability by analyzing the speed of fatigue accumulation and the actual occurrence of fatigue in a group of workouts. For the accumulation speed, we use a single numerical feature to represent the fatigue level via linear curve fitting. For the occurrence of fatigue, we define a feature set and cluster them into two categories as non-fatigue and fatigue. We describe related approaches and algorithms in Section 4.3.
4. System design
In this section, we present the design of our technique in detail, including how to estimate the acoustic channel, interpret fatigue level and analyze the fatigability of the muscle.
4.1. Channel estimation
To obtain the estimation matrix that carries information of muscle tremor, our technique contains two major steps of signal design and channel estimation.
Signal design:
The signal transmitted by smartphone speaker contains single carrier frequency and we encode the carrier wave with a known sequence through BPSK modulation as shown in Fig. 7. To achieve efficient computation of channel estimation (Pukkila, 2000), the sequence is chosen as a 26-bit GSM training sequence that is originally used in GSM communication protocol for channel equalization. Such pre-known sequence, though primarily estimates the characteristics of physical path in RF systems, is also applicable to acoustic channel due to the similarity between signal processing methods of both systems. Besides, since commodity smartphones always have co-located speaker and microphone (e.g., at the bottom side of the smartphone), their direct transmission, if not properly tackled, will have significant impact on the channel estimation. Therefore, we append a fixed idle period after each modulated sequence to make our transmitted signal perform like an impulse signal. With only reflections from external objects, the received sequence can be correctly demodulated to ensure the correctness of the channel estimation.
Fig. 7.
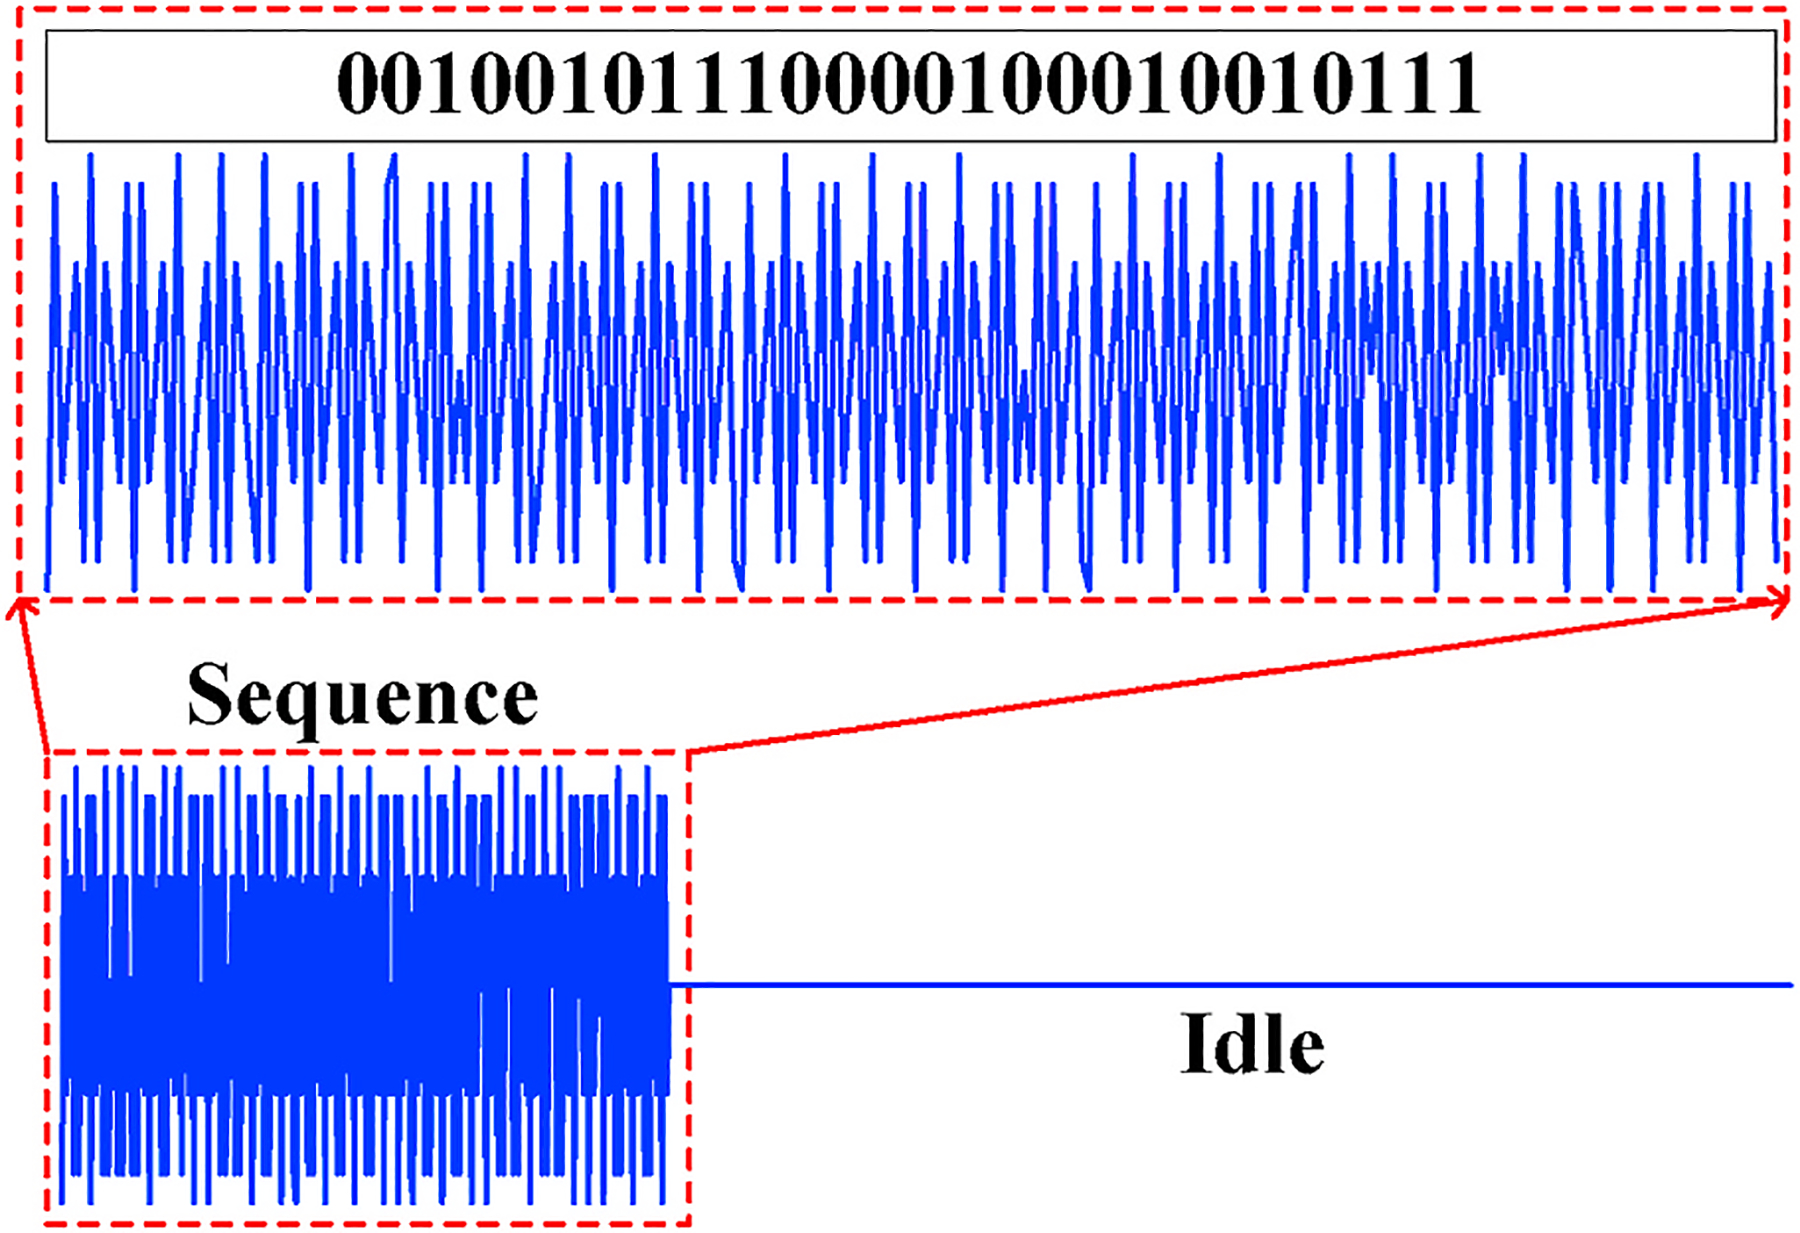
Transmitted signal including the training codeword sequence and the idle period.
Channel estimation:
The received signal sequence y, after demodulation, is expressed as y = Mh + n, where h is the complex channel impulse response, n is white Gaussian noise and M is the circulant training sequence derived from the known sequence mentioned in our signal design (Pukkila, 2000). Let m = {m0, m1, ⋯, mL+P−1} denote the known signal sequence being transmitted and L + P = 26 denote the matrix size (L and P are estimation parameters), then M is formed as:
| (1) |
The best linear unbiased estimate (BLUE) for h(L+1)×1 is then computed as , where we use partial decoded sequence yP×1. For the GSM training sequences, the given solution to provides the periodic autocorrelation function of the codeword sequence in the received signal. Since objects at different distances produce delayed reflections of the same transmitted ultrasound signal, we could extract the channel estimation corresponding to a certain distance range from the smartphone by shifting the original training sequence and autocorrelating it with different segments of the received signal after demodulation. Such operation, as shown in Fig. 8, divides the entire surrounding area into smaller ranges (sub-channels), and the aforementioned parameter L determines the number of such sub-channels. Note that, larger L produces more sub-channels with individual estimations, but the correspondingly smaller P will make the estimation less reliable as the length of autocorrelation is reduced (Yun et al., 2017). Empirically, we select P = 16 and L = 10 to have the best estimation results.
Fig. 8.
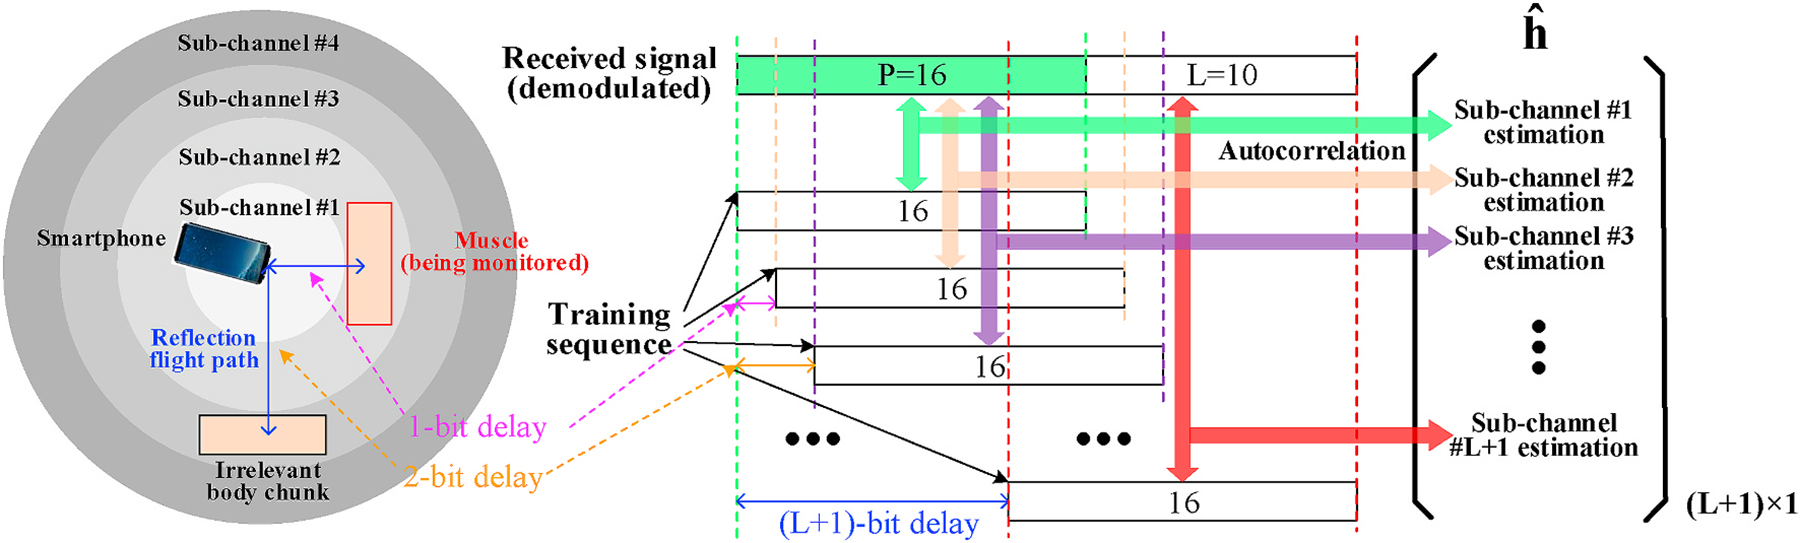
Sub-channels division based on different delays of the training sequence.
In summary, our preliminary metric is a complex vector, each element of which represents the channel estimation value at a specific distance range. Motion artifacts (e.g., body and hand motions) from other body chunks happen in distance ranges that are irrelevant to target muscle so that they will not affect our monitoring result. For those sub-channels farther from the phone, although our signal can still capture the variation within them, the interference and signal attenuation become more significant compared with closer ones. To improve the system reliability, we stipulate that our system should be used by placing the muscle being monitored close to the phone (<10 cm). Then, under the training sequence bit rate of 5 k/s, we will only search for tremor caused channel variation in the first three sub-channels (range of 10.2 cm1).
4.2. Fatigue interpretation
Next, we interpret the channel estimation values into the level of muscle fatigue. When the human subject contracts the muscle to produce force, our system records every changing value of during the process. At the end of each workout, we will have a time series of measurements on each sub-channel.
Depending on the type of exercise and muscle being used, we further process the received signal to locate the period of time that only the muscle tremor is the main cause of channel variation. For example, when a bicep workout is our target, the key of obtaining such period of time is to differentiate isometric and isotonic contractions because, as mentioned in Section 2.3, arm motion and the geometrical change of muscle may impact the tremor monitoring during an isotonic contraction (e.g., lifting up the forearm). Fig. 9 shows the time series from one sub-channel during a complete bicep workout and we demonstrate such impact by taking the moduli of those complex metrics.
Fig. 9.
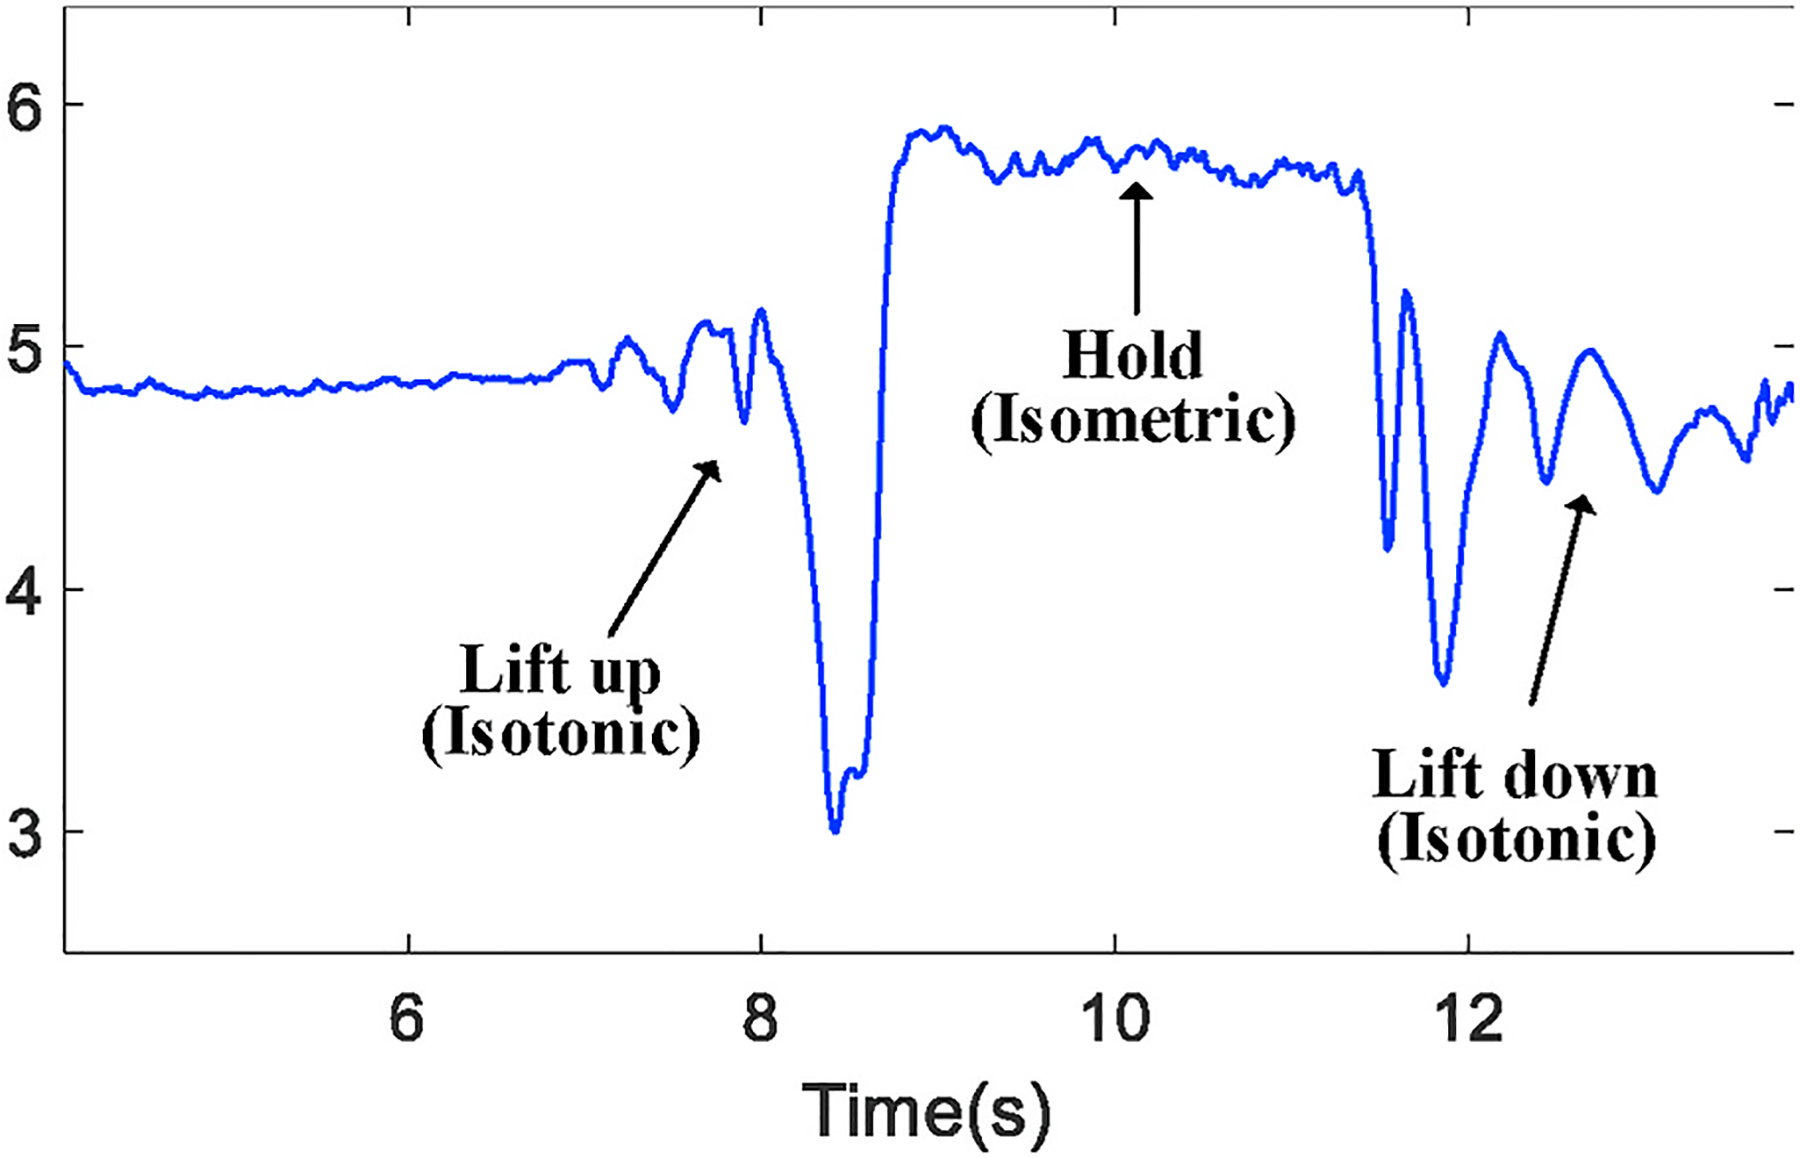
The waveform difference between isometric or isotonic contractions.
From Fig 9, we observe that both lift-up and lift-down phases lead to more evident changes of channel estimation due to the change of muscle geometry. As the physical change caused by tremor can be minor, it is very likely to be covered when being measured from isotonic contractions. To build solely the connection between tremor and channel variation, we identify the isometric phase by comparing the value range of a 3-s (stipulated in the test protocol) sliding window with a threshold. The threshold is set as 10% of the measured value over the 1st second when a subject remains static and prepares to begin the workout. Since this threshold is determined every time when the workout starts, it serves as a generic calibration process.
After addressing all significant factors that may affect the channel estimation, we propose an approach to extract the channel variation led by muscle tremor and interpret it to fatigue level. We exploit the channel estimation metric in the complex plane by assuming that any complex time series over time, if not being disturbed, would concentrate all at a single point on the complex plane. As shown in Fig. 10, the more disperse of the time series in the complex plane is, the more muscle tremor is exhibited. To measure the degree of dispersion, we first find the average point of all complex signal samples on the complex plane. Then, we form a new vector by computing the distance between every signal sample and the average point. For a single workout, the quantitative fatigue level can be formulated as the mean of these distances.
Fig. 10.
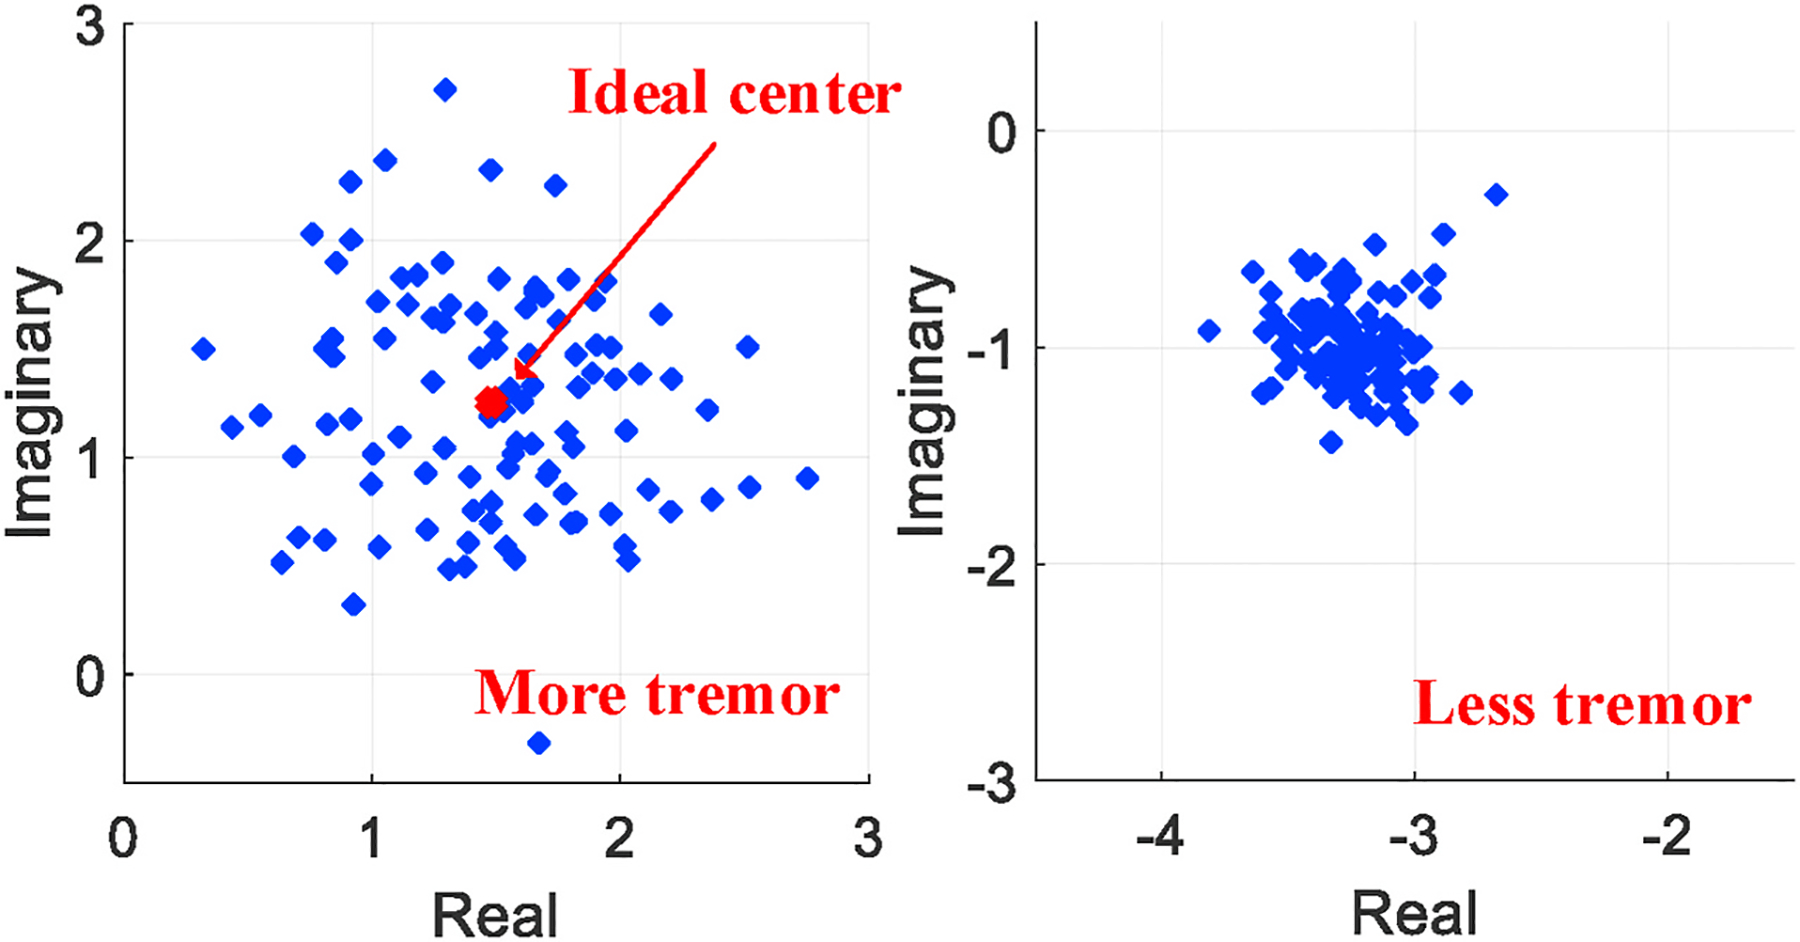
The concentration of a complex time series interpreted as fatigue level.
4.3. Fatigability analysis
After we interpret every workout into a specific fatigue level, we analyze the muscle fatigability in a scope of multiple workouts (a group) that one can finish during each test. However, these fatigue levels may contain outliers due to the uncertainty of subject’s efforts. For example, in a certain workout, the fatigue level may be abnormally high because the subject moves the arm. Presuming that human fatigue accumulates monotonically over time (Calbet, 2006), we will first identify these outliers and exclude them from muscle fatigue evaluation.
To decide an outlier, we first compute the difference between the fatigue level of a specific workout and the median fatigue level of the entire group of workouts. If the difference is three times larger than median absolute deviation (MAD), we consider the data as an outlier. Here the MAD is defined as:
| (2) |
where A is a test group including N workouts.
Then, we understand the muscle fatigability from two aspects: 1) the fatigue accumulation speed and 2) the occurrence of fatigue over a group of workouts.
Fatigue accumulation speed:
The fatigue accumulation speed can be computed based on the quantitative fatigue level of each workout. Fig. 11 depicts raw measurements of the fatigue level as discrete samples, over consecutive workouts in the same test group. In particular, we apply linear curve fitting over these samples, and the produced slope could then be used as the measurement of fatigue accumulation speed. From our experiments, the slope values are always positive, which conforms to the intuition that fatigue does not decrease when the subject keeps exercising.
Fig. 11.
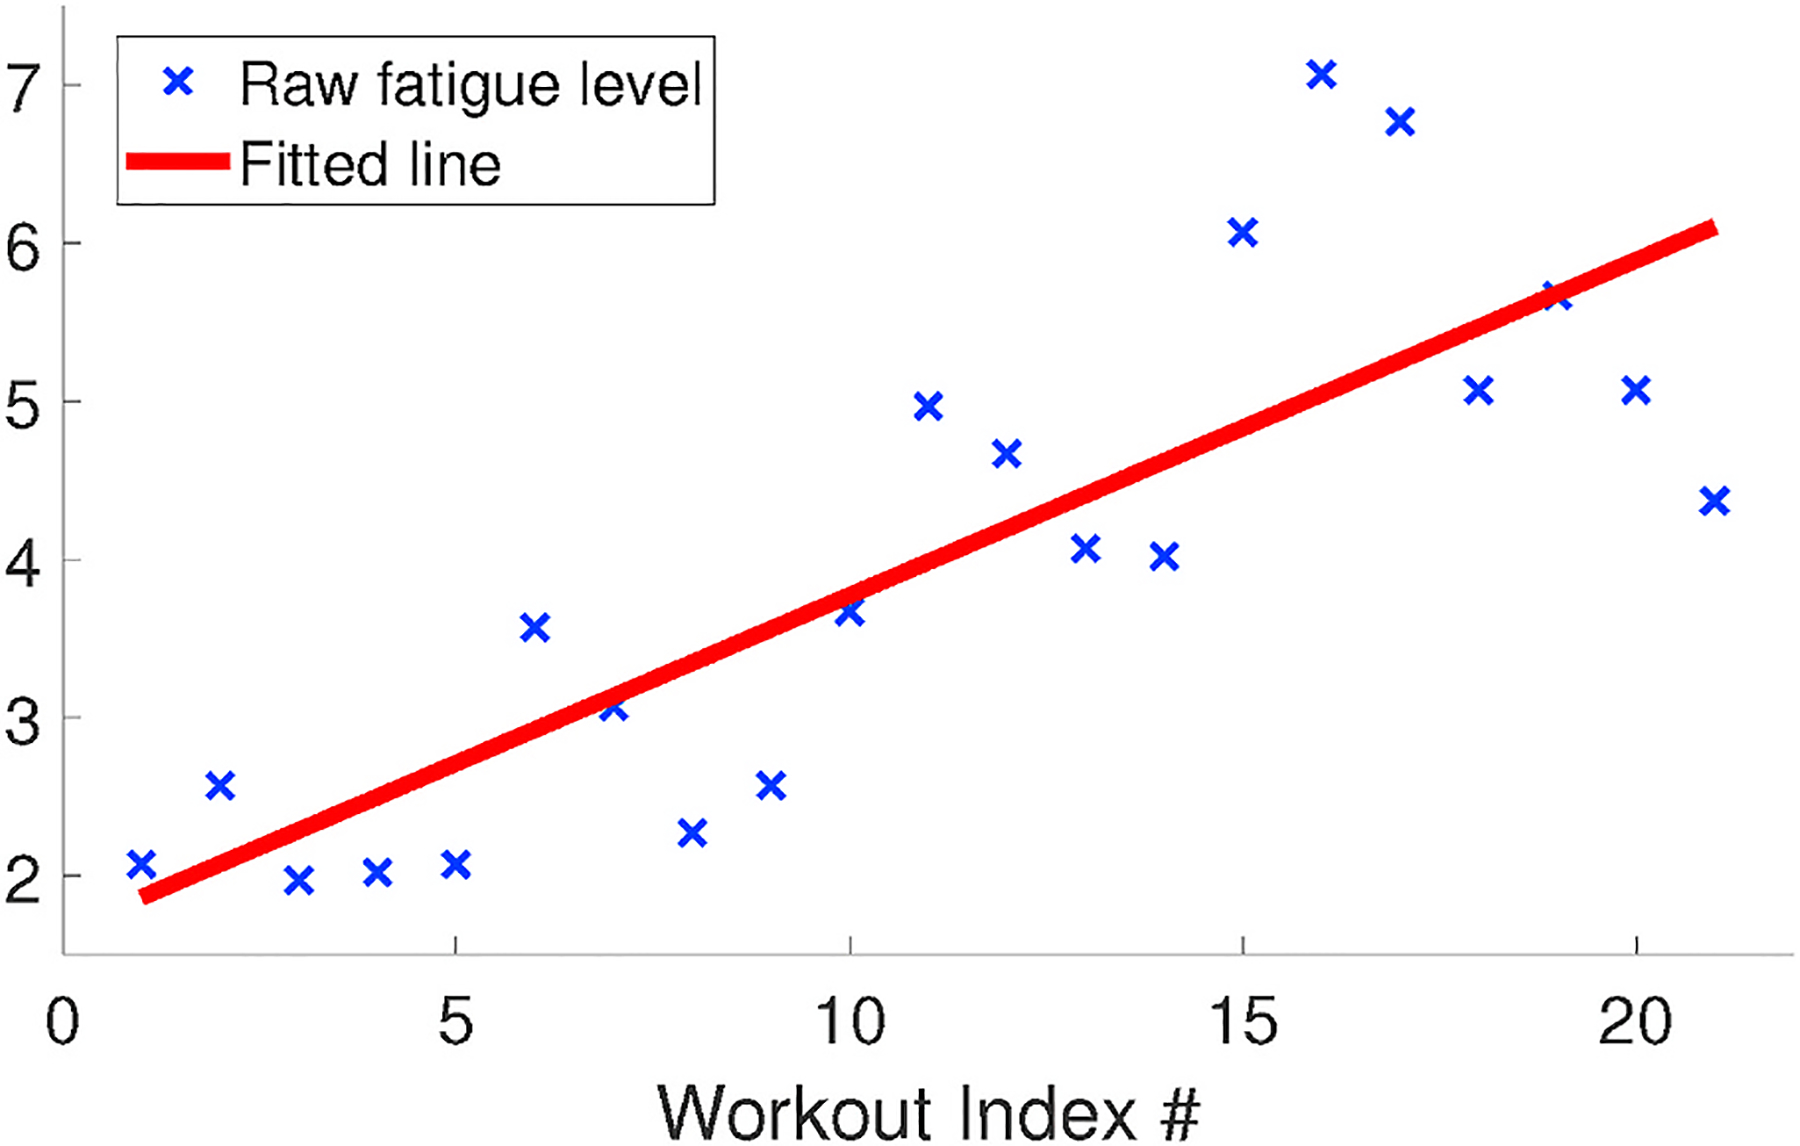
The accumulation speed of fatigue.
Identifying the occurrence of fatigue:
The accumulation speed reflects the muscle strength, such that stronger muscle exhibits slower accumulation of fatigue. However, it can not tell the actual occurrence of fatigue, which is of great importance in many practical scenarios of disease tracking and evaluation. Instead, we formulate the identification of fatigue occurrence as a binary clustering problem. The clustering is performed using k-means algorithm and all workouts of a test group will be clustered to be either “fatigued” or “non-fatigued” workout. To improve the reliability of the clustering, we incorporate more features besides the mean of distances on the complex plane as discussed in Section 4.2. These features are statistical moments including variance (second order central moment) and skewness (third order standardized moment) of these distances.
We initialize two clusters with the centroids defined as the feature values of the first and last workout in a group, respectively. This is to assume that the muscle at the end of a group of workouts is always fatigued. On the contrary, the first workout always begins with non-fatigued muscle. Next, we randomly feed the rest of the workouts into the clustering algorithm and compute the sum of point-to-centroid Euclidean distances. The algorithm runs for multiple times and returns the clustering results with least sum distances over all clusters.
However, due to the complexity of muscle fatigue, if we align the workouts in time order, there may not always be a clear boundary defined as the occurrence of fatigue as shown in Fig. 12. We summarize several reasons for this phenomenon from our experiments. First, people may not maintain the same concentration during the entire group of workouts. e.g., at a certain workout, they may be distracted and fail to strictly follow the protocol. Second, the actual boundary between fatigued and non-fatigued is not obvious enough and based on subjects’ different physical condition, the transition between two feelings may last long. As a result, the clustering results may show two clusters, in which some of points during the middle of test mix together.
Fig. 12.
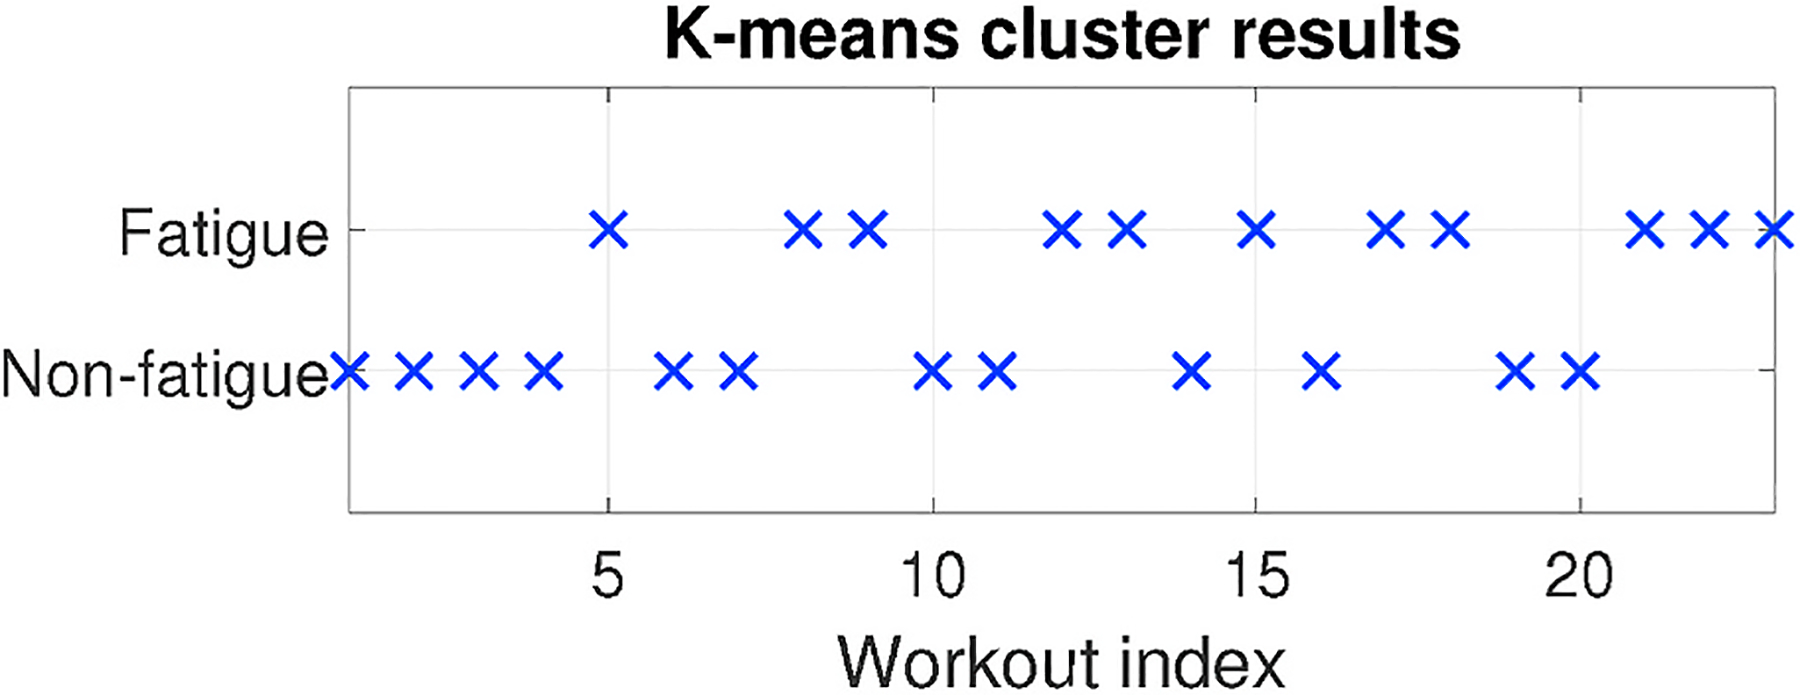
An example of unclear boundary between “fatigued” and “non-fatigued”.
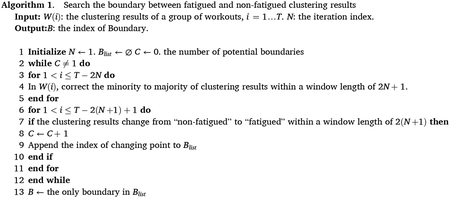
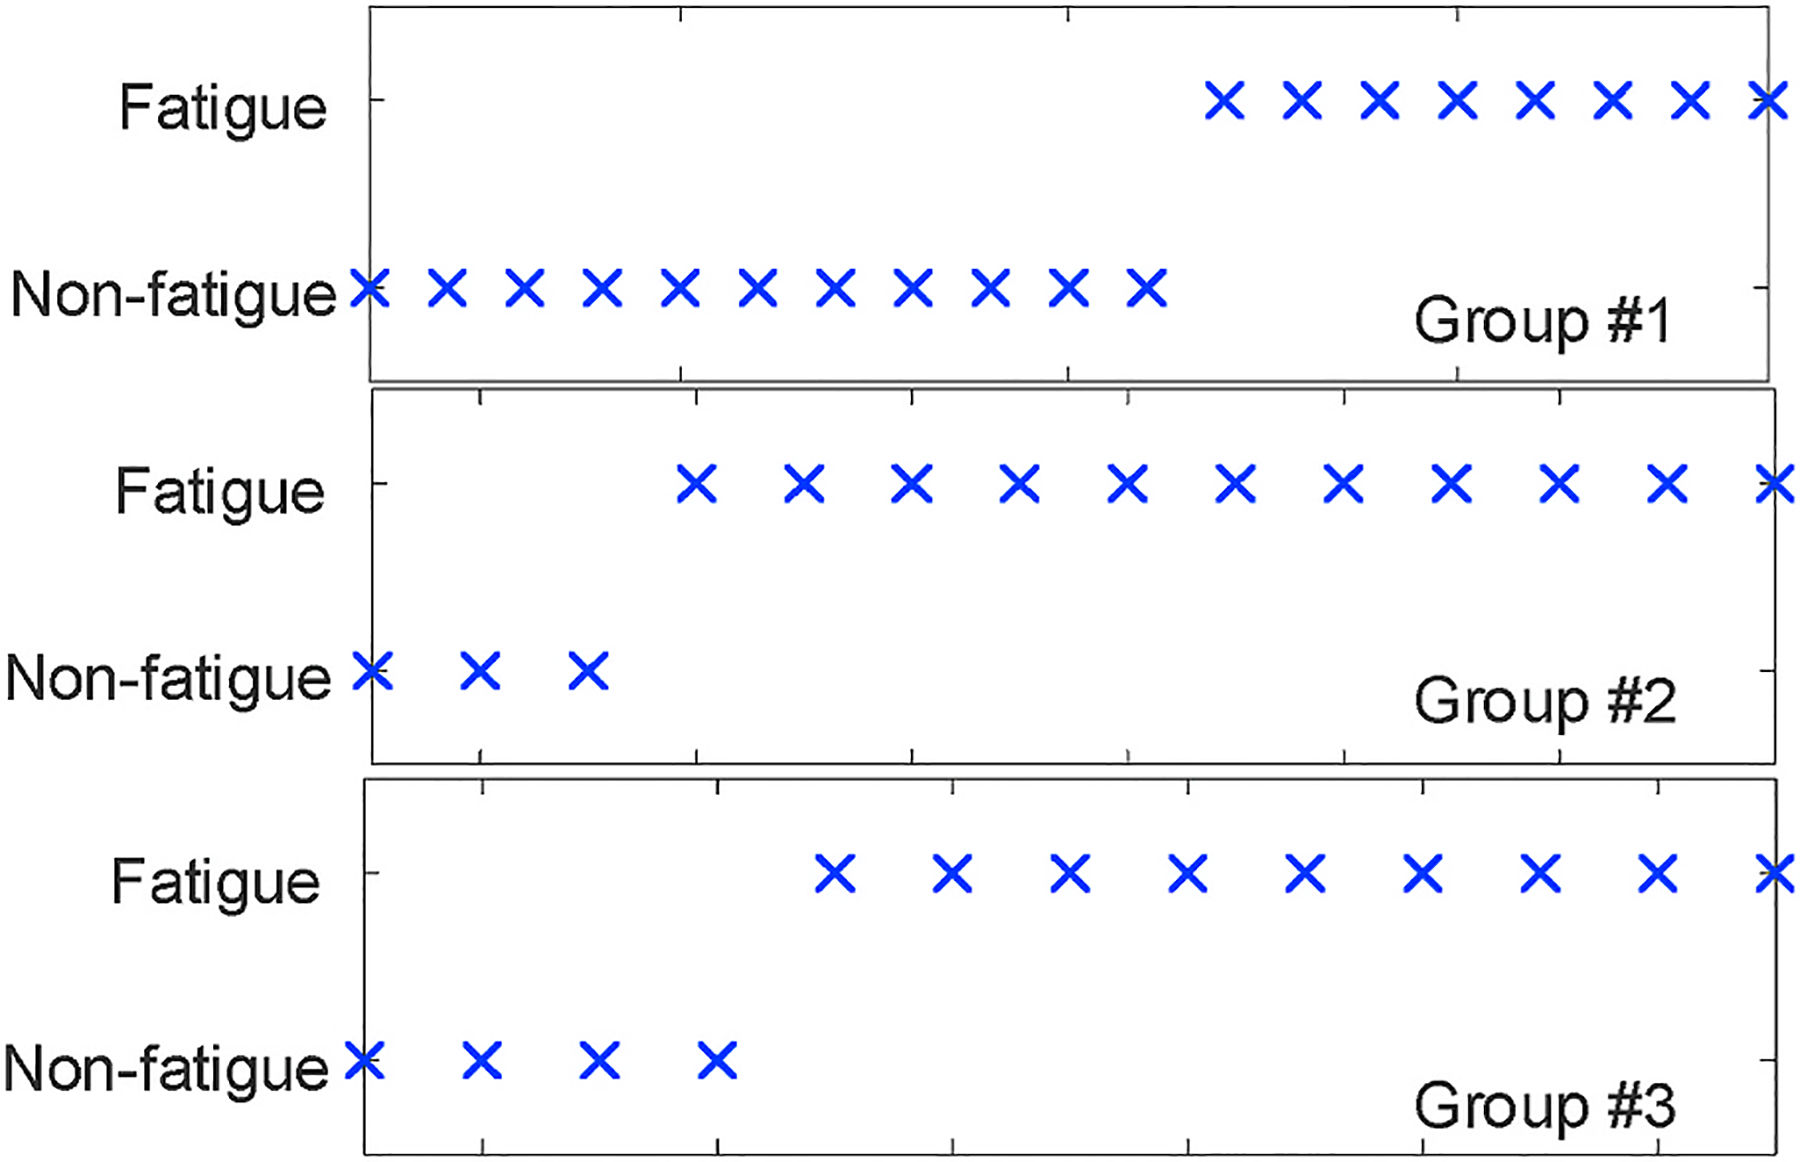
To address such ambiguity of muscle fatigue occurrence, we proposed a heuristic searching algorithm that explicitly finds the boundary. The algorithm, as described in Algorithm LABEL:alg:boundarySearch, is based on the distribution of clustering results among consecutive workouts and corrects minority of data points to the majority until there is only one boundary dividing “fatigued” and “non-fatigued” clearly. The outcomes, as shown in Fig. 13, remove the ambiguous transition between two muscle status and correct the outliers produced by inadequate human effort.
Fig. 13.
The algorithm explicitly identifying the occurrence of fatigue.
5. Implementation
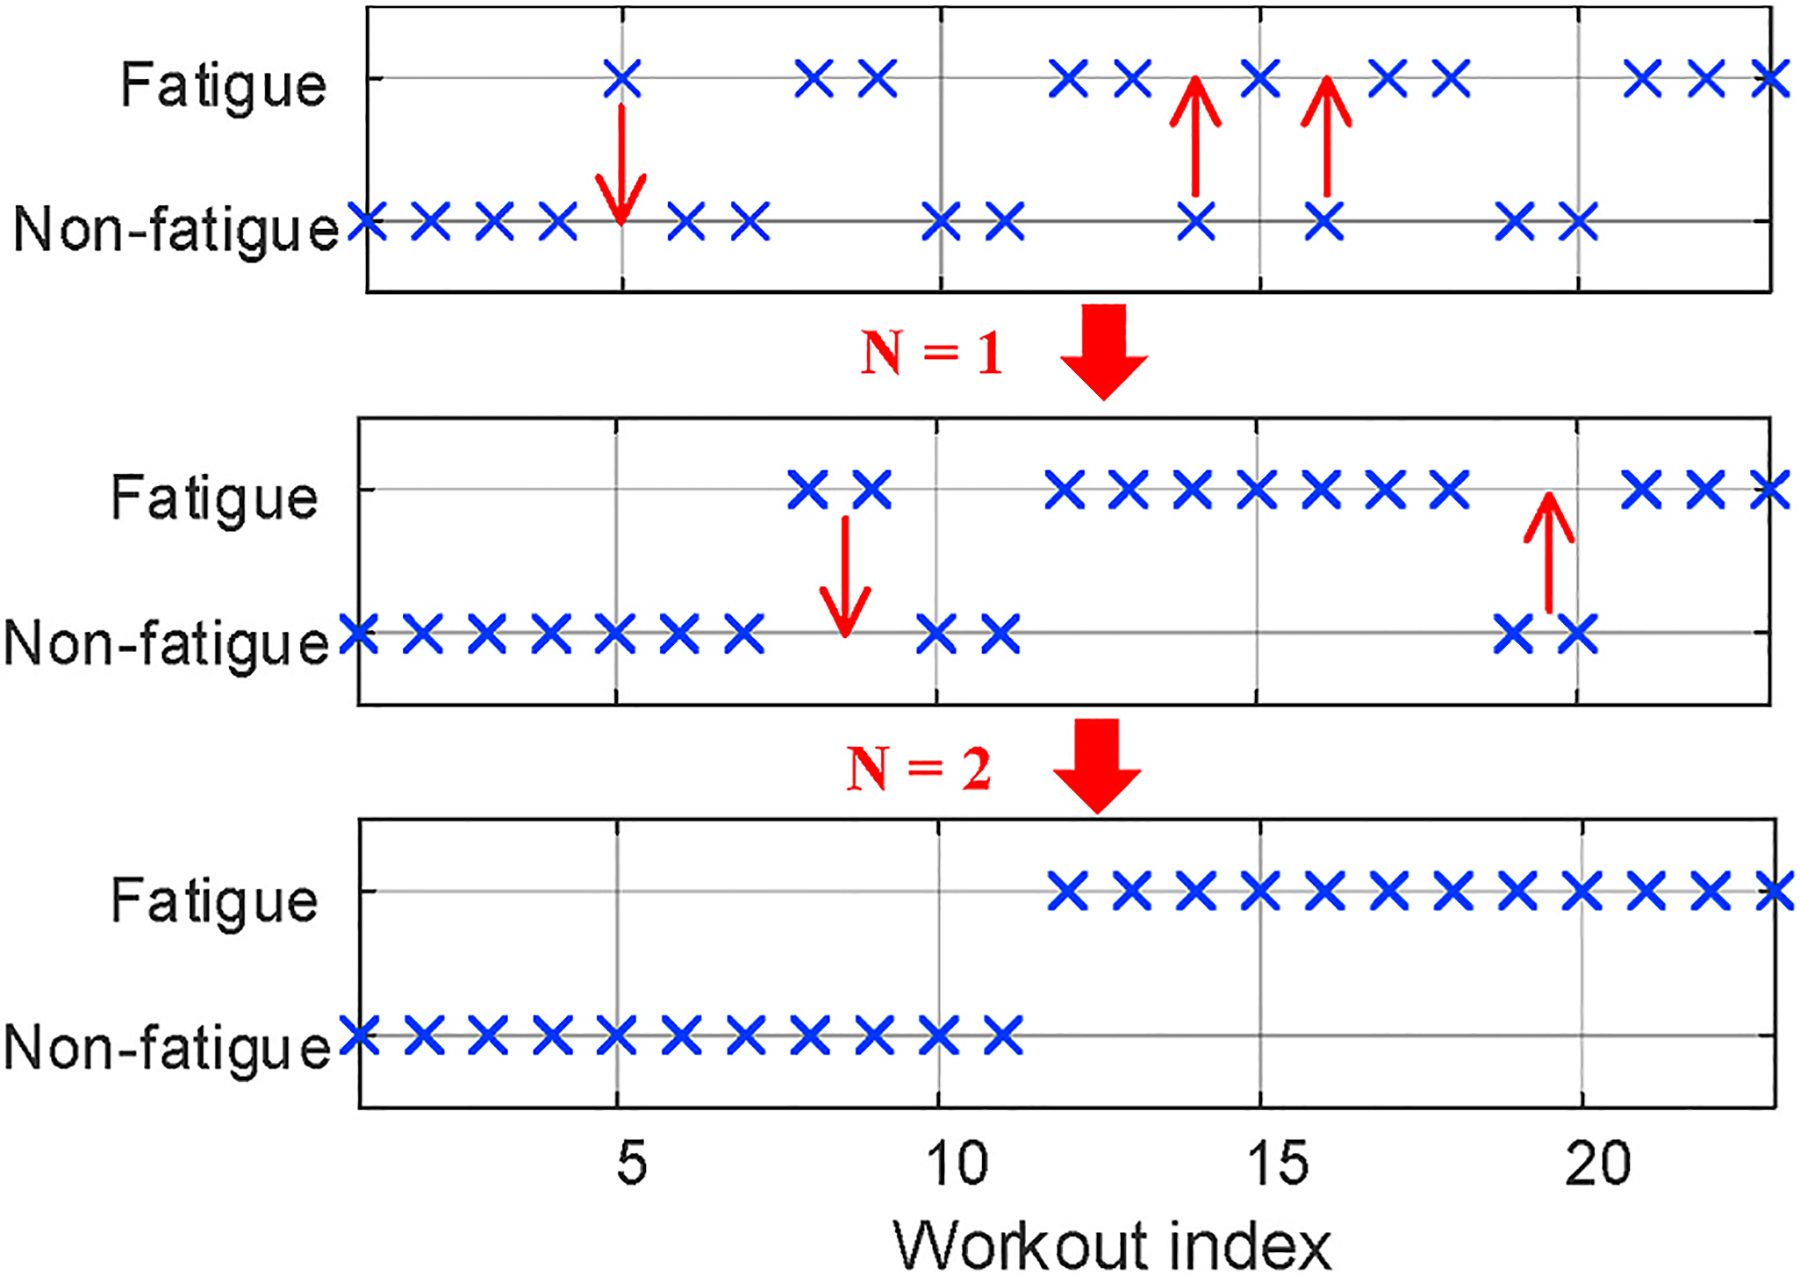
We implement our technique as an Android smartphone app, which uses 20 kHz as the carrier wave of our encoded signal. Though commodity smartphones usually have two pairs of speaker and microphone for music playback or voice call, we choose top speaker along with bottom microphone because this combination can ensure the best results of channel estimation from our experiments. To minimize interaction needs, the subject only needs to signal the start and end of each test by pressing a phone volume button. The test protocol is suggested by clinicians based on a simple bicep workout and entire procedures are automated by voice and screen instructions as shown in Fig. 14.
Fig. 14.
Protocol procedures and instructions of the smartphone app.
The protocol stipulates that the basic unit of our test is a group, in which we require the subject to complete as many biceps workouts as possible until he(she) feels hard to follow the speed of voice instructions. Each workout includes steps of preparation, lift-up, hold, lift-down and a resting interval for the following workouts. By explicitly defining the duration of these steps and the elevation that the dumbbell should be lifted, we make the protocol standardized so that people with different muscle condition should have similar feeling of fatigue after enough times of workout.
6. Evaluation
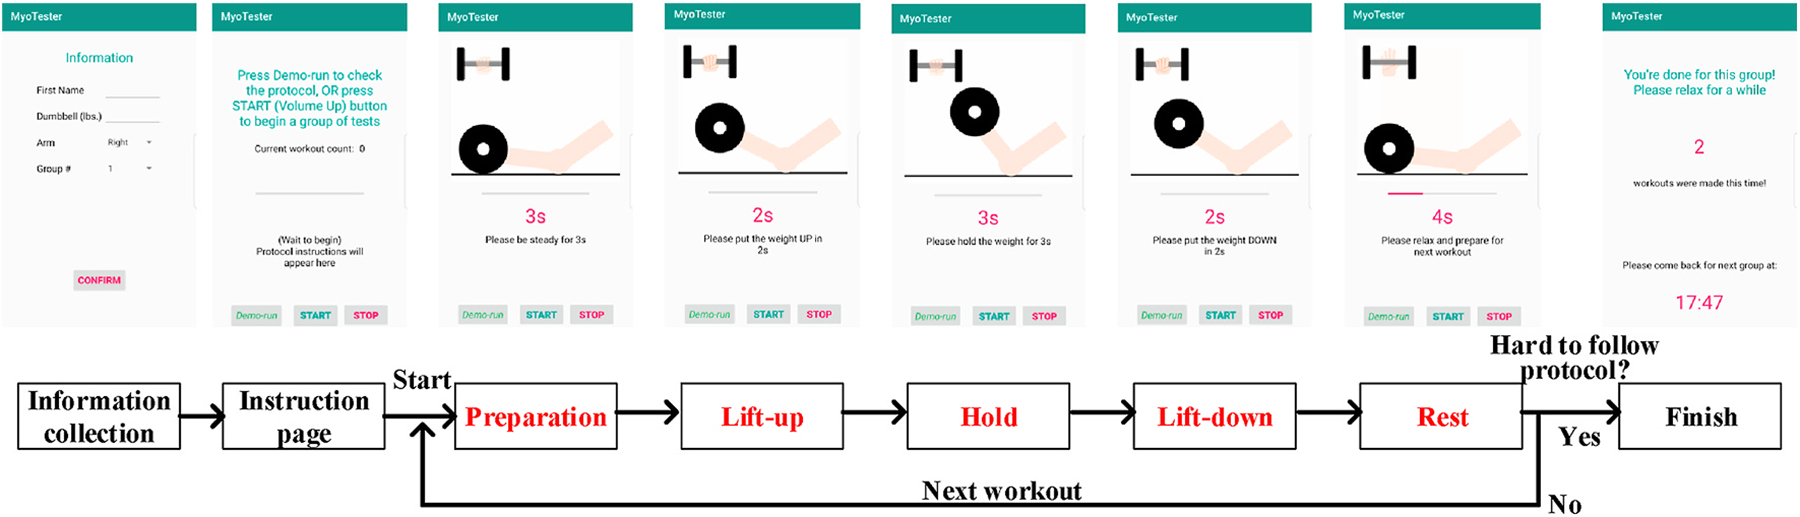
In this section, we evaluate our technique over 5 student volunteers. All volunteers have different muscle strength and exercise habits, but none of them has ever experienced any muscle disorders. All experiments are done in a 10m × 10m lab office with furniture and electronic equipment. Based on the evaluation goals, we may ask the subjects to use dumbells with different weights or complete multiple groups of test. During the test, the smartphone should be placed closely (5–10 cm) with its screen facing towards the muscle being monitored. For bicep muscle, we handmade a holder to fix the phone screen pointing to the inner area of upper arm as shown in Fig. 15.
Fig. 15.
Experimental setup for bicep muscle.
6.1. Fatigue accumulation with different workloads
We first evaluate our technique when being used to analyze the accumulation speed of muscle fatigue. The evaluation is based on a fact that bicep muscle would become fatigued faster when being exercised with heavier weights, so we preset 3 wt options and ask the subject to complete at least 1 group of workouts for each weight option. Our evaluation metric is whether the slope values discussed in Section 4.3 become larger accordingly as we increase the weights.
Meanwhile, we also deploy an EMG device, as shown in Fig. 16, to further validate such fact of accumulation speed and serve as the ground truth to evaluate our technique. In the scope of EMG analysis, muscle fatigue can be represented as the integration of EMG signal (IEMG) while muscle contracts (Stokes & Dalton, 1991), namely the area within the EMG curve and time axis as shown in Fig. 17. With similar insights of our system, we perform the first order curve fitting over IEMG values measured in a group of workouts and use the slope value to represent the accumulation speed of fatigue.
Fig. 16.
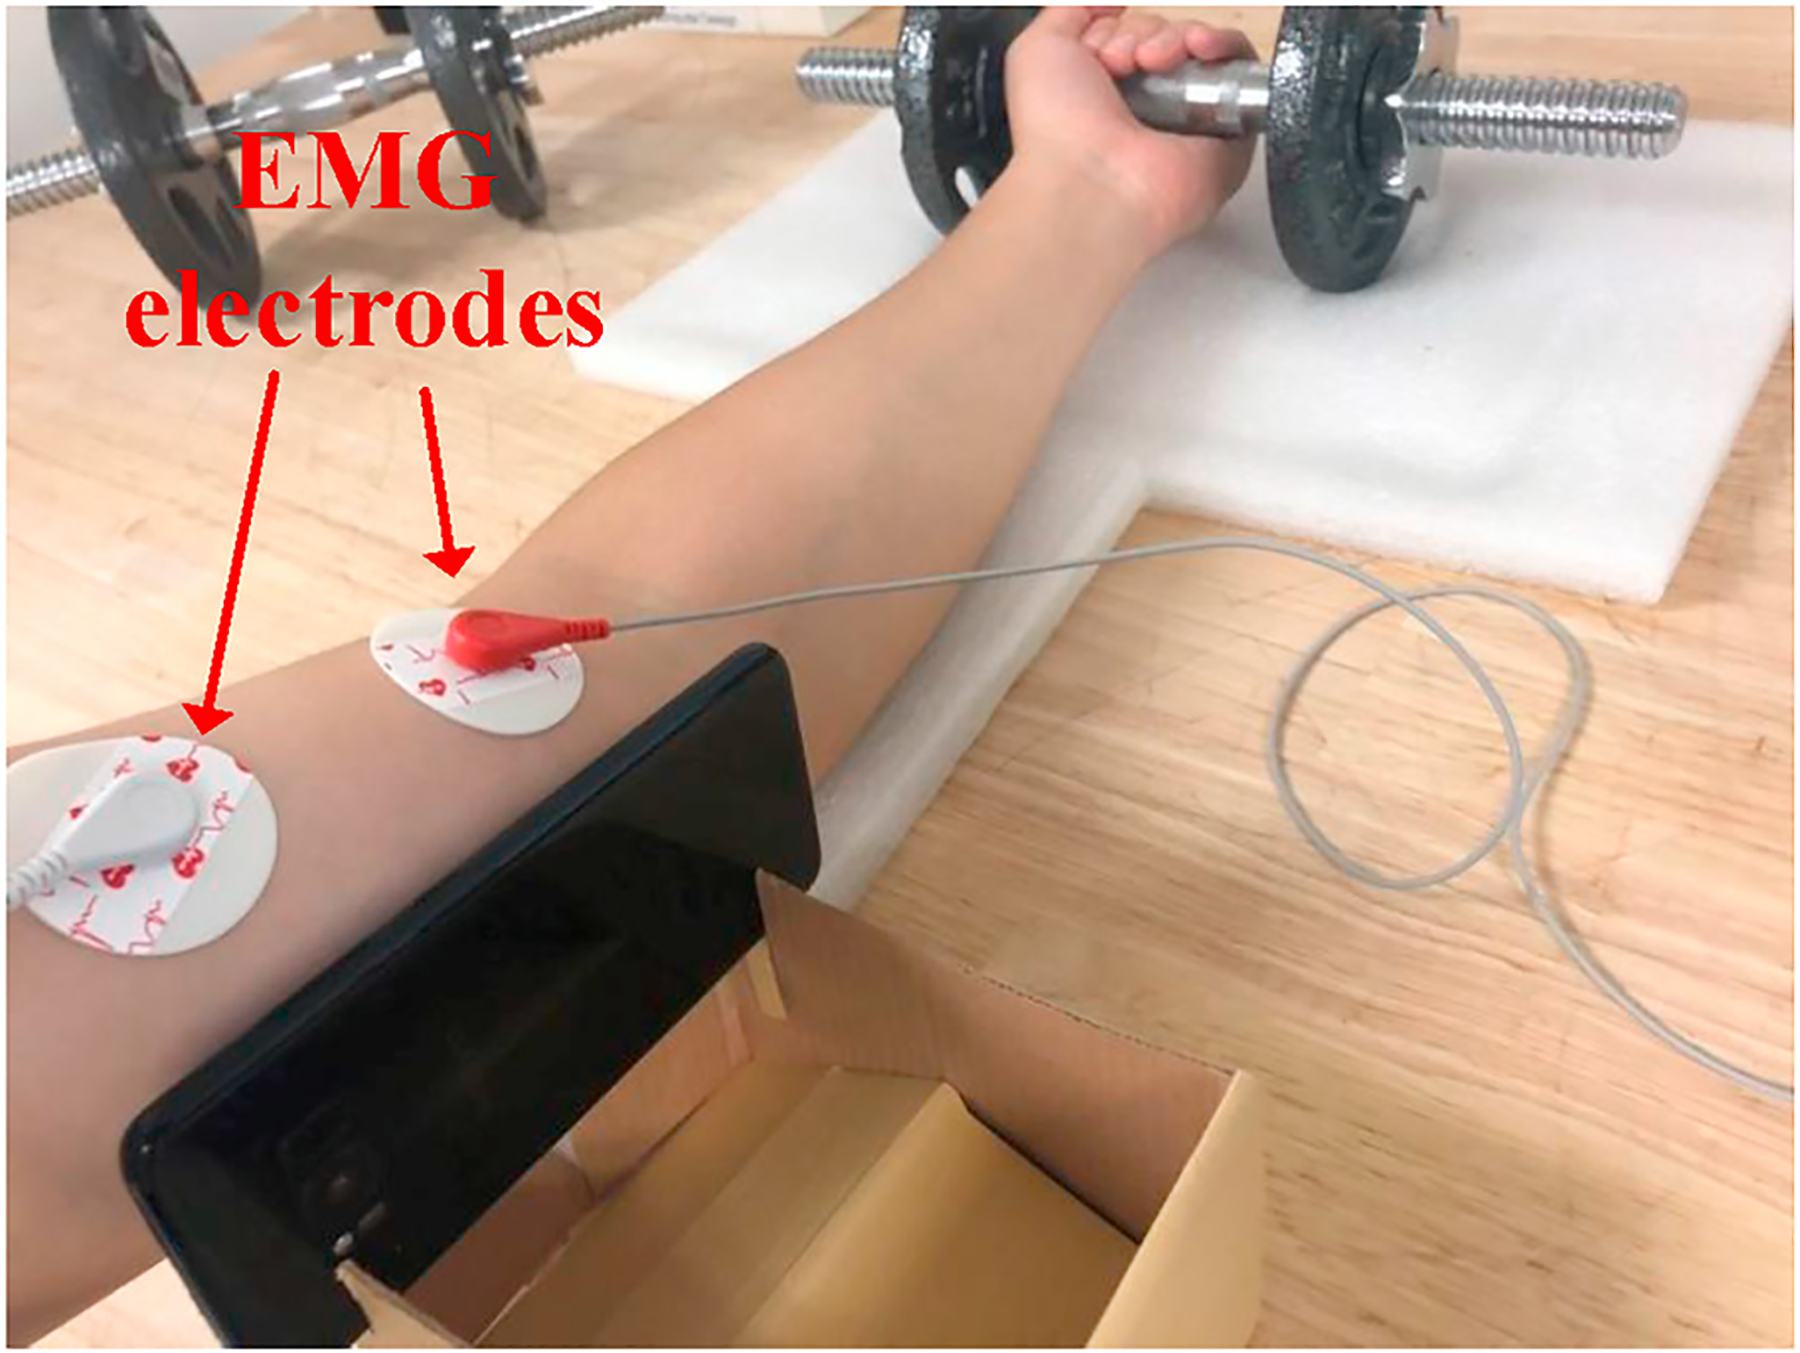
Experimental setup with EMG device.
Fig. 17.
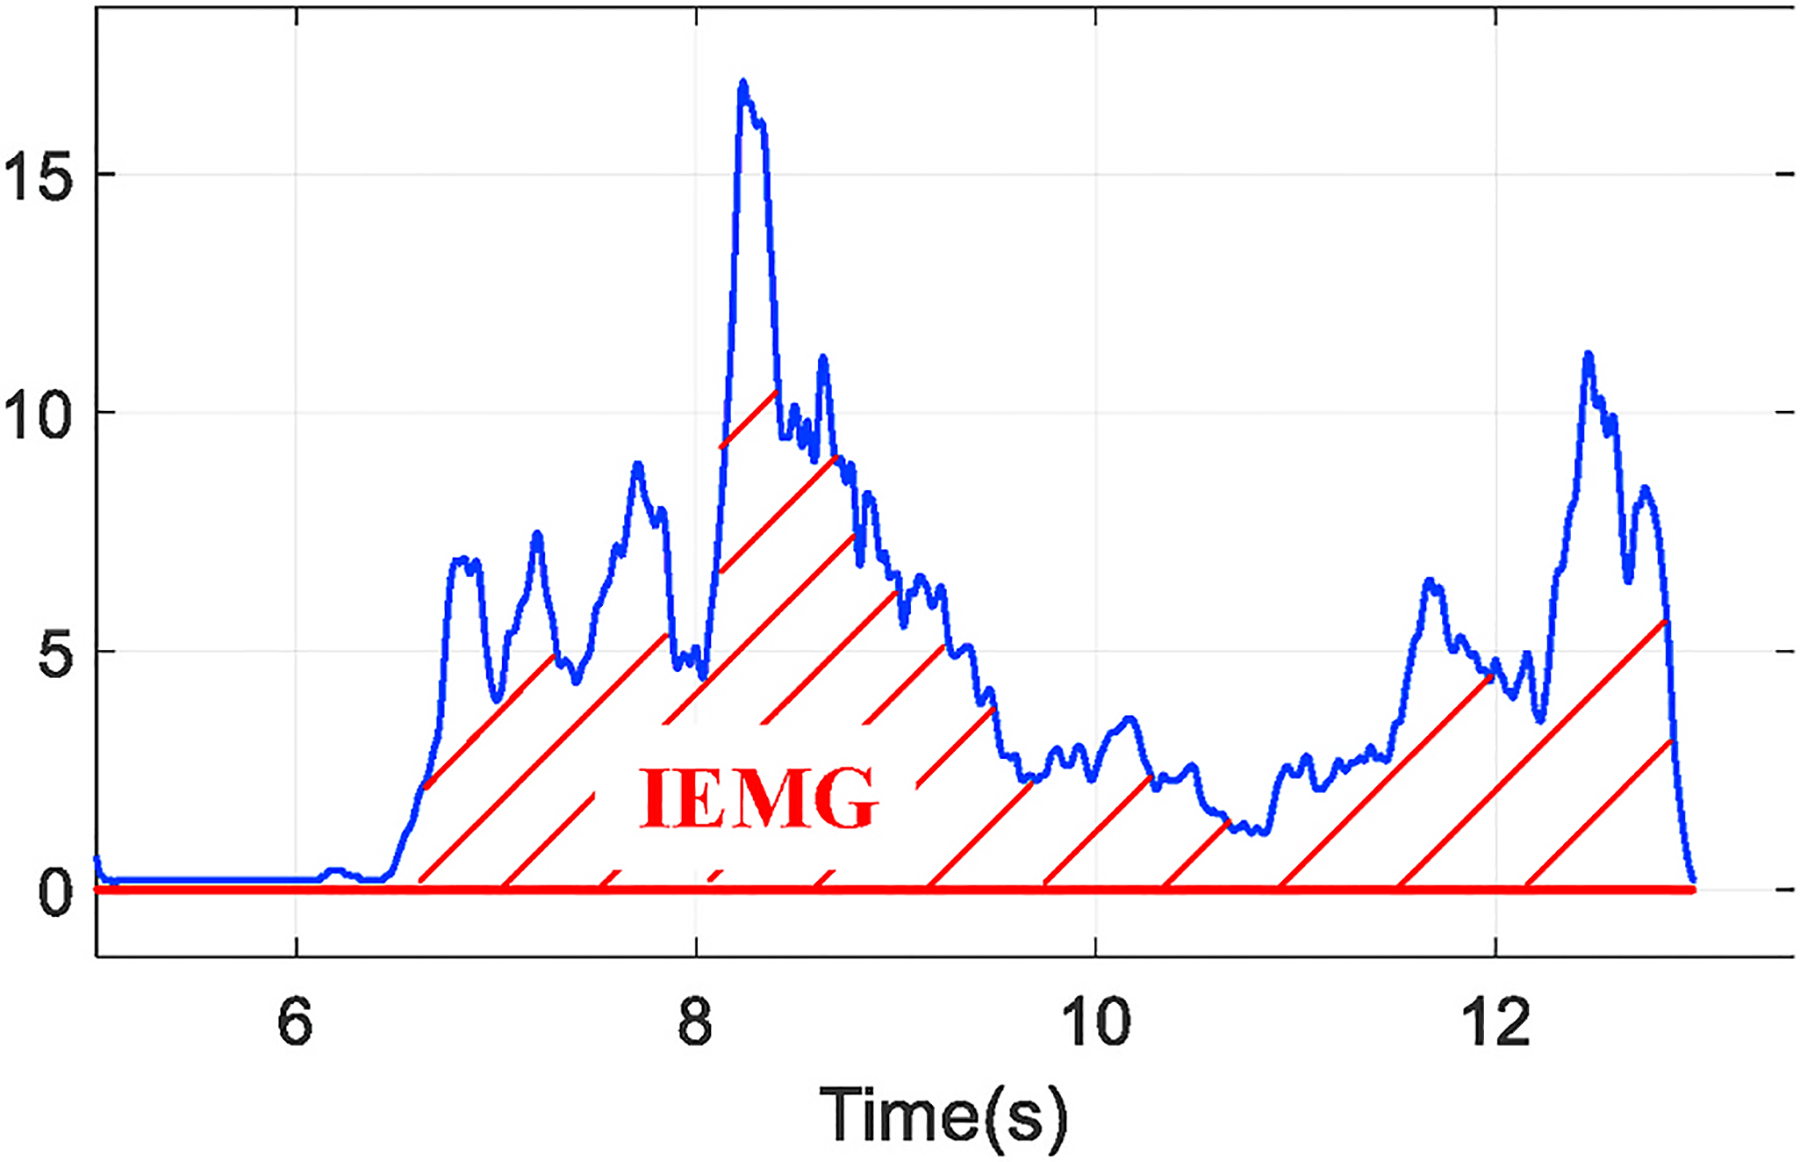
The integration of EMG signal (IEMG).
Fig. 18 shows the fitted lines of fatigue measurements for both EMG and our technique. The experiment includes 3 groups of workouts using weights of 9, 14 and 19 pounds respectively over the same subject. Because EMG has different measurement rationale with our technique, the scales of these values are different. However, from the correspondence between the slope value and actual weight being used, we validate that fatigue accumulates faster as we use heavier weights, which agrees with results measured by our technique as well.
Fig. 18.
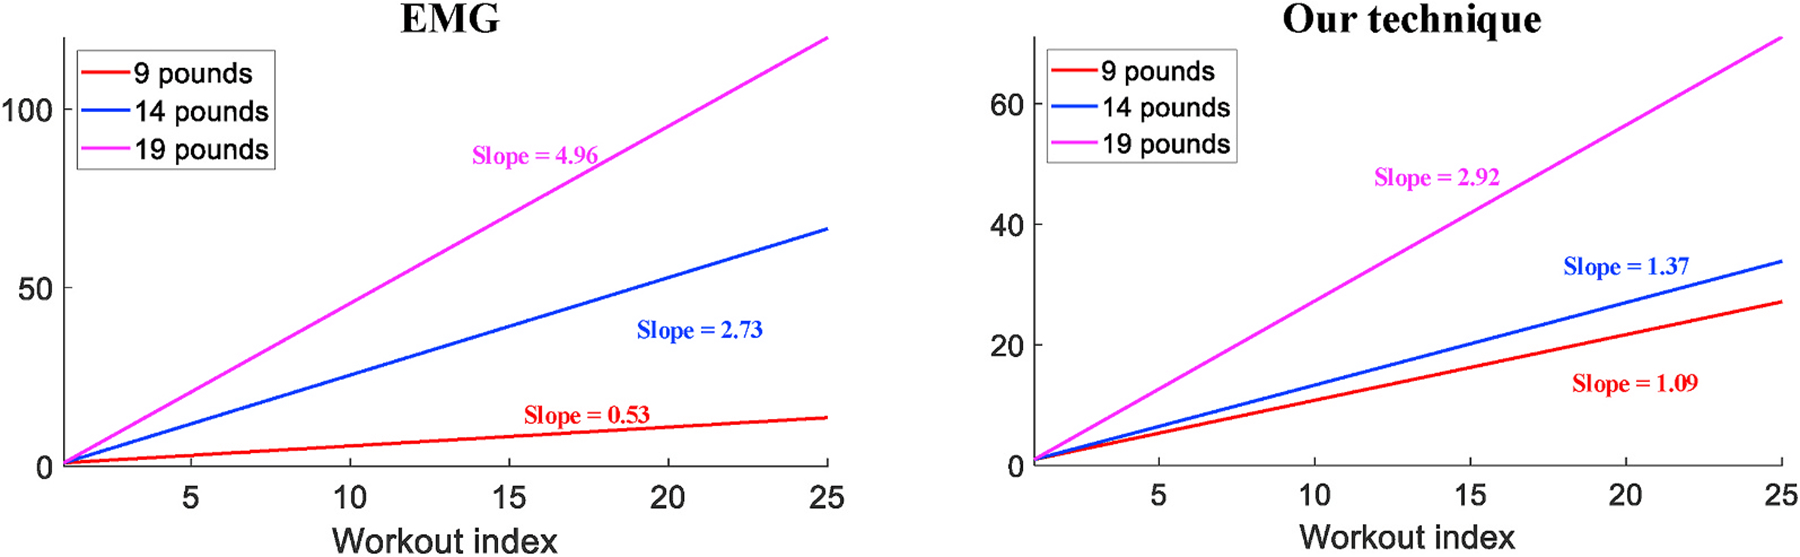
Slope values of 3 different weights measured by EMG and our technique.
We then evaluate our technique regarding its generality over more subjects with the same weight settings. Table 1 shows the slope values measured on all volunteers with different muscle strength, from which we still observe the same trend of increasing value when the weight gets heavier. Noticeably, each individual tends to have a value distinct from all the others. We consider such results are caused by muscle development and strength of different individuals, especially for subject #4 whose measurements are quite similar with different weights. Due to less exercises and training compared with others, the bicep muscle of subject #4 is much weaker, which causes the monitored data exhibiting little difference between isometric and isotonic contractions, as shown in Fig. 19. Unlike data collected from others that clearly shows the transition between these two phases such as the waveform in Fig. 9, subject #4’s data hinders the estimation of muscle tremor as well as the fatigue monitoring. For the rest majority of people, our technique can effectively quantify the speed of fatigue accumulation.
Table 1.
The speed of fatigue accumulation (slope value) over different subjects.
| Subject # | 9 Pounds | 14 Pounds | 19 Pounds |
|---|---|---|---|
| 1 | 1.28 | 1.51 | 3.64 |
| 2 | 0.42 | 0.95 | 2.34 |
| 3 | 1.02 | 1.62 | 3.22 |
| 4 | 0.52 | 0.46 | 0.65 |
| 5 | 1.09 | 1.37 | 2.92 |
Fig. 19.
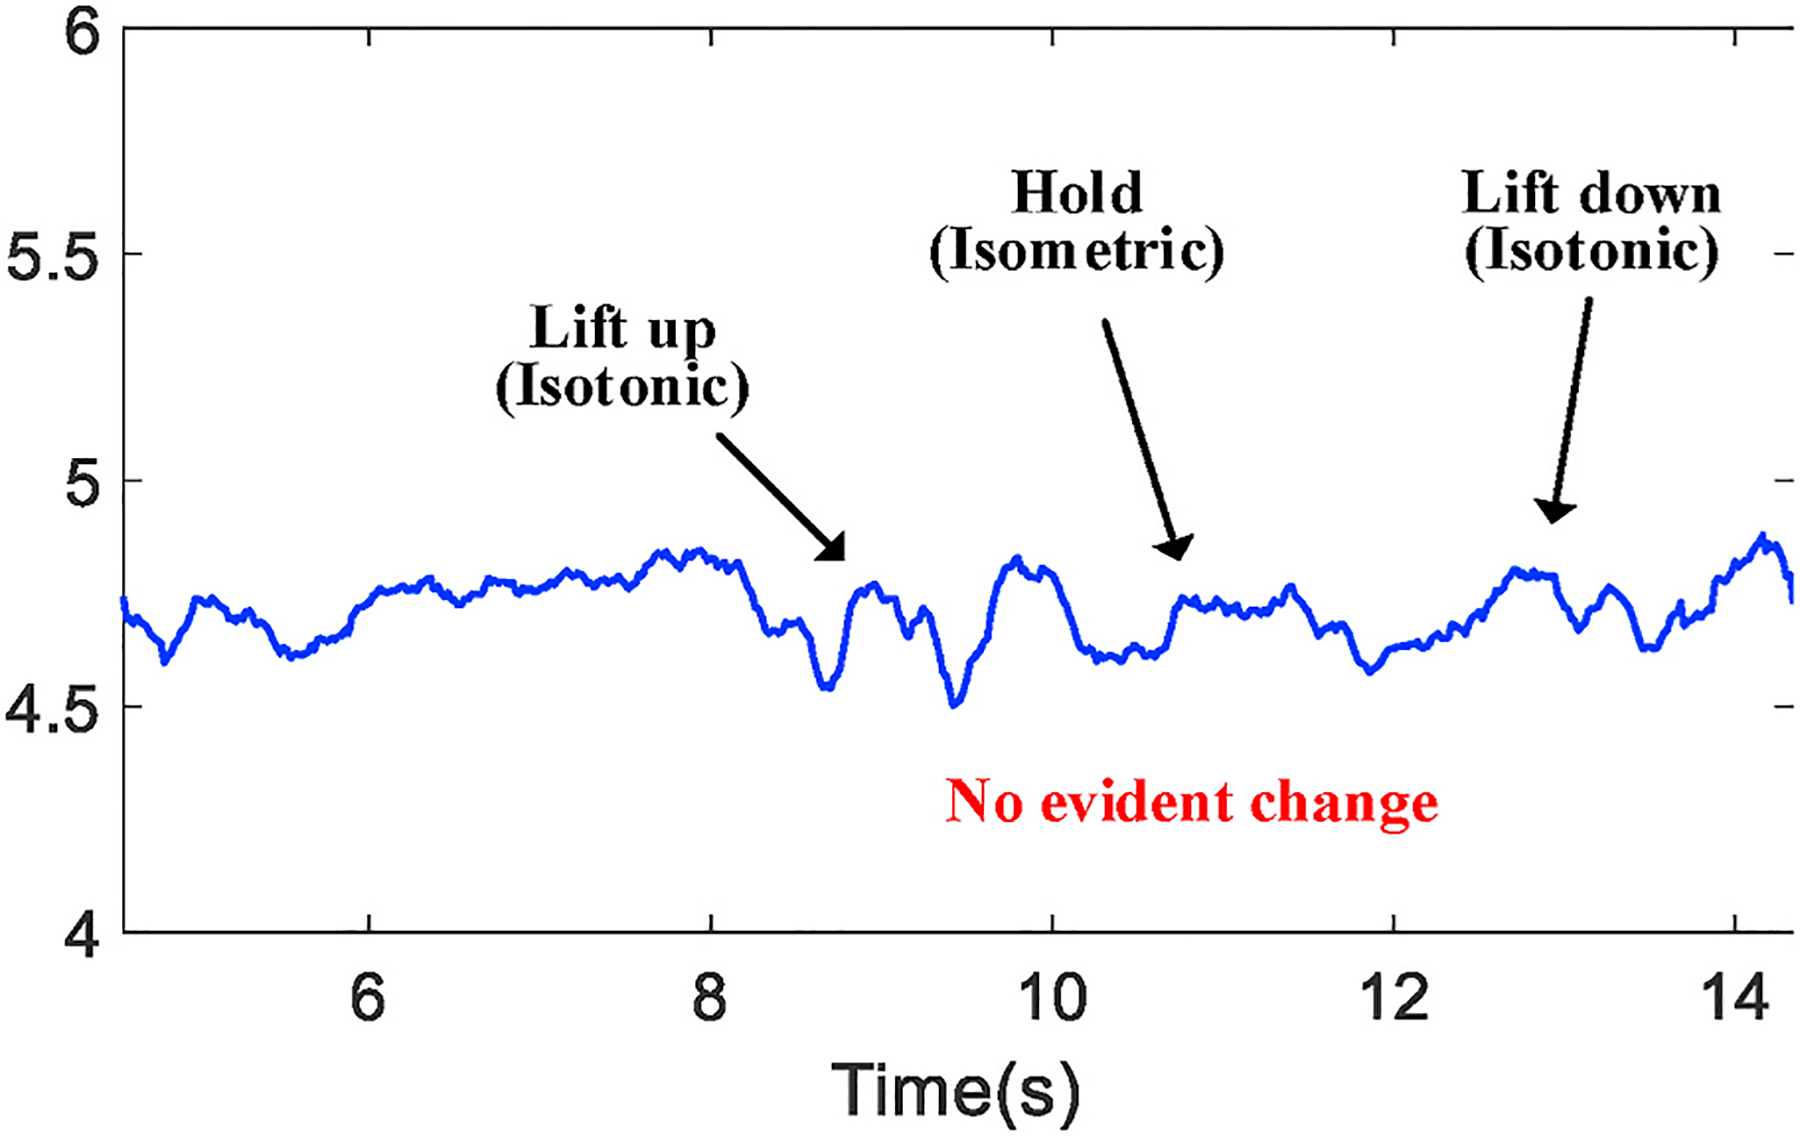
The data of subject #4 with weaker muscle.
6.2. Identifying the occurrence of fatigue
To justify that our technique is effective and consistent with the nature of muscle fatigue, we ask each subject to finish 3 groups (a session) of workouts using the same weight with an interval of 1 h. Then, given that later groups are conducted based on initial tiredness led by previous group(s), we consider that muscle fatigue, under the same weight, should occur earlier in later groups. As a result, we define a consistent test session as G1 > G2 > G3, where Gi is the workout index of fatigue boundary in group i. Then, our evaluation metric is the percentage of consistent sessions among all test sessions being finished.
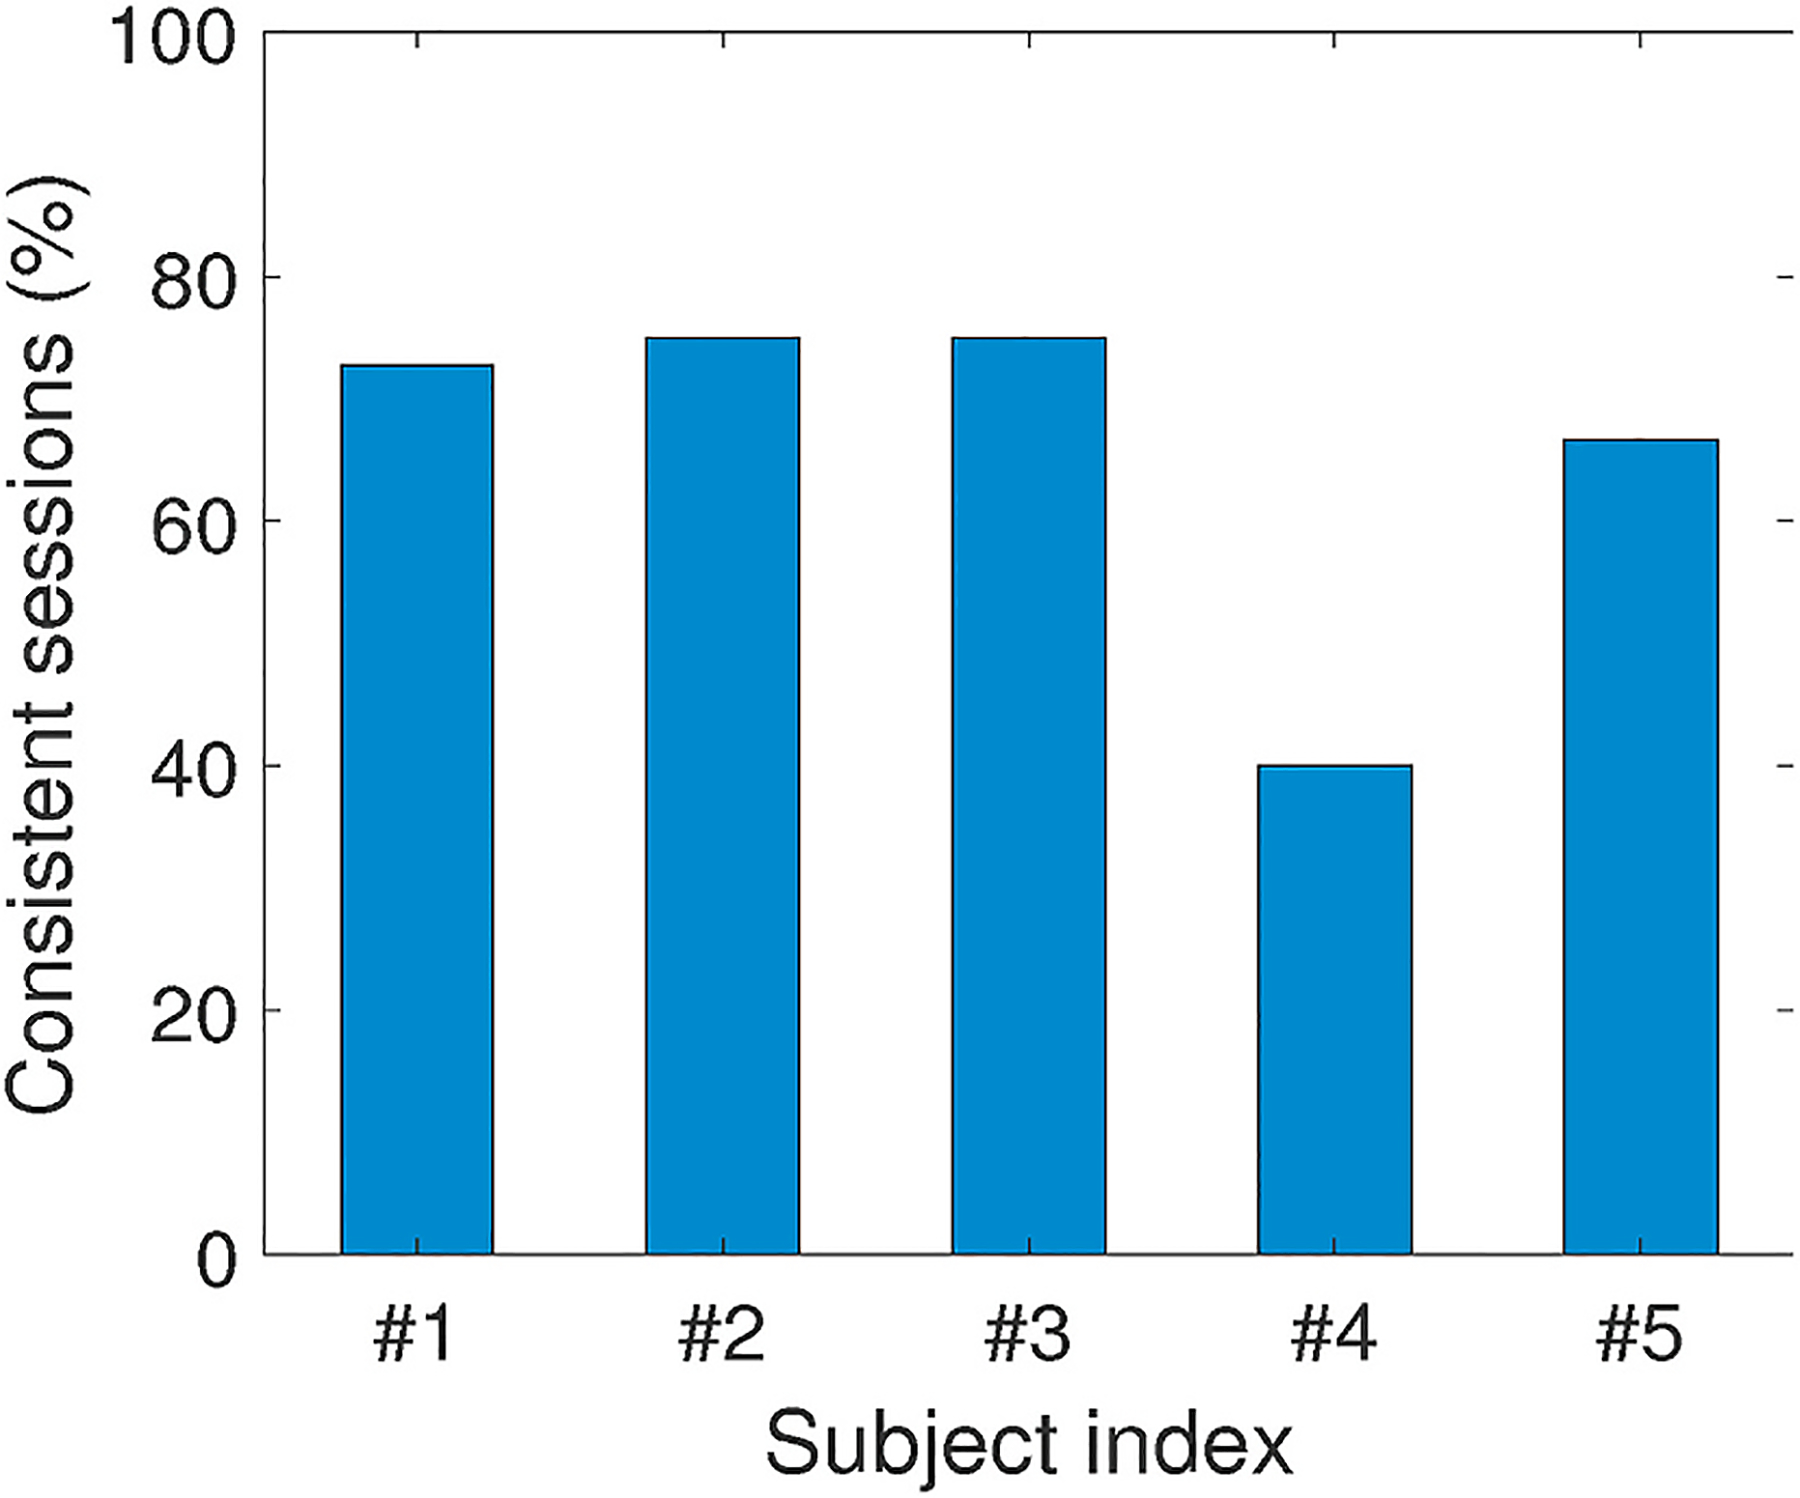
We collected 34 sessions of data over all the five volunteers and 23 sessions (67.6%) achieve the aforementioned consistency after the identification of fatigue occurrence. Fig. 20 presents the percentage of consistent sessions over 5 individuals, and our technique can achieve around 70% of consistency for the majority of participants. With the same reason for muscle weakness mentioned above, data of subject #4 produces only 40% of consistency. For all the other subjects, the ratio of consistency is generally higher than 75%.
Fig. 20.
Consistent sessions (%) of each individual.
For the 8 inconsistent sessions from all subjects except for subject #4, Fig. 21 shows the orders of fatigue boundaries in detail. We observe that only 1 session exhibits completely inverse order (G3 > G2 > G1), which is counter-intuitive for muscle fatigue. On the other hand, 4 out of 8 inconsistent sessions ranked the 1st group of workouts correctly but only mistakenly placed the 2nd and 3rd. Such inaccuracy between 2nd and 3rd groups is mainly caused by less evident cluster boundary after muscle exhaustion in the 1st group of that session. Since 1-h rest interval may not be sufficient enough for fatigue recovery, during the 2nd or 3rd group of tests workouts are performed with exhausted muscle that gets tired quickly. As shown in Fig. 22, the fatigue occurrence in the 3rd group is very close to that in the 2nd group, and both groups start to cluster the muscle as “fatigued” at the very beginning of the whole group. As described in Section 4.3, we initialize centroids of “fatigued” and “non-fatigue” clusters using the first and last workouts, the cluster boundaries in later groups shrink so that the data randomness produces this minor inconsistency.
Fig. 21.
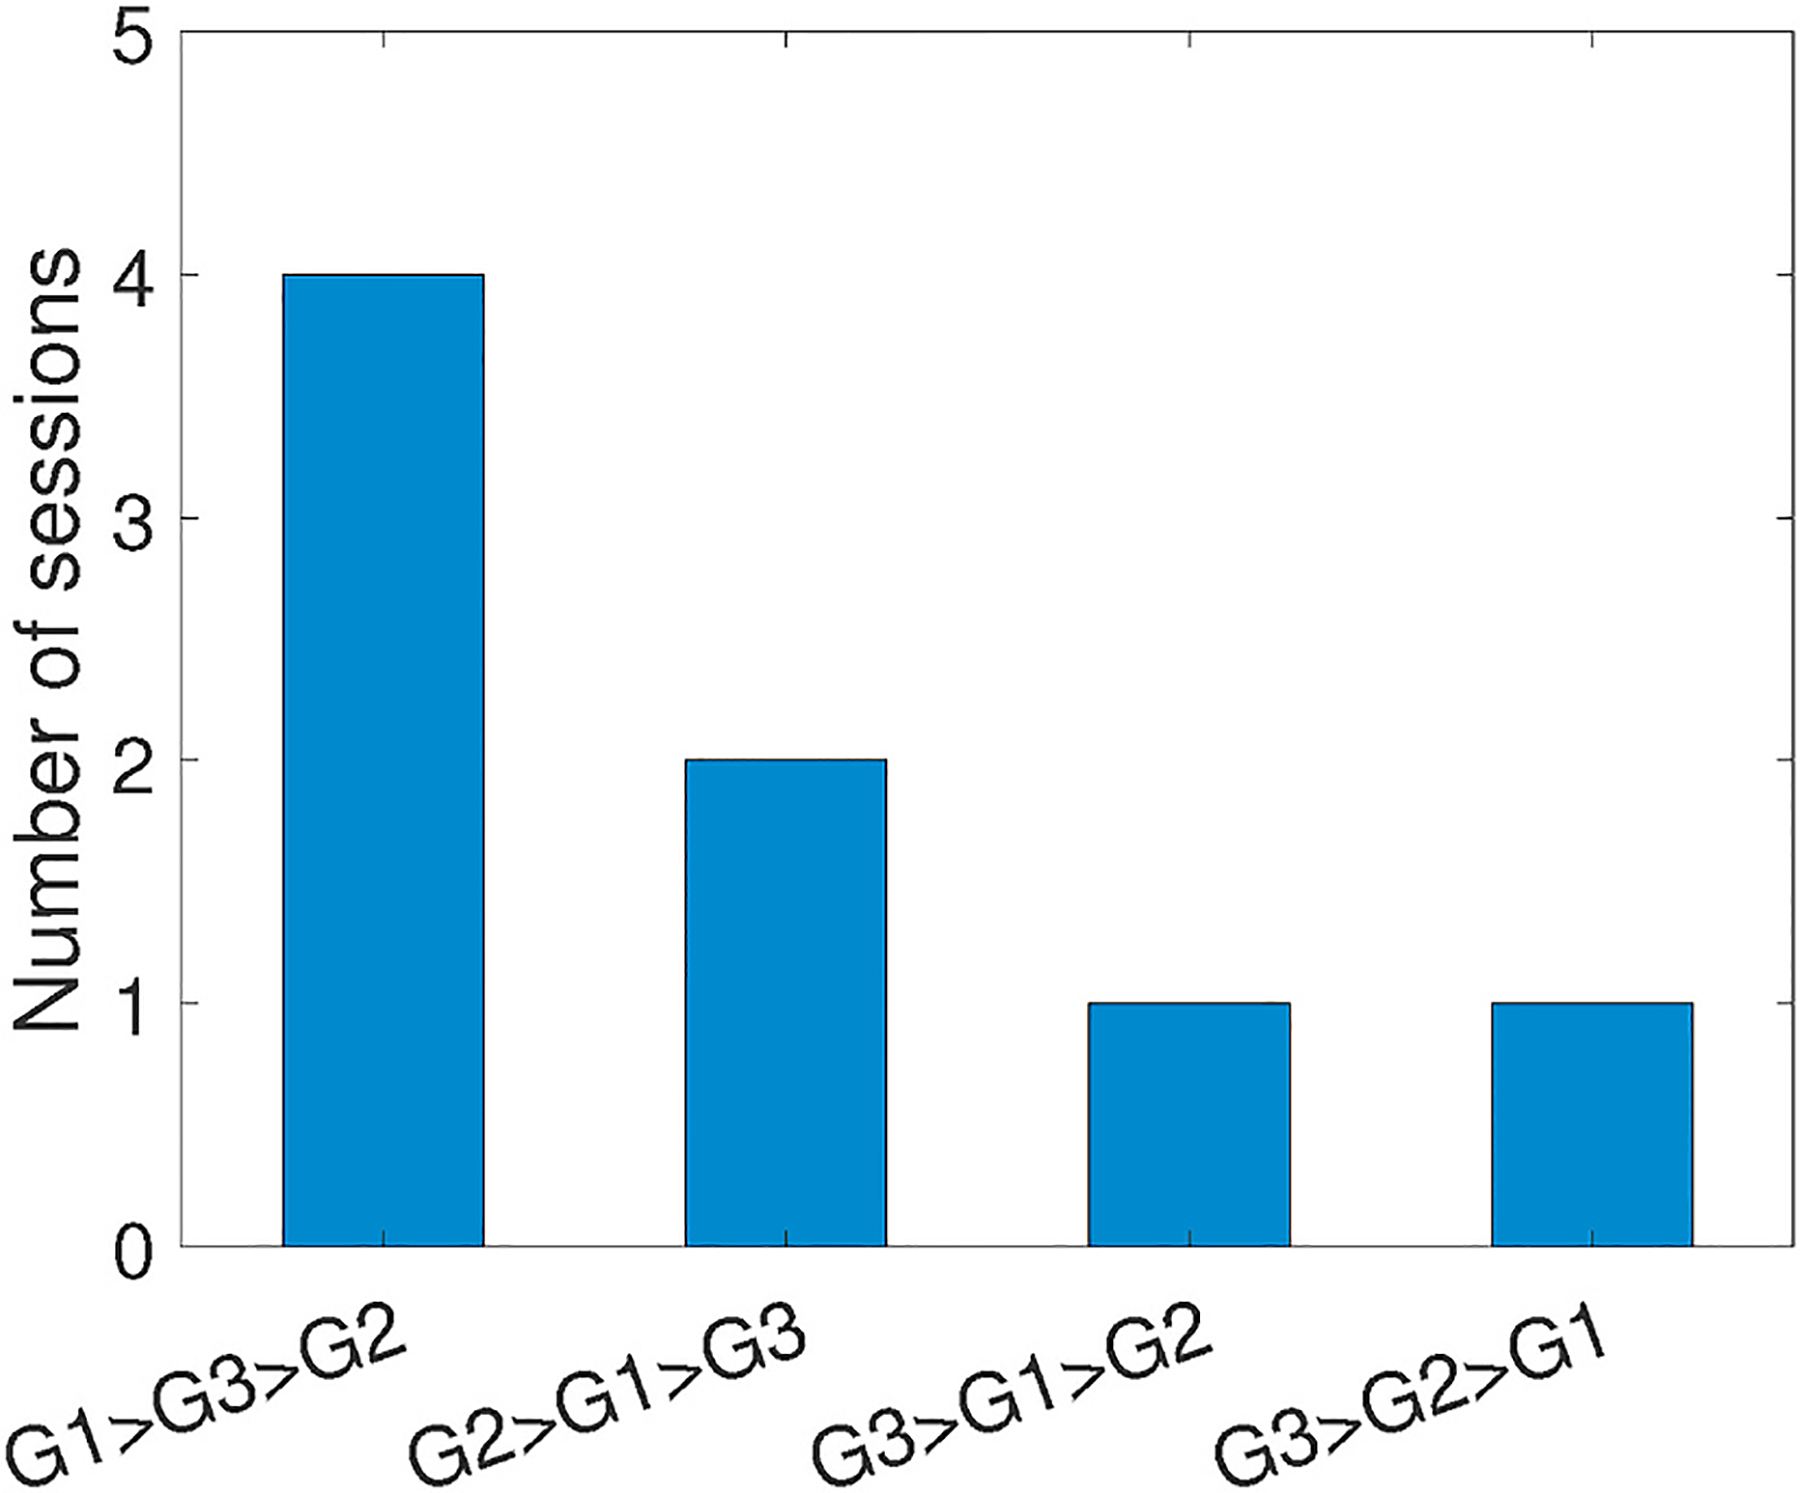
Cases of inconsistent sessions.
Fig. 22.
The inaccuracy between 2nd and 3rd groups.
Overall, these results demonstrate that the workout index discovered by our technique is a potential indicator of actual fatigue occurrence, and our technique bears more confidence when being applied to muscle without initial tiredness.
7. Related work
7.1. Muscle fatigue monitoring
Most systems for muscle fatigue monitoring are based on the EMG technique, which is non-invasive and widely adopted in clinic for the diagnosis of muscle disorders. However, clinical EMG equipment is too bulky to be carried for monitoring muscle fatigue produced in daily exercises out of clinic, the primary goal of these EMG-based systems is hence to make the measurement device portable and convenient. Chen et al. (2014) and Chang et al. (2012) designed lightweight circuitry with EMG sensors and a Bluetooth module that transmits the data wirelessly. Therefore, these systems can be attached to human body and monitor the fatigue through EMG signals produced during muscle exercises, but are generally expensive for patients to afford daily monitoring and evaluation. From another aspect to reduce the scale of on-body system, Dayan et al. (2012) proposed a fatigue monitoring system without using any micro-processor for the processing and transmission of EMG signal. Instead, they developed metrics of EMG spike and peak and used digital comparator and counter to monitor fatigue by counting the spikes. However, the monitoring accuracy of this system could be greatly impaired in many cases.
Besides EMG-based systems, many prior works exploit other sensing modalities for muscle fatigue monitoring. Vescio et al. (2011) modeled the fatigue as the bioimpedance change, so that they injected a small amount of electrical current into muscle and measured the electrical impedance. Being inspired by ultrasound imaging, AlMohimeed et al. (2013) integrated ultrasonic transducer into a piezoelectric film. Their system transmitted pulse signals and analyzed the echo to obtain the contraction information of small muscle on human body. However, all systems mentioned above require the attachment of sensors to human body. On the contrary, our technique is completely contactless, which is of great convenience for daily applications.
7.2. Mobile systems for health monitoring
In the past years, many mobile health systems have been built based on smartphones. For example, by using the smartphone camera, Bui et al. (2017) measures the blood oxygen level by analyzing the flashlight reflections from a fingertip. Qian et al. (2018) implements the electrocardiograms (ECG) on commodity smartphones that provide real-time heartbeat visualization. Bui et al. (2019) estimates the blood pressure level from human ear and realizes frequent blood pressure monitoring without affecting normal activities. To assess the health status, Balaji et al. (2019) analyzes the pH of sweat using pulse oximeter and can be integrated into smartwatches. Given the devastating consequences of myopathy and lifelong requirements of progression tracking, our technique implemented on commodity smartphones is the first mobile system targeting on muscle health monitoring.
8. Discussions
8.1. Monitoring people with obesity
Obese people tend to have extra body fat, which may make the skeletal muscle less observable. Although our technique correlates fatigue by monitoring the tremor of muscle, it does not attempt to penetrate any human tissue due to the low power of the ultrasound signal transmitted by smartphone. Instead, we monitor the external change of the muscle shape (e.g., arm shaking) caused by fatigue-induced tremor. Hence, since the fat tissue at the body surface can also reflect tremor externally, such differences on people with obesity will not impact the effectiveness of our proposed technique.
8.2. Monitoring different muscles and exercises
Our work primarily targets on the bicep muscle that is the simplest for experimental setup, but our technique could be easily generalized to other skeletal muscles, because tremor widely happens in all muscles (Lippold, 1981) and the data processing and analyzing approaches being applied on bicep muscle can be similarly adopted to other muscles. On the other hand, different muscle exercises may cause difficulty in setting up the position of smartphone. For example, when doing bicep workouts, the upper arm can be steadily held in bicep exercises in order to limit movements that affect the acoustic channel estimation. However, during deep squatting that trains quadriceps and requires entire leg movements, the monitoring smartphone cannot be stationary. In such cases, our system can be attached to muscle using a strap, and the tremor can be monitored from the closest sub-channel. Since the smartphone is relatively stationary with respect to the muscle, body movements will have the minimum impact on our evaluation accuracy.
8.3. Variation among human beings
As shown in Section 6, our technique has noticeably different measurements over certain individuals. This is expected, since people always have different muscle strengths that are difficult to be adapted in our protocol. To ensure that most subjects can feel muscle fatigue, our standardized protocol stipulates the same weight settings and a terminating condition of a test group as “difficult to follow the protocol”. As a result, low data quality of certain individuals may cause heterogeneous performance, not only because of their weaker muscle, but also because of their limited efforts and willingness of doing standard bicep workouts with heavier weights.
9. Conclusion
In this paper, we present a novel technique that evaluates muscle fatigue from commodity smartphones. Our technique measures disturbances of acoustic channels caused by muscle tremor, and interprets the variations of channels into fatigue level. As the preliminary target, we further analyze muscle fatigablity with specifically designed protocol for bicep workout. Evaluation results over multiple human individuals show that our system can achieve consistency with clinical EMG device on measuring the accumulation speed of fatigue, and 70% accuracy when being used to identify the occurrence of fatigue.
Acknowledgment
We thank the anonymous reviewers for their comments and feedback. This work was supported in part by the National Science Foundation (NSF) under grant number CNS-1812399, CNS-1812407 and CNS-2029520.
Footnotes
Declaration of competing interest
The authors declare that they have no known competing financial interests or personal relationships that could have appeared to influence the work reported in this paper.
Each sub-channel corresponds to a distance of Vs/2B, where Vs is the speed of sound (340 m/s) and B is the bit rate.
References
- Allum J, Dietz V, & Freund H (1978). Neuronal mechanisms underlying physiological tremor. Journal of Neurophysiology, 41(3), 557–571. [DOI] [PubMed] [Google Scholar]
- AlMohimeed I, Turkistani H, & Ono Y (2013). Development of wearable and flexible ultrasonic sensor for skeletal muscle monitoring. In Ieee international ultrasonics symposium (Ius) (pp. 1137–1140). IEEE. [Google Scholar]
- Angelini C, & Tasca E (2012). Fatigue in muscular dystrophies. Neuromuscular Disorders, 22, S214–S220. [DOI] [PMC free article] [PubMed] [Google Scholar]
- Balaji AN, Yuan C, Wang B, Peh L-S, & Shao H (2019). ph watch-leveraging pulse oximeters in existing wearables for reusable, real-time monitoring of ph in sweat. In Proceedings of the 17th annual international conference on mobile systems, applications, and services (pp. 262–274). [Google Scholar]
- Bui N, Nguyen A, Nguyen P, Truong H, Ashok A, Dinh T, … Vu T (2017). Pho2: Smartphone based blood oxygen level measurement systems using near-ir and red wave-guided light. In Proceedings of the 15th ACM conference on embedded network sensor systems (pp. 1–14). [Google Scholar]
- Bui N, Pham N, Barnitz JJ, Zou Z, Nguyen P, Truong H, Xiao J, et al. (2019). ebp: A wearable system for frequent and comfortable blood pressure monitoring from user’s ear. In The 25th annual international conference on mobile computing and networking (pp. 1–17). [Google Scholar]
- Calbet JA (2006). The rate of fatigue accumulation as a sensed variable. The Journal of Physiology, 575(Pt 3), 688. [DOI] [PMC free article] [PubMed] [Google Scholar]
- Chang K-M, Liu S-H, & Wu X-H (2012). A wireless semg recording system and its application to muscle fatigue detection. Sensors, 12(1), 489–499. [DOI] [PMC free article] [PubMed] [Google Scholar]
- Chen S-W, Liaw J-W, Chan H-L, Chang Y-J, & Ku C-H (2014). A real-time fatigue monitoring and analysis system for lower extremity muscles with cycling movement. Sensors, 14(7), 12410–12424. [DOI] [PMC free article] [PubMed] [Google Scholar]
- Christodoulou C (2005). The assessment and measurement of fatigue, Fatigue as a window to the brain.
- Ciafaloni E, Fox DJ, Pandya S, Westfield CP, Puzhankara S, Romitti PA,, … Miller LA, et al. (2009). Delayed diagnosis in duchenne muscular dystrophy: data from the muscular dystrophy surveillance, tracking, and research network (md starnet). The Journal of Pediatrics, 155(3), 380–385. [DOI] [PMC free article] [PubMed] [Google Scholar]
- Cifrek M, Medved V, Tonković S, & Ostojić S (2009). Surface emg based muscle fatigue evaluation in biomechanics. Clinical Biomechanics, 24(4), 327–340. [DOI] [PubMed] [Google Scholar]
- Dayan O, Spulber I, Eftekhar A, Georgiou P, Bergmann J, & McGregor A (2012). Applying emg spike and peak counting for a real-time muscle fatigue monitoring system. In IEEE biomedical circuits and systems conference (BioCAS) (pp. 41–44). IEEE. [Google Scholar]
- Gajewski J (2006). Fatigue-induced changes in tremor caused by physical efforts of different volume and intensity. Acta of Bioengineering and Biomechanics, 8(2), 103. [Google Scholar]
- Gandevia SC (2001). Spinal and supraspinal factors in human muscle fatigue. Physiological Reviews, 81(4), 1725–1789. [DOI] [PubMed] [Google Scholar]
- Lippold O (1981). The tremor in fatigue. In Ciba found symp (Vol. 82, pp. 234–248). Wiley Online Library. [DOI] [PubMed] [Google Scholar]
- Merletti R, & Parker PJ (2004). Electromyography: Physiology, engineering, and non-invasive applications (Vol. 11). John Wiley & Sons. [Google Scholar]
- Morrison S, Kavanagh J, Obst S, Irwin J, & Haseler L (2005). The effects of unilateral muscle fatigue on bilateral physiological tremor. Experimental Brain Research, 167(4), 609–621. [DOI] [PubMed] [Google Scholar]
- Muscle physiology. http://muscle.ucsd.edu/musintro/contractions.shtml.
- Muscular dystrophy statistics. https://www.cdc.gov/ncbddd/musculardystrophy/data.html.
- Neuroscience. https://nba.uth.tmc.edu/neuroscience/m/s3/chapter01.html.
- Pukkila M (2000). Channel estimation modeling. Nokia Research Center, 17, 66. [Google Scholar]
- Qian K, Wu C, Xiao F, Zheng Y, Zhang Y, Yang Z, & Liu Y (2018). Acousticcardiogram: Monitoring heartbeats using acoustic signals on smart devices. In IEEE INFOCOM 2018-IEEE conference on computer communications (pp. 1574–1582). IEEE. [Google Scholar]
- Sa-Ngiamsak T, Assessment of muscle fatigue in work related musculoskeletal disorders by high-density surface electromyogtaphy.
- Sahlin K (1986). Muscle fatigue and lactic acid accumulation., Acta physiologica Scandinavica. Supplementum, 556, 83–91. [PubMed] [Google Scholar]
- Stokes M, & Dalton P (1991). Acoustic myography for investigating human skeletal muscle fatigue. Journal of Applied Physiology, 71(4), 1422–1426. [DOI] [PubMed] [Google Scholar]
- Tarata M, Spaepen A, & Puers R (2001). The accelerometer mmg measurement approach, in monitoring the muscular fatigue. Measurement Science Review, 1(1), 47–50. [Google Scholar]
- Vescio G, Rosell J, Nescolarde L, & Giovinazzo G (2011). Muscle fatigue monitoring using a multifrequency bioimpedance technique. In 5th European conference of the international federation for medical and biological engineering (pp. 1257–1260). Springer. [Google Scholar]
- Warburton D, Gledhill N, Jamnik V, Krip B, & Card N (1999). Induced hypervolemia, cardiac function, vo2max, and performance of elite cyclists. Medicine & Science in Sports & Exercise, 31(6), 800–808. [DOI] [PubMed] [Google Scholar]
- Yun S, Chen Y-C, Zheng H, Qiu L, & Mao W (2017). Strata: Fine-grained acoustic-based device-free tracking. In Proceedings of the 15th annual international conference on mobile systems, applications, and services (pp. 15–28). [Google Scholar]