Abstract
Background:
Poorly controlled diabetes mellitus (DM) increases the risk for periprosthetic joint infection (PJI) after total joint arthroplasty (TJA). While institutional protocols include hemoglobin A1c (HbA1c) screening in TJA patients, the costs and benefits of routine preoperative screening have not been described.
Methods:
The authors created a decision tree model to evaluate short-term costs and risk reduction for PJIs with routine screening of primary total hip arthroplasty (THA) and total knee arthroplasty (TKA) patients. Probabilities and costs were obtained from published sources. They calculated net costs and absolute risk reduction in PJI for routine screening versus no screening. The authors also performed sensitivity analyses of model inputs including probabilistic sensitivity analyses (PSAs) consisting of 10,000 Monte Carlo simulations.
Results:
In patients with DM, routine screening before THA resulted in net cost savings of $81 per patient with 286 patients needing to be screened to prevent 1 PJI, while screening before TKA incurred net additional costs of $25,810 per PJI prevented. Routine screening in patients with DM undergoing THA or TKA was cost-saving across 75.5% or 21.8% of PSA simulations, respectively. In patients with no history of DM, routine screening before THA or TKA incurred net additional costs of $24,583 or $87,873 per PJI prevented, respectively.
Conclusions:
Routine HbA1c screening in patients with DM prior to THA with referral of patients with elevated HbA1c for glycemic optimization may prevent PJI and reduce healthcare costs. In contrast, routine screening in patients with DM prior to TKA or in patients with no history of DM is not cost-saving.
Level of Evidence:
Economic Level IV.
Keywords: A1c, cost-effectiveness, diabetes, joint replacement
INTRODUCTION
Total joint arthroplasty (TJA) is the most common procedure for U.S. Medicare beneficiaries, incurring annual costs of over $6 billion.1,2 Based on recent projections, the annual incidence of total hip or knee arthroplasties (THAs or TKAs) in the U.S. will reach 635,000 and 1.26 million, respectively, by 2030.3–5 The economic burden of TJA has stimulated efforts by health payers (e.g., Medicare) to reduce costs and complications in the face of finite health-care resources,6 including implementation of innovative payment systems such as the Bundled Payments for Care Improvement program. Consequently, recent research has focused on identifying modifiable risk factors for post-surgical complications.7–9 Periprosthetic joint infection (PJI) is a well-studied complication, affecting approximately 1% of primary TJA procedures and causing a multifold increase in cost.7,10–13
Diabetes mellitus (DM) is a known risk factor for infectious complications after TJA.14–20 Compared to patients with controlled DM, patients with poorly controlled DM, defined clinically or biochemically, are twice as likely to develop a postoperative infection.21 Multiple studies have found an association between the risk of postoperative infection (e.g., PJI) and hemoglobin A1c (HbA1c) that was greater than 7% to 8%.22–26 That threshold is an often cited marker for delaying TJA in favor of medical optimization in patients with DM,27–32 despite a lack of studies on the cost-benefit profile of HbA1c screening in this population. Furthermore, in addition to existing institutional protocols for screening patients with known DM, two recent studies recommended the inclusion of patients without a prior diagnosis of DM in routine preoperative HbA1c screening protocols to prevent short-term complications such as PJI and long-term sequelae of undiagnosed DM.27,33 While screening for type 2 DM in asymptomatic individuals is generally considered cost-effective over the long term,34 the cost-effectiveness of routine HbA1c screening in patients without known DM specifically for preventing arthroplasty-related complications such as PJI remains unproven.
In this study, the authors aimed to evaluate the costs and benefits, in terms of PJIs prevented, of routine preoperative HbA1c screening in patients with and without known DM undergoing primary THA and TKA. This study tests the null hypothesis that routine HbA1c screening in the TJA population is not cost-saving in terms of PJIs prevented.
MATERIALS AND METHODS
Ethical Review and Study Design
Because all data used in this study is publicly available and deidentified, the Stanford University Institutional Review Board determined that it was exempt from institutional review board approval. Informed patient consent was not required.
Decision Analysis Model
Using TreeAge Pro (TreeAge Software Inc; Williamstown, MA), the authors constructed decision trees to model HbA1c screening versus no screening prior to primary THA or TKA from a U.S. health payer perspective and with a time horizon of 1 year (Figure 1, Figure A1 [See A1 in Supplemental Digital File, Supplemental Digital Content 1, http://links.lww.com/COP/A59, which shows decision tree scheme for routine preoperative HbA1c screening.] ). In the model, patients with diabetes were divided into those above and below a predefined HbA1c threshold of greater than 7% (defined as uncontrolled DM). Patients above the HbA1c threshold were modeled to experience an increased risk of PJI, denoted by the relative risk (risk ratio). The risk ratio is defined as:
Figure 1.
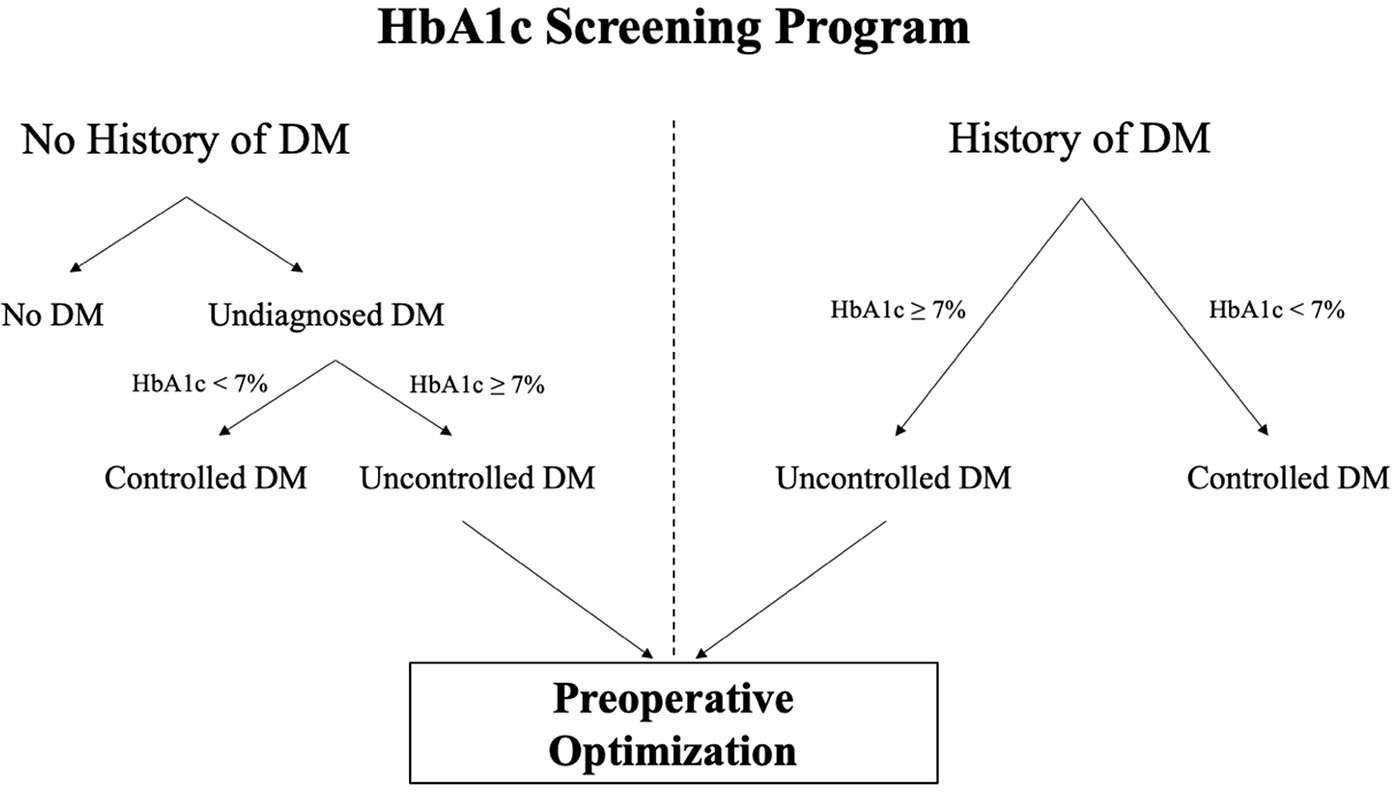
Model of routine hemoglobin A1c (HbA1c) screening programs in patients with or without a history of diabetes mellitus (DM). Patients with a history of DM can be identified by a review of their medical record and/or clinical interview.
Thus, the probability of PJI in patients with uncontrolled DM was calculated by multiplying this risk ratio by the probability of PJI in patients with controlled DM. All screening strategies also modeled a subsequent glycemic intervention for patients who screened above the threshold. This glycemic intervention had a defined success rate (Table 1) and above-threshold patients successfully treated by this intervention were considered to have controlled DM in the calculation of PJI risk. Patients with HbA1c that was less than 7% (defined as controlled DM) were not candidates for the modeled intervention because they already had controlled DM. The threshold for uncontrolled DM was varied to greater than 8% in a sensitivity analysis. In this model, PJI was treated with a two-stage revision. Probability and cost inputs for the model are shown in Table 1.
Table 1.
Model Input Parameters.
| Input parameter | Estimate (95% CI) | Reference | |
|---|---|---|---|
|
| |||
| Probabilities | Prevalence of undiagnosed DM in TJA population | ||
| Total hip arthroplasty | 52/709 | 33 | |
| Total knee arthroplasty | 71/574 | 33 | |
|
| |||
| Prevalence of uncontrolled diabetes in patients with DM | |||
| HbA1c ≥7% | 7,571/21,005 | 24,42,50 | |
| HbA1c ≥8% | 146/1,645 | 24 | |
| Ratio of uncontrolled diabetes† in patients with no history of DM compared to patients with DM | 0.746 (0.598 – 0.930) | 39 | |
|
| |||
| Probability of PJI | |||
| Baseline, all | |||
| Total hip arthroplasty | 15/5,060 | 11 | |
| Total knee arthroplasty‡ | 69/6,859 | 11 | |
| Patients with controlled DM | |||
| Total hip arthroplasty | 69/6,859 | 22 | |
| Total knee arthroplasty‡ | 147/14,921 | 23 | |
| Relative risk of PJI with uncontrolled DM | |||
| Total hip arthroplasty | 2.6 (1.9 – 3.4) | 22 | |
| Total knee arthroplasty | 1.7 (1.2 – 2.4) | 23 | |
|
| |||
| Probability of intervention success | |||
| HbA1c target <7% | 35/59 | 37 | |
| HbA1c target <8% | 21/30 | 37 | |
|
| |||
| Costs | Cost of primary TJA | $21,106 | CMS |
|
| |||
| Cost of HbA1c test | $9.71 | CLFS | |
|
| |||
| Cost of glycemic intervention | |||
|
| |||
| Evaluation and management* | $76.15 | CMS | |
| Medical nutrition initial evaluation | $38.25 | CMS | |
| Medical nutrition follow-up | $33.20 | CMS | |
| Medical nutrition group session | $17.32 | CMS | |
| Metformin 500 mg (8-month supply) | $12.20 | FSS | |
|
| |||
| Cost of two-stage revision | |||
| Hip | $59,714 (56,421 – 64,189) | 51 | |
| Knee | $58,211 (55,463 – 62,420) | 51 | |
Calculated using their data.
Since the estimate for rate of PJI in patients with controlled DM is similar to the baseline rate, the authors used the same lower estimate for both inputs in the analysis of patients with no known history of DM.
By primary care physician or endocrine specialist.
CI, confidence interval. DM, diabetes mellitus. HbA1c, hemoglobin A1c. TJA, total joint arthroplasty. PJI, periprosthetic joint infection. CMS, Centers for Medicare and Medicaid Services. CLFS, Clinical Lab Fee Schedule. FSS, Federal Supply Schedule.
The authors only examined the postoperative complication of PJI because of its considerable morbidity and cost. They made several assumptions: 1) Although studies have characterized a 2-to-3-fold increased risk of PJI with uncontrolled DM,21,35 there is no universal HbA1c threshold that defines uncontrolled DM. This study is based on recent data showing an increased risk of PJI above HbA1c of 7% to 8%.22,23 Other studies have found an increased risk of postoperative infection at comparable HbA1c thresholds.24,36 Due to data showing that the risk of PJI increases linearly through HbA1c of 7% without sharp discontinuity, the authors assumed that differences in risk with using HbA1c thresholds of 7% or 8% were negligible. Therefore, they applied the risk ratio of PJI with uncontrolled diabetes (Table 1) to all patients with HbA1c greater than or equal to the threshold. 2) All patients achieving HbA1c below the threshold were considered to have controlled DM with a lower risk of PJI. 3) They modeled a preoperative glycemic intervention consisting of three visits to a primary care physician or endocrine specialist, evaluation by a dietician with one follow-up and one group session, and pharmacologic therapy.37,38 To account for variations in intervention cost based on individual needs, the authors performed additional sensitivity analyses on that variable.
Probabilities and Costs
All probabilities were obtained from published sources. Since there were no published estimates for the prevalence of uncontrolled diabetes in patients with undiagnosed DM in the arthroplasty literature, the authors utilized data from a national, cross-sectional study to calculate the prevalence ratio:39
By multiplying this ratio by the prevalence of uncontrolled DM in arthroplasty patients with diagnosed DM (denominator), they obtained the estimate for the prevalence of uncontrolled DM in arthroplasty patients with undiagnosed DM (numerator). Given the low incidence of PJI, the odds ratio for PJI with uncontrolled DM was approximated as a risk ratio. When prevalence data were available from multiple sources, they were pooled into a single estimate.
All costs were obtained from published sources or from publicly available Centers for Medicare and Medicaid Services (CMS) datasets and adjusted to 2020 U.S. dollars using the consumer price index. The authors derived the cost of the index TJA using previous methods.40 The cost of pharmacologic therapy was modeled to be equivalent to an 8-month supply of metformin. Since their time horizon was 1 year, no discounting was required.
Sensitivity Analyses
The authors performed one-way sensitivity analyses by varying inputs within their 95% confidence intervals (where available) or from 50% to 150% of their base value. To simultaneously account for uncertainty in all model inputs, they performed probabilistic sensitivity analyses (PSAs) consisting of 10,000 Monte Carlo simulations with sampling from uncertainty distributions of each model input. When uncertainty estimates were unavailable, they assumed a coefficient of variation of 10%. The authors modeled probabilities using beta distributions, risks using log-normal distributions, and costs using normal distributions. All inputs used for the sensitivity analyses are provided in Table A1 (See A1 in Supplemental Digital File, Supplemental Digital Content 1, http://links.lww.com/COP/A59, which shows ranges used in sensitivity analyses and probabilistic sensitivity analysis parameters.).
RESULTS
HbA1c Screening in Patients With Diabetes Mellitus
Table 2 illustrates the costs and benefits of routine HbA1c screening (including both screening and subsequent intervention) compared to no screening. Screening patients with DM undergoing THA resulted in a net cost savings of $81 per patient, with 286 patients needing to be screened to prevent a single PJI. The cost savings of screening was most sensitive to the probabilities of PJI and success rate of lowering HbA1c (Figure A2, in Supplemental Digital File, Supplemental Digital Content 1, http://links.lww.com/COP/A59, which is a tornado diagram showing the sensitivity to variation in model inputs.). Generally, screening saved money if the overall probability of PJI was high, the risk of PJI with uncontrolled DM was high, or the glycemic intervention was more effective or less costly. Thus, screening remained cost-saving if the probability of PJI with controlled DM was greater than 0.6%, the risk ratio of PJI (which is multiplied with the probability of PJI with controlled DM to obtain the probability of PJI with uncontrolled DM) with uncontrolled DM was greater than 2.0%, and the success rate of lowering HbA1c was greater than 36.4% (Table 3). Routine screening saved money if intervention cost less than $553 (Figure 2A). When the HbA1c threshold was increased to greater than 8%, screening patients with DM undergoing THA resulted in a net cost savings of $22 per patient, with 983 patients needing to be screened to prevent a single PJI.
Table 2.
Costs and outcomes of HbA1c screening strategies.
| Strategy* | Cost | Probability of PJI | Number needed to screen† | |
|---|---|---|---|---|
|
| ||||
| Total hip arthroplasty |
Patients with diabetes mellitus
|
|||
| No HbA1c screening | $22,059 | 1.5962% | - | |
| Routine HbA1c screening | $21,979 | 1.2460% | 286 | |
|
| ||||
| Patients with no history of diabetes mellitus | ||||
|
| ||||
| No HbA1c screening | $21,333 | 0.0038% | - | |
| Routine HbA1c screening | $21,338 | 0.0036% | 5,189 | |
|
| ||||
| Total knee arthroplasty | Patients with diabetes mellitus | |||
|
| ||||
| No HbA1c screening | $21,830 | 1.2429% | - | |
| Routine HbA1c screening | $21,869 | 1.0900% | 654 | |
|
| ||||
| Patients with no history of diabetes mellitus | ||||
|
| ||||
| No HbA1c screening | $21,693 | 1.0091% | - | |
| Routine HbA1c screening | $21,706 | 0.9949% | 7,046 | |
PJI, periprosthetic joint infection. HbA1c, hemoglobin A1c.
All strategies include screening and subsequent glycemic intervention.
Number needed to screen to prevent a single PJI.
Table 3.
Sensitivity of results to probability of achieving HbA1c target of less than 7% in patients with diabetes mellitus.
| Probability of achieving HbA1c <7% | Incremental cost per patient | Number needed to screen to prevent one PJI | ||
|---|---|---|---|---|
|
| ||||
| THA | TKA | THA | TKA | |
|
| ||||
| 1% | $125 | $127 | 16,944 | 38,805 |
| 10% | $93 | $113 | 1,694 | 3,880 |
| 20% | $58 | $98 | 847 | 1,940 |
| 30% | $23 | $83 | 565 | 1,293 |
| 40% | −$13 | $68 | 424 | 970 |
| 50% | −$48 | $53 | 339 | 776 |
| 60% | −$83 | $38 | 282 | 647 |
| 70% | −$118 | $23 | 242 | 554 |
| 80% | −$153 | $8 | 212 | 485 |
| 90% | −$189 | −$7 | 188 | 431 |
| 100% | −$224 | −$22 | 169 | 388 |
HbA1c, hemoglobin A1c. PJI, periprosthetic joint infection. THA, total hip arthroplasty. TKA, total knee arthroplasty. Negative incremental costs indicate that HbA1c screening is less costly than no screening and vice versa.
Figure 2.
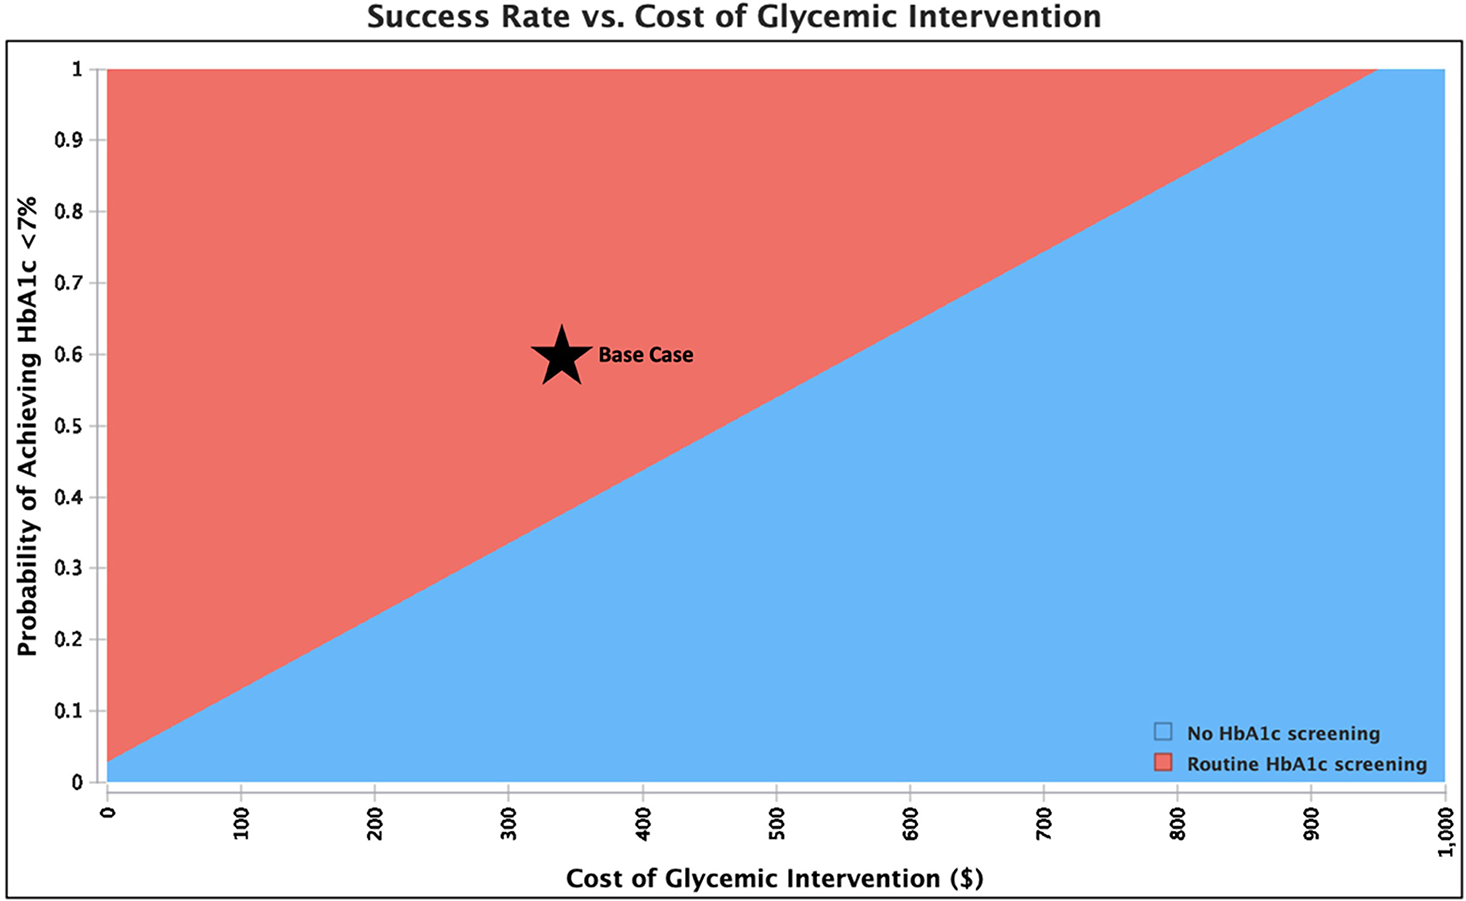
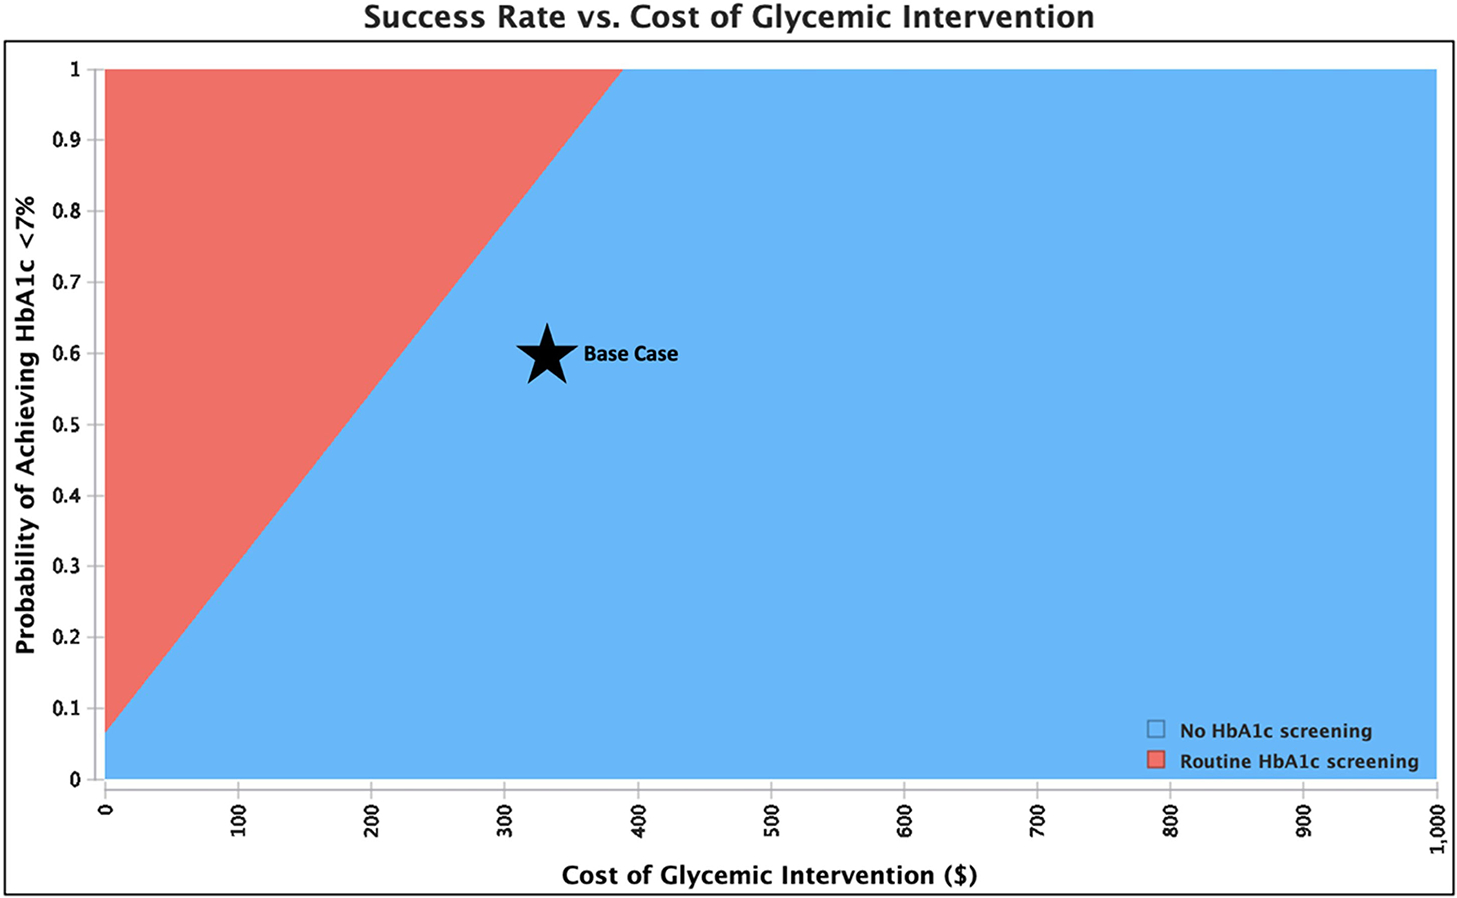
Sensitivity analysis showing the preferred (least costly) strategy across a range of values for intervention cost and probability of achieving hemoglobin A1c (HbA1c) less than 7% in patients with diabetes mellitus (DM) undergoing total hip arthroplasty or total knee arthroplasty. The base case is shown by the star. Routine HbA1c screening saves money compared to not screening when the cost of intervention is low and/or the success rate of lowering HbA1c is high.
Screening patients with DM undergoing TKA incurred additional net costs of $25,810 per PJI prevented. Similarly to above, screening saved money if the overall probability of PJI was high, the risk of PJI with uncontrolled DM was high, or the glycemic intervention was more effective or less costly. Screening became cost-saving when the probability of PJI with controlled DM was greater than 1.4%, risk ratio of PJI with uncontrolled DM was greater than 2.0, success rate of lowering HbA1c was greater than 85.6% (Table 3), or cost of intervention was less than $220 (Figures 2B, A3 [in Supplemental Digital File, Supplemental Digital Content 1, http://links.lww.com/COP/A59, which has tornado diagram showing the sensitivity to variation in model inputs.] ) When the HbA1c threshold was increased to greater than 8%, screening patients with DM undergoing TKA incurred additional net costs of $29,470 per PJI prevented.
In the PSA, routine screening saved money 75.5% of the time in THA and 21.8% of the time in TKA. Distributions of incremental costs and absolute risk reduction in PJI across 10,000 Monte Carlo simulations are shown (Figure 3, A4 [See A4 in Supplemental Digital Content, Supplemental Digital Content 1, http://links.lww.com/COP/A59, which shows distribution of absolute risk reduction in PJI with routine HbA1c screening compared to no screening.] ).
Figure 3.
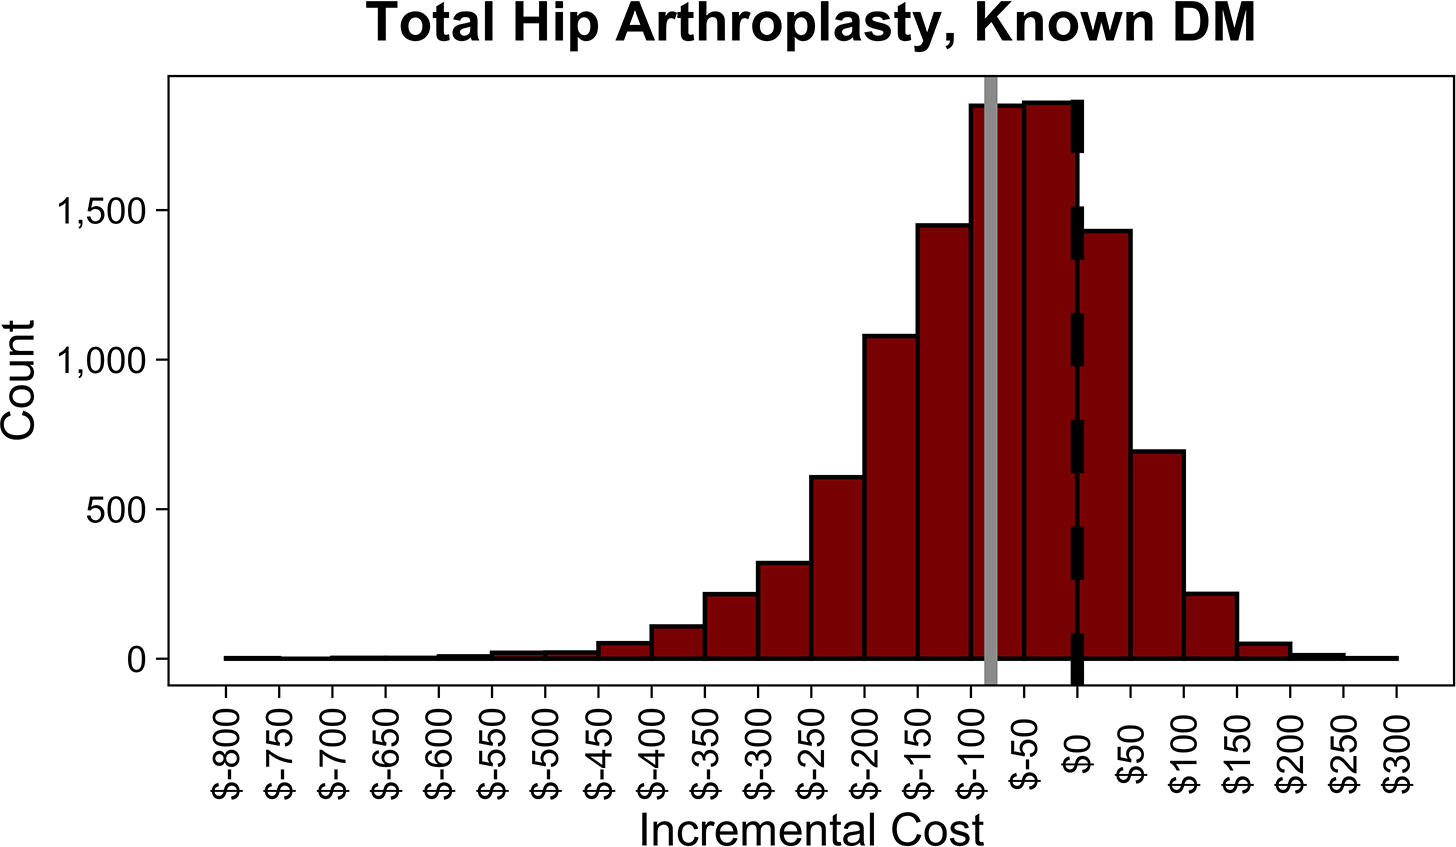
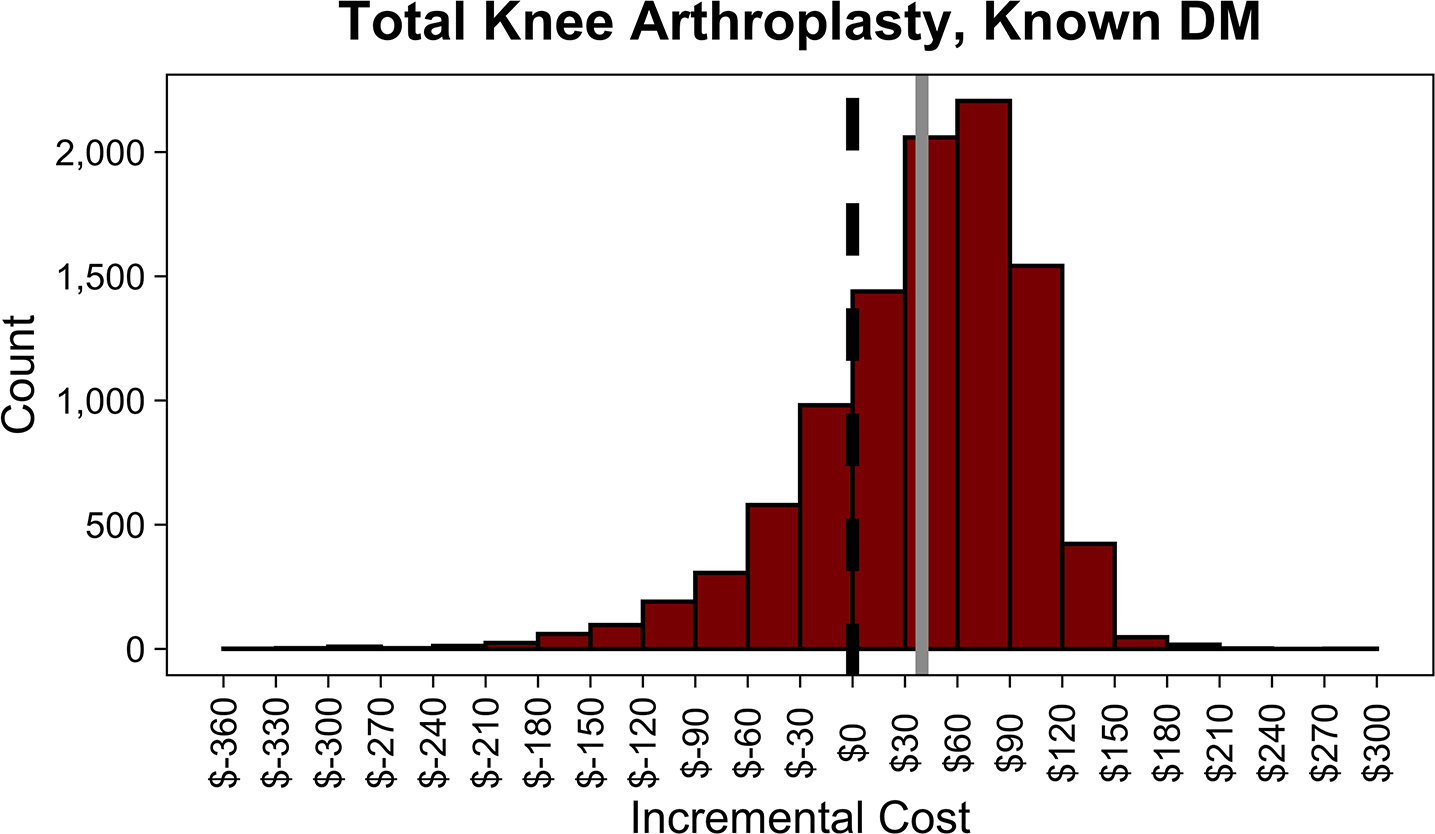
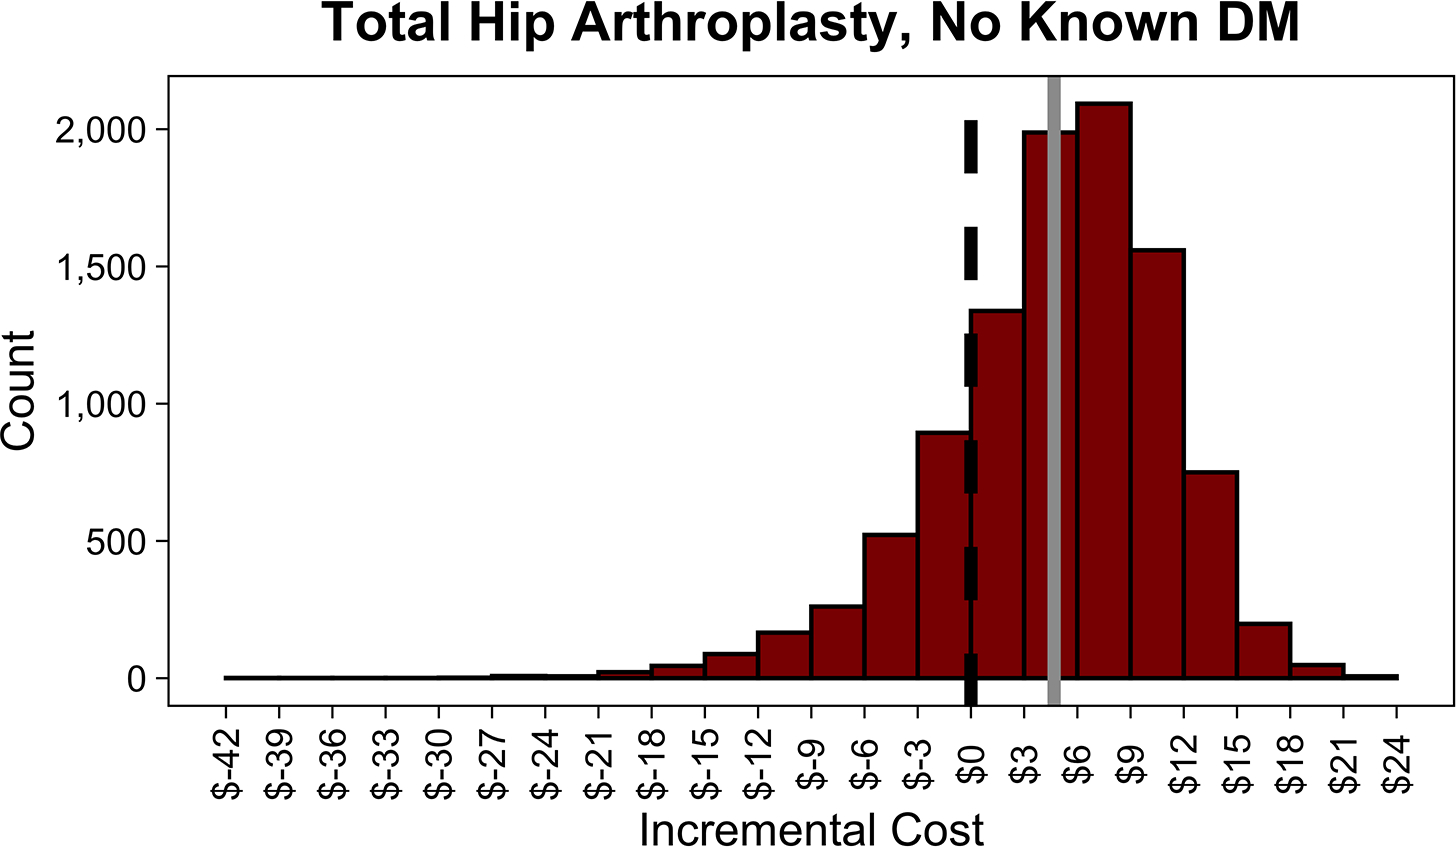
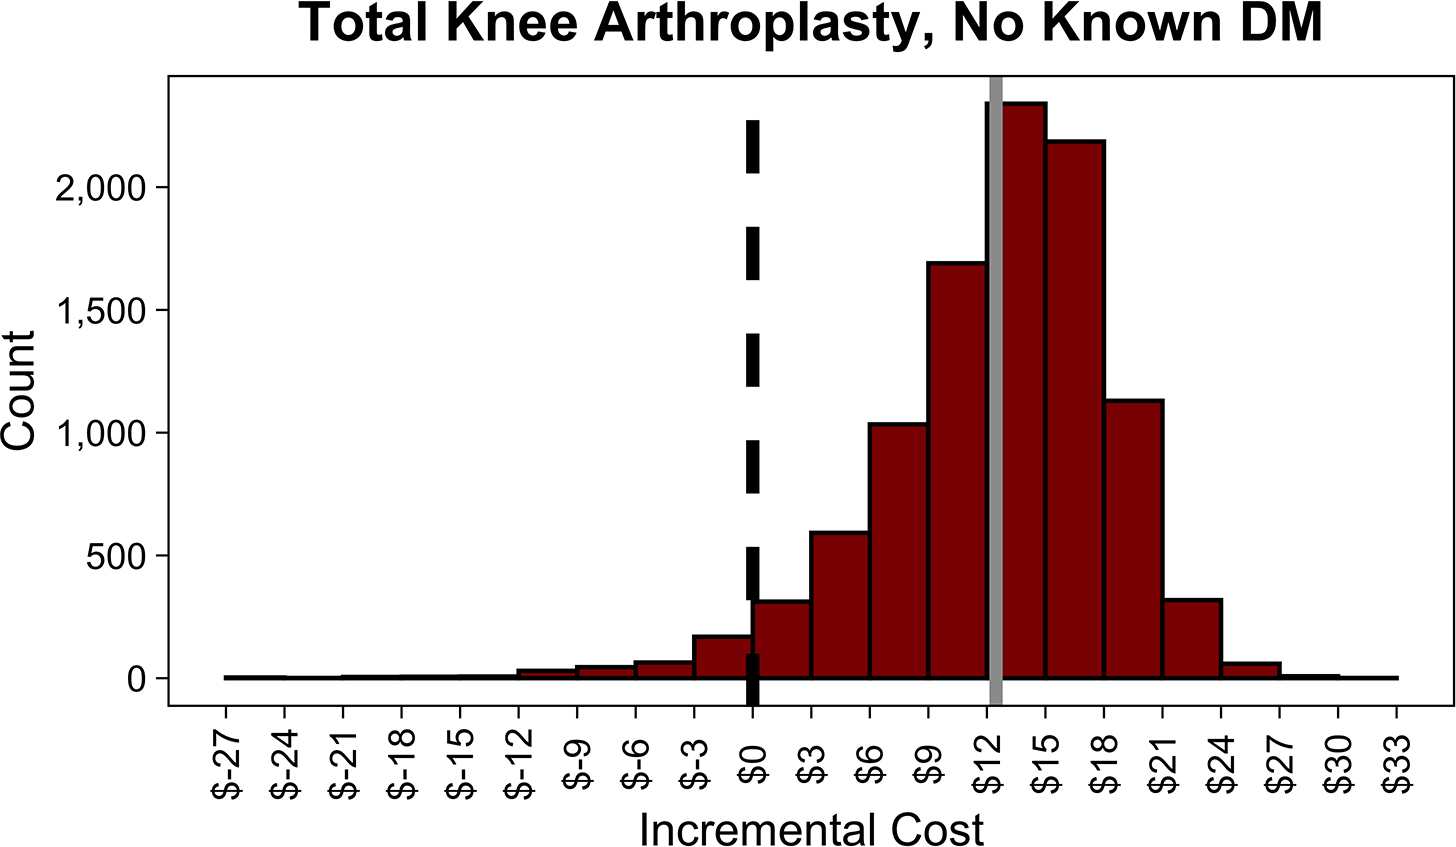
Distributions of incremental cost per patient of routine hemoglobin A1c (HbA1c) screening compared to no screening in patients with diabetes mellitus (DM) undergoing total hip arthroplasty (THA) (A), with diabetes mellitus undergoing total knee arthroplasty (TKA) (B), with no history of diabetes mellitus undergoing THA (C), and with no history of diabetes mellitus undergoing TKA across 10,000 Monte Carlo simulations (D). The dotted black line in each plot shows the indifference point. The solid gray line in each plot shows the mean incremental (net) cost. Negative incremental costs indicate that routine HbA1c screening is less costly than no screening and vice versa. Routine HbA1c screening in THA patients with DM on average saves money. Routine HbA1c screening in TKA patients with DM or total joint arthroplasty patients without a history of DM does not save money on average.
HbA1c Screening in Patients With No History of Diabetes Mellitus
In patients with no history of DM (i.e., a population containing undiagnosed DM cases), screening incurred additional net costs of $5 to $12 per patient screened and $24,583 to $87,873 per PJI prevented in the base case (Table 2). When the HbA1c threshold was increased to greater than 8%, screening patients with no history of DM incurred additional net costs of $142,423 to $243,069 per PJI prevented. Routine screening in THA patients without known DM saved money when the probability of PJI with controlled DM was greater than 1.4%, the risk ratio of PJI with uncontrolled DM was greater than 3.3%, the success rate of lowering HbA1c was greater than 83.7% (Table A2 [See A2 in Supplemental Digital File, Supplemental Digital Content 1, http://links.lww.com/COP/A59, which shows sensitivity of results to probability of achieving HbA1c target of less than 7% in patients with no history of diabetes mellitus.] ), or the cost of an HbA1c test was less than $4.97 (Figure A5 [See A5 in Supplemental Digital Content, Supplemental Digital Content 1, http://links.lww.com/COP/A59, which displays tornado diagram showing the sensitivity to variation in model inputs.] ). The authors varied the prevalence of undiagnosed DM for THA patients, showing that screening saved money when prevalence was greater than 14.3% (Figure 4).
Figure 4.
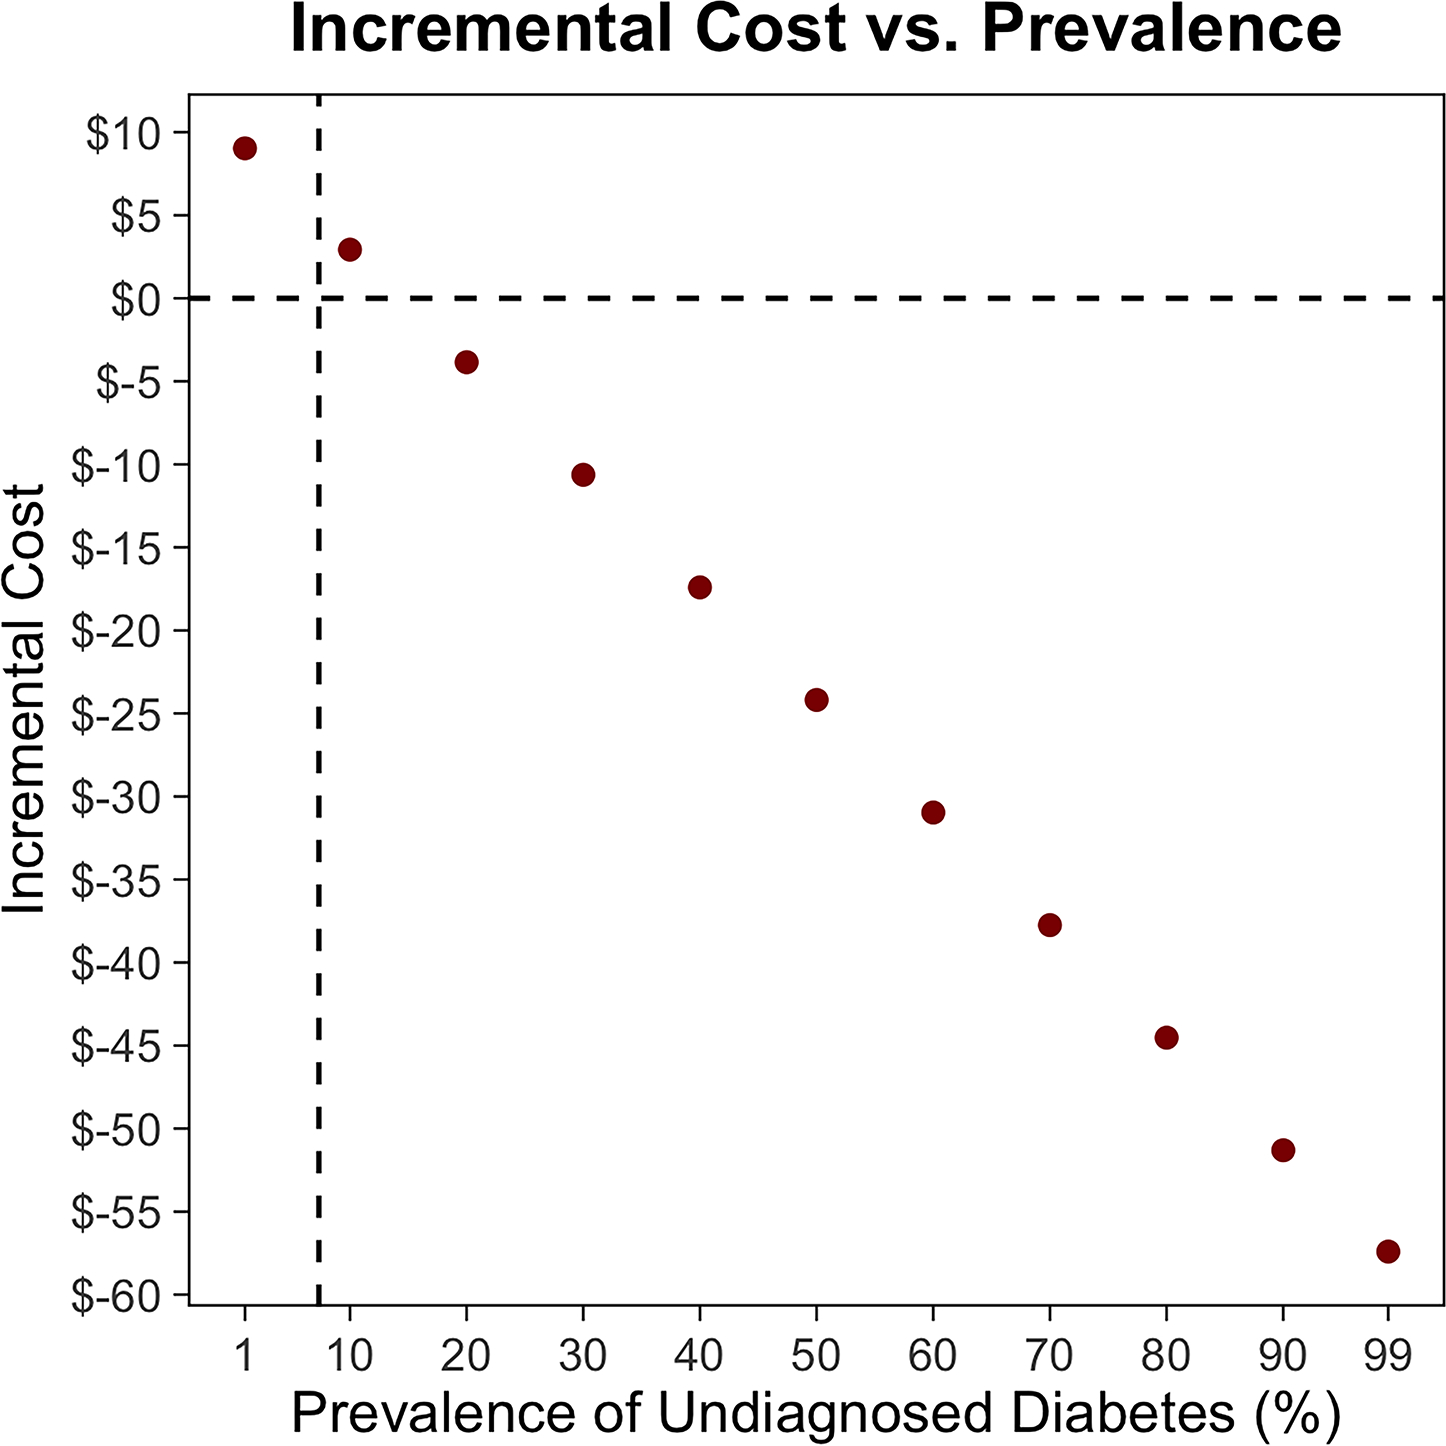
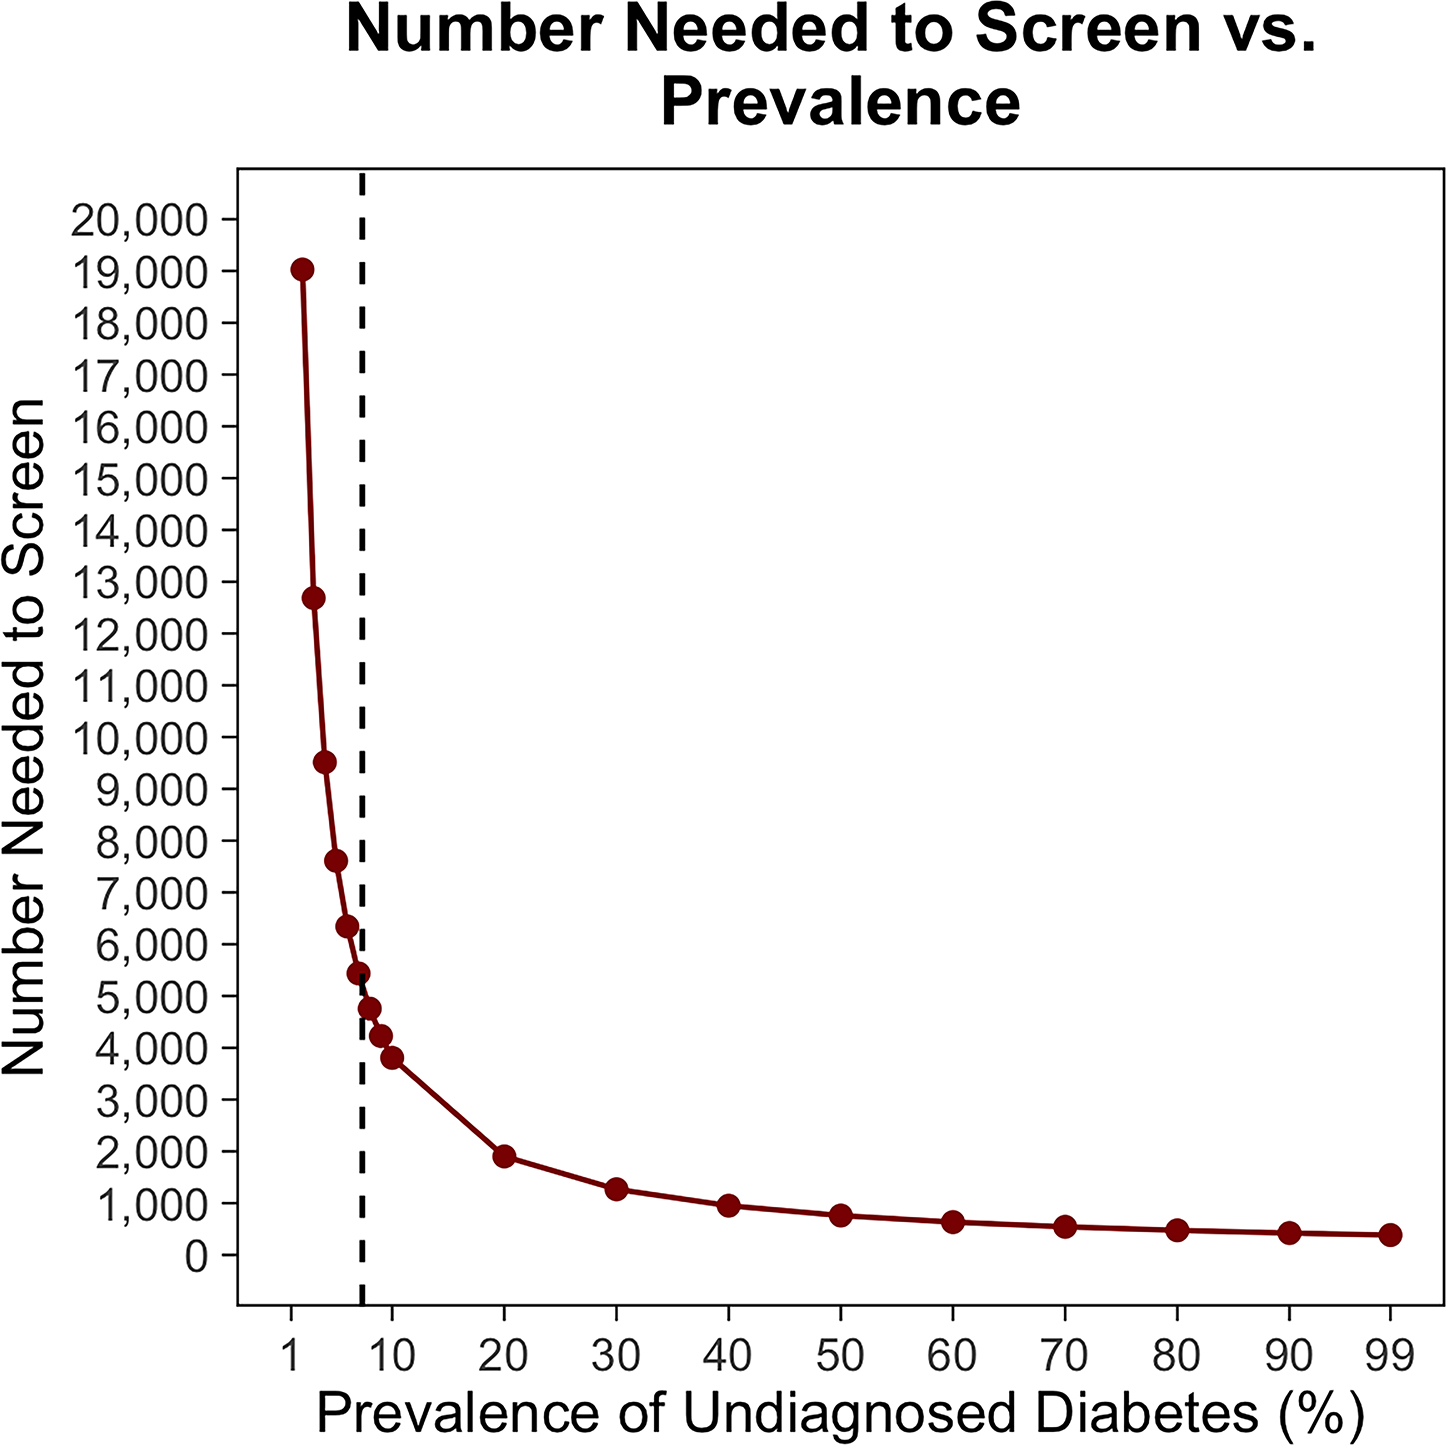
In total hip arthroplasty (THA) patients with no history of diabetes mellitus (DM), the relationship between prevalence of undiagnosed diabetes and incremental cost per patient of routine hemoglobin A1c (HbA1c) screening (A) andnumber needed to screen to prevent a single periprosthetic joint infection (PJI) (B). The vertical dotted lines show the base case. The horizontal dotted line indicates the indifference point. Negative incremental costs indicate that routine HbA1c screening is less costly than no screening and vice versa. As the prevalence of undiagnosed DM increases, routine HbA1c screening in THA patients with no history of DM saves more money and the number needed to screen to prevent a single PJI decreases.
In contrast, routine screening in TKA patients without known DM was never cost-saving across the ranges of model inputs tested or at any prevalence of DM (Figure A6, A7 [See A6 and A7 in Supplemental Digital Content, Supplemental Digital Content 1, http://links.lww.com/COP/A59, which displays tornado diagram showing the sensitivity to variation in model inputs, and sensitivity analysis showing the preferred strategy across a range of values for prevalence of undiagnosed diabetes and relative risk of PJI in uncontrolled diabetes vs. controlled diabetes in patients with no history of DM undergoing TKA.] ). In this population, a PSA showed that routine screening saved money 20.2% of the time in THA and 3.9% of the time in TKA (Figure 3, A4 [See A4 in Supplemental Digital Content, Supplemental Digital Content 1, http://links.lww.com/COP/A59, which shows distribution of absolute risk reduction in PJI with routine HbA1c screening, compared to no screening in patients.] ).
DISCUSSION
Interpretation
This study showed that routine preoperative HbA1c screening (with a subsequent glycemic intervention) in patients with DM undergoing THA saves money at the 1-year time horizon, with 286 patients needing to be screened to prevent a PJI. Routine screening in the other groups modeled in this study did not reduce costs in the short-term as related to prevention of PJI. The difference in cost-benefit profile between THA and TKA was attributable to the difference in the risk ratio of PJI in patients with uncontrolled DM undergoing those procedures. The difference in cost-benefit profile between patients with known DM and patients without known DM is attributable to the low prevalence of DM. Thus, routine preoperative screening of patients with DM undergoing THA saved money. In contrast, screening TKA patients with DM or THA/TKA patients with no history of DM incurred additional net costs per PJI prevented.
Although two recent studies have advocated for routine HbA1c screening in all arthroplasty patients,27,33 the short-term costs and benefits of screening were unknown. Shohat et al.33 provided a brief estimate of screening costs based only on HbA1c assay cost, but the costs or efficacy of subsequent interventions required to achieve adequate glycemic control were not incorporated. Since the purpose of screening before TJA is to prevent postoperative complications such as PJI, economic analyses would benefit from the inclusion of those interventions. These results suggest that incorporation of routine HbA1c screening into preoperative care pathways for THA with referral of patients found to have uncontrolled DM for medical optimization represents a low-burden intervention that would yield net cost savings.
Furthermore, while the evidence shows that elevated HbA1c is associated with an increased risk of PJI,41 identification of a specific threshold for intervention has been elusive.22–24 This may be due to a linear relationship between HbA1c and risk of PJI.42 Yet, despite those limitations, at least two studies advocate for routine HbA1c screening in arthroplasty patients.27,33 While this analysis faces similar limitations in the shortage of high-quality, prospective evidence on specific HbA1c thresholds, the authors’ results suggest that HbA1c screening in some populations (i.e., THA patients with DM) is likely to provide more value (lower cost-benefit ratios) compared to others (e.g., THA/TKA patients without known DM). Institutions with limited resources might want to consider prioritizing patients with DM and those undergoing THA. Institutions considering expansion of their screening programs to include patients without known diabetes should consider the cost per PJI prevented relative to alternative methods for optimizing PJI risk (e.g., smoking cessation).
Despite guidelines for referring patients with elevated HbA1c for preoperative optimization,43 there are few prospective studies on the efficacy of glycemic interventions prior to TJA. An effective strategy for lowering HbA1c prior to bariatric surgery included referrals to nutritionists, psychologists, and exercise physiologists with medication adjustments.44 Other proven strategies vary from diabetes education and dietary changes to exercise and pharmacologic therapy.45–48 Recognizing the benefits of a multimodal approach, one institution has established a multidisciplinary care pathway for glycemic optimization prior to spine surgery.38 Moreover, elective surgery itself may provide a strong incentive for lifestyle changes,49 thus augmenting the efficacy of screening protocols. Although the authors could not model every glycemic intervention shown to be effective, they modeled a representative intervention and provide cost and efficacy thresholds that any intervention must achieve in order to save money. (Figure 2).
Limitations and Future Perspectives
This study should be viewed in light of its limitations. Since no randomized studies of preoperative glycemic interventions in TJA patients exist, the risk reduction realized by lowering HbA1c might be more or less than expected, which would alter the cost savings and efficacy of screening. Further, glycemic optimization may require more intensive, costlier interventions, which would increase net costs. Alternatively, multidisciplinary clinics may achieve better outcomes at lower cost,38 which would be well-suited for patients requiring intensive interventions. As better evidence emerges from existing multidisciplinary programs, future iterations of this model can be adjusted accordingly. The authors also did not consider reduced quality-of-life attributable to delaying TJA for glycemic interventions. Since glycemic optimization could take months,37,44 the reduced quality-of-life in the interim would attenuate the benefits of risk reduction. Finally, they chose a time horizon of 1 year to accurately reflect the underlying literature.24 Although this limits comparison with the bundle time horizon that other studies have used,40 their results are still applicable to health payers and systems making short-term resource-allocation decisions. Due to their focus on short-term, TJA-specific costs and benefits, the authors also did not consider long-term diabetes-related or other sequelae avoided by screening and treatment, which would further increase the effectiveness of screening.50
CONCLUSIONS
In summary, this cost-effectiveness analysis shows that routine HbA1c screening in THA patients with DM reduces the risk of PJI at a net cost savings over the 1-year time horizon while screening in TKA patients with DM or THA/TKA patients without DM does not save money. These results can be used to inform the development of care pathways for glycemic optimization prior to TJA to achieve higher value care.
Supplementary Material
Financial disclosure:
Dr. Robin Kamal has received funding from the National Institutes of Health and the Orthopaedic Research and Education Foundation. Dr. William Maloney reports a financial relationship with Zimmer-Biomet and Stryker. The authors report no conflicts of interest.
REFERENCES
- 1.Wilson NA, Schneller ES, Montgomery K, Bozic KJ. Hip And knee implants: current trends and policy considerations. Health Affair. 2008; 27(6):1587–1598. doi: 10.1377/hlthaff.27.6.1587. [DOI] [PubMed] [Google Scholar]
- 2.Medicare Inpatient Hospitals. Baltimore, MD: Centers for Medicare and Medicaid Services, 2019. https://data.cms.gov/provider-summary-by-type-of-service/medicare-inpatient-hospitals/medicare-inpatient-hospitals-by-geography-and-service Accessed April 15, 2020. [Google Scholar]
- 3.Sloan M, Premkumar A, Sheth NP. Projected volume of primary total joint arthroplasty in the U.S., 2014 to 2030. J Bone Joint Surg Am. 2018; 100(17):1455–1460. [DOI] [PubMed] [Google Scholar]
- 4.Kurtz S, Ong K, Lau E, Mowat F, Halpern M. Projections of primary and revision hip and knee arthroplasty in the United States from 2005 to 2030. J Bone Joint Surg Am. 2007; 89(4):780–785. [DOI] [PubMed] [Google Scholar]
- 5.Kurtz SM, Ong KL, Lau E, Bozic KJ. Impact of the economic downturn on total joint replacement demand in the United States: updated projections to 2021. J Bone Joint Surg Am. 2014;96(8):624–630. [DOI] [PubMed] [Google Scholar]
- 6.Siddiqi A, White PB, Mistry JB, et al. Effect of bundled payments and health care reform as alternative payment models in total joint arthroplasty: a clinical review. J Arthroplasty. 2017; 32(8):2590–2597. doi: 10.1016/j.arth.2017.03.027. [DOI] [PubMed] [Google Scholar]
- 7.Kurtz SM, Lau EC, Ong KL, et al. Which clinical and patient factors influence the national economic burden of hospital readmissions after total joint arthroplasty? Clin Orthop Relat R. 2017; 475(12):2926–2937. doi: 10.1007/s11999-017-5244-6. [DOI] [PMC free article] [PubMed] [Google Scholar]
- 8.Urish KL, Qin Y, Li BY, et al. Predictors and cost of readmission in total knee arthroplasty. J Arthroplasty. 2018; 33(9):2759–2763. doi: 10.1016/j.arth.2018.04.008. [DOI] [PMC free article] [PubMed] [Google Scholar]
- 9.Kurtz SM, Lau EC, Ong KL, et al. Hospital, patient, and clinical factors influence 30- and 90-day readmission after primary total hip arthroplasty. J Arthroplasty. 2016; 31(10):2130–2138. doi: 10.1016/j.arth.2016.03.041. [DOI] [PubMed] [Google Scholar]
- 10.Ong KL, Kurtz SM, Lau E, et al. Prosthetic joint infection risk after total hip arthroplasty in the Medicare population. J Arthroplasty. 2009; 24(6, Supplement):105–109. doi: 10.1016/j.arth.2009.04.027. [DOI] [PubMed] [Google Scholar]
- 11.Pulido L, Ghanem E, Joshi A, Purtill JJ, Parvizi J. Periprosthetic joint infection: the incidence, timing, and predisposing factors. Clin Orthop Relat Res. 2008; 466(7):1710–1715. doi: 10.1007/s11999-008-0209-4. [DOI] [PMC free article] [PubMed] [Google Scholar]
- 12.Kurtz SM, Lau E, Watson H, Schmier JK, Parvizi J. Economic burden of periprosthetic joint infection in the United States. J Arthroplasty. 2012; 27(8, Supplement):61–65.e1. doi: 10.1016/j.arth.2012.02.022. [DOI] [PubMed] [Google Scholar]
- 13.Parisi TJ, Konopka JF, Bedair HS. What is the long-term economic societal effect of periprosthetic infections after THA? A Markov analysis. Clin Orthop Relat Res. 2017; 475(7):1891–1900. doi: 10.1007/s11999-017-5333-6. [DOI] [PMC free article] [PubMed] [Google Scholar]
- 14.Jämsen E, Nevalainen P, Eskelinen A, et al. Obesity, diabetes, and preoperative hyperglycemia as predictors of periprosthetic joint infection: a single-center analysis of 7181 primary hip and knee replacements for osteoarthritis. J Bone Joint Surg Am. 2012; 94(14):e101. [DOI] [PubMed] [Google Scholar]
- 15.Iorio R, Williams KM, Marcantonio AJ, et al. Diabetes mellitus, hemoglobin A1c, and the incidence of total joint arthroplasty infection. J Arthroplasty. 2012; 27(5):726–729.e1. doi: 10.1016/j.arth.2011.09.013. [DOI] [PubMed] [Google Scholar]
- 16.Kremers HM, Lewallen LW, Mabry TM, et al. Diabetes mellitus, hyperglycemia, hemoglobin A1c and the risk of prosthetic joint infections in total hip and knee arthroplasty. J Arthroplasty. 2015; 30(3):439–443. doi: 10.1016/j.arth.2014.10.009. [DOI] [PubMed] [Google Scholar]
- 17.Bozic KJ, Lau E, Kurtz S, Ong K, Berry DJ. Patient-related risk factors for postoperative mortality and periprosthetic joint infection in Medicare patients undergoing TKA. Clin Orthop Relat Res. 2012;470(1):130–137. [DOI] [PMC free article] [PubMed] [Google Scholar]
- 18.Yang Z, Liu H, Xie X, et al. The influence of diabetes mellitus on the post-operative outcome of elective primary total knee replacement. Bone Joint J. 2014; 96-B(12):1637–1643. doi: 10.1302/0301-620X.96B12.34378. [DOI] [PubMed] [Google Scholar]
- 19.Hogan C, Bucknell AL, King KB. The effect of diabetes mellitus on total joint arthroplasty outcomes. JBJS Rev. 2016;4(2):e3. [DOI] [PubMed] [Google Scholar]
- 20.Zhu Y, Zhang F, Chen W, et al. Risk factors for periprosthetic joint infection after total joint arthroplasty: a systematic review and meta-analysis. J Hosp Infect. 2015; 89(2):82–89. doi: 10.1016/j.jhin.2014.10.008. [DOI] [PubMed] [Google Scholar]
- 21.Marchant MH Jr, Viens NA, Cook C, Vail TP, Bolognesi MP. The impact of glycemic control and diabetes mellitus on perioperative outcomes after total joint arthroplasty. J Bone Joint Surg Am. 2009; 91(7):1621–1629. [DOI] [PubMed] [Google Scholar]
- 22.Cancienne JM, Werner BC, Browne JA. Is there a threshold value of hemoglobin A1c that predicts risk of infection following primary total hip arthroplasty? J Arthroplasty. 2017; 32(9, Supplement):S236–S240. doi: 10.1016/j.arth.2017.01.022. [DOI] [PubMed] [Google Scholar]
- 23.Cancienne JM, Werner BC, Browne JA. Is there an association between hemoglobin A1c and deep postoperative infection after TKA? Clin Orthop Relat R. 2017; 475(6):1642–1649. doi: 10.1007/s11999-017-5246-4. [DOI] [PMC free article] [PubMed] [Google Scholar]
- 24.Tarabichi M, Shohat N, Kheir MM, et al. Determining the threshold for HbA1c as a predictor for adverse outcomes after total joint arthroplasty: A multicenter, retrospective study. J Arthroplasty. 2017; 32(9, Supplement):S263–S267.e1. doi: 10.1016/j.arth.2017.04.065. [DOI] [PubMed] [Google Scholar]
- 25.Stryker LS, Abdel MP, Morrey ME, et al. Elevated postoperative blood glucose and preoperative hemoglobin A1C are associated with increased wound complications following total joint arthroplasty. J Bone Joint Surg Am. 2013; 95(9):808–814. [DOI] [PubMed] [Google Scholar]
- 26.Shohat N, Muhsen K, Gilat R, et al. Inadequate glycemic control is associated with increased surgical site infection in total joint arthroplasty: a systematic review and meta-analysis. J Arthroplasty. 2018; 33(7):2312–2321.e3. doi: 10.1016/j.arth.2018.02.020. [DOI] [PubMed] [Google Scholar]
- 27.Capozzi JD, Lepkowsky ER, Callari MM, et al. The prevalence of diabetes mellitus and routine hemoglobin A1c screening in elective total joint arthroplasty patients J Arthroplasty. 2017; 32(1):304–308. doi: 10.1016/j.arth.2016.06.025. [DOI] [PubMed] [Google Scholar]
- 28.Livshetz I, Nett M. Perioperative management of diabetes for total joint arthoplasty: a consensus article. Tech Orthop. 2019; 34(3):167–171. [Google Scholar]
- 29.Romero JA, Jones RE, Brown T. Modifiable risk factors and preoperative optimization of the primary total arthroplasty patient. Curr Orthop Pract. 2017; 28(3):272–275. [Google Scholar]
- 30.Nussenbaum FD, Rodriguez-Quintana D, Fish SM, Green DM, Cahill CW. Implementation of preoperative screening criteria lowers infection and complication rates following elective total hip arthroplasty and total knee arthroplasty in a veteran population. J Arthroplasty. 2018; 33(1):10–13. doi: 10.1016/j.arth.2017.07.031. [DOI] [PubMed] [Google Scholar]
- 31.Aggarwal VK, Tischler EH, Lautenbach C, et al. Mitigation and education. J Arthroplasty. 2014; 29(2):19–25. doi: 10.1016/j.arth.2013.09.028. [DOI] [PubMed] [Google Scholar]
- 32.Rizvi AA, Chillag SA, Chillag KJ. Perioperative management of diabetes and hyperglycemia in patients undergoing orthopaedic surgery. J Am Acad Orthop Surg. 2010; 18(7):426–435. [DOI] [PubMed] [Google Scholar]
- 33.Shohat N, Goswami K, Tarabichi M, et al. All patients should be screened for diabetes before total joint arthroplasty. J Arthroplasty. 2018; 33(7):2057–2061. doi: 10.1016/j.arth.2018.02.047. [DOI] [PubMed] [Google Scholar]
- 34.Kahn R, Alperin P, Eddy D, et al. Age at initiation and frequency of screening to detect type 2 diabetes: a cost-effectiveness analysis. Lancet. 2010; 375(9723):1365–1374. doi: 10.1016/S0140-6736(09)62162-0. [DOI] [PubMed] [Google Scholar]
- 35.Mraovic B, Suh D, Jacovides C, Parvizi J. Perioperative hyperglycemia and postoperative infection after lower limb arthroplasty. J Diabetes Sci Technol. 2011; 5(2):412–418. doi: 10.1177/193229681100500231. [DOI] [PMC free article] [PubMed] [Google Scholar]
- 36.Dronge AS, Perkal MF, Kancir S, et al. Long-term glycemic control and postoperative infectious complications. Arch Surg. 2006; 141(4):375–380. doi: 10.1001/archsurg.141.4.375. [DOI] [PubMed] [Google Scholar]
- 37.Giori NJ, Ellerbe LS, Bowe T, Gupta S, Harris AHS. Many diabetic total joint arthroplasty candidates are unable to achieve a preoperative hemoglobin A1c goal of 7% or less. J Bone Joint Surg Am. 2014; 96(6):500–504. [DOI] [PubMed] [Google Scholar]
- 38.Setji T, Hopkins TJ, Jimenez M, et al. Rationalization, development, and implementation of a preoperative diabetes optimization program designed to improve perioperative outcomes and reduce cost. Diabetes Spectr. 2017; 30(3):217–223. doi: 10.2337/ds16-0066. [DOI] [PMC free article] [PubMed] [Google Scholar]
- 39.Boltri JM, Okosun IS, Davis-Smith M, Vogel RL. Hemoglobin A1c levels in diagnosed and undiagnosed black, hispanic, and white persons with diabetes: results from NHANES 1999–2000. Ethn Dis. 2005; 15(4):562–567. [PubMed] [Google Scholar]
- 40.Boylan MR, Bosco JA, Slover JD. Cost-effectiveness of preoperative smoking cessation interventions in total joint arthroplasty. J Arthroplasty. 2019; 34(2):215–220. doi: 10.1016/j.arth.2018.09.084. [DOI] [PubMed] [Google Scholar]
- 41.Yang L, Sun Y, Li G, Liu J. Is hemoglobin A1c and perioperative hyperglycemia predictive of periprosthetic joint infection following total joint arthroplasty?: A systematic review and meta-analysis. Medicine (Baltimore). 2017; 96(51):e8805. doi: 10.1097/MD.0000000000008805. [DOI] [PMC free article] [PubMed] [Google Scholar]
- 42.Harris AHS, Bowe TR, Gupta S, Ellerbe LS, Giori NJ. Hemoglobin A1c as a marker for surgical risk in diabetic patients undergoing total joint arthroplasty. J Arthroplasty. 2013; 28(8, Supplement):25–29. doi: 10.1016/j.arth.2013.03.033. [DOI] [PubMed] [Google Scholar]
- 43.Stryker LS. Modifying risk factors: strategies that work diabetes mellitus. J Arthroplasty. 2016; 31(8):1625–1627. doi: 10.1016/j.arth.2016.02.084. [DOI] [PubMed] [Google Scholar]
- 44.English TM, Malkani S, Kinney RL, et al. Predicting remission of diabetes after RYGB surgery following intensive management to optimize preoperative glucose control. Obes Surg. 2015; 25(1):1–6. doi: 10.1007/s11695-014-1339-2. [DOI] [PubMed] [Google Scholar]
- 45.Chrvala CA, Sherr D, Lipman RD. Diabetes self-management education for adults with type 2 diabetes mellitus: a systematic review of the effect on glycemic control. Patient Educ Couns. 2016; 99(6):926–943. doi: 10.1016/j.pec.2015.11.003. [DOI] [PubMed] [Google Scholar]
- 46.Itsiopoulos C, Brazionis L, Kaimakamis M, et al. Can the Mediterranean diet lower HbA1c in type 2 diabetes? Results from a randomized cross-over study. Nutr Metab Cardiovasc Dis 2011; 21(9):740–747. doi: 10.1016/j.numecd.2010.03.005. [DOI] [PubMed] [Google Scholar]
- 47.Boulé NG, Haddad E, Kenny GP, Wells GA, Sigal RJ. Effects of exercise on glycemic control and body mass in type 2 diabetes mellitus; a meta-analysis of controlled clinical trials. JAMA. 2001; 286(10):1218–1227. doi: 10.1001/jama.286.10.1218. [DOI] [PubMed] [Google Scholar]
- 48.Sherifali D, Nerenberg K, Pullenayegum E, Cheng JE, Gerstein HC. The effect of oral antidiabetic agents on A1C levels. Diabetes Care. 2010; 33(8):1859–1864. doi: 10.2337/dc09-1727. [DOI] [PMC free article] [PubMed] [Google Scholar]
- 49.Akhavan S, Nguyen LC, Chan V, Saleh J, Bozic KJ. Impact of smoking cessation counseling prior to total joint arthroplasty. Orthopedics. 2017; 40(2):e323–e328. [DOI] [PubMed] [Google Scholar]
- 50.Shapiro L, Graham L, Hawn M, Kamal R. Quality reporting windows may not capture the effects of surgical site infections after orthopaedic surgery. J Bone Joint Surg Am. In copy-editing stage for 2022 publication. [DOI] [PubMed] [Google Scholar]
Associated Data
This section collects any data citations, data availability statements, or supplementary materials included in this article.


