Abstract
The concept of region of sensitivity is central to the field of diffuse optics and is closely related to the Jacobian matrix used to solve the inverse problem in imaging. It is well-known that, in diffuse reflectance, the region of sensitivity associated with a given source-detector pair is shaped as a banana, and features maximal sensitivity to the portions of the sample that are closest to the source and the detector. We have recently introduced a dual-slope method based on a special arrangement of two sources and two detectors, which results in deeper and more localized regions of sensitivity, resembling the shapes of different kinds of nuts. Here, we report the regions of sensitivity associated with a variety of source-detector arrangements for dual-slope measurements of intensity and phase with frequency-domain spectroscopy (modulation frequency: 140 MHz) in a medium with absorption and reduced scattering coefficients of 0.1 cm−1 and 12 cm−1, respectively. The main result is that the depth of maximum sensitivity, considering only cases that use source-detector separations of 25 and 35 mm, progressively increases as we consider single-distance intensity (2.0 mm), dual-slope intensity (4.6 mm), single-distance phase (7.5 mm), and dual-slope phase (10.9 mm). These results indicate the importance of dual-slope measurements, and even more so of phase measurements, when it is desirable to selectively probe deeper portions of a sample with diffuse optics. This is certainly the case in non-invasive optical studies of brain, muscle, and breast tissue, which are located underneath superficial tissue at variable depths.
Keywords: Near-infrared spectroscopy, tissue optics, diffuse optical tomography, frequency domain, dual slopes
1. Introduction
The field of diffuse optics, and more specifically its applications to non-invasive measurements of biological tissue, relies on the large optical penetration depth (of the order of centimeters) of near-infrared light into tissue. This property allows for non-invasive sensing of deep tissues, albeit with an intrinsically low spatial resolution of the order of 1 cm. Target tissues include the human brain,1 skeletal muscle,2 and lobules and ducts in the human breast,3 which must be interrogated through superficial tissue layers: scalp and skull for the brain, skin and subcutaneous lipid layer for muscle, skin and fatty tissue for the breast. Any diffuse optical study of tissue needs to consider potential confounds from superficial tissue that may obscure contributions to the optical signal from the target tissue. While this is true for any non-invasive application of diffuse optics, the severity of the signal contamination from superficial tissue can vary significantly depending on the target tissue, anatomical and physiological features, optical signal measured, properties of the optical probe, reflectance versus transmittance mode, etc.
As one may expect, given the importance of this problem, significant efforts have been devoted to separating the contributions to the measured optical signals that originate from superficial tissue and from the deeper target tissue. This is especially true in the case of non-invasive optical measurements of the brain. A common approach is based on direct measurements of the superficial tissue contributions using “short” source-detector separations (5–10 mm), and methods to remove these contributions from the optical signals collected at “large” source-detector separations (25–35 mm), which are sensitive to both brain and superficial extracerebral tissue. While conceptually straightforward, this approach is not of trivial application because it needs to either rely on a lack of correlation between extracerebral and cerebral tissue contributions, or quantify the extent to which the extracerebral tissue contributes to the signal recorded at large source-detector separation. Several approaches have been proposed to combine signals collected at short and long source-detector separations: a regression method based on a least square algorithm,4 adaptive filtering,5 state-space modeling,6 or independent component analysis.7 There is a further complication related to spatially inhomogeneous optical changes in the superficial tissue, which has been addressed by introducing two sets of short-distance source-detector pairs.8 Finally, one should consider that short source-detector separations, especially in the presence of hair, may lead to the collection of stray light, i.e. light that has not traveled through tissue but rather finds its way from the source to the detector via reflection or scattering externally to tissue. This is a further practical complication of methods based on the combination of short and long source-detector distances. More general solutions to this problem are afforded by layered reconstructions9–10 or full tomographic approaches,11 which aim to separately reconstruct the optical changes in superficial and deeper tissue from optical measurements obtained with an array of sources and detectors on the tissue surface.
In this article, we consider a conceptually different approach to addressing the issue of potential confounds from superficial tissue. Rather than trying to characterize or measure the contributions from superficial tissue, we propose to suppress the sensitivity of the optical signals to them. The optical sensitivity of a signal collected with a source-detector pair in diffuse reflectance is represented by a banana-shaped region,12 the so-called “photon banana,” which narrows at the source and detector locations and broadens as it extends into deeper tissue regions. The optical sensitivity within this banana-shaped region is not spatially uniform and is maximal for superficial tissue that is close to the source and the detector. In line with the approach considered in this work, it was previously suggested to use either one source and multiple detectors or one detector and multiple sources to reduce the sensitivity to a superficial tissue layer by considering slopes13–14 (what we call here “single slopes,” as defined in Section 2.1) or by subtraction methods.15 Despite the effectiveness of these approaches in reducing the sensitivity to thin, uniform superficial layers, they still feature banana shaped regions of sensitivity (albeit asymmetrical and bimodal) with maximal sensitivity close to the tissue surface for localized inhomogeneities.16–18 In this article, we consider an extension of single-slope methods that significantly improves upon them in terms of depth sensitivity.
As an alternative to a single source-detector distance (SD) or a single-slope arrangement (SS), we have recently proposed to use a special arrangement of two sources and two detectors to collect signals in a dual-slope approach (DS) that feature a dramatically different region of sensitivity.16–17 Such region of sensitivity, rather than extending all the way to the surface, is confined to deeper tissue and resembles the shape of nuts rather than bananas (hence the title of this article). The major outcome is that the region of maximal sensitivity is not at or close to the tissue surface (as in the case of the photon bananas), but is rather located deeper in the tissue. The depth of maximal sensitivity depends on the source-detector arrangement and is significantly greater for phase measurements (in frequency-domain diffuse optics) than for intensity measurements (in continuous-wave diffuse optics). Similar source-detector arrangements have also been considered to improve the depth sensitivity associated with statistical moments of the photon time-of-flight distribution measured in the time domain.18 Here, for the first time, we report the shape of the region of sensitivity for a variety of dual-slope source-detector arrangements.
2. Methods
2.1. Source-detector arrangements for dual slopes of intensity and phase
The most basic approach to diffuse optical measurements, especially in reflectance mode, employs a single source-detector pair, which obviously features a single distance (SD) between source and detector. An extension to this approach relies on the measurement of slopes (or gradients) of optical signals versus source-detector distance. This method requires collecting data at multiple (at least two) source-detector distances, which are typically realized using either a single source and multiple detectors or a single detector and multiple sources. We refer to this method as a single-slope (SS) method. A third approach, based on a concept originally introduced by Hueber et al.,19 and recently revisited and further developed by us,16–17 relies on averaging two paired slopes obtained with a special arrangement of a minimum of two sources and two detectors. We refer to this method as a dual-slope (DS) method. Here, we limit ourselves to the case of exactly two sources and two detectors, which is most practical and achieves the key objectives of the dual-slope method. The requirements for an arrangement of two sources (S1, S2) and two detectors (D1, D2) that is suitable for dual-slope measurements are as follows:
The distances between each source and the two detectors must be different, so that the two sets (S1,D1,D2) and (S2,D1,D2) realize two single-slope (SS) measurements, which we label SS1 and SS2;
The source-detector distance difference in SS1 and SS2, which we identify with ΔρSS1 and ΔρSS2, respectively, must be the same (ΔρSS1 = ΔρSS2);
If the distance between S1 and D1 is the shorter distance for SS1, then the distance between S2 and D1 must be the longer distance for SS2 (and vice versa). This condition and the one above (condition ii), are required for cancellation of unknown factors related to source emission and detector sensitivity properties, as well as unknown or variable efficiency of optical coupling between the optical probe and tissue;
The common value ΔρSS1 = ΔρSS2 must be limited to within a range; if Δρ is too small, the difference in the optical signals at the two distances may not exceed the measurement noise, whereas if Δρ is too large, the difference in the optical signals at the two distances may exceed the available dynamic range. In this work, we consider a range of values for Δρ of 10–20 mm;
The shorter source-detector distance in SS1 and SS2 must be greater than a minimum value that guarantees a suitable optical penetration beyond the superficial tissue layer. Such minimum value depends on the specific application. In this work, we consider a ρmin of 20 mm;
The longer source-detector distance in SS1 and SS2 must be less than a maximum value that fulfils condition (iv) and that guarantees a suitable signal-to-noise ratio (SNR) of the optical signal. In this work, we consider a ρmax of 40 mm.
One may see points i-iii above as strict requirements for the theoretical applicability of the dual slope approach, whereas points iv-vi are considerations for its practical applicability under given experimental conditions.
One can appreciate that there are many source-detector arrangements that satisfy the above requirements. In this article, we report a variety of such arrangements, and for each of them we report the associated regions of sensitivity, defined according to the sensitivity functions that are introduced next.
2.2. Sensitivity functions
The sensitivity of a diffuse optical signal to a given tissue volume is related to the photon hitting density, or partial optical pathlength, within that volume.20 One can express the sensitivity of a particular optical signal (intensity, phase, moments of the time-of-flight distribution, etc.) to a local change in a given optical parameter in terms of photon-measurement density functions.21 It is the latter concept that is relevant here, and may be expressed by the following sensitivity (SENS) of an optical signal to a point-like absorption perturbation at location r (δμa,r):21–22
| (1) |
where rSi, rDj are the position vectors of the source(s) and detector(s), enumerated by the indices i and j, respectively, that are used to generate the signal , whereas μa0 and are the background absorption and reduced scattering coefficients, respectively. With its meaning of a first-order partial derivative, Eq. (1) represents elements of a Jacobian matrix.
In this work, we adopt a related definition of sensitivity (S), which is a dimensionless ratio where the numerator is the apparent absorption change obtained from signal , and the denominator is the actual value of the absorption perturbation, δμa,r:
| (2) |
The apparent absorption change may be obtained under the assumption of a spatially homogeneous medium, even though the signal results from a localized absorption perturbation δμa,r. In the case of frequency-domain spectroscopy performed with one source and one detector, the signal may represent the intensity (I) (either its average value, DC (direct current) intensity, IDC, or the amplitude of intensity oscillations, AC (alternating current) amplitude, IAC) or the phase (ϕ) of the detected photon-density wave. Because in this case the optical data are collected at a single distance (SD) between source and detector, we refer to such intensity and phase signals as SDI and SDϕ, respectively. Using a first-order perturbation approach in diffusion theory, one can express the apparent absorption changes associated with SDI and SDϕ in terms of partial (i.e. through the volume of the absorption perturbation at r) and total (i.e. for all detected photons) mean optical pathlengths as follows:23
| (3) |
| (4) |
where lower-case l and upper-case L indicate partial and total mean pathlengths, respectively. Equation (3), for the case of DC Intensity (IDC), is related to the well-known modified Beer-Lambert law,24–25 which translates measured changes in single-distance intensity (ΔSDIDC) into apparent absorption changes. In the case of a homogeneous semi-infinite medium, with source and detector placed on the medium boundary at an inter-distance ρ, and zero boundary conditions, one can write:17
| (5) |
where SDIDC0 is the single-distance DC intensity measured in the reference medium characterized by and absorption coefficient μa0 and a reduced scattering coefficient . Equation (4) involves generalized mean pathlengths associated with SDϕ, which are further discussed and explicitly derived for a semi-infinite geometry using diffusion theory and zero boundary conditions elsewhere.16–17 The equation that translates changes in single-distance phase (ΔSDϕ) into apparent absorption changes in a homogeneous semi-infinite medium is the following:17
| (6) |
where , with ω angular frequency of intensity modulation and cn speed of light in the medium. Equations (5) and (6) assume that the reduced scattering coefficient remains constant (at the value ), as routinely done in the application of the modified Beer-Lambert law. The application of Eqs. (5) and (6) requires knowledge of the reference optical properties (μa0 and ), which typically refer to baseline conditions. One of the advantages of the frequency-domain dual-slope approach presented here is that it automatically affords absolute measurements of baseline optical properties by implementing the self-calibrating method.19 Therefore, in our dual-slope approach, the values of μa0 and are not assumed but actually measured.
In the case of two-source/two-detector arrangements suitable for dual-slope intensity and phase measurements, which we indicate with DSI and DSϕ, respectively, the expressions of Eqs. (3) and (4) become:16
| (7) |
| (8) |
where SS1 and SS2 refer to the two paired single-slopes considered in the dual-slope approach. Each single slope is based on two source-detector distances ρ1 and ρ2, which may be different in SS1 and SS2, as long as (ρ2 – ρ1)|SS1 = (ρ2 – ρ1)|SS2. The measured dual slopes of intensity (phase) is the average of the paired single slopes of intensity (phase). For a semi-infinite geometry using diffusion theory and zero boundary conditions, the equation that translates changes in dual-slope DC intensity and phase (ΔDSIDC and ΔDSϕ) into apparent absorption changes are the following:17
| (9) |
| (10) |
In this case of a semi-infinite geometry, the intensity and phase slopes (dual slopes or single slopes) of linear functions of ρ refer to specific expressions for IDC and ϕ, respectively, which are sometimes approximated by ln[ρ2IDC(ρ)] and ϕ(ρ).22 Similar to the case of Eqs. (5) and (6), the scattering coefficient is assumed to stay constant at , and the reference optical properties μa0 and are measured at baseline using the frequency-domain self-calibrating method.19
In light of Eqs. (3), (4), (7), and (8), one can appreciate that the sensitivity definition of Eq. (2) simply represents a combination of partial mean pathlengths within the absorption perturbation and total mean pathlengths (or generalized pathlengths in the case of phase or slope measurements) associated with the optical signal of interest.
2.3. Diffusion theory for a semi-infinite medium containing an absorption inhomogeneity
The regions of sensitivity for intensity and phase in single-distance (SD) and dual-slope (DS) configurations were obtained using diffusion theory in a semi-infinite geometry. All light sources and optical detectors were placed at the interface between the scattering medium (tissue) and the outside non-scattering medium (air), on the x-y plane at z = 0 (with the scattering medium occupying the half-space z > 0). We have considered an intensity modulation frequency of 140 MHz. We introduced an effective point-source located inside the medium, underneath the actual light source, at a depth and considered extrapolated boundary conditions, with the extrapolated boundary at , where A is a reflection factor that depends on the refractive index mismatch at the interface.26 In our case, for a tissue-air interface with a refractive index ratio of ~1.4, A = 2.95. We considered a medium with an absorption coefficient μa = 0.1 cm−1 and a reduced scattering coefficient cm−1. Consequently, the effective sources were at a depth of 0.8 mm inside the medium, and the extrapolated boundary was 1.6 mm outside the medium.
The optical signals in the presence of a localized absorption inhomogeneity were computed with first-order perturbation theory. The absorption perturbation was set to have an absorption coefficient 30% greater than the background (Δμa = 0.03 cm−1), and a size of 10mm×10mm×2mm along x, y, and z, respectively. The rationale for this choice is provided in the Discussion section. As this absorption perturbation was scanned within the medium, the sensitivity obtained from Eqs. (3), (4), (7), and (8) was assigned to its central location to map the region of sensitivity.
To take into account the different noise level of intensity and phase measurements with single-distance and dual-slope methods, we set a threshold for the sensitivity values at a signal-to-noise ratio (SNR) of 1. In other words, we gray out sensitivity values that are equal or less than the noise level. To estimate such noise level, we have considered an intensity noise of 0.4% and a phase noise of 0.06°, which are propagated to yield noise levels for the various sensitivities considered.
3. Results
The thirteen figures of this article illustrate the regions of sensitivity for a variety of source-detector configurations. Figures 1 and 2 report single-distance (SD) cases, whereas Figs. 3–13 report dual-slope (DS) cases. While there are many different ways to arrange two sources and two detectors to realize dual-slope measurements, in this work we report a set of representative cases that embody a variety of cases, including linear, square, rectangular, rhomboid, and trapezoid arrangements. The objective of this work is to describe the regions of sensitivity of the various arrangements, with the twofold purpose of (1) illustrating the dual-slope approach, and (2) providing indications of different spatial sensitivity features that may be achieved. These different features can inform the selection of the most suitable arrangement(s) for specific applications that may target either point measurements or imaging.
Fig. 1.
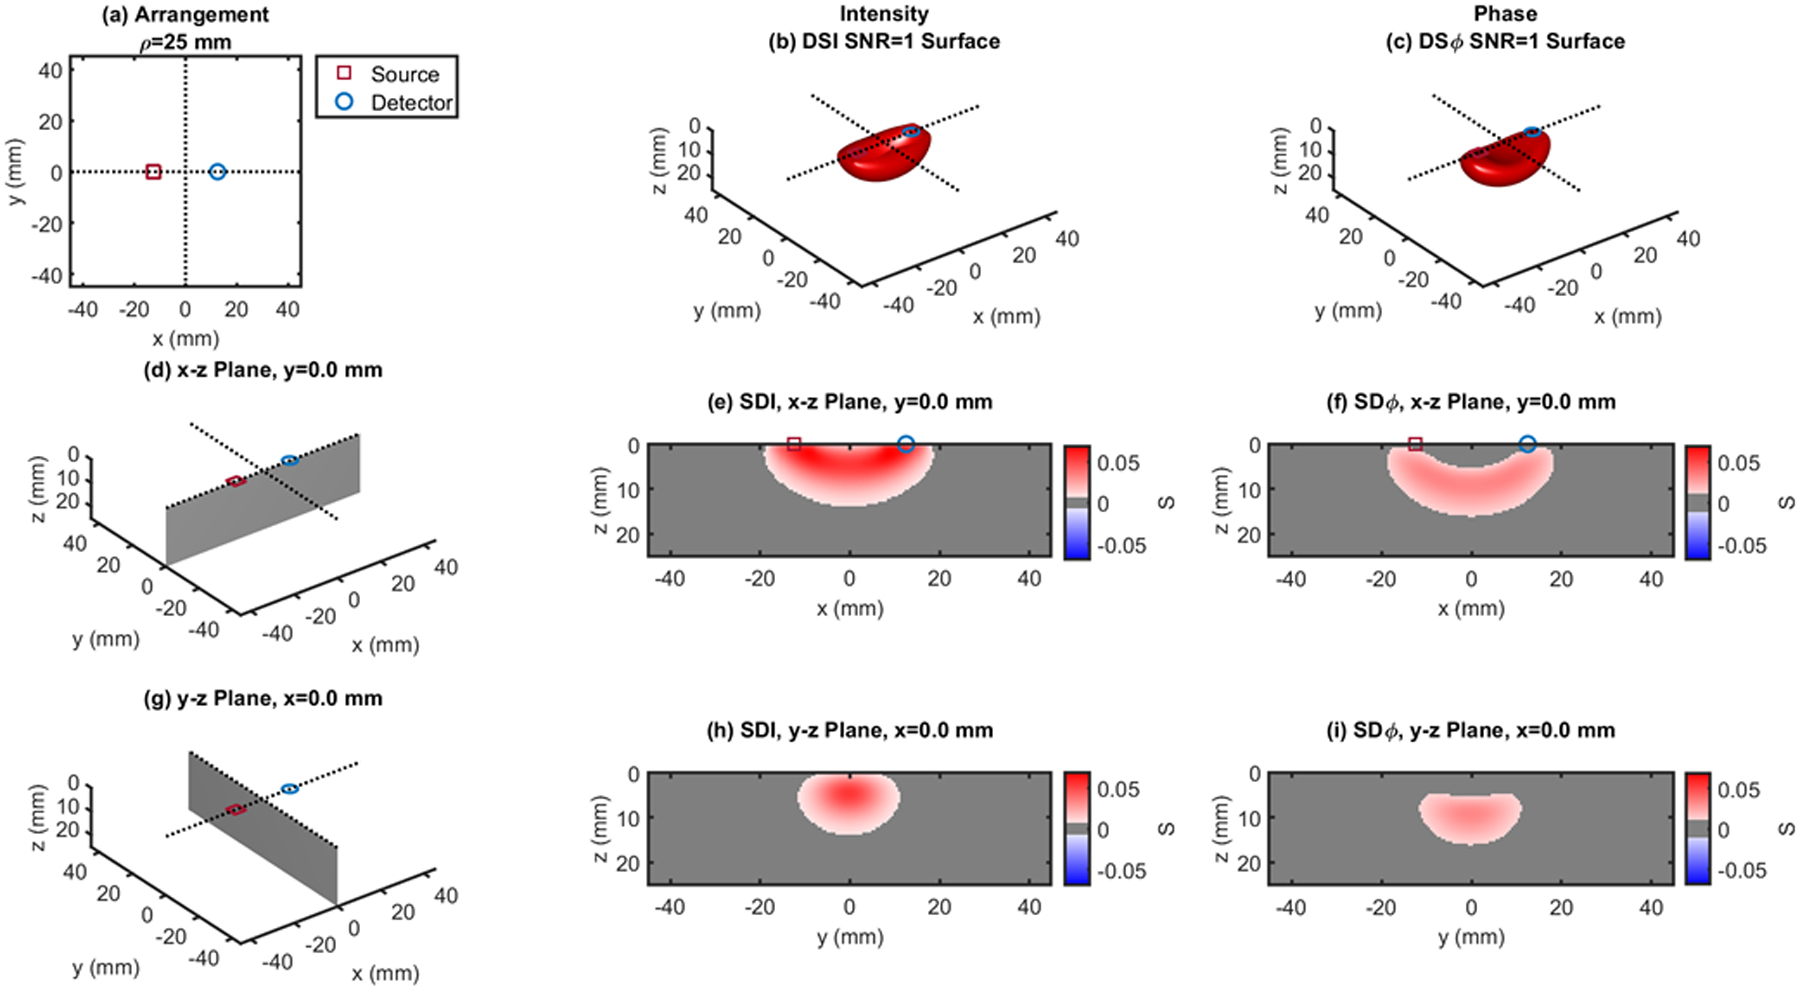
Single-distance (SD) case: ρ = 25 mm. (a) Source-detector arrangement in the x-y plane at z = 0. 3D rendition of the regions of sensitivity for (b) intensity and (c) phase. (d) Longitudinal x-z plane at y = 0 (shaded), and cross sections over this plane of the regions of sensitivity for (e) intensity and (f) phase. (g) Transverse y-z plane at x = 0 (shaded), and cross sections over this plane of the regions of sensitivity for (h) intensity and (i) phase. All regions of sensitivity are bounded by the surface or line at a signal-to-noise ratio (SNR) of 1. SDI: single-distance intensity; SDϕ: single-distance phase.
Fig. 2.
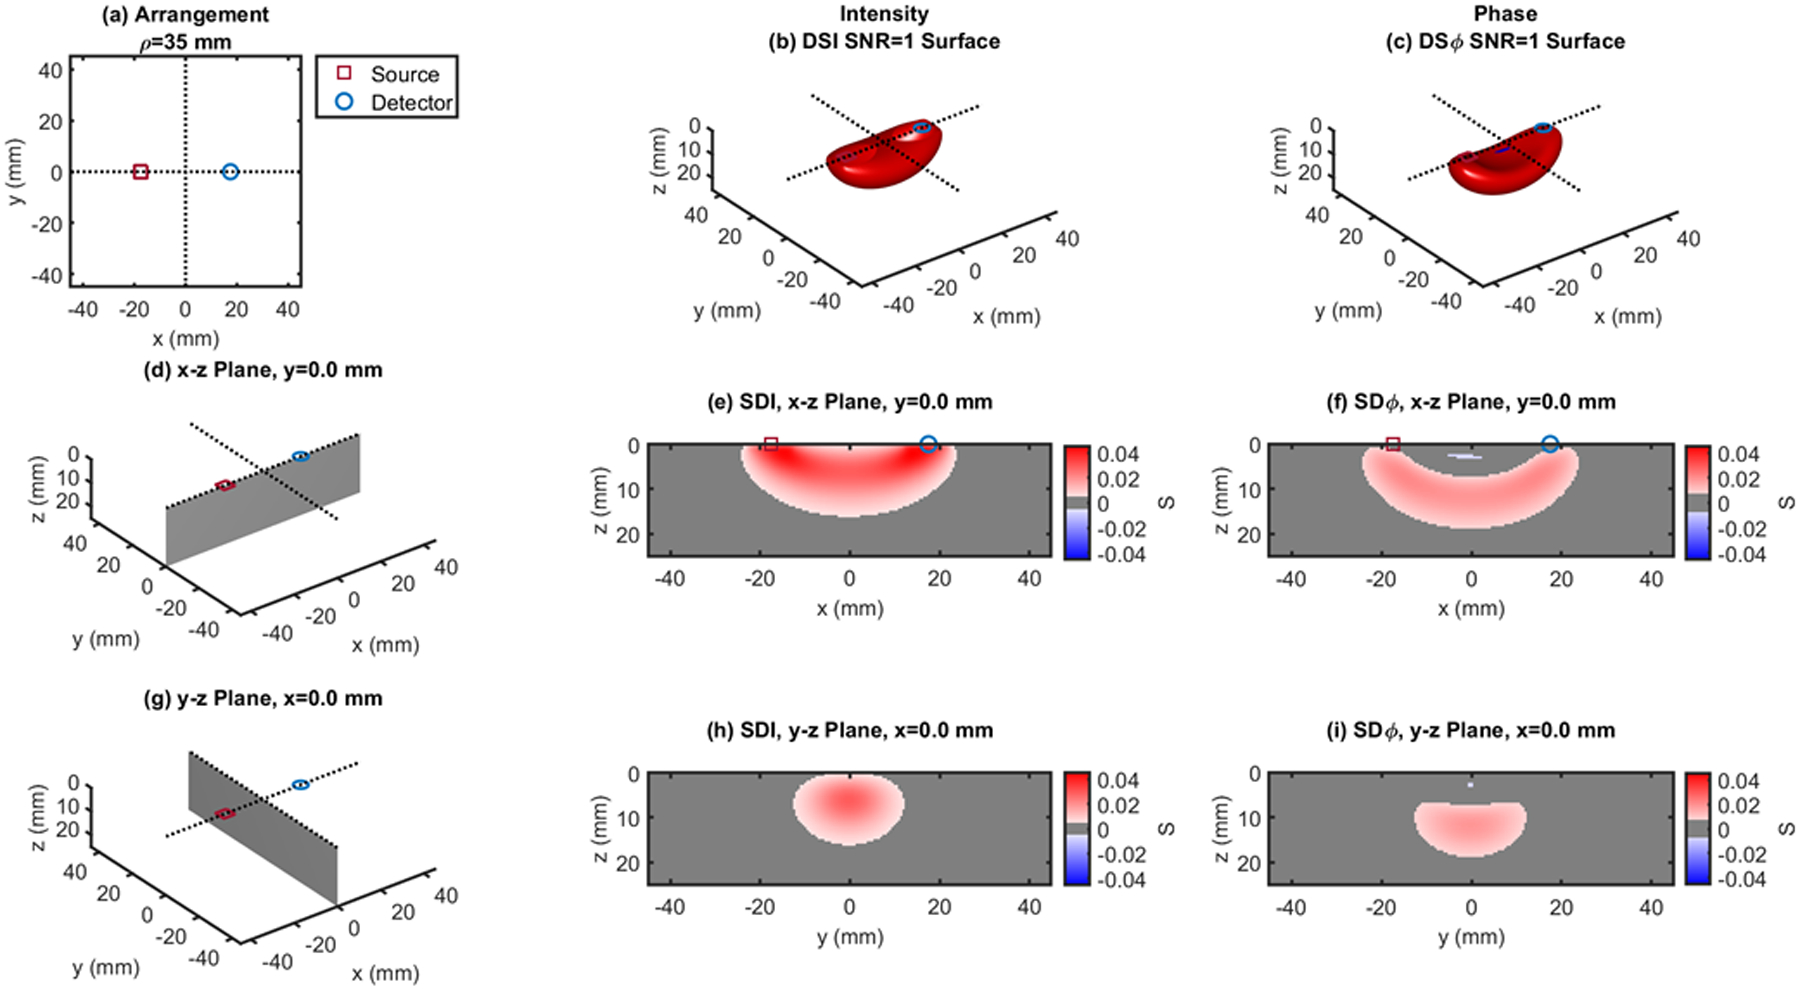
Single-distance (SD) case: ρ = 35 mm. (a) Source-detector arrangement in the x-y plane at z = 0. 3D rendition of the regions of sensitivity for (b) intensity and (c) phase. (d) Longitudinal x-z plane at y = 0 (shaded), and cross sections over this plane of the regions of sensitivity for (e) intensity and (f) phase. (g) Transverse y-z plane at x = 0 (shaded), and cross sections over this plane of the regions of sensitivity for (h) intensity and (i) phase. All regions of sensitivity are bounded by the surface or line at a signal-to-noise ratio (SNR) of 1. SDI: single-distance intensity; SDϕ: single-distance phase.
Fig. 3.
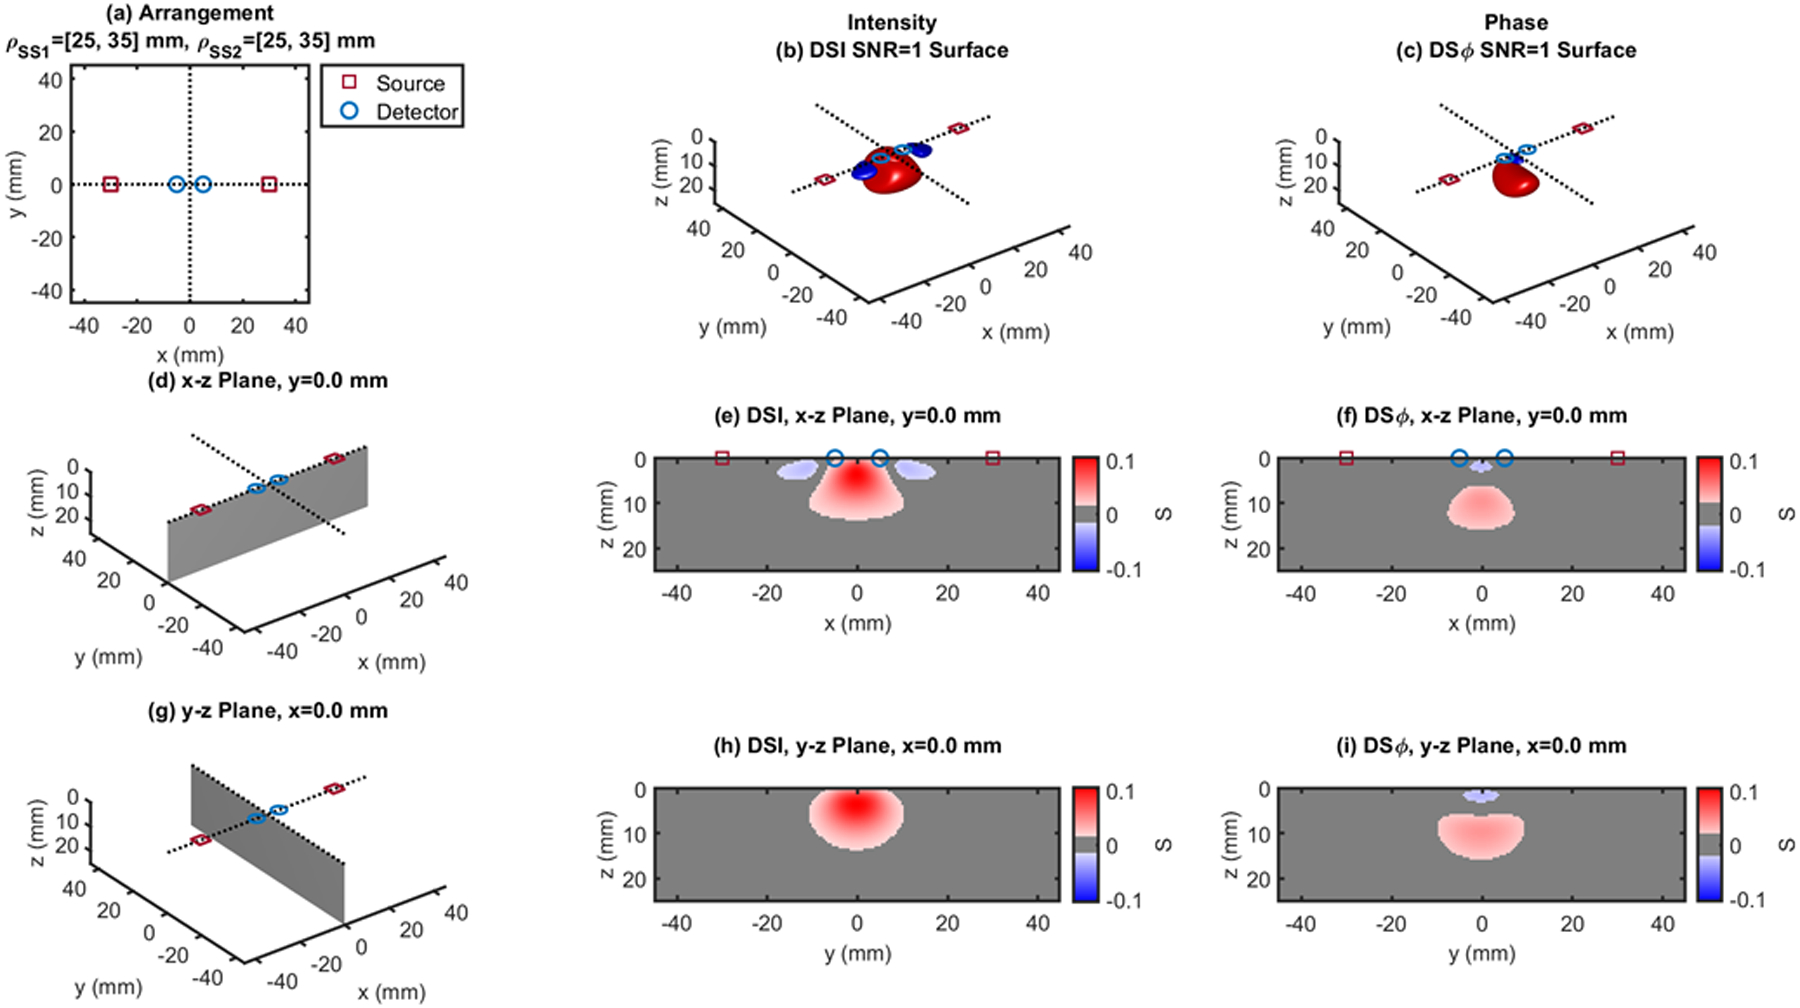
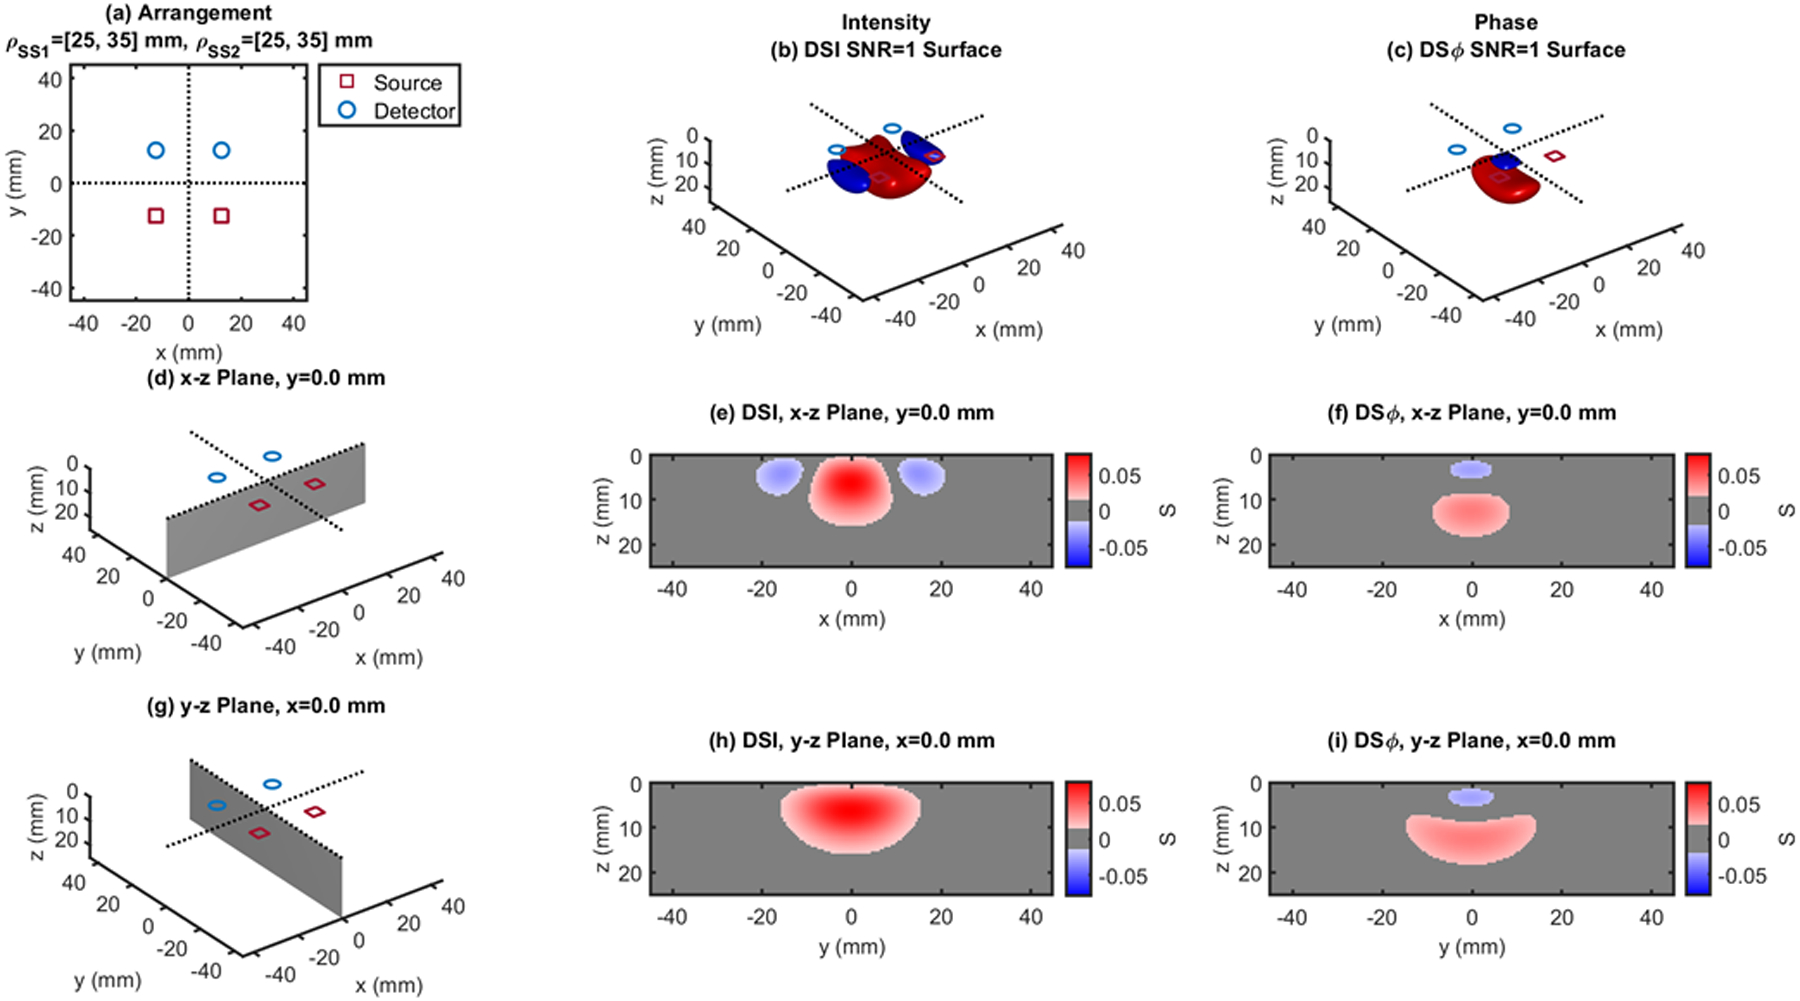
Dual-slope (DS) case based on two single slopes (SS1 and SS2) that feature source-detector distance of 25, 35 mm (ρSS1) and 25, 35 mm (ρSS2), respectively. (a) Source-detector arrangement in the x-y plane at z = 0 (Linear: LIN). 3D rendition of the regions of sensitivity for (b) intensity and (c) phase. (d) Longitudinal x-z plane at y = 0 (shaded), and cross sections over this plane of the regions of sensitivity for (e) intensity and (f) phase. (g) Transverse y-z plane at x = 0 (shaded), and cross sections over this plane of the regions of sensitivity for (h) intensity and (i) phase. All regions of sensitivity are bounded by the surface or line at a signal-to-noise ratio (SNR) of 1. SDI: single-distance intensity; SDϕ: single-distance phase.
Fig. 13.
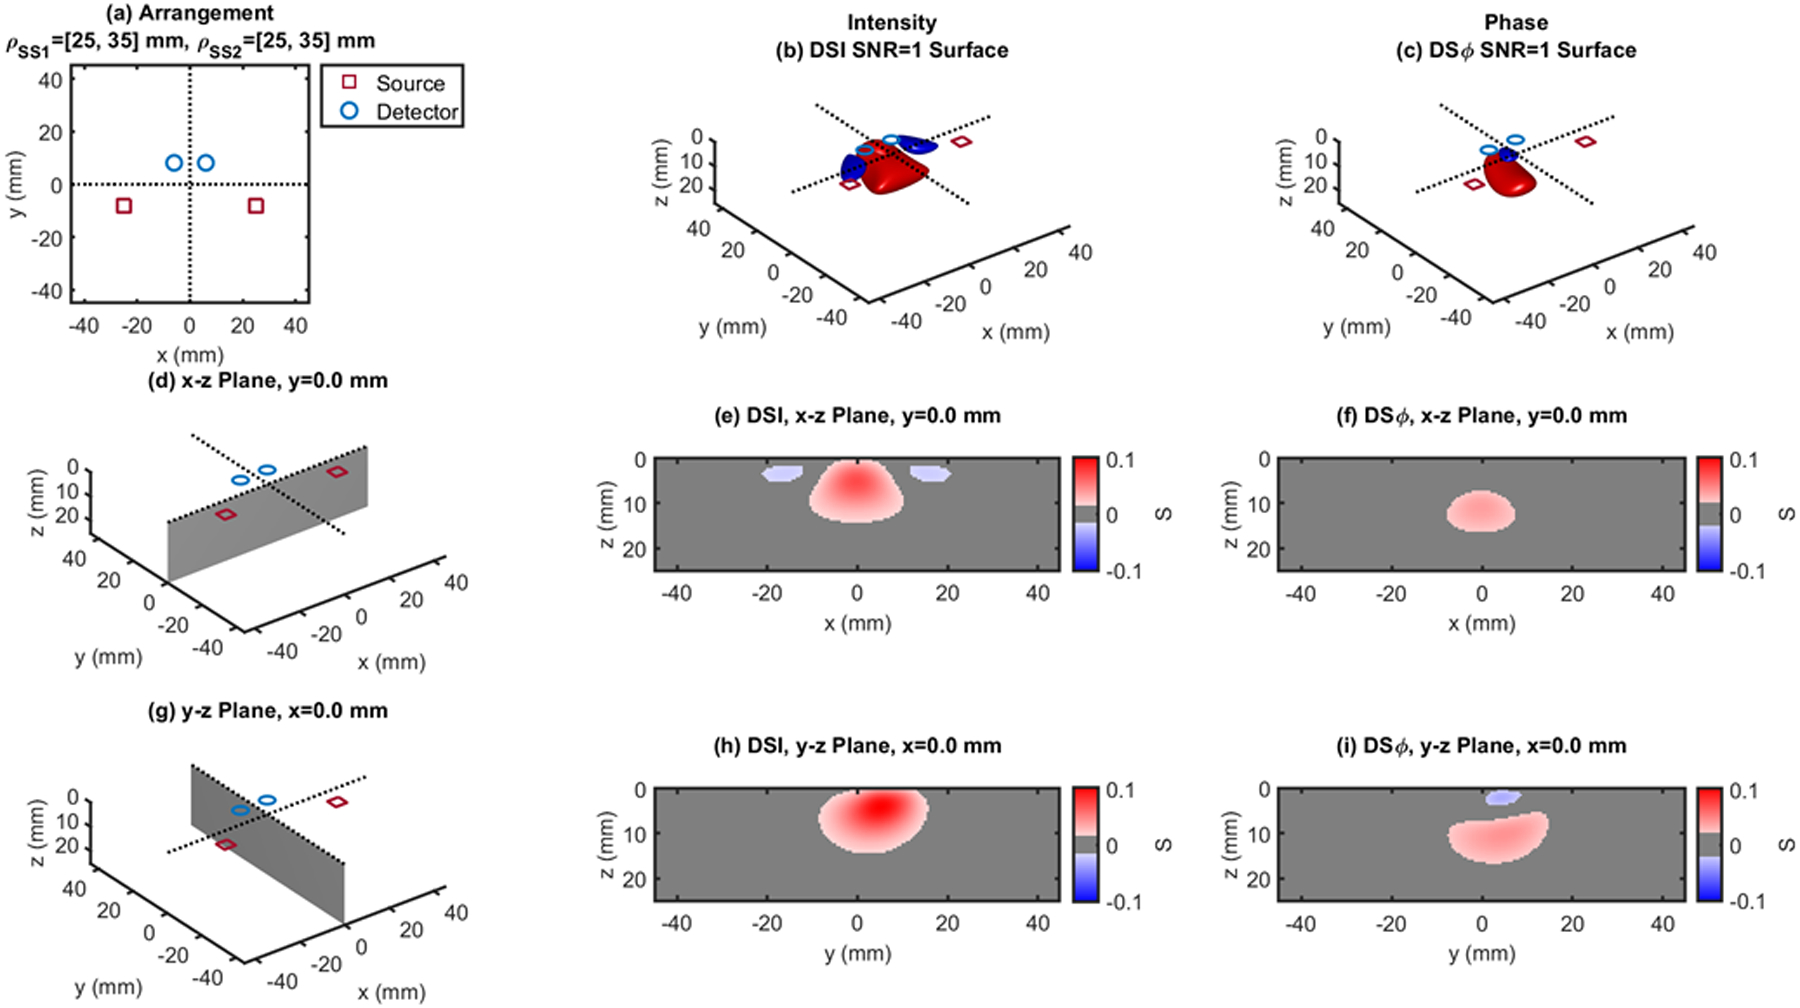
Dual-slope (DS) case based on two single slopes (SS1 and SS2) that feature source-detector distance of 25, 35 mm (ρSS1) and 25, 35 mm (ρSS2), respectively. (a) Source-detector arrangement in the x-y plane at z = 0 (Trapezoid: TPZ). 3D rendition of the regions of sensitivity for (b) intensity and (c) phase. (d) Longitudinal x-z plane at y = 0 (shaded), and cross sections over this plane of the regions of sensitivity for (e) intensity and (f) phase. (g) Transverse y-z plane at x = 0 (shaded), and cross sections over this plane of the regions of sensitivity for (h) intensity and (i) phase. All regions of sensitivity are bounded by the surface or line at a signal-to-noise ratio (SNR) of 1. SDI: single-distance intensity; SDϕ: single-distance phase.
In all figures, panel (a) reports the arrangement of sources (red squares) and detectors (blue circles) on the x-y plane (at z = 0), with an indication of the relevant source-detector distances (ρ in the single-distance case of Figs. 1 and 2; ρSS1 and ρSS2 in the dual-slope case of Figs. 3–13). Panels (b) and (c) report a 3D rendition of the regions of sensitivity for intensity and phase, respectively, with surfaces defined by a signal-to-noise ratio (SNR) of 1, and color-coded signs of sensitivity (red: positive; blue: negative). Panel (d) shows the x-z plane (at y = 0) for which the cross-section of the regions of sensitivity of intensity and phase are shown in panels (e) and (f), respectively. Finally, panel (g) shows the y-z plane (at x = 0) for which the cross-section of the regions of sensitivity of intensity and phase are shown in panels (h) and (i), respectively.
Figures 1 and 2 show single-distance (SD) cases at ρ = 25 mm (Fig. 1) and ρ = 35 mm (Fig. 2), where one can appreciate the banana shaped region of sensitivity for both intensity and phase in the 3D rendition ((b) and (d)) and in the x-z plane ((e) and (f)). A comparison of Figs 1 and 2 shows the expected deepening of the overall regions of sensitivity with increasing source-detector distance. A comparison of panels (e) and (f), and panels (h) and (i) in each of Figs. 1 and 2 shows the deeper sensitivity of phase versus intensity data. This result is consistent with previous reports of regions of sensitivity in the frequency domain,27 a deeper sensitivity of the first moment (essentially the phase), and even more so of the second moment (variance), versus the zeroth moment (intensity) of the photon time-of-flight distribution measured in the time domain,28 and a stronger sensitivity to brain tissue of phase versus intensity measurements in non-invasive brain studies.29–30
Figures 3–13 show the dual-slope regions of sensitivity for intensity (center panels) and phase (right panels) for a variety of source-detector configurations that are suitable for dual-slope measurements. The source-detector distances are the same (25 and 35mm) or comparable (20–40mm) to the single-distances of Figs. 1 and 2, so that a comparison of the depth of sensitivity is meaningful across all figures. Some of the dual-slope arrangements are symmetrical (Figs. 3, 5, 6, 9, 10–13) and some are asymmetrical (Figs. 4, 7, 8). We refer to the reported configurations as linear (LIN) (Figs. 3, 4), rhomboid (RHO) (Figs. 5, 6), quadrilateral (QDL) (Fig. 7), irregular (IRR) (Fig. 8), rectangular (RCT) (Figs. 9–11), square (SQR) (Fig. 12), trapezoid (TPZ) (Fig. 13).
Fig. 5.
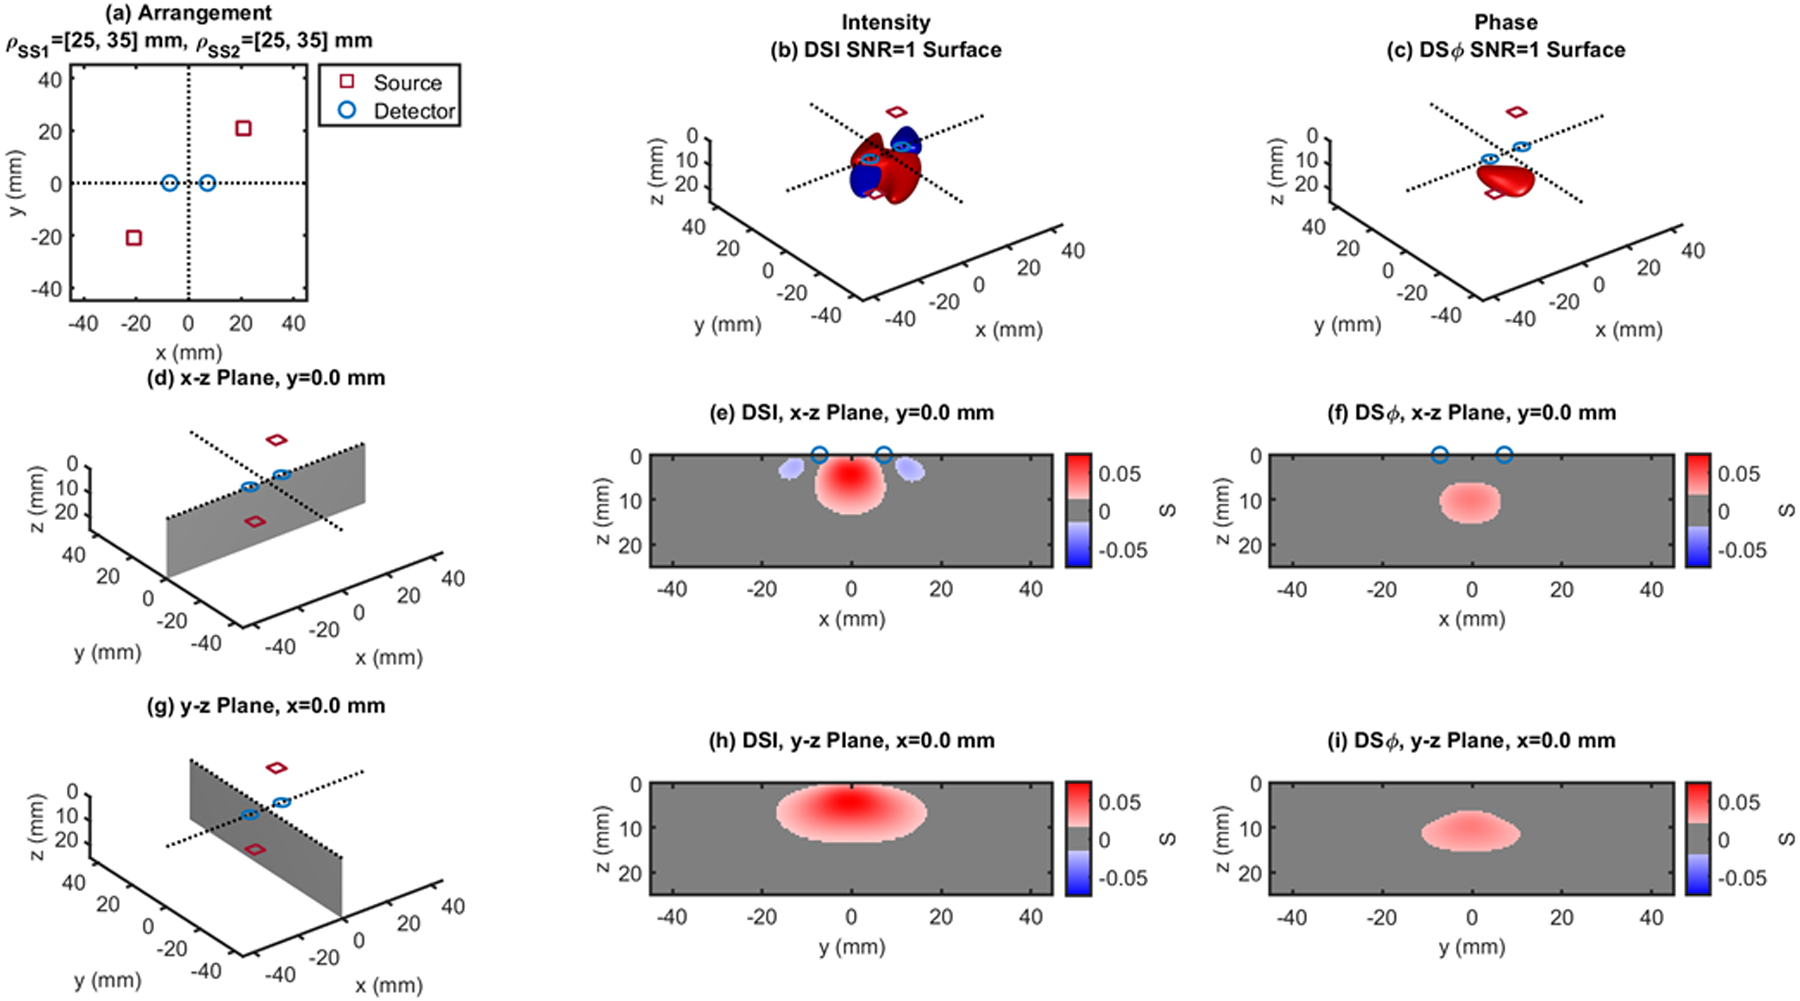
Dual-slope (DS) case based on two single slopes (SS1 and SS2) that feature source-detector distance of 25, 35 mm (ρSS1) and 25, 35 mm (ρSS2), respectively. (a) Source-detector arrangement in the x-y plane at z = 0 (Rhomboid: RHO). 3D rendition of the regions of sensitivity for (b) intensity and (c) phase. (d) Longitudinal x-z plane at y = 0 (shaded), and cross sections over this plane of the regions of sensitivity for (e) intensity and (f) phase. (g) Transverse y-z plane at x = 0 (shaded), and cross sections over this plane of the regions of sensitivity for (h) intensity and (i) phase. All regions of sensitivity are bounded by the surface or line at a signal-to-noise ratio (SNR) of 1. SDI: single-distance intensity; SDϕ: single-distance phase.
Fig. 6.
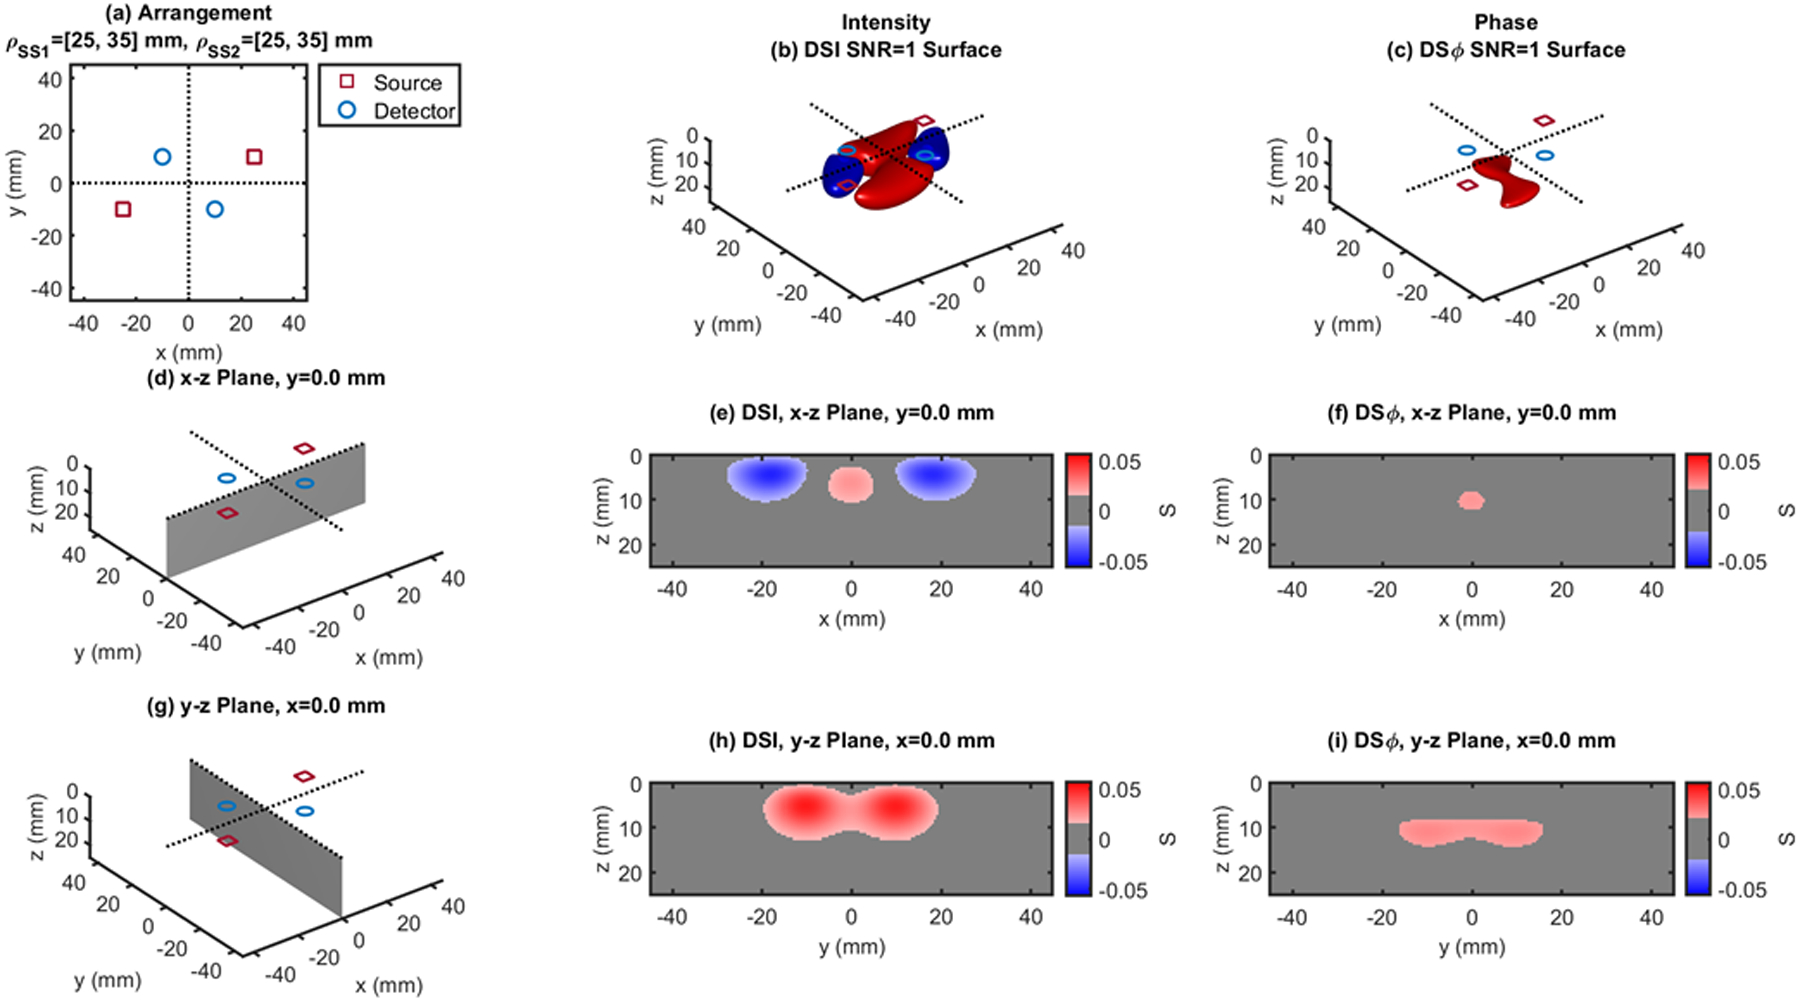
Dual-slope (DS) case based on two single slopes (SS1 and SS2) that feature source-detector distance of 25, 35 mm (ρSS1) and 25, 35 mm (ρSS2), respectively. (a) Source-detector arrangement in the x-y plane at z = 0 (Rhomboid: RHO). 3D rendition of the regions of sensitivity for (b) intensity and (c) phase. (d) Longitudinal x-z plane at y = 0 (shaded), and cross sections over this plane of the regions of sensitivity for (e) intensity and (f) phase. (g) Transverse y-z plane at x = 0 (shaded), and cross sections over this plane of the regions of sensitivity for (h) intensity and (i) phase. All regions of sensitivity are bounded by the surface or line at a signal-to-noise ratio (SNR) of 1. SDI: single-distance intensity; SDϕ: single-distance phase.
Fig. 9.
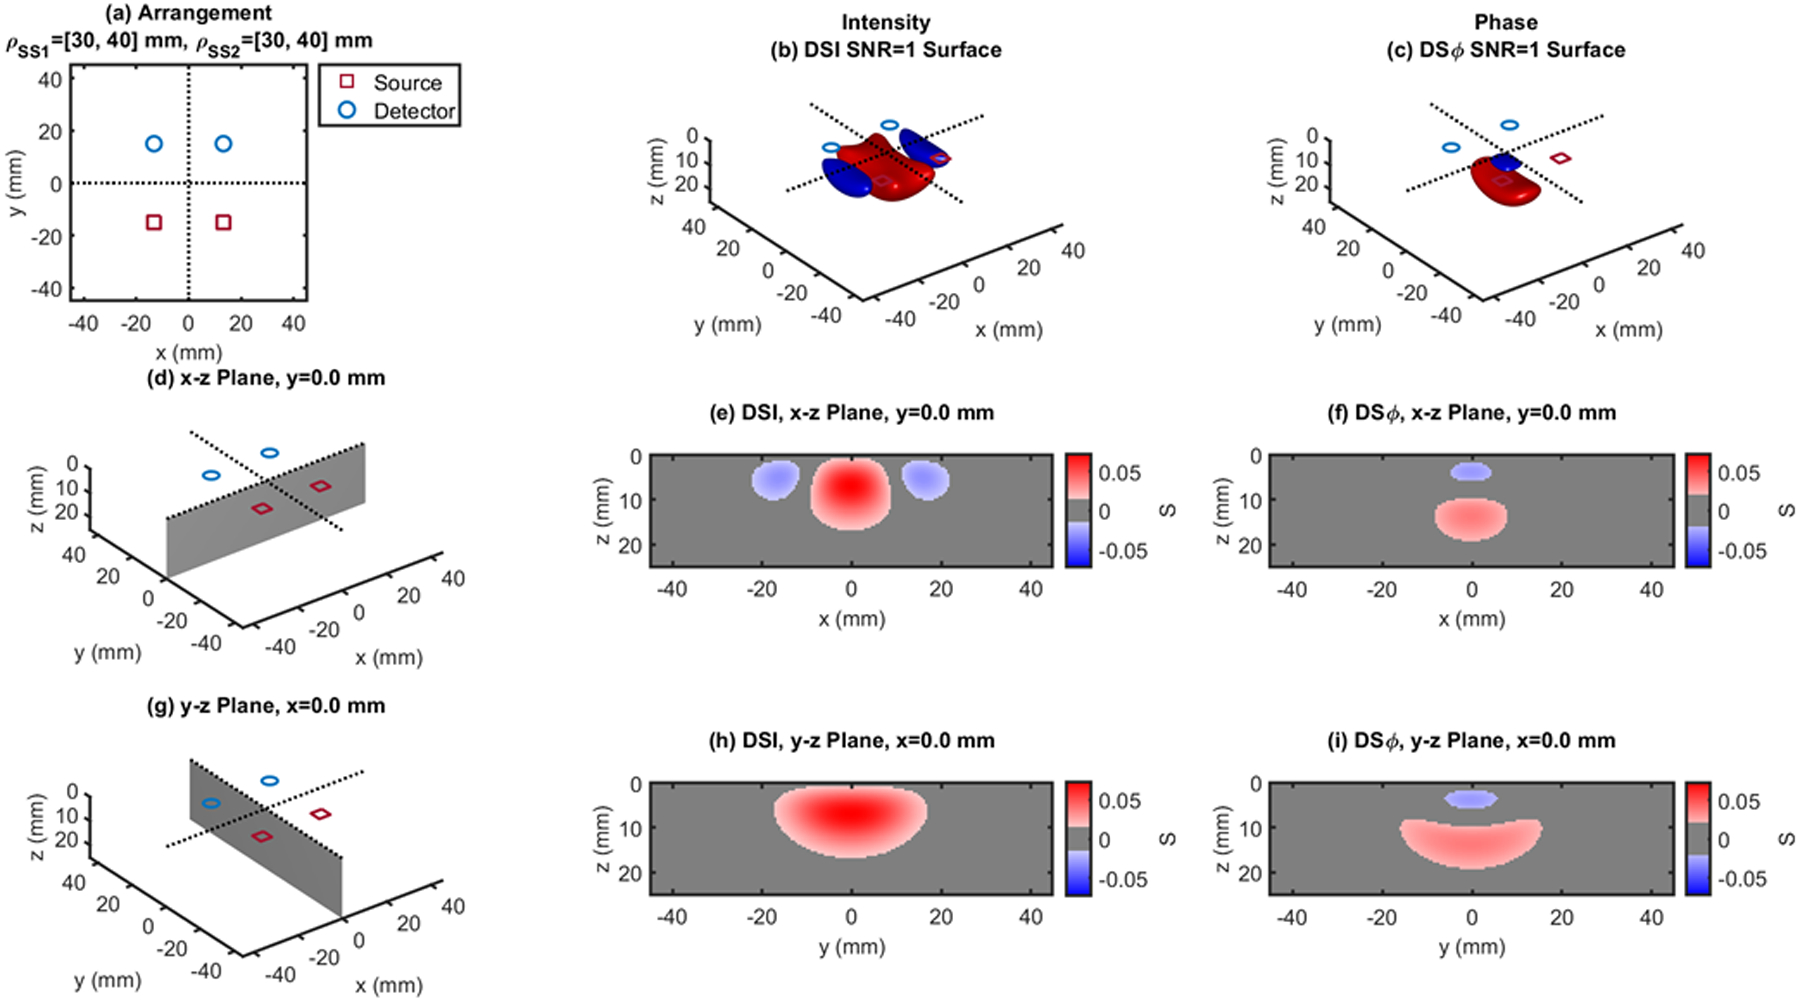
Dual-slope (DS) case based on two single slopes (SS1 and SS2) that feature source-detector distance of 30, 40 mm (ρSS1) and 30, 40 mm (ρSS2), respectively. (a) Source-detector arrangement in the x-y plane at z = 0 (Rectangle: RCT). 3D rendition of the regions of sensitivity for (b) intensity and (c) phase. (d) Longitudinal x-z plane at y = 0 (shaded), and cross sections over this plane of the regions of sensitivity for (e) intensity and (f) phase. (g) Transverse y-z plane at x = 0 (shaded), and cross sections over this plane of the regions of sensitivity for (h) intensity and (i) phase. All regions of sensitivity are bounded by the surface or line at a signal-to-noise ratio (SNR) of 1. SDI: single-distance intensity; SDϕ: single-distance phase.
Fig. 10.
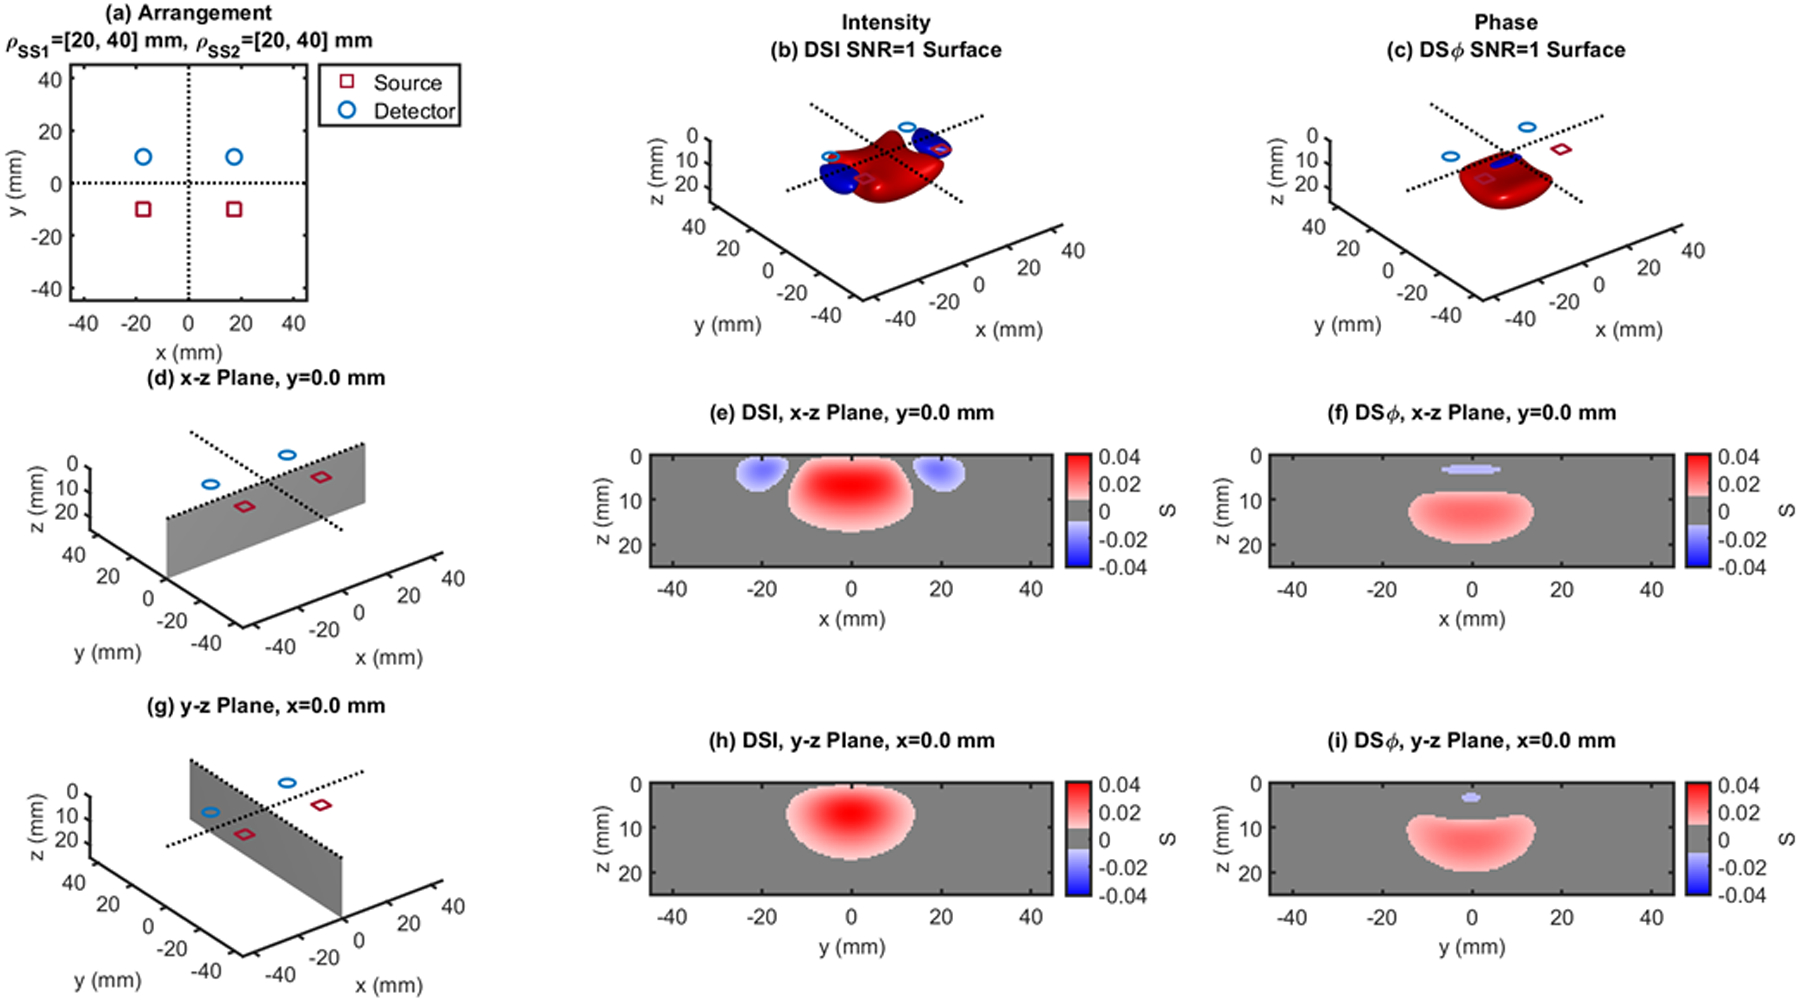
Dual-slope (DS) case based on two single slopes (SS1 and SS2) that feature source-detector distance of 20, 40 mm (ρSS1) and 20, 40 mm (ρSS2), respectively. (a) Source-detector arrangement in the x-y plane at z = 0 (Rectangle: RCT). 3D rendition of the regions of sensitivity for (b) intensity and (c) phase. (d) Longitudinal x-z plane at y = 0 (shaded), and cross sections over this plane of the regions of sensitivity for (e) intensity and (f) phase. (g) Transverse y-z plane at x = 0 (shaded), and cross sections over this plane of the regions of sensitivity for (h) intensity and (i) phase. All regions of sensitivity are bounded by the surface or line at a signal-to-noise ratio (SNR) of 1. SDI: single-distance intensity; SDϕ: single-distance phase.
Fig. 4.
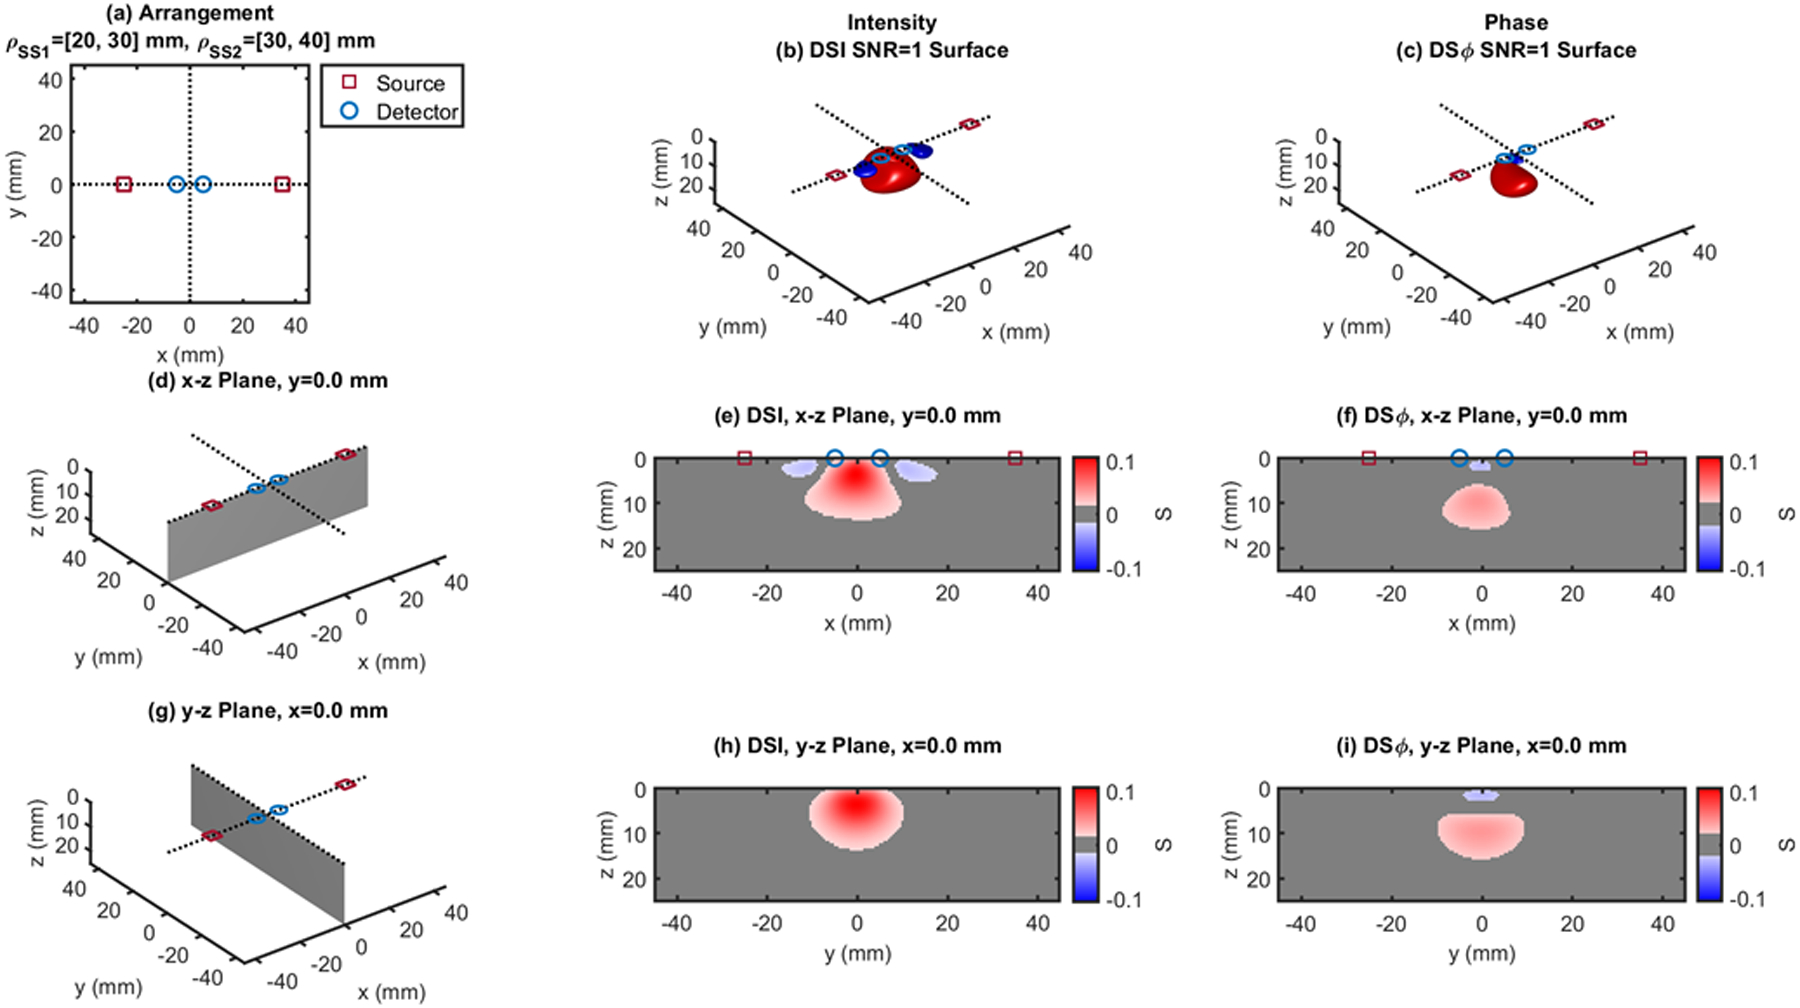
Dual-slope (DS) case based on two single slopes (SS1 and SS2) that feature source-detector distance of 20, 30 mm (ρSS1) and 30, 40 mm (ρSS2), respectively. (a) Source-detector arrangement in the x-y plane at z = 0 (Linear: LIN). 3D rendition of the regions of sensitivity for (b) intensity and (c) phase. (d) Longitudinal x-z plane at y = 0 (shaded), and cross sections over this plane of the regions of sensitivity for (e) intensity and (f) phase. (g) Transverse y-z plane at x = 0 (shaded), and cross sections over this plane of the regions of sensitivity for (h) intensity and (i) phase. All regions of sensitivity are bounded by the surface or line at a signal-to-noise ratio (SNR) of 1. SDI: single-distance intensity; SDϕ: single-distance phase.
Fig. 7.
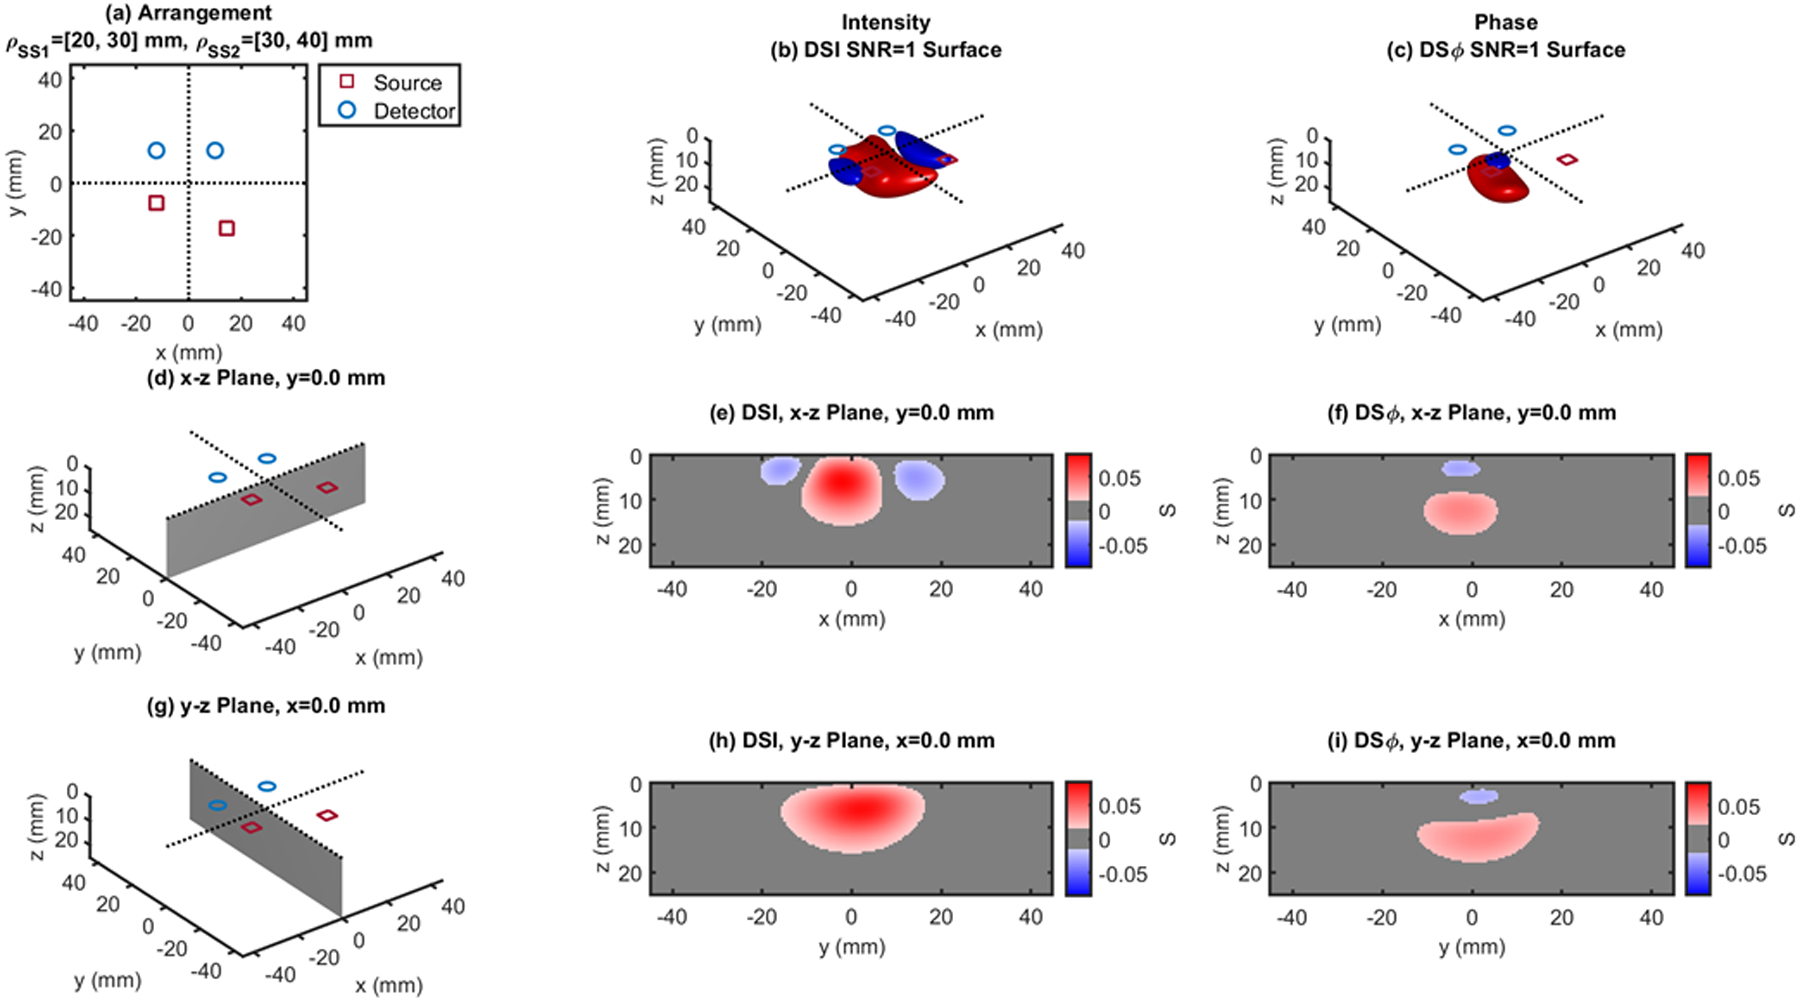
Dual-slope (DS) case based on two single slopes (SS1 and SS2) that feature source-detector distance of 20, 30 mm (ρSS1) and 30, 40 mm (ρSS2), respectively. (a) Source-detector arrangement in the x-y plane at z = 0 (Quadrilateral: QDL). 3D rendition of the regions of sensitivity for (b) intensity and (c) phase. (d) Longitudinal x-z plane at y = 0 (shaded), and cross sections over this plane of the regions of sensitivity for (e) intensity and (f) phase. (g) Transverse y-z plane at x = 0 (shaded), and cross sections over this plane of the regions of sensitivity for (h) intensity and (i) phase. All regions of sensitivity are bounded by the surface or line at a signal-to-noise ratio (SNR) of 1. SDI: single-distance intensity; SDϕ: single-distance phase.
Fig. 8.
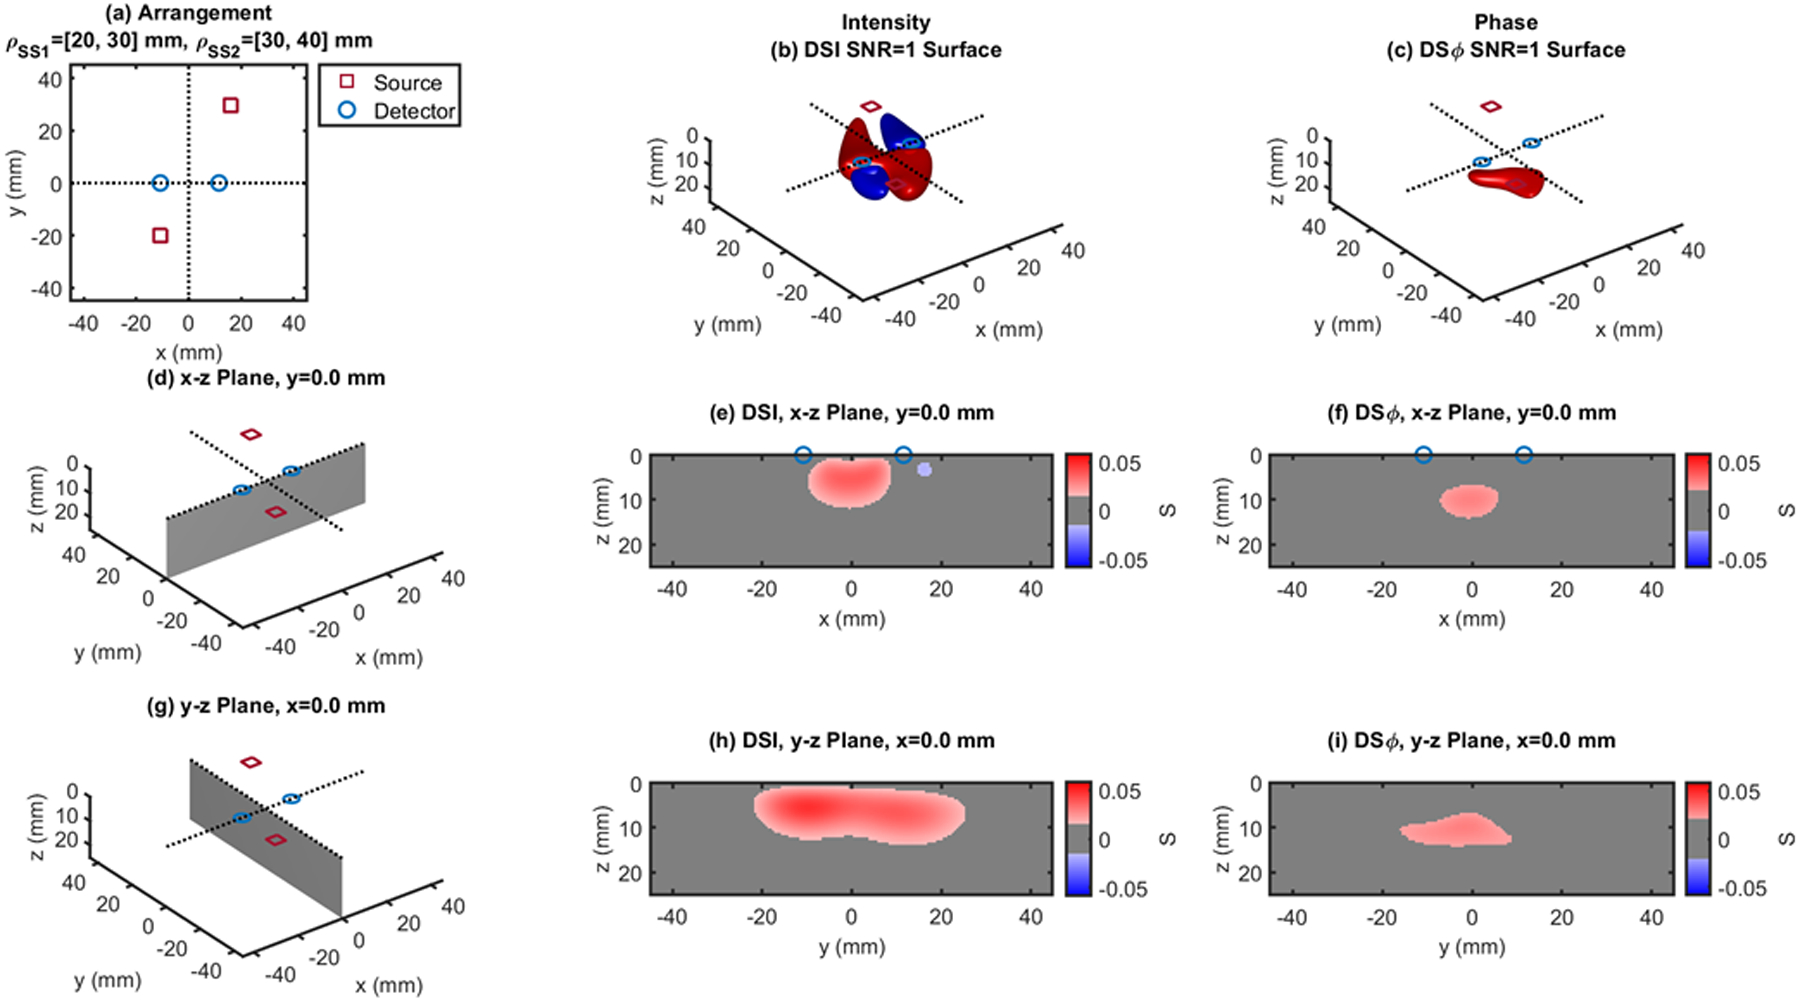
Dual-slope (DS) case based on two single slopes (SS1 and SS2) that feature source-detector distance of 20, 30 mm (ρSS1) and 30, 40 mm (ρSS2), respectively. (a) Source-detector arrangement in the x-y plane at z = 0 (Irregular: IRR). 3D rendition of the regions of sensitivity for (b) intensity and (c) phase. (d) Longitudinal x-z plane at y = 0 (shaded), and cross sections over this plane of the regions of sensitivity for (e) intensity and (f) phase. (g) Transverse y-z plane at x = 0 (shaded), and cross sections over this plane of the regions of sensitivity for (h) intensity and (i) phase. All regions of sensitivity are bounded by the surface or line at a signal-to-noise ratio (SNR) of 1. SDI: single-distance intensity; SDϕ: single-distance phase.
Fig. 11.
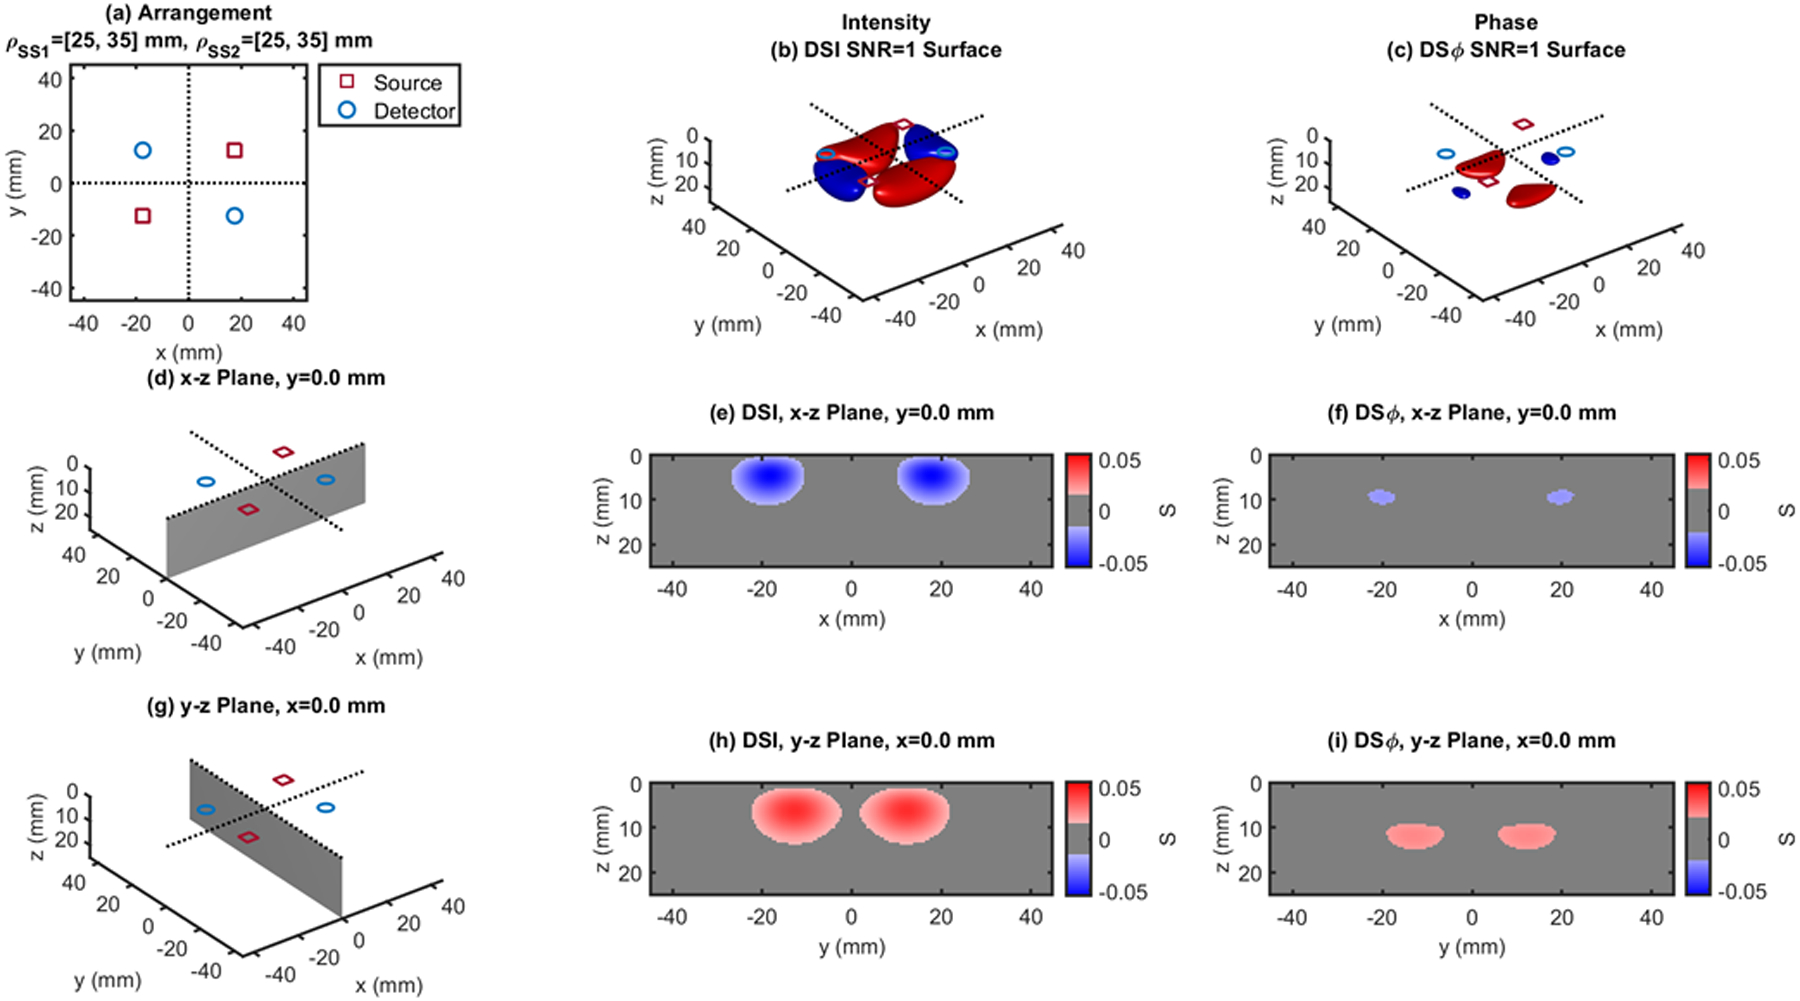
Dual-slope (DS) case based on two single slopes (SS1 and SS2) that feature source-detector distance of 25, 35 mm (ρSS1) and 25, 35 mm (ρSS2), respectively. (a) Source-detector arrangement in the x-y plane at z = 0 (Rectangle: RCT). 3D rendition of the regions of sensitivity for (b) intensity and (c) phase. (d) Longitudinal x-z plane at y = 0 (shaded), and cross sections over this plane of the regions of sensitivity for (e) intensity and (f) phase. (g) Transverse y-z plane at x = 0 (shaded), and cross sections over this plane of the regions of sensitivity for (h) intensity and (i) phase. All regions of sensitivity are bounded by the surface or line at a signal-to-noise ratio (SNR) of 1. SDI: single-distance intensity; SDϕ: single-distance phase.
Fig. 12.
Dual-slope (DS) case based on two single slopes (SS1 and SS2) that feature source-detector distance of 25, 35 mm (ρSS1) and 25, 35 mm (ρSS2), respectively. (a) Source-detector arrangement in the x-y plane at z = 0 (Square: SQR). 3D rendition of the regions of sensitivity for (b) intensity and (c) phase. (d) Longitudinal x-z plane at y = 0 (shaded), and cross sections over this plane of the regions of sensitivity for (e) intensity and (f) phase. (g) Transverse y-z plane at x = 0 (shaded), and cross sections over this plane of the regions of sensitivity for (h) intensity and (i) phase. All regions of sensitivity are bounded by the surface or line at a signal-to-noise ratio (SNR) of 1. SDI: single-distance intensity; SDϕ: single-distance phase.
The cross-sections in the x-z plane of the regions of sensitivity in Figs. 3–13 resemble, rather than the bananas of Figs. 1 and 2, different kinds of nuts (hazelnuts, chestnuts, cashew nuts, etc.), and one can even see a peanut in the y-z cross sections of Figs. 6(h) and 6(i). Most importantly, the maximum value of the region of sensitivity occurs deeper in the tissue for dual-slope than for single-distance and is always deeper for the phase than for the intensity. In Table I, we report the value and coordinates of the maximal sensitivity of intensity and phase for all source-detector arrangements considered in Figs. 1–13. From Table I, one may appreciate the trade-off between depth of sensitivity and level of sensitivity for intensity versus phase, and for single-distance versus dual slope. In particular, considering only cases that use source-detector separations of 25 and 35 mm for a more meaningful comparison, the depth of maximum sensitivity progressively increases as we consider single-distance intensity (2.0 mm), dual-slope intensity (4.6 mm), single-distance phase (7.5 mm), and dual-slope phase (10.9 mm). Correspondingly, the value of maximum sensitivity for these cases is: single-distance intensity (0.058), dual-slope intensity (0.077), single-distance phase (0.027), and dual-slope phase (0.036).
Table I.
Maximum sensitivity values and spatial coordinates of maximum sensitivity for intensity and phase measurements in the single-distance (SD) and dual-slope (DS) arrangements reported in Figs. 1–13 (LIN: linear; RHO: rhomboid; QDL: quadrilateral; IRR: irregular; RCT: rectangle; SQR: square; TPZ: trapezoid). The size of the optical inhomogeneity is 10×10×2 mm3.
| Intensity | Phase | |||||||||
|---|---|---|---|---|---|---|---|---|---|---|
| Mode | Shape-Figure | Distances (mm) | Maximum Sensitivity | x (mm) | y (mm) | z (mm) | Maximum Sensitivity | x (mm) | y (mm) | z (mm) |
| SD | Fig. 1 | 25 | 0.069 | ±9.0 | 0 | 2.0 | 0.033 | ±7.5 | 0 | 7.5 |
| Fig. 2 | 35 | 0.046 | ±14.0 | 0 | 2.0 | 0.021 | ±14.5 | 0 | 7.5 | |
| DS | LIN - Fig. 3 | 25,35 | 0.105 | 0 | 0 | 3.5 | 0.043 | 0 | 0 | 9.5 |
| LIN - Fig. 4 | 20,30,40 | 0.107 | −0.5 | 0 | 3.5 | 0.044 | −1.0 | 0 | 9.5 | |
| RHO - Fig. 5 | 25,35 | 0.075 | 0 | 0 | 4.0 | 0.038 | 0 | 0 | 10.0 | |
| RHO - Fig.6 | 25,35 | 0.053 | ±3.0 | ±10.0 | 4.5 | 0.027 | ±1.0 | ±10.0 | 11.0 | |
| QDL - Fig.7 | 20,30,40 | 0.084 | −2.0 | 1.5 | 6.0 | 0.041 | −2.5 | 2.0 | 12.0 | |
| IRR - Fig.8 | 20,30,40 | 0.059 | 6.0 | −5.5 | 4.0 | 0.030 | 3.0 | −4.5 | 10.0 | |
| RCT - Fig.9 | 30,40 | 0.073 | 0 | 0 | 7.0 | 0.037 | 0 | 0 | 13.5 | |
| RCT - Fig.10 | 20,40 | 0.041 | 0 | 0 | 7.0 | 0.024 | 0 | 0 | 13.0 | |
| RCT - Fig.11 | 25,35 | 0.048 | ±8.5 | ±13.0 | 5.0 | 0.026 | 0 | ±12.5 | 12.0 | |
| SQR - Fig.12 | 25,35 | 0.079 | 0 | 0 | 6.5 | 0.040 | 0 | 0 | 12.5 | |
| TPZ - Fig.13 | 25,35 | 0.102 | 0 | 5.0 | 4.0 | 0.043 | 0 | 4.5 | 10.5 | |
It is important to point out that the sensitivity to deeper tissue (say, at a fixed depth of ~10 mm) is comparable (~0.03 under the conditions considered in this work) for single distance and dual slope measurements. However, the contrast-to-noise ratio may be better for intensity measurements as they typically feature lower noise than phase measurements. In any case, dual-slope data feature a sensitivity to deep tissue that is comparable to that of single-distance data, but without the confounding effects of a greater sensitivity to shallower tissue.
We also point out that a negative sensitivity to an absorption perturbation indicates a change in the measured signal that is in the opposite direction than expected from a homogenous absorption perturbation. Equations (5), (6), (9), and (10) specify that a uniform increase in absorption (Δμa > 0) results in a decrease in single-distance intensity, single-distance phase, dual-slope intensity (more negative slope), and dual-slope phase (less positive slope) (i.e. ΔSDIDC < 0, ΔSDϕ < 0, ΔDSIDC < 0, ΔDSϕ < 0). By contrast, it can happen that a superficial and localized absorption increase may result in a greater single-distance phase, dual-slope-intensity, and/or dual-slope phase (but never in a greater single-distance intensity). Such signal increases in response to a localized increase in absorption are associated with a negative sensitivity.
4. Discussion
The regions of sensitivity reported in this article show the dramatic difference between the sample volumes probed by single-distance and dual-slope optical data. In particular, we point out how the banana-shaped sensitivity regions of the single-distance case (Figs. 1–2) extend to the most superficial tissue underneath the source and the detector, which contrasts with the nut-shaped sensitivity regions of the dual-slope cases (Figs. 3–13) that are more localized within deeper tissue. It is important to comment on the representation for regions of sensitivity used in this article. This representation is based on SNR considerations, so that, in all figures, the 3D renditions in panels (b) and (c) and the cross-sections of panels (e), (f), (h), and (i) are bounded by SNR = 1. This requires a specification of the signal and the noise considered. For the signal, i.e. the optical perturbation caused by the absorption inhomogeneity, we have considered a rectangular region of size 10mm×10mm×2mm (x, y, z dimensions) that features an absorption coefficient 30% greater than the background. This choice is based on estimates of the lateral size (~10 mm) of focal hemodynamic changes in extracerebral and cerebral tissue, the approximate thickness of scalp and cerebral cortex (~2 mm), and the blood volume change associated with brain activation (~30%).31 For the noise, we have considered values of 0.4% for the intensity and 0.06°, which we obtained from phantom measurements using typical data acquisition parameters used for in vivo diffuse optical measurements. Of course, different optical inhomogeneities will result in different signals, and different instrumental configurations will result in different noise levels. However, the key fact illustrated in Figs. 1–13 is the relative level of sensitivity to deep versus shallow tissue for a given optical perturbation measured with intensity or phase using single-distance or dual-slope methods.
Another important point related to the discussion of the previous paragraph is that the white areas in the 3D renditions and the grey areas in the cross-sections of the regions of sensitivity do not represent a zero sensitivity, but rather a sensitivity below the threshold of SNR = 1. This means that a local perturbation may still be detected outside of the depicted regions of sensitivity, provided it features a large enough optical contrast. In other words, even in the case of nut-shaped regions of sensitivity that only appear deep in the tissue (such as the one in Fig. 8(f)), it may still be the case that a high-contrast superficial perturbation results in the same signal as a low-contrast deep perturbation. Furthermore, it is possible that multiple low-contrast absorption perturbations, each associated with a SNR<1, may collectively result in a SNR>1. The quantitative description of sensitivity provided by Eq. (2), in conjunction with Eqs. (3), (4), (7), and (8), allows for the determination of the optical signal associated with perturbations of any size and absorption contrast (at least within the case of first-order perturbation theory considered here). It is also worth pointing out that both intensity and phase dual slopes feature negative sensitivities to localized superficial tissue. Even though these negative sensitivities are typically weaker than the deeper positive sensitivities and tend to be highly localized, they may nevertheless result in misleading results in the case of similarly localized superficial perturbations with a relatively high optical contrast. In fact, they may yield contributions to the apparent absorption changes that are opposite to the actual ones.
An evident result of Figs. 1–13, further quantified in Table I, is the deeper sensitivity of phase data with respect to intensity data, regardless of the approach (single-distance or dual-slope). This result indicates that stand-alone phase data can play an important role in diffuse optics, beyond its more common use in combination with intensity data to quantify both absorption and scattering properties of tissue. Such a role is to improve the sensitivity to deeper tissue and enhance imaging applications of diffuse optics rather than performing absolute measurements of optical properties of turbid media and tissue.
Finally, we’d like to comment on the relevance of illustrating a large variety of source-detector arrangements for dual-slope measurements. In fact, it is true that some arrangements, most notably the linear one of Fig. 3, may be optimal from a practical point of view, and for its minimal sensitivity to inaccuracies in the source-detector locations and to deformations of the probe when conforming to a curved tissue. However, there are at least two reasons for considering a variety of dual-slope source-detector arrangements. The first reason is practical: spatial constraints, tissue curvature, or other limiting factors may prevent the use of specific source-detector arrangements, and it is important to have alternative options to consider. The second reason is more fundamental: imaging applications require the collection of data with multiple dual-slope configurations that cover the entirety of the tissue to be imaged, ideally with overlapping regions of sensitivity. The family of dual-slope configurations illustrated in Figs. 3–13, with additional variants achieved by further displacements of sources and/or detectors, gives a sense of the flexibility that one has for combining subsets of optodes in a source-detector grid for dual-slope-based imaging applications. This is a major next step for the approach presented here, which we will further develop in future work.
5. Conclusions
The ability of deepening and spatially confining the optical region of sensitivity can have a transformational effect on the field of diffuse optics. First, it can enhance the sensitivity to deeper tissues, which is an important goal for a broad class of non-invasive optical measurements of tissue, including the human brain, skeletal muscle, and breast. Second, it can enhance the spatial resolution in diffuse optical imaging, enable novel image reconstruction schemes, and achieve tissue sectioning. The dual-slope approach, reported here for a variety of source-detector configurations, features regions of sensitivity that resemble nuts (compact, round or oblong, mostly confined within the tissue) rather than the banana-shaped regions of sensitivity (curved regions that extend all the way to the source and the detector) that are typical in diffuse optics. The most significant aspect of the nut-shaped regions of sensitivity of the intensity and, even more so, phase dual-slopes is the fact that their maximal sensitivity occurs significantly deeper in the tissue than for single-distance intensity and phase. This result points to the value of the source-detector arrangements and the data processing schemes of dual-slopes for a broad range of applications in diffuse optics, with a renewed emphasis on the importance of phase measurements in frequency-domain spectroscopy.
Acknowledgements
This research was supported by NIH Grant No. R01-NS095334.
Footnotes
Conflict of interest
The authors declare no conflicts of interest.
References
- [1].Quaresima V and Ferrari M, “A mini-review on functional near-infrared spectroscopy (fNIRS): where do we stand, and where should we go?” Photonics 6, 87 (2019). [Google Scholar]
- [2].Jones S, Chiesa ST, Chaturvedi N, and Hughes AD, “Recent developments in near-infrared spectroscopy (NIRS) for the assessment of local skeletal muscle microvascular function and capacity to utilize oxygen,” Artery Res. 16, 25–33 (2016). [DOI] [PMC free article] [PubMed] [Google Scholar]
- [3].Grosenick D, Rinneberg H, Cubeddu R, and Taroni P, “Review of optical breast imaging and spectroscopy,” J. Biomed. Opt 21, 091311 (2016). [DOI] [PubMed] [Google Scholar]
- [4].Saager RB, and Berger AJ, “Direct characterization and removal of interfering absorption trends in two-layer turbid media,” J. Opt. Soc. Am. A 22, 1874–1882 (2005). [DOI] [PubMed] [Google Scholar]
- [5].Zhang Q, Brown EN, and Strangman GE, “Adaptive filtering for global interference cancellation and real-time recovery of evoked brain activity: A Monte Carlo simulation study,” J. Biomed. Opt 12, 044014 (2007). [DOI] [PubMed] [Google Scholar]
- [6].Gagnon L, Perdue KL, Greve DN, Goldenholz D, Kaskhedikar G, and Boas DA, “Improved recovery of the hemodynamic response in diffuse optical imaging using short optode separations and state-space modeling,” NeuroImage 56, 1362–1371 (2011). [DOI] [PMC free article] [PubMed] [Google Scholar]
- [7].Funane T, Atsumori H, Katura T, Obata AN, Sato H, Tanikawa Y, Okada E, and Kiguchi M, “Quantitative evaluation of deep and shallow tissue layers’ contribution to fNIRS signal using multi-distance optodes and independent component analysis,” NeuroImage 85, 150–165 (2014). [DOI] [PubMed] [Google Scholar]
- [8].Gagnon L, Yűcel MA, A. M, Boas DA, and Cooper RJ, “Further improvement in reducing superficial contamination in NIRS using doubleshort separation measurements,” NeuroImage 85, 127–135 (2014). [DOI] [PMC free article] [PubMed] [Google Scholar]
- [9].Steinbrink J, Wabnitz H, Obrig H, Villringer A, and Rinneberg H, “Determining changes in NIR absorption using a layered model of the human head,” Phys. Med. Biol 46, 879–896 (2001). [DOI] [PubMed] [Google Scholar]
- [10].Hallacoglu B, Sassaroli A, and Fantini S, “Optical characterization of two-layered turbid media for non-invasive, absolute oximetry in cerebral and extracerebral tissue,” PLoS ONE 8, e64095 (2013). [DOI] [PMC free article] [PubMed] [Google Scholar]
- [11].Gregg NM, White BR, Zeff BW, Berger AJ, and Culver JP, “Brain specificity of diffuse optical imaging: Improvements from superficial signal regression and tomography,” Front. Neuroenerg 2, 14 (2010). [DOI] [PMC free article] [PubMed] [Google Scholar]
- [12].Feng S, Zeng F, and Chance B, “Photon migration in the presence of a single defect: a perturbation analysis,” Appl. Opt 34, 3826–3837 (1995). [DOI] [PubMed] [Google Scholar]
- [13].Franceschini MA, Fantini S, Paunescu LA, Maier JS, and Gratton E, “Influence of a superficial layer in the quantitative spectroscopic study of strongly scattering media,” Appl. Opt 37, 7447–7458 (1998). [DOI] [PubMed] [Google Scholar]
- [14].Suzuki S, Takasaki S, Ozaki T, and Kobayashi Y, “A tissue oxygenation monitor using NIR spatially resolved spectroscopy,” Proc. SPIE 3597, 582–592 (1999). [Google Scholar]
- [15].Milej D, Abdalmalak A, McLachlan P, Diop M, Liebert A, and St. Lawrence K, “Subtraction-based approach for enhancing the depth sensitivity of time-resolved NIRS,” Biomed. Opt. Express 7, 4514–4526 (2016). [DOI] [PMC free article] [PubMed] [Google Scholar]
- [16].Sassaroli A, Blaney G, and Fantini S, “Dual-slope method for enhanced depth sensitivity in diffuse optical spectroscopy,” J. Opt. Soc. Am. A (in press, 2019). Available online: https://www.osapublishing.org/DirectPDFAccess/8BEB86AE-9AA3-8AC4-CD77B5229CAED828_ads368965.pdf?da=1&adsid=368965&journal=1&seq=0&mobile=no [DOI] [PMC free article] [PubMed]
- [17].Blaney G, Sassaroli A, Pham T, Fernandez C, and Fantini S, “Phase dual-slopes in frequency-domain near-infrared spectroscopy for enhanced sensitivity to brain tissue: First applications to human subjects,” J. Biophotonics (in press, 2019). Available online: https://onlinelibrary.wiley.com/doi/abs/10.1002/jbio.201960018 [DOI] [PMC free article] [PubMed]
- [18].Sawosz P, and Liebert A, “Method to improve the depth sensitivity of diffuse reflectance measurements to absorption changes in optically turbid medium,” Biomed. Opt. Express 10, 5031–5041 (2019). [DOI] [PMC free article] [PubMed] [Google Scholar]
- [19].Hueber DM, Fantini S, Cerussi AE, and Barbieri B, “New optical probe designs for absolute (self-calibrating) NIR tissue hemoglobin measurements,” Proc. SPIE 3597, 618–631 (1999). [Google Scholar]
- [20].Schotland JC, Haselgrove JC, and Leigh JS, “Photon hitting density,” Appl. Opt 32, 448–453 (1993). [DOI] [PubMed] [Google Scholar]
- [21].Arridge SR, “Photon-measurement density functions. Part I: Analytical forms,” Appl. Opt 34, 7395–7409 (1995). [DOI] [PubMed] [Google Scholar]
- [22].Bigio IJ and Fantini S, Quantitative Biomedical Optics: Theory, methods, and applications (Cambridge University Press, Cambridge, UK, 2016). [Google Scholar]
- [23].Sassaroli A, Martelli F, and Fantini S, “Perturbation theory for the diffusion equation by use of the moments of the generalized temporal point-spread function. I. Theory,” J. Opt. Soc. Am. A 23, 2105–2118 (2006). [DOI] [PubMed] [Google Scholar]
- [24].Delpy DT, Cope M, van der Zee P, Arridge S, Wray S, and Wyatt J, “Estimation of optical path length measurements on adult head, calf, and forearm and the head of newborn infants using phase resolved spectroscopy,” Phys. Med. Biol 40, 295–304 (1988). [Google Scholar]
- [25].Sassaroli A and Fantini S, “Comment on the modified Beer-Lambert law for scattering media,” Phys. Med. Biol 49, N255–N257 (2004). [DOI] [PubMed] [Google Scholar]
- [26].Contini D, Martelli F, and Zaccanti G, “Photon migration through a turbid slab described by a model based on diffusion approximation. I. Theory,” Appl. Opt 36, 4587–4599 (1997). [DOI] [PubMed] [Google Scholar]
- [27].Fantini S, Franceschini MA, Walker SA, Maier JS, and Gratton E, “Photon path distributions in turbid media: Applications for imaging,” Proc. SPIE 2389, 340–349 (1995). [Google Scholar]
- [28].Liebert A, Wabnitz H, Steinbrink J, Obrig H, Möller M, Macdonald R, Villringer A, and Rinneberg H, “Time-resolved multidistance near-infrared spectroscopy of the adult head: intracerebral and extracerebral absorption changes from moments of distribution of time of flight of photons,” Appl. Opt 43, 3037–3047 (2004). [DOI] [PubMed] [Google Scholar]
- [29].Doulgerakis M, Eggebrecht A, and Dehghani H, “Information rich phase content of frequency domain functional near-infrared spectroscopy,” Proc. SPIE 10865, 108650C (2019). [Google Scholar]
- [30].Blaney G, Sassaroli A, Pham T, Krishnamurthy N, and Fantini S, “Multi-distance frequency-domain optical measurements of coherent cerebral hemodynamics,” Photonics 6, 83 (2019). [DOI] [PMC free article] [PubMed] [Google Scholar]
- [31].Gu H, Lu H, Ye FQ, Stein EA, and Yanga Y, “Noninvasive quantification of cerebral blood volume in humans during functional activation,” NeuroImage 30, 377–387 (2006). [DOI] [PubMed] [Google Scholar]


