
Figure 5. Gene perturbations with broad effects on protein abundance.
(A) Number of proteins significantly affected by each gene perturbation (FDR<0.05). The entire bar represents all gene perturbations with at least one significant effect on a protein. (B) Heatmap of protein-level effects of the 29 gene perturbations with broad effects (left panel) and of SIT4 and SAP155 gene perturbations for direct comparison (right panel). The color scale is capped at –1.5 and 1.5. (C) Network representation of the 29 genes with broad effects. Edges of the network reflect the overall confidence score for protein-protein interactions reported in the STRING database and colors represent enriched functional categories (orange: ribosome biogenesis, purple: tRNA metabolism) (Doncheva et al., 2018; Szklarczyk et al., 2020). Miniature networks are colored by the prevalent direction of effect on protein abundance (blue: decreased abundance, red: increased abundance) or by gene essentiality (light green: nonessential, dark green: essential). (D) Validation of observations from the base editor screen ('GFP') by LC-MS proteomics ('MS') for a hypomorphic mutation in POP1 (H642Y). Red data points reflect proteins that change significantly in both experiments upon POP1 perturbation (FDR<0.1). (E) For each gRNA, the fitness effect (vertical axis) is plotted against the number of proteins significantly affected by each gRNA (FDR<0.05) (horizontal axis). For the fitness analysis, the 24 hr base editor induction period with galactose was followed by 24 hr of growth in glucose media. Box plot overlays summarize the underlying data points (center line: median; box limits: first and third quartiles; whiskers: 1.5-fold interquartile range). The coloring of the data points reflects whether the gRNA targets an essential or nonessential gene. (F) The fraction of gRNAs targeting essential and nonessential genes as a function of the number of proteins significantly affected by each gRNA (FDR<0.05). Note that at the reference time point of the fitness experiment, there was no bias in read counts across the gRNAs affecting different numbers of proteins (data not shown).

Figure 5—figure supplement 1. Proteomics analysis of POP1 and SIT4 mutants represented as volcano plot.
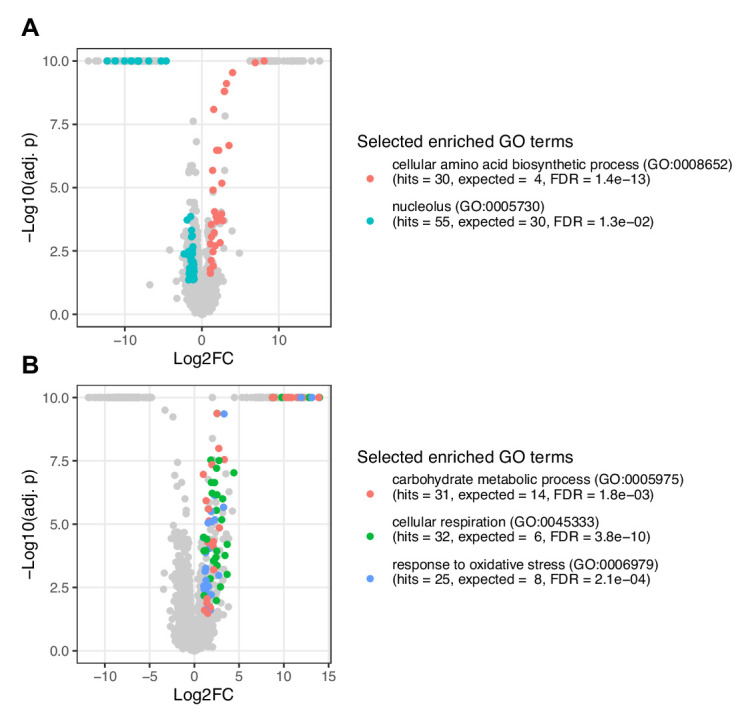
Figure 5—figure supplement 2. Base edits and natural variants across the POP1 gene.
