

Abstract
Small cell lung cancer (SCLC) is a highly aggressive neuroendocrine tumor with dismal prognosis. Recently, molecular subtypes of SCLC have been defined by the expression status of ASCL1, NEUROD1, YAP1, and POU2F3 transcription regulators. ASCL1 is essential for neuroendocrine differentiation and is expressed in the majority of SCLC. Although previous studies investigated ASCL1 target genes in SCLC cells, ASCL1‐mediated regulation of miRNAs and its relationship to molecular subtypes remain poorly explored. Here, we performed genome‐wide profiling of chromatin modifications (H3K27me3, H3K4me3, and H3K27ac) by CUT&Tag assay and ASCL1 knockdown followed by RNA sequencing and miRNA array analyses in SCLC cells. ASCL1 could preferentially regulate genes associated with super‐enhancers (SEs) defined by enrichment of H3K27ac marking. Moreover, ASCL1 positively regulated several SE‐associated miRNAs, such as miR‐7, miR‐375, miR‐200b‐3p, and miR‐429, leading to repression of their targets, whereas ASCL1 suppressed miR‐455‐3p, an abundant miRNA in other molecular subtypes. We further elucidated unique patterns of SE‐associated miRNAs in different SCLC molecular subtypes, highlighting subtype‐specific miRNA networks with functional relevance. Notably, we found apparent de‐repression of common target genes of different miRNAs following ASCL1 knockdown, suggesting combinatorial action of multiple miRNAs underlying molecular heterogeneity of SCLC (e.g., co‐targeting of YAP1 by miR‐9 and miR‐375). Our comprehensive analyses provide novel insights into SCLC pathogenesis and a clue to understanding subtype‐dependent phenotypic differences.
Keywords: ASCL1, miR‐375, small cell lung cancer, super‐enhancer, YAP1
ASCL1 preferentially regulates genes and miRNAs associated with super‐enhancers (SEs). SCLC molecular subtypes show unique patterns of SE‐associated miRNAs. ASCL1‐induced SE‐associated miRNAs cooperatively regulate target genes; for example, miR‐9 and miR‐375 co‐target YAP1.
1. INTRODUCTION
Small cell lung cancer (SCLC) is an aggressive tumor that accounts for approximately 15% of lung cancers. 1 , 2 Recently, genome and transcriptome analyses of SCLC have made great progress. 3 , 4 , 5 , 6 , 7 , 8 SCLC typically expresses neuroendocrine markers such as synaptophysin and chromogranin A (CHGA). 9 Achaete‐scute complex homolog 1 (ASCL1), a master regulator for neuroendocrine differentiation, 10 , 11 is expressed in the majority of SCLC (designated as SCLC‐A). 12 , 13 ASCL1 interacts with NK2 homeobox 1 (NKX2‐1) and prospero homeobox 1 (PROX1) 14 and regulates genes unique to neuroendocrine tumors, such as delta‐like 3 (DLL3). 15
Genetically engineered mouse models of SCLC based on Trp53 and Rb1 loss suggest that MYC drives NEUROD1 expression during SCLC progression, 16 , 17 and NEUROD1 subtype (SCLC‐N) presumably originates from SCLC‐A. Insulinoma‐associated protein 1 (INSM1), a novel marker for pulmonary neuroendocrine tumors, 18 is a common transcriptional target of ASCL1 and NEUROD1. 13
Previous studies, including ours, reported SCLC cases lacking ASCL1 expression and neuroendocrine features, 19 , 20 which correspond to Yes‐associated protein 1 (YAP1) subtype (SCLC‐Y) 19 , 21 and POU class 2 homeobox 3 (POU2F3) subtype (SCLC‐P). 20 Overall, four molecular subtypes of SCLC defined by the expression of ASCL1, NEUROD1, YAP1, and POU2F3 transcription regulators are recognized 12 , 13 and subtype‐dependent therapeutic vulnerabilities have been reported. 21 , 22 , 23 , 24 Transcriptomic features unique to SCLC subtypes correlate with distinct signatures of super‐enhancers (SEs), which are large genomic regions marked by high levels of H3 acetylation at lysine 27 (H3K27ac) or Mediator binding. 13 , 14 , 25 , 26 , 27
MicroRNAs (miRNAs) display tissue‐specific expression patterns and regulate gene expression by binding to the 3′ untranslated regions (3′UTRs) of target mRNAs. 28 , 29 SEs play critical roles in the tissue‐specific miRNA expression and function to shape cell‐type identity. 30 , 31 A few reports have identified transcriptional targets of ASCL1. 13 , 32 However, miRNA profiles regulated by ASCL1 in SCLC cells and its relationship to SEs remain poorly studied.
Here, we performed genome‐wide profiling of histone modifications by Cleavage Under Targets and Tagmentation (CUT&Tag) assay, 33 RNA sequencing, and miRNA array analyses to elucidate SE‐associated gene and miRNA regulation in SCLC cells.
2. MATERIALS AND METHODS
2.1. Public datasets
Public datasets analyzed in this study are summarized in Table S1. 3 , 6 , 34 , 35 Mapped sequence data were visualized using Integrative Genomics Viewer. 36 Gene set enrichment analysis was performed as described previously. 37 Predicted target genes with conserved sites for each miRNA were obtained from TargetScan (v7.2). 38
2.2. Cell cultures
Details were described previously. 19 Small interfering RNA against human ASCL1 and negative control were purchased from Invitrogen (Thermo Fisher Scientific). 39 Electroporation was performed for siRNA delivery. 40 Lipofectamine RNAiMAX Transfection Reagent (Invitrogen) was used for transfection of negative control or miRCURY LNA miR‐455‐3p mimic (Qiagen).
2.3. Cleavage Under Targets and Tagmentation
Cleavage Under Targets and Tagmentation (CUT&Tag) was performed according to the protocol with minor modifications. 33 , 41 Lu134A cells (1 × 10⁵) were bound to concanavalin‐coated magnetic beads (Bangs Laboratories). After permeabilization with digitonin, cells were incubated with primary antibody at room temperature for 2 h and subsequently incubated with secondary antibody for 1 h. Then, CUTANA pAG‐Tn5 for CUT&Tag (EpiCypher) was bound to secondary antibody. After incubation with Mg2+ containing solution to cleave the target DNA, the extracted DNA was amplified by PCR. The PCR product was purified using AMPureXP magnetic beads (Beckman Coulter). Sequence libraries were pooled at 5 nM. For non‐specific IgG, the entire library was pooled. The pooled library was sequenced on HiSeqX (Illumina) using 150 bp paired end reads. Rabbit monoclonal anti‐H3 acetylation at lysine 27 (H3K27ac) antibody (Abcam, ab4729), rabbit monoclonal anti‐H3 tri‐methylation at lysine 27 (H3K27me3) antibody (CST, #9733S), and rabbit polyclonal anti‐H3 tri‐methylation at lysine 4 (H3K4me3) antibody (Active Motif, #39159) were used as primary antibodies. Rabbit IgG (Merck Millipore, PP64B) was used for IgG control. Guinea pig anti‐rabbit IgG (antibodies‐online, ABIN101961) was used as secondary antibody.
2.4. Data processing of Cleavage Under Targets and Tagmentation
After quality control, reads were aligned against hg38 by Bowtie2 (version 2.3.5.1). Peak calling was performed by SEACR (version 1.4) for H3K27ac and H3K4me3 with relaxed mode using non‐normalized IgG control track 42 or by SICER2 (version 1.0.3) for H3K27me3. 43 A heatmap was generated using deepTools (version 3.3.2, binSize = 10). 44 Data were deposited in the Gene Expression Omnibus (GEO) repository (GSE185083).
2.5. Identification of super‐enhancers
Super‐ enhancers (SEs) were identified according to the algorithm described previously. 25 We calculated the linkage score between miRNA genes and enhancers as reported previously. 30 SE‐associated miRNA genes were defined when the transcription start site (TSS) or hairpin sequence has a linkage score <0.2 or is located within the SE region.
2.6. MicroRNA expression profiling and PCR analysis
Expression of 2578 human mature miRNAs was profiled using Affymetrix GeneChip miRNA 4.0 Array (Filgen). 40 Data were deposited in GSE180315. Mature miR‐7‐5p and miR‐375 were quantified using TaqMan microRNA assays (Thermo Fisher Scientific) and expression levels were normalized to that of U6.
2.7. RNA‐sequencing
RNA‐sequencing (RNA‐seq) reads were analyzed using CLC Genomics workbench software (Qiagen). Reads per kilobase of transcript per million mapped reads (RPKM) data were obtained as reported previously. 39 Data were deposited in GSE180314.
2.8. Quantitative RT‐PCR analysis
Expression levels were normalized to glyceraldehyde‐3‐phosphate dehydrogenase. The primers are shown in Table S2.
2.9. Immunoblot analysis
Mouse monoclonal antibodies for ASCL1 and α‐tubulin were from BD Pharmingen and Sigma‐Aldrich, respectively.
2.10. Immunohistochemistry
Lung specimens were obtained from 4 patients pathologically diagnosed with SCLC. For antigen retrieval, tissue sections for ASCL1, YAP1, thyroid transcription factor‐1 (TTF‐1), and synaptophysin were autoclaved for 20 min at 120°C in 10 mM sodium citrate buffer (pH 6.0), and tissue sections for NEUROD1 were boiled at 95°C. Antibodies and dilutions used for immunohistochemistry were as follows. ASCL1 (BD Pharmingen, #556604, 1:50); YAP1 (CST, #14074, 1:150); TTF‐1 (Nichirei Biosciences, SPT24); synaptophysin (DakoCytomation, A0010, 1:100); NEUROD1 (Abcam, EPR20766, ab213725, 1:3000). The sections were then incubated with Histofine Simple Stain MAX‐PO (MULTI) (Nichirei Biosciences) as secondary antibodies with peroxidase for 30 min.
2.11. Statistical analysis
Pearson's correlation coefficient (r) was calculated for correlation analyses. The Wilcoxon rank test was used for comparisons of different gene sets. ANOVA followed by the Tukey–Kramer honestly significant difference (HSD) test was used for pairwise comparisons.
3. RESULTS
3.1. Super‐enhancer‐associated genes in Lu134A cells
Lu134A cells harbor TP53 and RB1 mutations 45 and express ASCL1. 19 We performed CUT&Tag assay of H3K27me3, H3K4me3, and H3K27ac in Lu134A cells and determined 972 SE‐associated genes based on H3K27ac profiles (Figure 1A and Table S3). As compared to 795 SE‐associated genes in SCLC‐A identified by a recent study, 14 18.6% of SE‐associated genes in Lu134A cells were overlapping, which included ASCL1, INSM1, NKX2‐1, and forkhead box A1 (FOXA1). 40
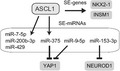
FIGURE 1.
Chromatin modifications and achaete‐scute complex homolog 1 (ASCL1)‐mediated regulation of super‐enhancer (SE)‐associated genes in Lu134A cells. (A) H3K27ac profiles at enhancers in Lu134A cells. SEs were distinguished from typical enhancers (TEs) by identifying an inflection point of H3K27ac signal vs enhancer rank. Representative SE‐associated genes are indicated. (B) Distribution of H3K27me3, H3K4me3, and H3K27ac signals within the intervals of 3.0 kb upstream of transcription start sites (TSSs), gene bodies, and 3.0 kb downstream of transcription end sites (TESs) of the ASCL1 target genes. ASCL1, insulinoma‐associated protein 1 (INSM1), and NK2 homeobox 1 (NKX2‐1) showed markedly broad distribution of both H3K4me3 and H3K27ac signals around their TSSs. y‐axis values of the upper panels indicate normalized read counts. (C) Immunoblotting for ASCL1 in Lu134 cells treated with control (siNC) or ASCL1 siRNAs (siASCL1). Alpha‐tubulin was used as the loading control. (D) Scatter plot representation of genes in Lu134A cells treated with siASCL1 (y‐axis) compared to siNC (x‐axis). Expression levels are shown as log2 (1 + RPKM) values. Key transcription regulators and neuroendocrine markers are indicated. (E) Gene set enrichment analysis using the RNA‐seq result of Lu134A cells treated with siNC or siASCL1. (F) Cumulative distribution plot of log2‐transformed gene expression fold changes of SE‐associated genes (SE‐genes), TE‐associated genes (TE‐genes) and others. The genes with RPKM >1 in both siNC‐ and siASCL1‐treated groups were analyzed. The p‐value was calculated by one‐sided Wilcoxon rank test. SE‐genes vs others: p < 2.2 × 10⁻¹⁶. TE‐genes vs others: p < 2.2 × 10⁻¹⁶. SE‐genes vs TE‐genes: p = 1.3 × 10⁻⁹. (G) Schematic representation of ASCL1‐mediated preferential regulation of SE‐genes.
Next, we compared H3K27me3, H3K4me3, and H3K27ac histone marks of the previously reported 141 transcriptional targets of ASCL1 (Table S4). 13 For more than half of these genes, including key transcription factors (ASCL1, INSM1, and NKX2‐1) and neuroendocrine markers (DLL3 and CHGA), we noted high H3K4me3 and H3K27ac signals around their TSSs (Figure 1B). Visualization of H3K4me3 and H3K27ac signals in the genomic regions of ASCL1, INSM1, NKX2‐1, and FOXA1 showed markedly broad distributions (Figure S1). Cell identity genes are frequently associated with both SEs and broad H3K4me3 domains (>4.0 kb), 30 and this observation supported their essential roles for cell‐type specification.
H3K27me3 marks are associated with transcriptional repression of cell‐type‐specific genes. 46 , 47 A previous study identified H3K27me3‐marked 60 genes whose expression levels were generally repressed in SCLC cell lines (Table S4). 46 We compared H3K27me3, H3K4me3, and H3K27ac histone marks in their genomic regions and noted high H3K27me3 marks for most genes in contrast to scant H3K4me3 and H3K27ac signals (Figure S2).
3.2. ASCL1 regulates super‐enhancer‐associated genes in Lu134A cells
For loss‐of‐function experiments, we treated Lu134A cells with siRNAs against ASCL1, and efficient knockdown of ASCL1 was confirmed by immunoblotting (Figure 1C). RNA‐seq analysis was conducted following ASCL1 knockdown, and we identified 409 downregulated and 95 upregulated transcripts, using the thresholds of RPKM >1 in the control, and fold change <0.67 or >1.5 (Figure 1D and Table S5). Downregulated genes included ASCL1 and its known target genes (e.g., DLL3 and INSM1) 13 while upregulated genes included YAP1 (Figure 1D).
Gene set enrichment analysis indicated that the ASCL1 target gene signature (Table S4) 13 was enriched among the genes downregulated by ASCL1 knockdown (p < 0.01) (Figure 1E), confirming effective suppression of ASCL1‐mediated transcription.
ASCL1 knockdown led to preferential suppression of SE‐associated genes compared to typical enhancer (TE)‐associated genes or others (Figure 1F). Of note, SE‐associated genes suppressed by ASCL1 knockdown included NKX2‐1, INSM1, and FOXA1 (Figure 1G). These observations supported that ASCL1 is a bona fide master regulator that governs SE‐associated transcriptional regulation and cell identity in Lu134A cells, consistent with the previous report that ASCL1‐bound sites are enriched in the SEs of SCLC cells. 13
3.3. Profiling of miRNAs regulated by ASCL1 in Lu134A cells
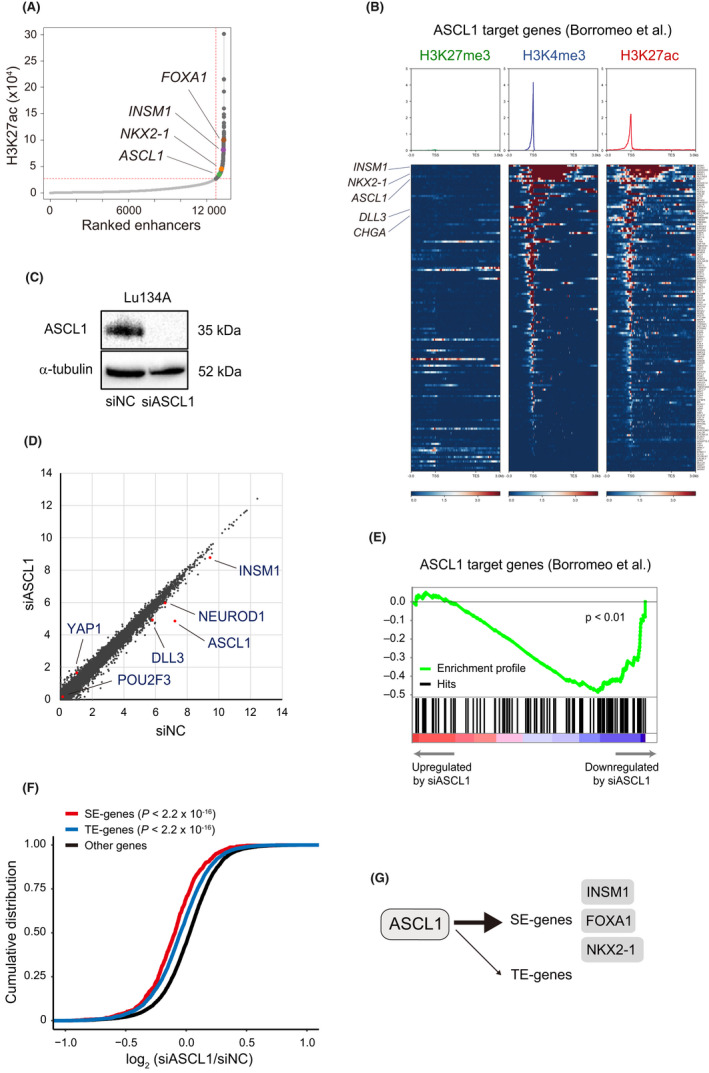
We conducted miRNA array analysis following ASCL1 knockdown and reliably detected 824 miRNAs in the cells treated with control and ASCL1 siRNAs (Figure 2A). We selected 417 miRNAs with expression values >50 in the control, and among them, 111 miRNAs showed downregulation (fold change <0.8) and 37 miRNAs showed upregulation (fold change >1.25; Figure 2B and Table S6).
FIGURE 2.
Profiling of miRNAs regulated by achaete‐scute complex homolog 1 (ASCL1) in Lu134A cells. (A) Scatter plot representation of miRNAs in Lu134A cells treated with siASCL1 (y‐axis) compared to siNC (x‐axis). Expression levels are shown as log2 values of microarray signal intensity. Representative miRNAs upregulated and downregulated by ASCL1 knockdown are indicated. (B) Venn diagrams showing overlaps of downregulated or upregulated miRNAs by ASCL1 knockdown and miRNAs positively or negatively correlated with ASCL1 in 50 small cell lung cancer (SCLC) cell lines in the Cancer Cell Line Encyclopedia (CCLE). Numbers of miRNAs are indicated. (C) Correlations of ASCL1 with miR‐7 (left), miR‐375 (middle), and miR‐455‐3p (right) in 50 SCLC cell lines. Expression levels of genes and miRNAs are shown as log2 (1+RPKM) and log2 values of microarray signal intensity, respectively. (D) Quantitative PCR for miR‐7‐5p (upper) and miR‐375 (lower) in SCLC‐Y (SBC5 and SBC3) and SCLC‐A (H209, Lu139, Lu134A, and Lu134B) cell lines. Bars represent means + standard errors. (E) ASCL1 ChIP peaks in SCLC‐A cell lines (H128, H2107, and H889) and NEUROD1 ChIP peaks in SCLC‐N cell lines (H82 and H524) around MIR7‐3 (upper) and MIR375 (lower) gene loci. Note that ASCL1 binding peaks are present in the upstream regions of MIR7‐3 (upper) and MIR375 (lower) genes only in SCLC‐A cell lines.
To further select miRNAs associated with ASCL1, we exploited gene and miRNA expression profiling data obtained from the Cancer Cell Line Encyclopedia (CCLE) (Table S7). 6 We evaluated log‐transformed expression levels of ASCL1 and miRNAs in 50 different SCLC cell lines and identified 27 or 7 miRNAs whose expression levels were positively or negatively correlated with that of ASCL1 (r > 0.35 or <−0.35) (Figure 2B). Comparing them with downregulated or upregulated miRNAs by ASCL1 knockdown, we identified four miRNAs (miR‐7‐5p, miR‐375, miR‐200b‐3p, and miR‐429) or miR‐455‐3p, as positively or negatively regulated miRNAs by ASCL1, respectively (Figures 2B,C and S3). Strong positive or negative correlations with miR‐375 (r = 0.62) or miR‐455‐3p (r = −0.68) were noteworthy (Figure 2C).
Next, we validated expression levels of miR‐7‐5p and miR‐375 in SCLC cell lines (Figure 2D) 19 and found that miR‐7‐5p and miR‐375 were expressed in SCLC‐A but not in SCLC‐Y cell lines without ASCL1 expression (Figure 2D).
We further analyzed the public ChIP‐seq dataset 13 and identified ASCL1 binding sites around MIR7‐3 host gene (MIR7‐3HG) and MIR375 gene loci in SCLC‐A cell lines, suggesting direct regulation of miR‐7 and miR‐375 by ASCL1 (Figure 2E). In contrast, NEUROD1 binding peaks were not found around MIR7‐3HG or MIR375 gene loci in SCLC‐N cell lines (Figure 2E).
Consistently, H3K4me3 and H3K27ac active marks were abundant, while H3K27me3 repressive mark was scant around MIR7‐3HG and MIR375 gene loci in Lu134A cells (Figure S4A). SE formation overlying MIR375 gene locus was identified and three peaks of H3K27ac signals were found in the upstream region of the MIR7‐3 gene (Figure S4A).
3.4. Repression of miR‐455‐3p in Lu134A cells
To clarify the genome‐wide landscape of chromatin modifications of miRNA genes, we comprehensively profiled H3K27me3, H3K4me3, and H3K27ac signals within 2.0 kb upstream and 2.0 kb downstream of the TSSs of miRNA genes. We selected the top 100 miRNA genes with high signals for each histone mark and obtained a list of 196 miRNA genes (Table S8). According to H3K4me3 and H3K27ac signals, these miRNA genes were separated into two clusters (Figure 3A). Cluster 1 was enriched with H3K4me3 and H3K27ac marking and included the miR‐375 gene. Cluster 2 was characterized by high H3K27me3 marking and included the miR‐455 gene (Figure 3A). Visualization of H3K4me3, H3K27ac, and H3K27me3 signals showed a broad peak of H3K27me3 repressive mark covering the host gene of miR‐455, collagen type XXVII alpha 1 chain (COL27A1) (Figure S4B).
FIGURE 3.
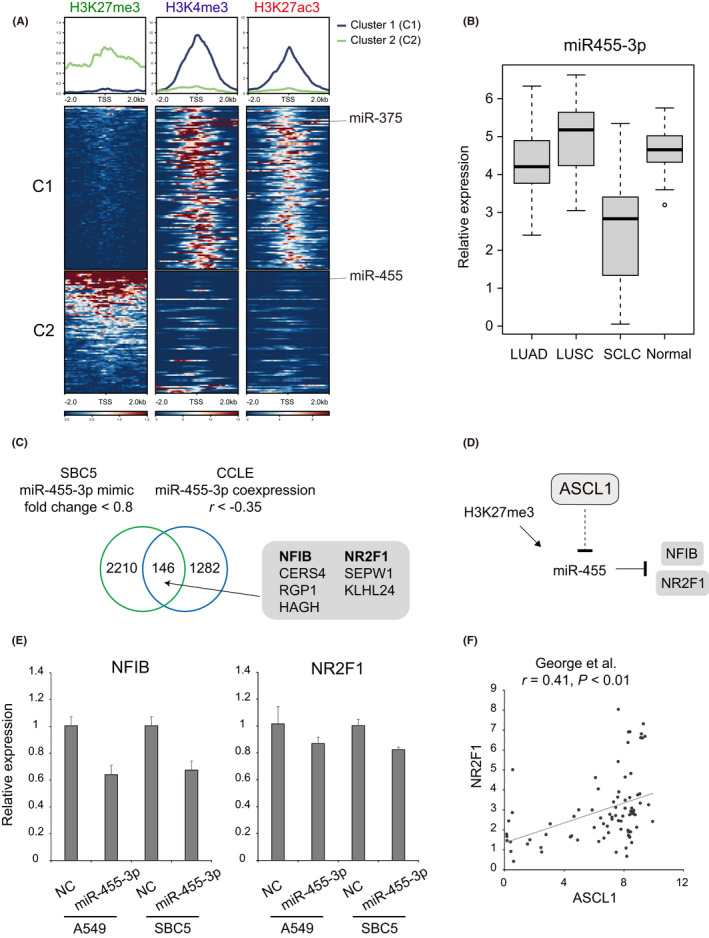
miR‐455 gene is repressed in Lu134A cells and miR‐455‐3p possibly targets nuclear factor I B (NFIB) and nuclear receptor subfamily 2 group F member 1 (NR2F1). (A) Distribution of H3K27me3, H3K4me3, and H3K27ac signals within 2.0 kb upstream and 2.0 kb downstream of the transcription start sites (TSSs) of 196 miRNA genes. Clustering analysis based on H3K27me3 and H3K27ac signals yielded two clusters. Cluster 1 (C1) included 112 miRNA genes marked by H3K4me3 and H3K27ac (e.g., miR‐375). Cluster 2 (C2) miRNA genes were marked by H3K27me3 in contrast to lower H3K4me3 and H3K27ac signals (e.g., miR‐455). y‐axis values in the upper panels indicate normalized read counts. (B) Expression levels of miR‐455‐3p in lung adenocarcinoma (LUAD, n = 36), squamous cell carcinoma (LUSC, n = 30), small cell lung cancer (SCLC, n = 17), and normal lung tissue samples (n = 44) were compared using the GSE74190 dataset. Note that miR‐455‐3p expression is generally low in SCLC tissue samples. Tukey–Kramer honestly significant difference (HSD) test, p < 0.01. (C) Venn diagram showing an overlap of downregulated genes by miR‐455‐3p mimic in SBC5 cells, and the genes negatively correlated with miR‐455‐3p in 50 SCLC cell lines. Among 146 overlapping genes, the indicated seven genes were predicted as miR‐455‐3p targets by TargetScan (miR‐455‐3p.1). Numbers of genes are indicated. (D) Schematic representation of achaete‐scute complex homolog 1 (ASCL1)‐mediated negative regulation and H3K27me3 marking of miR‐455 gene and possible targeting of NFIB and NR2F1 by miR‐455‐3p. (E) Quantitative RT‐PCR for NFIB and NR2F1 in A549 and SBC5 cells following negative control (NC) or miR‐455‐3p mimic transfection. Data are shown as means + standard errors. (F) Correlation of ASCL1 and NR2F1 in 81 SCLC tissue samples reported by George et al. Expression levels are shown as log2 (1 + FPKM) values.
Expression levels of COL27A1 and miR‐455‐3p in SCLC cell lines were strongly correlated (r = 0.90) (Figure S5A). Furthermore, log‐transformed expression levels of ASCL1 and COL27A1 were inversely correlated (r = −0.47) in SCLC tissue samples (Figure S5B). 3 We also found that miR‐455‐3p expression levels were lower in SCLC compared to lung adenocarcinoma (LUAD), squamous cell carcinoma (LUSC), and normal lung tissue samples (Figure 3B). 35 Given that ASCL1 is expressed in the majority of SCLC with neuroendocrine features, 10 , 11 , 12 but not in most cases of LUAD, LUSC, or normal lung tissues, 39 this observation supported that miR‐455‐3p expression might be suppressed by ASCL1 in SCLC tissues.
Next, we tested the effect of miR‐455‐3p mimic transduction. Because it was difficult to transduce miRNA mimic into Lu134A cells cultured as floating aggregates, we alternatively utilized SBC5 cells. RNA‐seq analysis of SBC5 cells transfected with miR‐455‐3p mimic revealed 2356 downregulated genes (fold change <0.8), and expression levels of 146 genes were negatively correlated with that of miR‐455‐3p (r < −0.35) in SCLC cell lines (Figure 3C). Furthermore, 7 of 146 genes were predicted targets by TargetScan (Figure 3C). Among them, we selected nuclear factor I B (NFIB) and nuclear receptor subfamily 2 group F member 1 (NR2F1) for validation experiments (Figure 3D), because previous studies demonstrated that NFIB is implicated in SCLC metastasis, 48 , 49 and NR2F1 is involved in neural development. 50 Consistent with the RNA‐seq result, quantitative RT‐PCR analysis revealed that NFIB and NR2F1 were downregulated by miR‐455‐3p mimic in SBC5 and A549 lung adenocarcinoma cells (Figure 3E). Of clinical relevance, log‐transformed expression levels of ASCL1 and NR2F1 were positively correlated in SCLC tissue samples (Figure 3F). 3
3.5. Identification of super‐enhancer‐associated miRNA genes in small cell lung cancer cells
We have previously demonstrated that SEs drive the biogenesis of cell‐type‐specific miRNAs and determined a catalog of SE‐associated miRNA genes across 86 different kinds of human cell and tissue samples (Table S9). 30 Similarly, we assigned SEs to miRNA genes using H3K27ac profiles in Lu134A cells and identified 18 SE‐associated miRNA genes, including let‐7b‐7a3, miR‐200a‐200b‐429, miR‐141‐200c, miR‐23a‐24‐2‐27a, miR‐375, and miR‐191‐425 (Figure 4A and Table S10). Considering that miR‐375, miR‐200b‐3p, and miR‐429 were downregulated by ASCL1 knockdown (Table S6), their associations with SEs suggested a role for ASCL1 in the preferential regulation of SE‐associated miRNA genes analogous to SE‐associated genes (Figure 1G).
FIGURE 4.
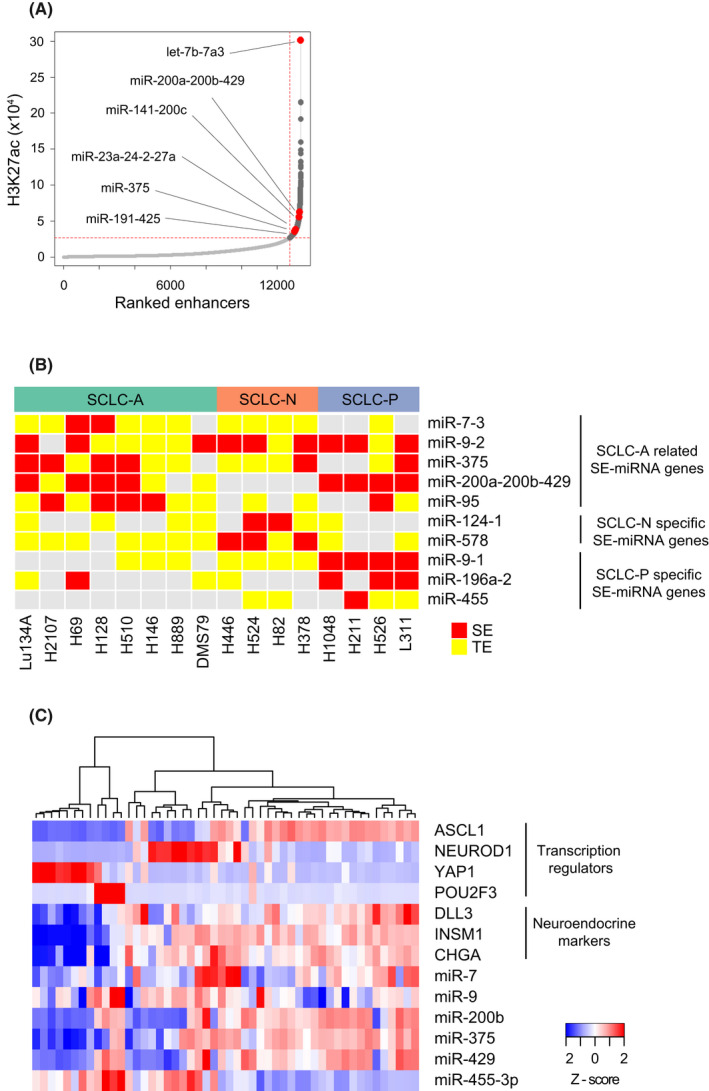
Super‐enhancer (SE)‐associated miRNA genes in small cell lung cancer (SCLC) cell lines. (A) H3K27ac signals at enhancers in Lu134A cells. Enhancer regions are plotted in an increasing order based on their signals. Representative SE‐associated miRNA genes are indicated, and the full list is described in Table S10. (B) Associations of representative miRNA genes with SEs or typical enhancers (TEs) in eight SCLC‐A (including Lu134A), four SCLC‐N, and four SCLC‐P cell lines. H3K27ac Cleavage Under Targets and Tagmentation (CUT&Tag) data were used for Lu134A and H3K27ac ChIP‐seq data obtained from the GSE151002 and GSE115124 datasets were used for the other cell lines. (C) Heatmap of relative expression levels of key transcription regulators, neuroendocrine markers, and miRNAs related to SCLC‐A in 50 SCLC cell lines.
Next, we defined SE‐associated miRNA genes across different molecular subtypes using the public datasets of H3K27ac ChIP‐seq in SCLC cell lines (Table S1). 14 , 20 In addition to Lu134 A cells, we determined SE‐associated or TE‐associated miRNA genes in 7 SCLC‐A, 4 SCLC‐N and 4 SCLC‐P cell lines (Table S11) 30 and further selected SE‐associated miRNA genes found in ≥3 SCLC‐A, ≥2 SCLC‐N, or ≥2 SCLC‐P cell lines. Consequently, we obtained a list of 57 SE‐associated miRNA genes as summarized in Table S12. With a few exceptions, such as let‐7b‐7a3, many SE‐associated miRNA genes in SCLC cell lines were rarely associated with the SEs of the aforementioned 86 samples (Table S9), indicating the highly cell‐type‐specific nature of SEs. 30
Some miRNA genes were ubiquitously associated with SEs across different SCLC subtypes (e.g., let‐7b‐7a3, miR‐9‐2 and miR‐203) (Figure 4B and Table S12). Other SE‐associated miRNA genes were related to one or two molecular subtypes. For example, miR‐200a‐200b‐429 was associated with SEs in both SCLC‐A and SCLC‐P but not in SCLC‐N (Figure 4B and Table S12).
A subset of miRNA genes was associated with SEs preferentially in SCLC‐A cell lines, including miR‐95, miR‐375, and miR‐7‐3 (Figure 4B and Table S12). Remarkably, miR‐375 was not associated with SEs in any of the 86 samples (Table S12), indicating its highly specific association with SEs and phenotypic relevance to SCLC‐A. Of note, miR‐7‐3 was associated with SEs in two SCLC‐A cell lines (H69 and H128), but not in SCLC‐N or SCLC‐P cell lines (Figure 4B and Table S11).
SE‐associated miRNA genes unique to SCLC‐N (e.g., miR‐124‐1 and miR‐578) or SCLC‐P (e.g., miR‐9‐1 and miR‐196a‐2) were also identified (Figure 4B and Table S12).
In any SCLC‐A cell line, miR‐455 gene was not associated with either SE or TE. In contrast, miR‐455 was associated with SEs or TEs in three out of four SCLC‐P cell lines (Figure 4B and Table S12). We analyzed the public ChIP‐seq dataset 20 and found POU2F3 binding peaks around the TSS of COL27A1 (host gene for miR‐455) in H1048 cells of SCLC‐P subtype, suggesting direct regulation of miR‐455 by POU2F3 (Figure S5C). Consistently, POU2F3‐high SCLC cell lines in the CCLE expressed higher miR‐455‐3p (Figure S5D). Taken together, miR‐455 might be negatively regulated by ASCL1 in SCLC‐A and positively regulated by POU2F3 in SCLC‐P (Figure S5E).
We compared expression levels of key transcription regulators (ASCL1, NEUROD1, YAP1, and POU2F3), neuroendocrine markers (DLL3, INSM1, and CHGA), and miRNAs associated with SCLC‐A (miR‐7, miR‐9, miR‐200b, miR‐375, miR‐429, and miR‐455‐3p) in SCLC cell lines. Consistent with previous studies, 12 , 13 neuroendocrine markers were expressed in SCLC‐A and SCLC‐N but not in SCLC‐Y and SCLC‐P cell lines (Figure 4C).
Expression of miR‐7 was found in SCLC‐A and SCLC‐N cell lines and that of miR‐9 was more ubiquitous (Figure 4C). In line with the result of miRNA array analysis (Figure 2B), miR‐200b, miR‐375, and miR‐429 were preferentially expressed in SCLC‐A cell lines (Figure 4C). Expression of miR‐455‐3p was generally low in SCLC‐A but was the highest in SCLC‐P cell lines (Figure 4C). Thus, miRNA expression levels and SE associations were overall concordant across SCLC subtypes.
3.6. Target gene candidates of miR‐7, miR‐9, and miR‐375
We aimed to explore target genes of miRNAs with pathological significance and focused on miR‐7, miR‐9, and miR‐375 as SE‐associated miRNAs in SCLC‐A cell lines. Referring to the public dataset, 35 these miRNAs were highly expressed in SCLC as compared to LUAD, LUSC, and normal lung tissues (Figure 5A).
FIGURE 5.
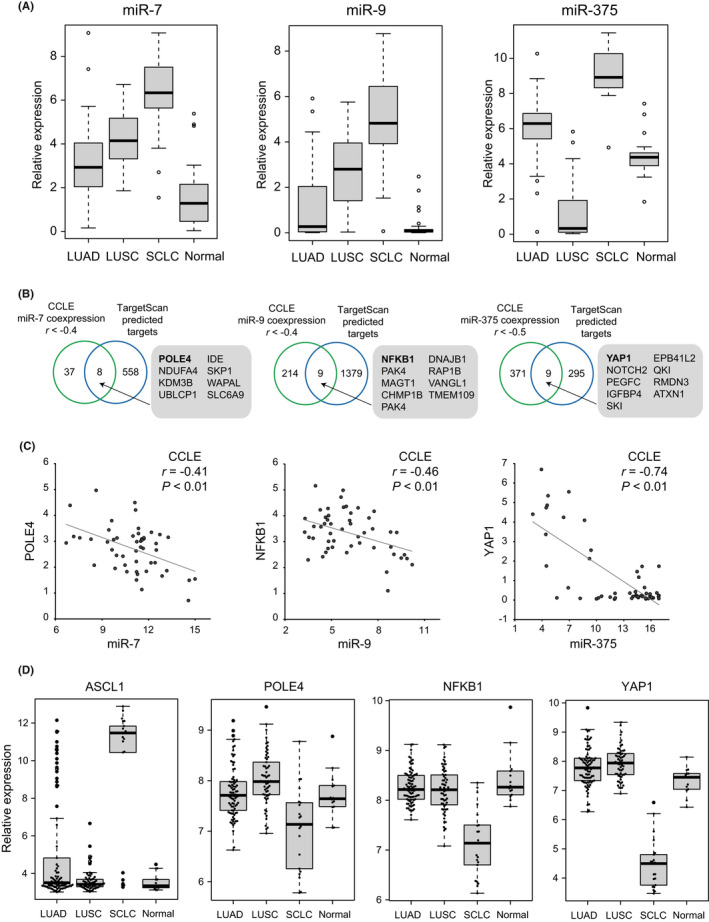
Candidate target genes of miR‐7, miR‐9, and miR‐375 in small cell lung cancer (SCLC). (A) Expression levels of miR‐7 (left), miR‐9 (middle), or miR‐375 (right) in lung adenocarcinoma (LUAD, n = 36), squamous cell carcinoma (LUSC, n = 30), SCLC (n = 17), and normal lung tissue samples (n = 44) were compared using the GSE74190 dataset. Note that expression levels of these miRNAs are generally high in SCLC tissue samples. Tukey–Kramer honestly significant difference (HSD) test, p < 0.01. (B) Venn diagrams showing overlaps of target genes of miR‐7, miR‐9, and miR‐375 predicted by TargetScan and the genes negatively correlated with each miRNA in 50 SCLC cell lines (Pearson's r < −0.4 for miR‐7 and miR‐9, and r < −0.5 for miR‐375). Numbers of genes are indicated. (C) Correlations between miR‐7 and DNA polymerase epsilon 4, accessory subunit (POLE4) (left), miR‐9 and nuclear factor kappa B subunit 1 (NFKB1) (middle), and miR‐375 and Yes‐associated protein 1 (YAP1) in 50 SCLC cell lines. Expression levels of genes and miRNAs are shown as log2 (1 + RPKM) and log2 values of microarray signal intensity, respectively. (D) Expression levels of achaete‐scute complex homolog 1 (ASCL1) (left), POLE4 (middle left), NFKB1 (middle right), and YAP1 (right) in LUAD (n = 85), LUSC (n = 61), SCLC (n = 21) and normal lung tissue samples (n = 14) were compared using the GSE30219 dataset. Note that expression levels of POLE4, NFKB1, and YAP1 are generally low in SCLC tissue samples in contrast to high expression of ASCL1. Tukey–Kramer HSD test, p < 0.01.
We then compared target genes with conserved sites predicted by TargetScan and those negatively correlated with the miRNAs (r < −0.4 for miR‐7 and miR‐9, and r < −0.5 for miR‐375) in SCLC cell lines (Figure 5B). These comparisons identified possible miRNA target genes, such as DNA polymerase epsilon 4, accessory subunit (POLE4) for miR‐7, nuclear factor kappa B subunit 1 (NFKB1) for miR‐9, and YAP1 for miR‐375 (Figure 5C). POLE4 is a subunit of DNA polymerase epsilon and plays a key role for DNA replication. Interestingly, double knockout of Pole4 and Trp53 in mice exhibits accelerated tumorigenesis, suggesting that replication stress and p53 inactivation are implicated in cancer development. 51 NFKB1 is a subunit of NFκB, a central regulator of inflammatory responses and is presumably important for tumor immune reactions. 52
We compared expression levels of ASCL1, POLE4, NFKB1, and YAP1 in lung cancer tissue samples using the public dataset. 34 ASCL1 expression was restricted to the majority of SCLC and part of LUAD tissue samples. In contrast, expression levels of POLE4, NFKB1, and YAP1 were generally low in SCLC as compared to LUAD, LUSC, and normal lung tissues (Figure 5D). Regarding higher expression of miR‐7, miR‐9, and miR‐375 in SCLC tissue samples (Figure 5A), lower expression of their possible target genes POLE4, NFKB1, and YAP1 suggested miRNA‐mediated regulation.
3.7. Co‐targeting of miRNAs associated with SCLC‐A
We explored whether predicted target genes of SE‐associated miRNAs in SCLC‐A were de‐repressed by ASCL1 knockdown in Lu134A cells using the RNA‐seq result. We focused on ASCL1‐regulated miRNAs identified in this study (miR‐7‐5p, miR‐375, miR‐200b‐3p, and miR‐429) and miR‐9‐5p that is ubiquitously expressed in SCLC. We found that silencing of ASCL1 tended to upregulate the expression levels of predicted target genes of miR‐375, miR‐7‐5p, miR‐200b‐3p, miR‐429, and miR‐9‐5p with statistical significance (Figure 6A,B, upper panel), although such effect on miR‐9‐5p target genes was modest. These observations indicated that downregulation of these miRNAs following ASCL1 knockdown led to de‐repression of their target genes, underscoring the functional relevance of miRNA‐mediated gene regulation.
FIGURE 6.
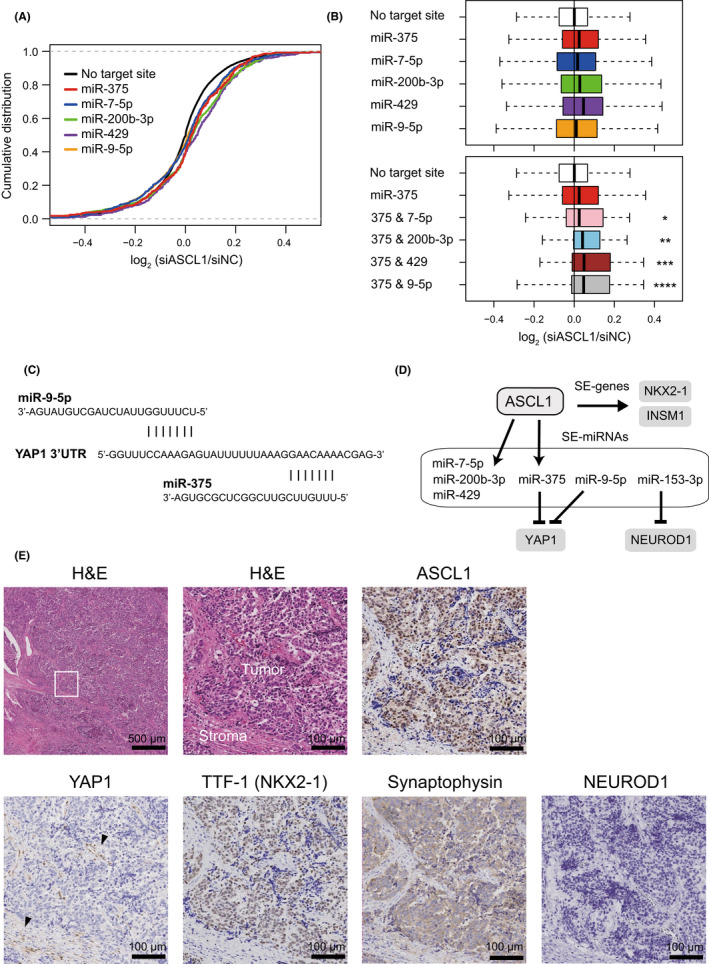
Yes‐associated protein 1 (YAP1) is a common target of miR‐9‐5p and miR‐375. (A) Cumulative distribution plot of log2‐transformed gene expression fold changes of predicted target genes of miR‐375, miR‐7‐5p, miR‐200b‐3p, miR‐429, or miR‐9‐5p and other genes with no target site. The RNA‐seq result of Lu134A cells treated with siNC or siASCL1 was analyzed. (B) Upper panel: Comparisons of log2‐transformed gene expression fold changes of predicted target genes. Compared to other genes with no target site, predicted target genes of miR‐375, miR‐7‐5p, miR‐200b‐3p, miR‐429, and miR‐9‐5p were preferentially de‐repressed following ASCL1 knockdown (p < 10−4, p < 10−2, p < 10−12, p < 10−8, and p < 10−4, respectively). The p‐value was calculated by one‐sided Wilcoxon rank test. Lower panel: Compared to other genes with no target site, common predicted target genes of miR‐375 and miR‐7‐5p (375 & 7‐5p), miR‐375 and miR‐200b‐3p (375 & 200b‐3p), miR‐375 and miR‐429 (375 & 429), and miR‐375 and miR‐9‐5p (375 & 9‐5p) were preferentially de‐repressed following ASCL1 knockdown. *p = 4.5 × 10⁻², **p = 2.7 × 10⁻³, ***p = 3.8 × 10⁻³, ****p = 4.3 × 10⁻⁴. The p‐value was calculated by one‐sided Wilcoxon rank test. (C) Target sequences of miR‐9‐5p and miR‐375 in the 3′UTR region of YAP1 mRNA. (D) Schematic representation of achaete‐scute complex homolog 1 (ASCL1)‐mediated regulation of super‐enhancer (SE)‐genes and SE‐associated miRNAs (SE‐miRNAs). (E) Upper left: H&E staining (low magnification). The square indicates the area used for the high magnification view. Upper middle: H&E staining (high magnification). Tumor and stromal areas are indicated. Upper right: Immunohistochemistry (IHC) for ASCL1. Lower pictures indicate IHC for YAP1, thyroid transcription factor‐1 (TTF‐1) also known as NK2 homeobox 1 (NKX2‐1), synaptophysin, and NEUROD1. Arrowheads indicate positive YAP1 staining in stromal cells. Scale bar is shown in each picture.
Given that multiple miRNAs frequently repress shared target genes in a cooperative manner, 53 we examined expression changes of common target genes of two different miRNAs following ASCL1 knockdown. Based on the potential importance of miR‐375 as ASCL1‐regulated, SE‐associated and SCLC‐specific miRNA, we focused on combined effects between miR‐375 and other miRNAs. Common target genes of miR‐375 and another miRNA (miR‐7‐5p, miR‐200b‐3p, miR‐429, or miR‐9‐5p) tended to be upregulated by ASCL1 silencing and those of miR‐375 and miR‐9‐5p showed a noticeable trend toward upregulation (Figure 6B, lower panel). Such upregulated co‐target genes of miR‐375 and miR‐9‐5p included YAP1 (Table S5). Interestingly, the 3′UTR region of YAP1 contains target recognition sequences for miR‐375 and miR‐9‐5p in close proximity (20 nt distance) (Figure 6C), which is important for cooperative action of two miRNA target sites. 54
We further found that YAP1, POU2F3, and NEUROD1 mRNAs have target recognition sequences for SE‐associated miRNAs unique to SCLC‐A, SCLC‐N, and/or SCLC‐P (Figure S6). Notably, miR‐153‐2‐595 was associated with SEs only in SCLC‐A cell lines (Table S12), and TargetScan predicted NEUROD1 as a target gene of miR‐153‐3p. Considering its specific association with SEs, miR‐153‐3p may be involved in SCLC subtyping via NEUROD1 suppression in SCLC‐A.
Taken together, our findings indicated that ASCL1 induces SE‐associated genes (e.g., NKX2‐1 and INSM1) as well as SE‐associated miRNAs (e.g., miR‐200b‐3p, miR‐429, and miR‐375) (Figure 6D). Moreover, SE‐associated miRNA‐mediated cooperative regulation of target genes may contribute to SCLC subtyping (Figure 6D).
Finally, we performed immunohistochemistry for ASCL1, YAP1, NEUROD1, TTF‐1 (an alias for NKX2‐1), and synaptophysin as a neuroendocrine marker. In four SCLC tissue samples evaluated in this study (Table S13), tumor cells were positive for ASCL1, TTF‐1, and synaptophysin, while YAP1 was only positive in stromal cells and not in tumor cells (Figure 6E). These observations on clinical samples were consistent with our experimental results that ASCL1 positively regulates NKX2‐1 and suppresses YAP1, possibly through induction of miR‐375 (Figure 6D).
NEUROD1 was negative in two cases while NEUROD1 positivity was noted in the other two cases (Figure S7). These findings were in line with previous studies showing ASCL1/NEUROD1 double‐positive as well as ASCL1‐positive/NEUROD1‐negative SCLC cases. 55 , 56
4. DISCUSSION
In the present study, we revealed the histone modification landscape in SCLC cells utilizing a novel technique, CUT&Tag assay. We found SEs and broad H3K4me3 domains overlying ASCL1, INSM1, NKX2‐1, and FOXA1 gene loci, suggesting their importance for cell‐type identity. 30 ASCL1 knockdown followed by RNA‐seq analysis demonstrated that ASCL1 preferentially governs the expression of SE‐associated genes, highlighting its significance as a master transcription regulator. These findings were consistent with the previous reports showing that JQ1, a BET bromodomain inhibitor commonly used for suppressing SE‐associated gene regulation, inhibits ASCL1 expression and cell growth in SCLC cell lines. 57 , 58
Our study is the first to profile miRNAs regulated by ASCL1, and we identified miR‐7, miR‐375, miR‐200b‐3p, and miR‐429 as ASCL1‐regulated miRNAs. Moreover, we determined SE‐associated miRNA genes across different molecular subtypes and revealed subtype‐specific miRNA networks with potential relevance to phenotypic differences.
A previous study demonstrated that ASCL1 directly induces miR‐375 that inhibits YAP1 expression, thereby regulating neuroendocrine features. 59 Our results further confirmed ASCL1‐mediated regulation of miR‐375 and its highly cell‐type‐specific association with SEs suggested its role as a cell‐type‐defining miRNA. Because target sequences of miR‐9‐5p and miR‐375 are closely located in the 3′UTR of YAP1, co‐targeting by these two miRNAs may be an important mechanism for YAP1 suppression in SCLC‐A. In analogy, the ubiquitous association of miR‐9 with SEs in SCLC‐A, SCLC‐N, and SCLC‐P suggested that miR‐9 and its cooperative action with other SE‐associated miRNAs may be a prerequisite for YAP1 repression.
ASCL1 is known to be negatively regulated by Notch signaling, 60 and Notch activation has a tumor suppressive role. 3 We noted that NOTCH2 is a common target gene of miR‐9‐5p and miR‐375, and this mechanism may contribute to suppression of Notch signaling and sustained expression of ASCL1. As such, differential combinations of SE‐associated miRNAs might be generally involved in determining SCLC molecular subtypes and phenotypic differences.
In addition to intertumoral differences, recent studies demonstrated intratumoral coexpression of ASCL1, NEUROD1, and YAP1 at various levels in SCLC tissue samples. 55 , 56 In line with previous reports, two out of four SCLC tissue samples evaluated in this study were positive for both ASCL1 and NEUROD1. This finding may reflect a phenotypic shift from SCLC‐A to SCLC‐N, as suggested in previous mouse models. 16 , 17 Thus, different expression patterns of miRNAs targeting SCLC subtype‐defining genes might participate in forming intratumoral heterogeneity.
In summary, our findings revealed ASCL1‐mediated miRNA regulation, SE‐associated miRNAs, and their potential contributions to complex transcriptional networks underlying SCLC heterogeneity. Further investigations are necessary to obtain the whole picture of the miRNA‐mediated combinatorial regulation of target genes associated with SCLC subtyping, such as YAP1 suppression by miR‐375 and miR‐9‐5p in SCLC‐A.
AUTHOR CONTRIBUTIONS
Conceptualization: NM, MH, HIS, AS. Data curation: NM, MH, HIS. Funding acquisition: NM, TN, AS. Investigation: KM, NM, MH, HT, HU, KF, YO, TI, NK, HIS. Supervision: MH, YT, HIS, TN, AS. Validation: KM, NM, MH, HIS. Visualization: KM, NM, MH, YT, HT, NK, HIS. Writing: KM, NM, AS.
FUNDING INFORMATION
This work was supported by JSPS KAKENHI (21K16111 to N.M., 18K08170 to A.S., 16H02653 to T.N.) and Takeda Science Foundation to A. S.
DISCLOSURE
No potential conflicts of interest were disclosed.
ETHICAL APPROVAL
The study protocol was approved by the Human Ethics Review Committee of Nippon Medical School for immunohistochemistry of human lung specimens. Informed consent was obtained from the patients. Registry and the Registration No. of the study/trial: N/A. Animal studies: N/A.
Supporting information
Figure S1
Figure S2
Figure S3
Figure S4
Figure S5
Figure S6
Figure S7
Table S1‐S13
ACKNOWLEDGMENTS
We thank all the members of the Department of Respiratory Medicine, Graduate School of Medicine, the University of Tokyo for their support and useful discussion.
Miyakawa K, Miyashita N, Horie M, et al. ASCL1 regulates super‐enhancer‐associated miRNAs to define molecular subtypes of small cell lung cancer. Cancer Sci. 2022;113:3932‐3946. doi: 10.1111/cas.15481
REFERENCES
- 1. Sabari JK, Lok BH, Laird JH, Poirier JT, Rudin CM. Unravelling the biology of SCLC: implications for therapy. Nat Rev Clin Oncol. 2017;14:549‐561. [DOI] [PMC free article] [PubMed] [Google Scholar]
- 2. Gazdar AF, Bunn PA, Minna JD. Small‐cell lung cancer: what we know, what we need to know and the path forward. Nat Rev Cancer. 2017;17:725‐737. [DOI] [PubMed] [Google Scholar]
- 3. George J, Lim JS, Jang SJ, et al. Comprehensive genomic profiles of small cell lung cancer. Nature. 2015;524:47‐53. [DOI] [PMC free article] [PubMed] [Google Scholar]
- 4. Meder L, König K, Ozretić L, et al. NOTCH, ASCL1, p53 and RB alterations define an alternative pathway driving neuroendocrine and small cell lung carcinomas. Int J Cancer. 2016;138:927‐938. [DOI] [PMC free article] [PubMed] [Google Scholar]
- 5. Umemura S, Mimaki S, Makinoshima H, et al. Therapeutic priority of the PI3K/AKT/mTOR pathway in small cell lung cancers as revealed by a comprehensive genomic analysis. J Thorac Oncol. 2014;9:1324‐1331. [DOI] [PMC free article] [PubMed] [Google Scholar]
- 6. Ghandi M, Huang FW, Jané‐Valbuena J, et al. Next‐generation characterization of the cancer cell line encyclopedia. Nature. 2019;569:503‐508. [DOI] [PMC free article] [PubMed] [Google Scholar]
- 7. Polley E, Kunkel M, Evans D, et al. Small cell lung cancer screen of oncology drugs, investigational agents, and gene and microRNA expression. J Natl Cancer Inst. 2016;108:djw122. [DOI] [PMC free article] [PubMed] [Google Scholar]
- 8. Tlemsani C, Pongor L, Elloumi F, et al. SCLC‐CellMiner: a resource for small cell lung cancer cell line genomics and pharmacology based on genomic signatures. Cell Rep. 2020;33:108296. [DOI] [PMC free article] [PubMed] [Google Scholar]
- 9. Travis WD, Brambilla E, Nicholson AG, et al. The 2015 World Health Organization classification of lung tumors: impact of genetic, clinical and radiologic advances since the 2004 classification. J Thorac Oncol. 2015;10:1243‐1260. [DOI] [PubMed] [Google Scholar]
- 10. Osada H, Tatematsu Y, Yatabe Y, Horio Y, Takahashi T. ASH1 gene is a specific therapeutic target for lung cancers with neuroendocrine features. Cancer Res. 2005;65:10680‐10685. [DOI] [PubMed] [Google Scholar]
- 11. Osada H, Tomida S, Yatabe Y, et al. Roles of achaete‐scute homologue 1 in DKK1 and E‐cadherin repression and neuroendocrine differentiation in lung cancer. Cancer Res. 2008;68:1647‐1655. [DOI] [PubMed] [Google Scholar]
- 12. Rudin CM, Poirier JT, Byers LA, et al. Molecular subtypes of small cell lung cancer: a synthesis of human and mouse model data. Nat Rev Cancer. 2019;19:289‐297. [DOI] [PMC free article] [PubMed] [Google Scholar]
- 13. Borromeo MD, Savage TK, Kollipara RK, et al. ASCL1 and NEUROD1 reveal heterogeneity in pulmonary neuroendocrine tumors and regulate distinct genetic programs. Cell Rep. 2016;16:1259‐1272. [DOI] [PMC free article] [PubMed] [Google Scholar]
- 14. Pozo K, Kollipara RK, Kelenis DP, et al. ASCL1, NKX2‐1, and PROX1 co‐regulate subtype‐specific genes in small‐cell lung cancer. iScience. 2021;24:102953. [DOI] [PMC free article] [PubMed] [Google Scholar]
- 15. Matsuo K, Taniguchi K, Hamamoto H, et al. Delta‐like canonical Notch ligand 3 as a potential therapeutic target in malignancies: a brief overview. Cancer Sci. 2021;112:2984‐2992. [DOI] [PMC free article] [PubMed] [Google Scholar]
- 16. Mollaoglu G, Guthrie MR, Böhm S, et al. MYC drives progression of small cell lung cancer to a variant neuroendocrine subtype with vulnerability to Aurora kinase inhibition. Cancer Cell. 2017;31:270‐285. [DOI] [PMC free article] [PubMed] [Google Scholar]
- 17. Ireland AS, Micinski AM, Kastner DW, et al. MYC drives temporal evolution of small cell lung cancer subtypes by reprogramming neuroendocrine fate. Cancer Cell. 2020;38:60‐78.e12. [DOI] [PMC free article] [PubMed] [Google Scholar]
- 18. Fujino K, Motooka Y, Hassan WA, et al. Insulinoma‐associated protein 1 is a crucial regulator of neuroendocrine differentiation in lung cancer. Am J Pathol. 2015;185:3164‐3177. [DOI] [PubMed] [Google Scholar]
- 19. Horie M, Saito A, Ohshima M, Suzuki HI, Nagase T. YAP and TAZ modulate cell phenotype in a subset of small cell lung cancer. Cancer Sci. 2016;107:1755‐1766. [DOI] [PMC free article] [PubMed] [Google Scholar]
- 20. Huang YH, Klingbeil O, He XY, et al. POU2F3 is a master regulator of a tuft cell‐like variant of small cell lung cancer. Genes Dev. 2018;32:915‐928. [DOI] [PMC free article] [PubMed] [Google Scholar]
- 21. Owonikoko TK, Dwivedi B, Chen Z, et al. YAP1 expression in SCLC defines a distinct subtype with T‐cell‐inflamed phenotype. J Thorac Oncol. 2021;16:464‐476. [DOI] [PMC free article] [PubMed] [Google Scholar]
- 22. Gay CM, Stewart CA, Park EM, et al. Patterns of transcription factor programs and immune pathway activation define four major subtypes of SCLC with distinct therapeutic vulnerabilities. Cancer Cell. 2021;39:346‐360.e347. [DOI] [PMC free article] [PubMed] [Google Scholar]
- 23. Poirier JT, George J, Owonikoko TK, et al. New approaches to SCLC therapy: from the laboratory to the clinic. J Thorac Oncol. 2020;15:520‐540. [DOI] [PMC free article] [PubMed] [Google Scholar]
- 24. Ito T, Matsubara D, Tanaka I, et al. Loss of YAP1 defines neuroendocrine differentiation of lung tumors. Cancer Sci. 2016;107:1527‐1538. [DOI] [PMC free article] [PubMed] [Google Scholar]
- 25. Whyte WA, Orlando DA, Hnisz D, et al. Master transcription factors and mediator establish super‐enhancers at key cell identity genes. Cell. 2013;153:307‐319. [DOI] [PMC free article] [PubMed] [Google Scholar]
- 26. Hnisz D, Abraham BJ, Lee TI, et al. Super‐enhancers in the control of cell identity and disease. Cell. 2013;155:934‐947. [DOI] [PMC free article] [PubMed] [Google Scholar]
- 27. Christensen CL, Kwiatkowski N, Abraham BJ, et al. Targeting transcriptional addictions in small cell lung cancer with a covalent CDK7 inhibitor. Cancer Cell. 2014;26:909‐922. [DOI] [PMC free article] [PubMed] [Google Scholar]
- 28. Suzuki HI, Katsura A, Matsuyama H, Miyazono K. MicroRNA regulons in tumor microenvironment. Oncogene. 2015;34:3085‐3094. [DOI] [PMC free article] [PubMed] [Google Scholar]
- 29. Osada H, Takahashi T. Let‐7 and miR‐17‐92: small‐sized major players in lung cancer development. Cancer Sci. 2011;102:9‐17. [DOI] [PubMed] [Google Scholar]
- 30. Suzuki HI, Young RA, Sharp PA. Super‐enhancer‐mediated RNA processing revealed by integrative MicroRNA network analysis. Cell. 2017;168:1000‐1014.e1015. [DOI] [PMC free article] [PubMed] [Google Scholar]
- 31. Suzuki HI, Onimaru K. Biomolecular condensates in cancer biology. Cancer Sci. 2022;113:382‐391. [DOI] [PMC free article] [PubMed] [Google Scholar]
- 32. Augustyn A, Borromeo M, Wang T, et al. ASCL1 is a lineage oncogene providing therapeutic targets for high‐grade neuroendocrine lung cancers. Proc Natl Acad Sci U S A. 2014;111:14788‐14793. [DOI] [PMC free article] [PubMed] [Google Scholar]
- 33. Kaya‐Okur HS, Wu SJ, Codomo CA, et al. CUT&tag for efficient epigenomic profiling of small samples and single cells. Nat Commun. 2019;10:1930. [DOI] [PMC free article] [PubMed] [Google Scholar]
- 34. Rousseaux S, Debernardi A, Jacquiau B, et al. Ectopic activation of germline and placental genes identifies aggressive metastasis‐prone lung cancers. Sci Transl Med. 2013;5:186ra166. [DOI] [PMC free article] [PubMed] [Google Scholar]
- 35. Jin Y, Liu Y, Zhang J, et al. The expression of miR‐375 is associated with carcinogenesis in three subtypes of lung cancer. PLoS One. 2015;10:e0144187. [DOI] [PMC free article] [PubMed] [Google Scholar]
- 36. Robinson JT, Thorvaldsdóttir H, Winckler W, et al. Integrative genomics viewer. Nat Biotechnol. 2011;29:24‐26. [DOI] [PMC free article] [PubMed] [Google Scholar]
- 37. Subramanian A, Tamayo P, Mootha VK, et al. Gene set enrichment analysis: a knowledge‐based approach for interpreting genome‐wide expression profiles. Proc Natl Acad Sci U S A. 2005;102:15545‐15550. [DOI] [PMC free article] [PubMed] [Google Scholar]
- 38. Agarwal V, Bell GW, Nam JW, Bartel DP. Predicting effective microRNA target sites in mammalian mRNAs. eLife. 2015;4:e05005. [DOI] [PMC free article] [PubMed] [Google Scholar]
- 39. Miyashita N, Horie M, Suzuki HI, et al. An integrative analysis of transcriptome and epigenome features of ASCL1‐positive lung adenocarcinomas. J Thorac Oncol. 2018;13:1676‐1691. [DOI] [PubMed] [Google Scholar]
- 40. Horie M, Miyashita N, Mattsson JSM, et al. An integrative transcriptome analysis reveals a functional role for thyroid transcription factor‐1 in small cell lung cancer. J Pathol. 2018;246:154‐165. [DOI] [PubMed] [Google Scholar]
- 41. Kaya‐Okur HS, Janssens DH, Henikoff JG, Ahmad K, Henikoff S. Efficient low‐cost chromatin profiling with CUT&tag. Nat Protoc. 2020;15:3264‐3283. [DOI] [PMC free article] [PubMed] [Google Scholar]
- 42. Meers MP, Tenenbaum D, Henikoff S. Peak calling by sparse enrichment analysis for CUT&RUN chromatin profiling. Epigenetics Chromatin. 2019;12:42. [DOI] [PMC free article] [PubMed] [Google Scholar]
- 43. Zang C, Schones DE, Zeng C, Cui K, Zhao K, Peng W. A clustering approach for identification of enriched domains from histone modification ChIP‐seq data. Bioinformatics. 2009;25:1952‐1958. [DOI] [PMC free article] [PubMed] [Google Scholar]
- 44. Ramírez F, Ryan DP, Grüning B, et al. deepTools2: a next generation web server for deep‐sequencing data analysis. Nucleic Acids Res. 2016;44:W160‐W165. [DOI] [PMC free article] [PubMed] [Google Scholar]
- 45. Tate JG, Bamford S, Jubb HC, et al. COSMIC: the catalogue of somatic mutations in cancer. Nucleic Acids Res. 2019;47:D941‐d947. [DOI] [PMC free article] [PubMed] [Google Scholar]
- 46. Sato T, Kaneda A, Tsuji S, et al. PRC2 overexpression and PRC2‐target gene repression relating to poorer prognosis in small cell lung cancer. Sci Rep. 2013;3:1911. [DOI] [PMC free article] [PubMed] [Google Scholar]
- 47. Huang J, Gou H, Yao J, et al. The noncanonical role of EZH2 in cancer. Cancer Sci. 2021;112:1376‐1382. [DOI] [PMC free article] [PubMed] [Google Scholar]
- 48. Denny SK, Yang D, Chuang CH, et al. Nfib promotes metastasis through a widespread increase in chromatin accessibility. Cell. 2016;166:328‐342. [DOI] [PMC free article] [PubMed] [Google Scholar]
- 49. Semenova EA, Kwon MC, Monkhorst K, et al. Transcription factor NFIB is a driver of small cell lung cancer progression in mice and Marks metastatic disease in patients. Cell Rep. 2016;16:631‐643. [DOI] [PMC free article] [PubMed] [Google Scholar]
- 50. Bertacchi M, Parisot J, Studer M. The pleiotropic transcriptional regulator COUP‐TFI plays multiple roles in neural development and disease. Brain Res. 2019;1705:75‐94. [DOI] [PubMed] [Google Scholar]
- 51. Bellelli R, Borel V, Logan C, et al. Polε instability drives replication stress, abnormal development, and tumorigenesis. Mol Cell. 2018;70:707‐721.e707. [DOI] [PMC free article] [PubMed] [Google Scholar]
- 52. Cartwright T, Perkins ND, Wilson CL. NFKB1: a suppressor of inflammation, ageing and cancer. FEBS J. 2016;283:1812‐1822. [DOI] [PubMed] [Google Scholar]
- 53. Cherone JM, Jorgji V, Burge CB. Cotargeting among microRNAs in the brain. Genome Res. 2019;29:1791‐1804. [DOI] [PMC free article] [PubMed] [Google Scholar]
- 54. Briskin D, Wang PY, Bartel DP. The biochemical basis for the cooperative action of microRNAs. Proc Natl Acad Sci U S A. 2020;117:17764‐17774. [DOI] [PMC free article] [PubMed] [Google Scholar]
- 55. Sato Y, Okamoto I, Kameyama H, et al. Integrated immunohistochemical study on small‐cell carcinoma of the lung focusing on transcription and co‐transcription factors. Diagnostics. 2020;10:949. [DOI] [PMC free article] [PubMed] [Google Scholar]
- 56. Baine MK, Hsieh MS, Lai WV, et al. SCLC subtypes defined by ASCL1, NEUROD1, POU2F3, and YAP1: a comprehensive immunohistochemical and histopathologic characterization. J Thorac Oncol. 2020;15:1823‐1835. [DOI] [PMC free article] [PubMed] [Google Scholar]
- 57. Lenhart R, Kirov S, Desilva H, et al. Sensitivity of small cell lung cancer to BET inhibition is mediated by regulation of ASCL1 gene expression. Mol Cancer Ther. 2015;14:2167‐2174. [DOI] [PubMed] [Google Scholar]
- 58. Kato F, Fiorentino FP, Alibés A, et al. MYCL is a target of a BET bromodomain inhibitor, JQ1, on growth suppression efficacy in small cell lung cancer cells. Oncotarget. 2016;7:77378‐77388. [DOI] [PMC free article] [PubMed] [Google Scholar]
- 59. Nishikawa E, Osada H, Okazaki Y, et al. miR‐375 is activated by ASH1 and inhibits YAP1 in a lineage‐dependent manner in lung cancer. Cancer Res. 2011;71:6165‐6173. [DOI] [PubMed] [Google Scholar]
- 60. Ball DW. Achaete‐scute homolog‐1 and Notch in lung neuroendocrine development and cancer. Cancer Lett. 2004;204:159‐169. [DOI] [PubMed] [Google Scholar]
Associated Data
This section collects any data citations, data availability statements, or supplementary materials included in this article.
Supplementary Materials
Figure S1
Figure S2
Figure S3
Figure S4
Figure S5
Figure S6
Figure S7
Table S1‐S13