

Abstract
Myofiber hypertrophy during resistance training (RT) poorly associates with tissue-level surrogates of hypertrophy. However, it is underappreciated that, in pennate muscle, changes in myofiber cross-sectional area (fCSA), fascicle length (Lf), and pennation angle (PA) likely coordinate changes in whole-muscle cross-sectional area (mCSA). Therefore, we determined if changes in fCSA, PA, and Lf predicted vastus lateralis (VL) mCSA changes following RT. Thirteen untrained college-aged males (23±4 years old, 25.4±5.2 kg/m2) completed seven weeks of full-body RT (twice weekly). Right leg VL ultrasound images and biopsies were obtained prior to (PRE) and 72 hours following the last training bout (POST). Regression was used to assess if training-induced changes in mean fCSA, PA, and Lf predicted VL mCSA changes. Correlations were also performed between PRE-to-POST changes in obtained variables. Mean fCSA (+18%), PA (+8%), and mCSA (+22%) increased following RT (p<0.05), but not Lf (0.1%, p=0.772). Changes in fCSA, Lf and PA did not collectively predict changes in mCSA (R2 = 0.282, adjusted R2 =0.013, F3,8 = 1.050, p=0.422). Moderate negative correlations existed for percentage changes in PA and Lf (r=−0.548, p=0.052) and changes in fCSA and Lf (r=−0.649, p=0.022), and all other associations were weak (|r|<0.500). Although increases in mean fCSA, PA, and VL mCSA were observed, inter-individual responses for each variable and technique limitations make it difficult to generalize the morphological adaptations that predominantly drive tissue-level VL muscle hypertrophy. However, the small subject pool is a significant limitation which warrants more research in this area.
Keywords: ultrasound, muscle, resistance training, histology
INTRODUCTION
Resistance training (RT) increases skeletal muscle hypertrophy at the cellular and whole tissue levels (Goldberg et al., 1975; Garfinkel & Cafarelli, 1992; Hikida et al., 2000; Kadi et al., 2004; Kim et al., 2005; Baar et al., 2006; Petrella et al., 2008; Verney et al., 2008; Phillips, 2014; Snijders et al., 2016; Stec et al., 2016). It is widely assumed that increases in myofiber cross-sectional area (fCSA) during periods of resistance training results in proportional increases in whole-muscle cross-sectional area (mCSA). While both metrics generally show similar increases in directionality, there have been agreement discrepancies between fCSA and mCSA changes. This observation was evident as early as 1897, where run-trained dogs exhibited 26% greater fCSA values compared to untrained dogs despite the former group presenting only 13% greater mCSA values (Morpurgo, 1897). Animal studies reported similar findings decades later (Goldspink, 1964; Roberts et al., 2020), and subsequent human studies have reported that RT leads to different muscle hypertrophy outcomes depending on the method being used for assessments (Staron et al., 1990; Aagaard et al., 2001; Esmarck et al., 2001; Haun et al., 2019a; Ruple et al., 2022).
An excellent review by Jorgenson et al. (Jorgenson et al., 2020) described skeletal muscle adaptations from the microscopic to whole muscle levels. The authors presented a compelling hypothesis suggesting that increases in mean fCSA do not proportionally translate to increases in mCSA in pennate muscles given that hypertrophy likely involves the interaction of three factors including overload-induced changes in pennation angle (PA), fiber length (and thus fascicle length, or Lf), and mean fCSA. Instead, mCSA changes in a pennate muscle during overload may be largely driven by increases in Lf (i.e., longitudinal growth) rather than mean fCSA changes. Alternatively, if overload appreciably increases mean fCSA values (i.e., radial growth) this could lead to increases in PA as well as mCSA changes without appreciable Lf changes. Jorgenson and colleagues developed this hypothesis to contend that muscle fiber splitting likely does not appreciably contribute to muscle hypertrophy in rodents during rapid muscle enlargement. However, this model may also explain why increases in mean fCSA do not proportionally translate to mCSA increases in humans during periods of RT. Therefore, this study aimed to examine if changes in mean fCSA, PA, and Lf collectively predicted changes in mCSA following a period of RT. Additionally, we analyzed the associations between changes in mCSA, fCSA, PA, and Lf.
METHODS
Participants
This study was a secondary analysis from a subset of participants from a study that was reviewed and approved by the Institutional Review Board at Auburn University (IRB approval #: 21–390 FB). The study conformed to the standards set by the latest revisions of the Declaration of Helsinki except for not being registered as a clinical trial. Thirteen untrained college-aged males (23±4 years, 82.1±17.6 kg, 25.4±5.2 kg/m2) completed the study. All participants were free from cardio-metabolic diseases or medical conditions that precluded the collection of muscle biopsies. Additionally, participants could not have recently engaged in RT within the last three years. Interested participants provided verbal and written consent to participate prior to the data collection procedures outlined below.
Experimental design
Testing sessions described below occurred a month after a familiarization period (PRE) and 72 hours following the last training bout (POST). Participants were instructed to report to the laboratory during the PRE and POST visits 6–12 hours fasted and well-hydrated. Before testing, participants submitted a urine sample (~5 mL) to assess urine specific gravity using a handheld refractometer (ATAGO; Bellevue, WA, USA). Values were <1.020 in all participants indicating sufficient hydration (American College of Sports et al., 2007). The tests described below were performed thereafter.
Ultrasonography.
Real-time B-mode ultrasonography (NextGen LOGIQe R8, GE Healthcare) utilizing a multi-frequency linear-array transducer (L4–12T, 4–12 MHz, GE Healthcare) was used to capture right leg mid-thigh vastus lateralis (VL) images in the transverse plane (or cross-sectional orientation) for measurement of whole VL mCSA. Mid-thigh scan and PRE biopsy location was determined by measuring the total distance from the greater trochanter to the lateral epicondyle of the femur, and marking halfway, then the total distance between inguinal crease and proximal patella and marking halfway. Finally, a final mark was made at the halfway point of these measurements. This final mark is where all PRE images of the VL were taken as well as the muscle biopsy (described below), while POST images were taken at the PRE biopsy scar to ensure consistency between scans. For reference, a visual of biopsy and image acquisition sites can be seen in Figure 1e in the results section.
Figure 1. Morphological adaptations to resistance training.
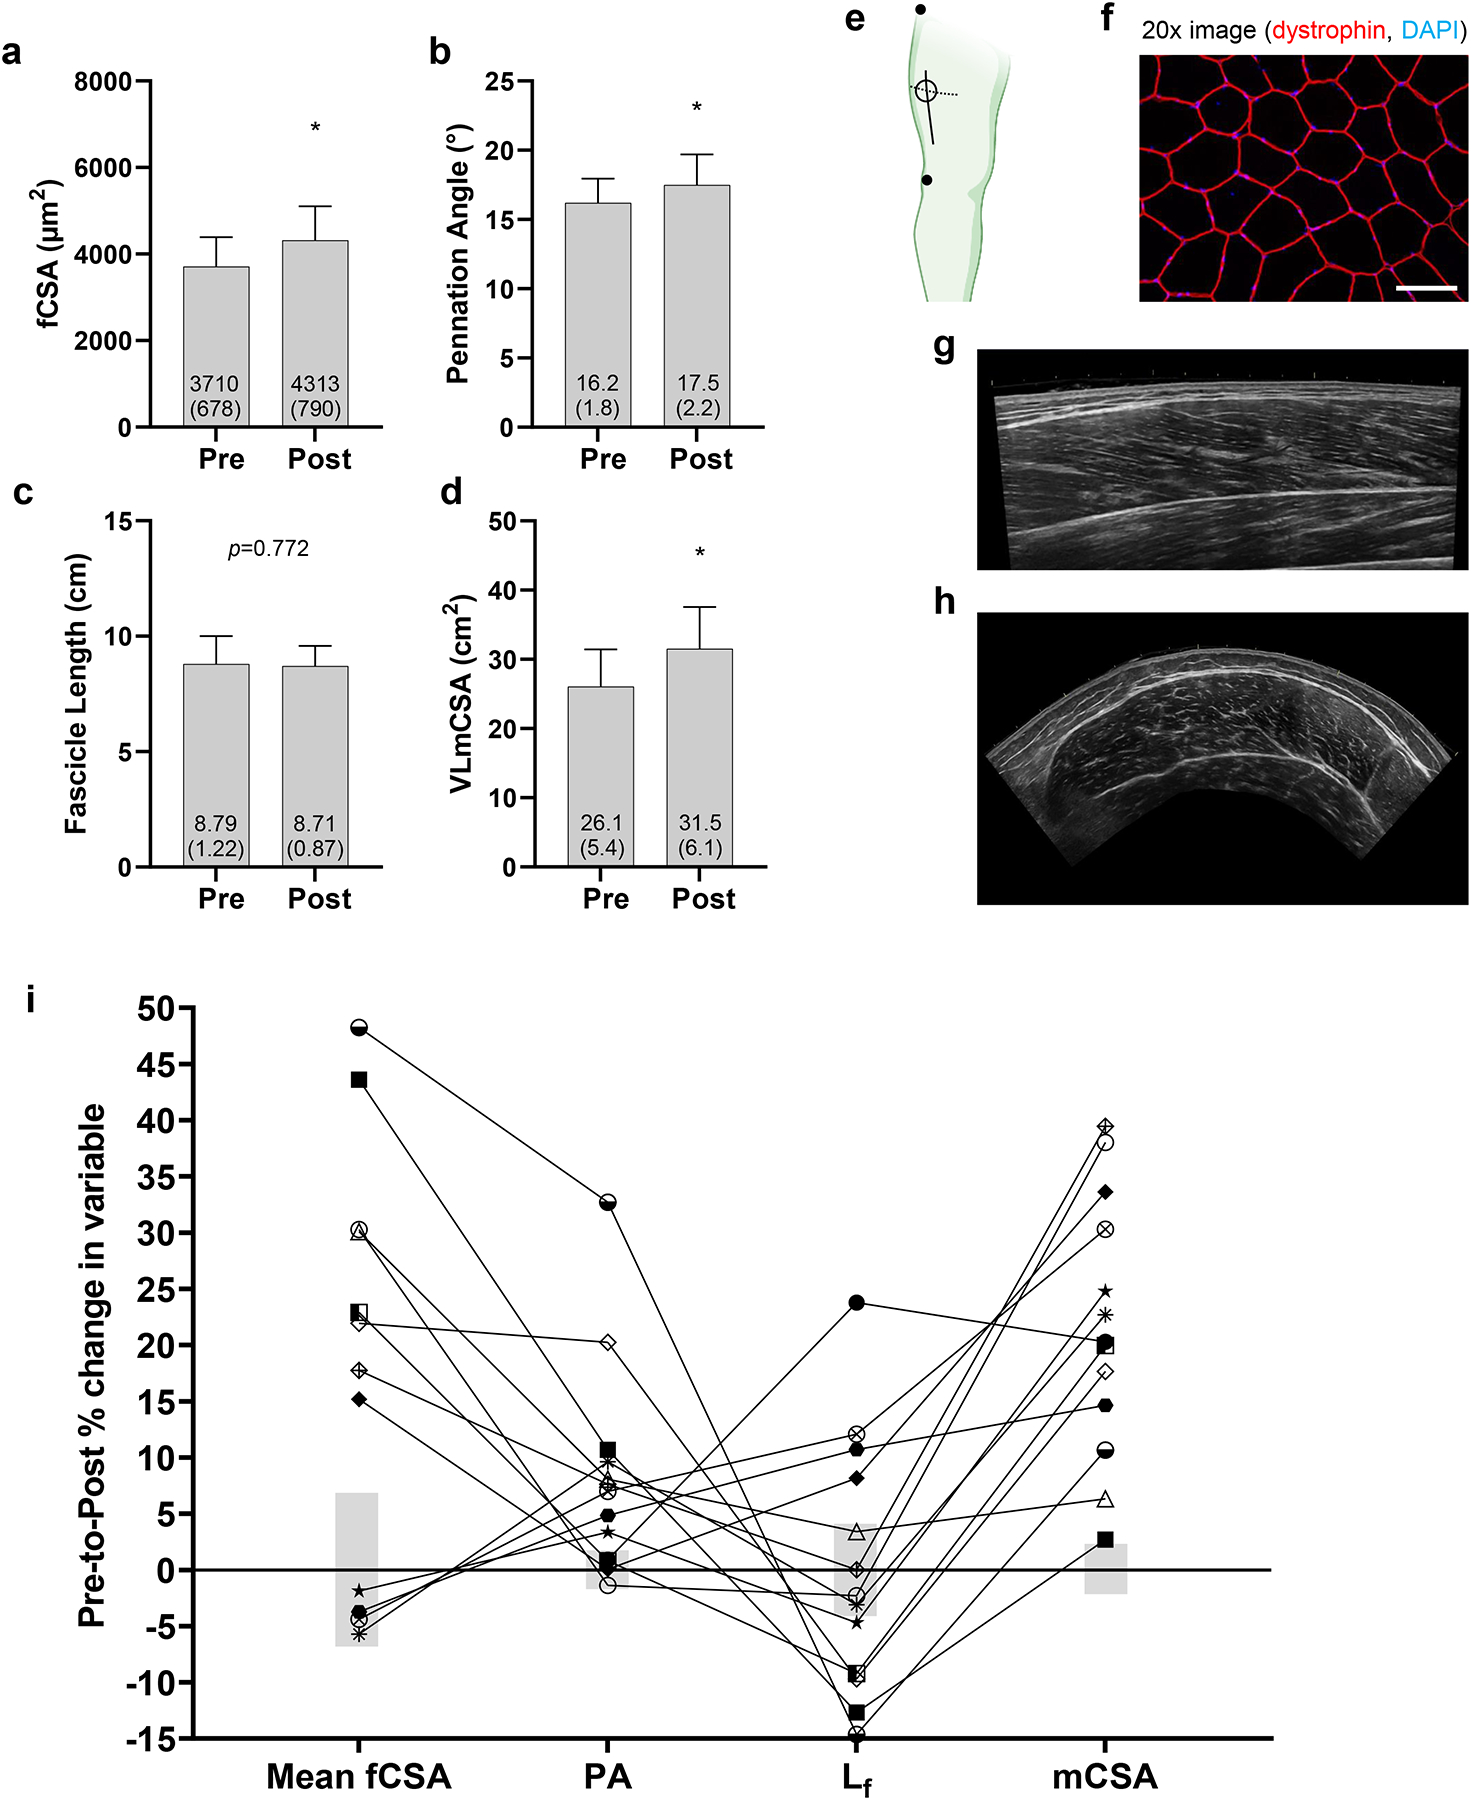
PRE and POST values for (a) mean fiber cross-sectional area (fCSA), (b) pennation angle (PA), (c) fascicle length (Lf), and (d) muscle cross-sectional area (mCSA). Data are presented as mean ± (standard deviation) values, and individual participant values are plotted as well. Panel e contains a schematic showing estimated locations where PRE biopsies were obtained (open circle), VL mCSA panoramic images were obtained (dashed line), and PA and Lf panoramic images were obtained; notably, the PRE biopsy scar was a landmark to obtain POST VL mCSA/PA/ Lf panoramic images. Not pictured in panel e is the POST biopsy site which was ~2 cm proximal to the PRE biopsy site. Panel f contains a representative 20x image for fCSA determination (white scale bar = 100 μm). Panel g contains a representative mid-thigh panoramic ultrasound image used for pennation angle and fascicle length assessments. Panel h contains a representative mid-thigh panoramic ultrasound image for VL mCSA assessments. Panel i contains individual response data for each participant where data points represent PRE-to-POST percentage changes and gray bars indicate the typical error (TE), which was expressed as the coefficient of variation (CV). Abbreviations: Lf, fascicle length determined by ultrasound; fCSA, fiber cross-sectional area determined by muscle biopsy and histology; mCSA, whole-muscle cross-sectional area. Other note: *, indicates statistical significance (p<0.05).
Prior to transverse image acquisition, a semi-rigid pad was placed around the thigh and secured with an adjustable strap. This was used as a guide to ensure probe movement occurred in a uniform transverse plane starting at the lateral aspect of the thigh moving medially until the rectus femoris was visualized. VL mCSA images were captured using the panoramic function of the device (LogicView, GE Healthcare, USA). All ultrasound settings were held constant across participants and laboratory visits (frequency: 10 MHz, gain: 50 dB, dynamic range: 75). Images were downloaded and analyzed using the freely available ImageJ software (National Institutes of Health, Bethesda, MD, USA). VL mCSA was calculated by manually tracing the border of the VL along the fascia border, using the polygon function, with care taken to exclude any connective tissue within the region of interest. Images, which only contained a participant code but did not indicate whether the scan was obtained at PRE or POST, were analyzed by the same investigator (JSG). Test-retest reliability for VL mCSA was calculated from 10 individuals that did not participate in the training intervention. Data from two scans that occurred within a 24-hour period in these 10 individuals yielded a typical error (TE) of 0.60 cm2 and coefficient of variation (CV) of 2.20%.
PA was assessed by first obtaining a panoramic image of the VL muscle in longitudinal view which was perpendicular to where VL mCSA assessments occurred. Thereafter, angles of 3–5 clearly demarcated fascicles were assessed using the angle tool function where these fascicles intersected the deep aponeuroses. A final average of these 3–5 measurements per image was used to produce the PA values presented herein. Lf was then determined on these same images by manually tracing an average of 3–5 fascicles per image from superficial to deep aponeuroses using the segmented line function to account for the natural curvature of the fascicles. Again, all images only contained a participant code but did not indicate whether the scan was obtained at PRE or POST, were analyzed by the same investigator (BAR). Test-retest reliability for PA and Lf were calculated from 11 individuals that did not participate in the training intervention. Data from two scans that occurred within a 24-hour period in these 11 individuals yielded a TE of 0.33° and 0.35 cm for PA and Lf, respectively, and CV of 1.70% and 4.10% for PA and Lf, respectively.
Muscle biopsies.
After ultrasound images were obtained, PRE skeletal muscle biopsies were collected from the right VL at the marked location from ultrasound imaging as described by our laboratory prior (Ruple et al., 2021; Sexton et al., 2021). The published methods of tissue procurement, processing, and preservation has been shown by our laboratory to produce muscle sections that exhibit excellent quality with no freeze fracturing. Notably, POST biopsies were obtained ~2 cm proximal of the PRE biopsy scar.
Immunohistochemistry for mean fCSA
Immunohistochemistry (IHC) for mean fCSA determination has been previously described by our laboratory (Ruple et al., 2021), with slight modifications. Briefly, OCT preserved samples were sectioned at a thickness of 10 μm using a cryotome (Leica Biosystems; Buffalo Grove, IL, USA) and adhered to positively charged histology slides. Slides were then stored at −80°C until batch processing occurred. During batch processing, slides were air-dried for 90 minutes prior to incubation in acetone chilled at −20°C for 5 minutes. Sections were then incubated with 3% H2O2 for 10 minutes and autofluorescence quenching reagent for one minute (TrueBlack; biotium, Fremont, CA, USA). Sections were then blocked for one hour with 5% goat serum and 2.5% horse serum diluted in phosphate-buffered saline (PBS). After blocking, sections were incubated overnight at 4°C with a primary antibody cocktail consisting of 1:20 Mandra (dystrophin) (Developmental Studies Hybridoma Bank; Iowa City, IA, USA) and 2.5% horse serum in PBS. The following day, sections were incubated for one hour with a secondary antibody cocktail consisting of 1:250 anti-mouse IgG1 AF594 (Thermo Fisher Scientific; Waltham, MA, USA; catalog #: A-21125) in PBS. Cover slips were applied using PBS + glycerol as mounting medium.
Following mounting, three digital images per section were immediately captured with a fluorescent microscope (Nikon Instruments, Melville, NY, USA) using a 20x objective. Standardized measurements of mean fCSA were performed using open-sourced software (MyoVision) (Wen et al., 2018). Twelve of 13 participants had fCSA analyzed at PRE and POST given that one participant had poor tissue quality for histological analysis at POST. Test-retest reliability for fCSA was previously determined in our laboratory by comparing two separate images from 26 participants resulting in TE of 470.75 μm2 and CV of 6.80%.
Three-repetition maximum (3RM) testing for training prescription
The 3RM strength testing for the leg press, bench press, and leg extension were used to estimate one repetition maximum (1RM) values according to methods provided by the National Strength and Conditioning Association (Haff et al., 2016). These strength testing sessions occurred 2–6 days following PRE testing described above.
Resistance training protocol
The training protocol consisted of twice weekly, full-body resistance training sessions, for a total of seven weeks. Each workout involved leg press, bench press, leg extension, cable pull-down, and leg curls. Participants performed sets of six repetitions of leg press and leg extension per workout, progressing from three sets of each exercise in the first week to five sets in the last week. The load increased from 70% to 95% of the initial estimated 1RM, which was assessed prior to the training period as described prior. Bench press, cable pull-down, and leg curl were prescribed three sets of 10 repetitions with two repetitions in reserve (RIR), which was gauged by participants as repetitions “left in the tank” prior to technical failure. If RIR was scored greater than 2 by the participant after a given set, then 4.5–9.1 kg (10–20 lbs) was added to lower body exercises or 2.3–4.5 kg (5–10 lbs) to upper body exercises.
Statistical Analyses
Statistical analyses were performed using SPSS (Version 25; IBM SPSS Statistics Software, Chicago, IL, USA). Normality testing was performed using Shapiro-Wilk’s test for all dependent variables. All variables were analyzed using dependent samples t-tests to monitor changes from PRE to POST. The reliability of the measurement was determined from the typical error (TE), which was expressed as the coefficient of variation (CV) of the measurement according to Hopkins (Hopkins, 2000). For the analysis of individual responses, a true change was considered when changes in a variable occurred above or below the CV. Multiple regression analysis was used to determine if the PRE-to-POST percentage changes in mean fCSA, PA, and Lf predicted changes in VL mCSA, and this was only performed on 12 participants given that one participant had poor tissue quality for histological analysis at POST as stated above. Finally, associations between percentage changes in all dependent variables were analyzed using Pearson correlations. Values between ±0.00–0.49 were considered weak, ±0.50–0.79 were noted as moderate, and values between ±0.80–0.99 were noted as strong (Zou et al., 2003). Where applicable, data are presented as mean ± standard deviation values, and statistical significance was established as p<0.05.
RESULTS
Vastus lateralis adaptations with resistance training
Figure 1 represents PRE and POST data for VL mean fCSA, PA, Lf, and VL mCSA. Mean fCSA increased from 3,710±678 μm2 to 4,313±791 μm2 with RT (p=0.013, Fig. 1a), and the number of fibers used for mean fCSA calculations were 119±37 fibers for PRE and 105±36 fibers for POST (p=0.090). Eight participants showed increases above the calculated CV. PA increased from 16.2±1.8° to 17.5±2.2° (p=0.007, Fig. 1b), and nine participants showed increases above the calculated CV. Lf did not statistically change from PRE (8.79±1.22 cm) to POST (8.71±0.87 cm; p=0.772, Fig. 1c); however, four participants showed increases above and five showed decreases below the calculated CV. Lastly, mCSA increased from 26.1±5.4 cm2 to 31.5±6.1 cm2 (p<0.001, Fig. 1d), and all 13 participants increased values beyond the calculated CV. Fig. 1e depicts where ultrasound and biopsy sites were, f/g/h show representative images used for analyses, and Fig. 1i shows individual responses in percentage changes for all obtained variables.
Changes in PA, Lf, and mean fCSA as predictors for changes in vastus lateralis mCSA with training
Results from multiple regression are presented in Table 1, and visually depicted in Figure 2. Multiple regression results (n=12) revealed that percentage changes in mean fCSA, Lf and PA are not predictors of percentage changes in VL mCSA (R2 = 0.282, Adjusted R2 =0.013, F3,8 = 1.050, p=0.422). The results of the multivariate analyses are shown in Table 1.
Table 1.
Multiple regression analysis of predictors of changes in muscle cross-sectional area.
| Variables | β | Standard error | 95% confidence interval | |t| | p | |
|---|---|---|---|---|---|---|
| Lower limit | Upper limit | |||||
| Intercept | 27.93 | 5.97 | 14.16 | 41.70 | 4.67 | 0.001 |
| Change in PA (%) | −0.45 | 0.45 | −1.49 | 0.59 | 0.99 | 0.350 |
| Change in Lf (%) | 0.12 | 0.56 | −1.18 | 1.42 | 0.21 | 0.834 |
| Change in fCSA (%) | −0.11 | 0.25 | 0.70 | 0.47 | 0.45 | 0.662 |
fCSA, fiber cross-sectional area; Lf, fascicle length; PA, pennation angle.
Figure 2. Observed versus predicted change in VL mCSA with a regression model.

These data represent the multiple regression model used to predict VL mCSA changes to resistance training. As noted in the results, the model did not significantly predict mCSA changes when using changes in mean fiber cross-sectional area, fascicle length, or pennation angle.
As an exploratory post hoc analysis, we also performed multiple regression to determine if percentage changes in mean fCSA and PA were significant predictors of percentage changes in VL mCSA (n=13 participants). Regression results indicated a similar nonsignificant outcome (R2 = 0.278, Adjusted R2 =0.118, F3,8 = 1.735, p=0.230) (data not shown).
PRE-to-POST change score correlations between metrics
There was a moderate negative correlation between changes in PA and Lf (r=−0.548, p=0.052) as well as fCSA and Lf (r=−0.649, p=0.022). All other associations were weak and non-significant (see Table 2).
Table 2.
Correlations between percentage changes in outcome variables.
| Variable | PA | Lf | Mean fCSA | VL mCSA | |
|---|---|---|---|---|---|
| PA | Pearson r | ---- | ---- | ---- | ---- |
| Significance | |||||
| Lf | Pearson r | −0.548 | ---- | ---- | ---- |
| Significance | 0.052 | ||||
| Mean fCSA | Pearson r | 0.450 | −0.649 | ---- | ---- |
| Significance | 0.142 | 0.022 | |||
| VL mCSA | Pearson r | −0.466 | 0.286 | −0.401 | ---- |
| Significance | 0.109 | 0.343 | 0.197 |
These data depict correlations between percentage change values from pre to post training. Data contain 13 participants per outcome variable except mean fCSA data, which contains 12 participants. Abbreviations: PA, pennation angle determined by ultrasound; Lf, fascicle length determined by ultrasound; fCSA, fiber cross sectional area determined by muscle biopsy and histology; mCSA, whole-muscle cross-sectional area determined by ultrasound.
DISCUSSION
This study is the first to examine if changes in mean fCSA, PA, and Lf collectively predicted mCSA changes following a period of RT, and multiple regression indicated that such a relationship was not evident. While increases in mean fCSA, PA, and VL mCSA were observed, we contend that inter-individual responses for each variable as well as technique limitations make it difficult to determine which morphological adaptations predominantly drive VL muscle hypertrophy. However, our sample size is significantly limited, and this warrants continued research in this area.
The aforementioned review by Jorgenson et al. (Jorgenson et al., 2020) largely inspired our analysis given that the authors provided excellent commentary as to how inter-dependent alterations in mean fCSA, Lf, and PA during overload may act to coordinate increases in whole muscle CSA. These authors posited two hypothetical scenarios when describing how surgical ablation in mice alters muscle morphology of the intact pennate plantaris muscle. The first scenario was:
“…if the 30% increase in [whole muscle] CSA was due exclusively to an increase in radial growth of the fascicles, then the fascicle diameter would have to increase by 14%, and this would result in a concomitant 15% increase in pennation angle.”
The second scenario was:
“If the 30% increase in [whole muscle] CSA was purely due to longitudinal growth of the fascicles, then fascicle length would have to increase by 11%, and the pennation angle would remain unaltered.”
Interestingly, participants exhibited significant increases in mean fCSA (+18%) and PA (+8%), and a positive (but not significant) association existed between percentage changes in mean fCSA and PA (r = 0.450, p = 0.142). While this somewhat supports the contention by Jorgenson and colleagues suggesting that fascicle diameter (thus, mean fCSA increases) may influence PA outcomes during periods of resistance training, the weak and non-significant correlation confounds interpretation and larger sample sizes are needed to further investigate this relationship. However, Lf was not altered with the training herein despite a significant increase in VL mCSA (+22%). These latter findings contrast a report from Ema et al. (Ema et al., 2016) who compiled data from 38 studies to show that a significant positive relationship existed between the exercise training-induced increases in muscle size and Lf. These authors also outlined ~20 reports in the literature showing that Lf increases occurred during periods of RT. Indeed, some training studies have reported results like those herein where average increases in fCSA, PA, and mCSA occurred with no change in average Lf values (Kawakami et al., 1995; Erskine et al., 2010). However, recent reports have indicated that training-induced increases in Lf may be more evident with eccentric-based versus concentric-only or conventional RT (Reeves et al., 2009; Franchi et al., 2014). Likewise, the direction of mechanical strain employed during training is likely a key factor in dictating Lf changes (Franchi et al., 2015; Franchi et al., 2018b). Thus, given that eccentric training or focused “mechanical attention” on the VL was not emphasized herein likely explains why Lf (on average) did not change.
Perhaps the most intriguing finding of the current study is that individual modes of tissue-level VL hypertrophy may have occurred between individuals. For instance, based on the CV calculations for each technique, two participants exhibited increases in Lf with no changes in mean fCSA, whereas four participants showed mean fCSA increases exceeding 20% with Lf decreases exceeding 9%. All six of these participants exhibited increases in VL mCSA. Although reasons for this phenomenon are speculative, it may have occurred due to slight differences in range-of-motion implemented by participants; this being a variable which unfortunately was not accounted for beyond instructing participants to execute full range-of-motion technique for all exercises. As well, this inter-individualized hypertrophy may be due to physiological factors and certainly warrants further research consideration.
The lack of a significant positive association between changes in fCSA and changes in mCSA also warrants further discussion. First, the size and pennation of the VL may be a large reason why disagreement existed between mean fCSA and mCSA changes. West et al. (West et al., 2010) reported that changes in mean fCSA and biceps brachii mCSA (derived via MRI) showed good agreement following resistance training (~10% increase in both metrics). This finding was perhaps due to the biceps brachii being a smaller muscle than the vastus lateralis as cadaver estimates have shown that the VL contains ~500,000–600,000 muscle fibers while the biceps brachii contains ~200,000–300,000 muscle fibers (Lexell et al., 1988; Klein et al., 2003). Given that ~100–150 muscle fibers are sampled for mean fCSA analysis, it stands to reason that the mean fCSA metric may be more representative of fiber characteristics in muscles with less fibers. Also notable, the biceps brachii is a fusiform muscle. Hence, increases in mean fCSA and tissue-level mCSA during periods of overload seemingly have a better chance of proportionally increasing without the confounding influence of PA changes. The second issue when trying to reconcile why VL mean fCSA changes do not proportionally translate to tissue-level CSA changes likely involves the relatively poorer reliability of fCSA measurements. In support of this contention, our reliability data reported in the methods section indicates a relatively larger CV exists for mean fCSA determination relative to the other methods used herein. Horwath et al. (Horwath et al., 2021) similarly demonstrated this point when examining myofiber size and type distribution from muscle samples collected from multiple sites along the length of the VL. These authors reported that type I fCSA from two random biopsy locations varied from 18–83%, and type II fCSA varied from 26–95%. Hence, while several studies have used fCSA as an indicator of skeletal muscle hypertrophy (Hikida et al., 2000; Kadi et al., 2004; Kim et al., 2005; Petrella et al., 2008; Snijders et al., 2016; Haun et al., 2019b; Angleri et al., 2022), the relatively poorer reliability of this method should be taken into consideration when attempting to compare mean fCSA data to other macro-measurements of the muscle hypertrophy. In relation to VL mCSA versus mean fCSA changes it is also worth mentioning the moderately negative, albeit nonsignificant, correlation that was found to exist. In a separate group of participants that partook in 10 weeks of resistance training we observed a similar outcome where percentage changes in VL mCSA (determined by magnetic resonance imaging) showed a moderate negative association with percentage changes in mean fCSA (r = −0.569, p=0.054) (Ruple et al., 2022). Further, in each respective study two of the participants that exhibited the largest increases in mean fCSA exhibited some of the lowest increases in VL mCSA. Although these could be random negative associations, there is the possibility that these associations could be physiologically relevant, and this warrants further research consideration.
An unexpected finding was the significant negative association between percentage changes between mean fCSA and Lf. As well, the individual respondent data in Fig. 1i illustrate that four participants who exhibited mean fCSA increases outside of the measurement error presented decreases in Lf, whereas two participants who did not exhibit mean fCSA increases presented increases in Lf. Only one participant presented concomitant increases in both metrics. Collectively, these data may provide unique insight into a general tissue morphology adaptation that occurs at the onset of conventional resistance training where Lf must decrease to accommodate radial fiber growth in those who experience mean fCSA increases. However, given that Lf values have been shown to not differ between resistance-trained individuals and non-trained individuals (Fukutani & Kurihara, 2015), this may be a transient adaptation. Notwithstanding, this hypothesis is speculative and requires further interrogation given that the training paradigm herein was only seven weeks in duration, there were a limited number of participants, and time course sampling (e.g., weekly biopsies and ultrasound images) was not performed.
An inexplicable finding was the degree of hypertrophy exhibited by participants in the current study. After only 14 training sessions, VL mCSA increased ~22% and mean fCSA increased on average by ~16% with four individuals showing ~30–50% increase in this latter metric. To be certain, and relative to other resistance training studies in previously untrained males y our laboratory and others (Franchi et al., 2018a; Ruple et al., 2022), this level of skeletal muscle hypertrophy is robust. However, it should be noted that training was supervised for each participant and progressive overload was strictly implemented. Moreover, while training volume data was not presented herein, participants (on average) were performing week 7 leg press training volumes that were ~160% of week 1 volume values. Similarly, week 7 leg extension training volumes that were ~170% of week 1 volume values. Hence, given these training data as well as the care taken to ensure ultrasound images were acquired at the same location at PRE and POST as describe in the Methods section, we contend that the degree of observed hypertrophy was likely due to the rapid progression of training volume in these untrained participants. The only other notable explanation involves the reported limitations to panoramic ultrasound assessments. To this end, some data suggests panoramic ultrasound underestimates VL mCSA (Ruple et al., 2022), and other data suggest that panoramic ultrasound overestimates this metric (Ahtiainen et al., 2010; Scott et al., 2012). Thus, the inherent error in the technique may be partially responsible as to why VL mCSA increases were robust and this requires further interrogation.
Limitations
Beyond the various limitations mentioned throughout, there are other limitations to the current study. First, the data presented herein were all taken from a single location (i.e., mid-thigh). More insight may have been provided if multiple images and samples were obtained along the length of the VL. Second, for PA, Lf, and fCSA, the inability to analyze the same fascicle or fiber PRE to POST is a shortcoming which likely introduces error into these techniques. Again, we want to underscore the limited sample size (i.e., 12 or 13 participants depending on the outcome) being an unresolved limitation. When performing studies using multiple regression it has been suggested that the sample size of participants should be 50 + (8 × # of predictors) (Green, 1991), which would be n=74 participants for the current analysis. Given that 12 participants were used for our regression analysis our sample size is significantly limited, and similar investigations are needed to continue to provide insight in this area of muscle physiology. What should also be noted is that CV calculations were performed from past studies performed by our laboratory. Regarding mean fCSA assessments, a different type of software was used with the 26 sections that were analyzed in duplicate; specifically, CellProfiler was used to obtain fCSA data for CV calculations and MyoVision was used to analyze the PRE and POST sections in the current study (Haun et al., 2019b). We have no reason to believe that the former and current analytical pipelines would yield substantially different outcomes. However, the reader should be aware of this aspect of the study.
Conclusions
This study continues to outline how muscle morphology is altered in humans following resistance training. Our findings show that the changes in fCSA, Lf and PA are not predictors of changes in mCSA. These data reiterate the notion that discrepancies between methodologies used to track muscle morphological changes to overload exist.
Supplementary Material
NEW FINDINGS.
In pennate muscle, changes in myofiber cross-sectional area (fCSA), fascicle length (Lf), and pennation angle (PA) with exercise training likely interact to alter whole-muscle cross-sectional area (mCSA). Herein, we are the first to use multiple regression to show that changes in vastus lateralis (VL) mean fCSA, Lf and PA following a period of resistance training did not collectively predict changes in mCSA. Thus, the n-size is limited herein, it remains difficult to generalize the morphological adaptations that predominantly drive tissue-level VL muscle hypertrophy. We also present compelling evidence suggesting the mode of hypertrophy differs between individuals, which requires further interrogation.
Acknowledgments
The authors would like to thank the participants for participating in the study. The authors would also like to thank Dr. Troy Hornberger (University of Wisconsin-Madison) for providing constructive feedback during the writing of this manuscript.
Funding
Reagents for histology were provided from the laboratory of M.D.R. Participant compensation costs were provided by a doctoral student grant awarded by the National Strength and Conditioning Foundation to P.H.C. Mesquita. M.C. McIntosh was fully supported through a T32 NIH grant (T32GM141739). C. A. Libardi was supported by the The São Paulo Research Foundation (# 2020/13613-4) and National Council for Scientific and Technological Development (# 311387/2021-7).
Footnotes
Competing interests
None of the authors have financial or other conflicts of interest to report regarding these data.
Data availability statement
The data that support the findings of this study are available from the corresponding author upon reasonable request.
REFERENCES
- Aagaard P, Andersen JL, Dyhre-Poulsen P, Leffers AM, Wagner A, Magnusson SP, Halkjaer-Kristensen J & Simonsen EB (2001). A mechanism for increased contractile strength of human pennate muscle in response to strength training: changes in muscle architecture. J Physiol 534, 613–623. [DOI] [PMC free article] [PubMed] [Google Scholar]
- Ahtiainen JP, Hoffren M, Hulmi JJ, Pietikainen M, Mero AA, Avela J & Hakkinen K (2010). Panoramic ultrasonography is a valid method to measure changes in skeletal muscle cross-sectional area. Eur J Appl Physiol 108, 273–279. [DOI] [PubMed] [Google Scholar]
- American College of Sports M, Sawka MN, Burke LM, Eichner ER, Maughan RJ, Montain SJ & Stachenfeld NS (2007). American College of Sports Medicine position stand. Exercise and fluid replacement. Med Sci Sports Exerc 39, 377–390. [DOI] [PubMed] [Google Scholar]
- Angleri V, Damas F, Phillips SM, Selistre-de-Araujo HS, Cornachione AS, Stotzer US, Santanielo N, Soligon SD, Costa LAR, Lixandrao ME, Conceicao MS, Vechin FC, Ugrinowitsch C & Libardi CA (2022). Resistance training variable manipulations are less relevant than intrinsic biology in affecting muscle fiber hypertrophy. Scand J Med Sci Sports 32, 821–832. [DOI] [PubMed] [Google Scholar]
- Baar K, Nader G & Bodine S (2006). Resistance exercise, muscle loading/unloading and the control of muscle mass. Essays Biochem 42, 61–74. [DOI] [PubMed] [Google Scholar]
- Ema R, Akagi R, Wakahara T & Kawakami Y (2016). Training-induced changes in architecture of human skeletal muscles: Current evidence and unresolved issues. J Phys Fitness Sports Med 5, 37–46. [Google Scholar]
- Erskine RM, Jones DA, Williams AG, Stewart CE & Degens H (2010). Inter-individual variability in the adaptation of human muscle specific tension to progressive resistance training. Eur J Appl Physiol 110, 1117–1125. [DOI] [PubMed] [Google Scholar]
- Esmarck B, Andersen JL, Olsen S, Richter EA, Mizuno M & Kjaer M (2001). Timing of postexercise protein intake is important for muscle hypertrophy with resistance training in elderly humans. J Physiol 535, 301–311. [DOI] [PMC free article] [PubMed] [Google Scholar]
- Franchi MV, Atherton PJ, Reeves ND, Fluck M, Williams J, Mitchell WK, Selby A, Beltran Valls RM & Narici MV (2014). Architectural, functional and molecular responses to concentric and eccentric loading in human skeletal muscle. Acta Physiol (Oxf) 210, 642–654. [DOI] [PubMed] [Google Scholar]
- Franchi MV, Longo S, Mallinson J, Quinlan JI, Taylor T, Greenhaff PL & Narici MV (2018a). Muscle thickness correlates to muscle cross-sectional area in the assessment of strength training-induced hypertrophy. Scand J Med Sci Sports 28, 846–853. [DOI] [PMC free article] [PubMed] [Google Scholar]
- Franchi MV, Ruoss S, Valdivieso P, Mitchell KW, Smith K, Atherton PJ, Narici MV & Fluck M (2018b). Regional regulation of focal adhesion kinase after concentric and eccentric loading is related to remodelling of human skeletal muscle. Acta Physiol (Oxf) 223, e13056. [DOI] [PubMed] [Google Scholar]
- Franchi MV, Wilkinson DJ, Quinlan JI, Mitchell WK, Lund JN, Williams JP, Reeves ND, Smith K, Atherton PJ & Narici MV (2015). Early structural remodeling and deuterium oxide-derived protein metabolic responses to eccentric and concentric loading in human skeletal muscle. Physiol Rep 3. [DOI] [PMC free article] [PubMed] [Google Scholar]
- Fukutani A & Kurihara T (2015). Comparison of the muscle fascicle length between resistance-trained and untrained individuals: cross-sectional observation. Springerplus 4, 341. [DOI] [PMC free article] [PubMed] [Google Scholar]
- Garfinkel S & Cafarelli E (1992). Relative changes in maximal force, EMG, and muscle cross-sectional area after isometric training. Med Sci Sports Exerc 24, 1220–1227. [PubMed] [Google Scholar]
- Goldberg AL, Etlinger JD, Goldspink DF & Jablecki C (1975). Mechanism of work-induced hypertrophy of skeletal muscle. Med Sci Sports 7, 185–198. [PubMed] [Google Scholar]
- Goldspink G (1964). The Combined Effects of Exercise and Reduced Food Intake on Skeletal Muscle Fibers. J Cell Comp Physiol 63, 209–216. [DOI] [PubMed] [Google Scholar]
- Green SB (1991). How Many Subjects Does It Take To Do A Regression Analysis. Multivariate Behav Res 26, 499–510. [DOI] [PubMed] [Google Scholar]
- Haff G, Triplett NT, National S & Conditioning A (2016). Essentials of strength training and conditioning. [Google Scholar]
- Haun CT, Vann CG, Mobley CB, Osburn SC, Mumford PW, Roberson PA, Romero MA, Fox CD, Parry HA, Kavazis AN, Moon JR, Young KC & Roberts MD (2019a). Pre-training Skeletal Muscle Fiber Size and Predominant Fiber Type Best Predict Hypertrophic Responses to 6 Weeks of Resistance Training in Previously Trained Young Men. Front Physiol 10, 297. [DOI] [PMC free article] [PubMed] [Google Scholar]
- Haun CT, Vann CG, Osburn SC, Mumford PW, Roberson PA, Romero MA, Fox CD, Johnson CA, Parry HA, Kavazis AN, Moon JR, Badisa VLD, Mwashote BM, Ibeanusi V, Young KC & Roberts MD (2019b). Muscle fiber hypertrophy in response to 6 weeks of high-volume resistance training in trained young men is largely attributed to sarcoplasmic hypertrophy. PLoS One 14, e0215267. [DOI] [PMC free article] [PubMed] [Google Scholar]
- Hikida RS, Staron RS, Hagerman FC, Walsh S, Kaiser E, Shell S & Hervey S (2000). Effects of high-intensity resistance training on untrained older men. II. Muscle fiber characteristics and nucleo-cytoplasmic relationships. J Gerontol A Biol Sci Med Sci 55, B347–354. [DOI] [PubMed] [Google Scholar]
- Hopkins WG (2000). Measures of reliability in sports medicine and science. Sports Med 30, 1–15. [DOI] [PubMed] [Google Scholar]
- Horwath O, Envall H, Roja J, Emanuelsson EB, Sanz G, Ekblom B, Apro W & Moberg M (2021). Variability in vastus lateralis fiber type distribution, fiber size, and myonuclear content along and between the legs. J Appl Physiol (1985) 131, 158–173. [DOI] [PubMed] [Google Scholar]
- Jorgenson KW, Phillips SM & Hornberger TA (2020). Identifying the Structural Adaptations that Drive the Mechanical Load-Induced Growth of Skeletal Muscle: A Scoping Review. Cells 9. [DOI] [PMC free article] [PubMed] [Google Scholar]
- Kadi F, Schjerling P, Andersen LL, Charifi N, Madsen JL, Christensen LR & Andersen JL (2004). The effects of heavy resistance training and detraining on satellite cells in human skeletal muscles. J Physiol 558, 1005–1012. [DOI] [PMC free article] [PubMed] [Google Scholar]
- Kawakami Y, Abe T, Kuno SY & Fukunaga T (1995). Training-induced changes in muscle architecture and specific tension. Eur J Appl Physiol Occup Physiol 72, 37–43. [DOI] [PubMed] [Google Scholar]
- Kim PL, Staron RS & Phillips SM (2005). Fasted-state skeletal muscle protein synthesis after resistance exercise is altered with training. J Physiol 568, 283–290. [DOI] [PMC free article] [PubMed] [Google Scholar]
- Klein CS, Marsh GD, Petrella RJ & Rice CL (2003). Muscle fiber number in the biceps brachii muscle of young and old men. Muscle Nerve 28, 62–68. [DOI] [PubMed] [Google Scholar]
- Lexell J, Taylor CC & Sjostrom M (1988). What is the cause of the ageing atrophy? Total number, size and proportion of different fiber types studied in whole vastus lateralis muscle from 15- to 83-year-old men. J Neurol Sci 84, 275–294. [DOI] [PubMed] [Google Scholar]
- Morpurgo B (1897). Eine experimentelle Studie. Archiv für pathologische Anatomie und Physiologie und für klinische Medicin 150, 522–554. [Google Scholar]
- Petrella JK, Kim JS, Mayhew DL, Cross JM & Bamman MM (2008). Potent myofiber hypertrophy during resistance training in humans is associated with satellite cell-mediated myonuclear addition: a cluster analysis. J Appl Physiol (1985) 104, 1736–1742. [DOI] [PubMed] [Google Scholar]
- Phillips SM (2014). A brief review of critical processes in exercise-induced muscular hypertrophy. Sports Med 44 Suppl 1, S71–77. [DOI] [PMC free article] [PubMed] [Google Scholar]
- Reeves ND, Maganaris CN, Longo S & Narici MV (2009). Differential adaptations to eccentric versus conventional resistance training in older humans. Exp Physiol 94, 825–833. [DOI] [PubMed] [Google Scholar]
- Roberts MD, Mobley CB, Vann CG, Haun CT, Schoenfeld BJ, Young KC & Kavazis AN (2020). Synergist ablation-induced hypertrophy occurs more rapidly in the plantaris than soleus muscle in rats due to different molecular mechanisms. Am J Physiol Regul Integr Comp Physiol 318, R360–R368. [DOI] [PubMed] [Google Scholar]
- Ruple BA, Godwin JS, Mesquita PHC, Osburn SC, Sexton CL, Smith MA, Ogletree JC, Goodlett MD, Edison JL, Ferrando AA, Fruge AD, Kavazis AN, Young KC & Roberts MD (2021). Myofibril and Mitochondrial Area Changes in Type I and II Fibers Following 10 Weeks of Resistance Training in Previously Untrained Men. Front Physiol 12, 728683. [DOI] [PMC free article] [PubMed] [Google Scholar]
- Ruple BA, Smith MA, Osburn SC, Sexton CL, Godwin JS, Edison JL, Poole CN, Stock MS, Fruge AD, Young KC & Roberts MD (2022). Comparisons between skeletal muscle imaging techniques and histology in tracking midthigh hypertrophic adaptations following 10 wk of resistance training. J Appl Physiol (1985) 133, 416–425. [DOI] [PubMed] [Google Scholar]
- Scott JM, Martin DS, Ploutz-Snyder R, Caine T, Matz T, Arzeno NM, Buxton R & Ploutz-Snyder L (2012). Reliability and validity of panoramic ultrasound for muscle quantification. Ultrasound Med Biol 38, 1656–1661. [DOI] [PubMed] [Google Scholar]
- Sexton CL, Smith MA, Smith KS, Osburn SC, Godwin JS, Ruple BA, Hendricks AM, Mobley CB, Goodlett MD, Fruge AD, Young KC & Roberts MD (2021). Effects of Peanut Protein Supplementation on Resistance Training Adaptations in Younger Adults. Nutrients 13. [DOI] [PMC free article] [PubMed] [Google Scholar]
- Snijders T, Smeets JS, van Kranenburg J, Kies AK, van Loon LJ & Verdijk LB (2016). Changes in myonuclear domain size do not precede muscle hypertrophy during prolonged resistance-type exercise training. Acta Physiol (Oxf) 216, 231–239. [DOI] [PubMed] [Google Scholar]
- Staron RS, Malicky ES, Leonardi MJ, Falkel JE, Hagerman FC & Dudley GA (1990). Muscle hypertrophy and fast fiber type conversions in heavy resistance-trained women. Eur J Appl Physiol Occup Physiol 60, 71–79. [DOI] [PubMed] [Google Scholar]
- Stec MJ, Kelly NA, Many GM, Windham ST, Tuggle SC & Bamman MM (2016). Ribosome biogenesis may augment resistance training-induced myofiber hypertrophy and is required for myotube growth in vitro. Am J Physiol Endocrinol Metab 310, E652–E661. [DOI] [PMC free article] [PubMed] [Google Scholar]
- Verney J, Kadi F, Charifi N, Feasson L, Saafi MA, Castells J, Piehl-Aulin K & Denis C (2008). Effects of combined lower body endurance and upper body resistance training on the satellite cell pool in elderly subjects. Muscle Nerve 38, 1147–1154. [DOI] [PubMed] [Google Scholar]
- Wen Y, Murach KA, Vechetti IJ Jr., Fry CS, Vickery C, Peterson CA, McCarthy JJ & Campbell KS (2018). MyoVision: software for automated high-content analysis of skeletal muscle immunohistochemistry. J Appl Physiol (1985) 124, 40–51. [DOI] [PMC free article] [PubMed] [Google Scholar]
- West DW, Burd NA, Tang JE, Moore DR, Staples AW, Holwerda AM, Baker SK & Phillips SM (2010). Elevations in ostensibly anabolic hormones with resistance exercise enhance neither training-induced muscle hypertrophy nor strength of the elbow flexors. J Appl Physiol (1985) 108, 60–67. [DOI] [PMC free article] [PubMed] [Google Scholar]
- Zou KH, Tuncali K & Silverman SG (2003). Correlation and simple linear regression. Radiology 227, 617–622. [DOI] [PubMed] [Google Scholar]
Associated Data
This section collects any data citations, data availability statements, or supplementary materials included in this article.
Supplementary Materials
Data Availability Statement
The data that support the findings of this study are available from the corresponding author upon reasonable request.