

Summary
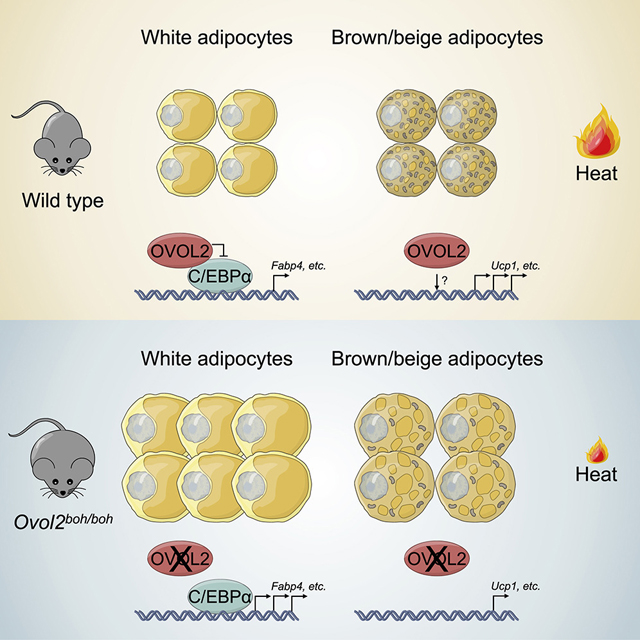
Using random germline mutagenesis in mice, we identified a viable hypomorphic allele (boh) of the transcription factor encoding gene Ovol2 that resulted in obesity which initially developed with normal food intake and physical activity but decreased energy expenditure. Fat weight was dramatically increased while lean weight was reduced in 12-week-old boh homozygous mice, culminating by 24 weeks in massive obesity, hepatosteatosis, insulin resistance, and diabetes. The Ovol2boh/boh genotype augmented obesity in Lepob/ob mice and pair-feeding failed to normalize obesity in Ovol2boh/boh mice. OVOL2 deficient mice were extremely cold intolerant. OVOL2 is essential for brown/beige adipose tissue mediated thermogenesis. In white adipose tissues, OVOL2 limited adipogenesis by blocking C/EBPα engagement of its transcriptional targets. Overexpression of OVOL2 in adipocytes of mice fed a high fat diet reduced total body and liver fat and improved insulin sensitivity. Our data reveal OVOL2 plays dual functions in thermogenesis and adipogenesis to maintain energy balance.
Keywords: Obesity, Thermogenesis, Adipogenesis, OVOL2, UCP1, C/EBPα
eTOC blurb
Using a forward genetic screen, Zhang et al. identified a new mouse obesity syndrome caused by a viable hypomorphic mutation in the transcription factor encoding gene Ovol2. They discovered that OVOL2 plays dual roles in promoting brown/beige thermogenesis and inhibiting white adipocyte differentiation to maintain energy balance.
Graphical Abstract
Introduction
In mammals, adipose tissue plays a key role in the regulation of whole body metabolism, responding to energetic and nutritional cues by storing or expending energy to support most physiological processes. At least three adipocyte types store triglycerides within intracellular lipid droplets. The main function of unilocular white adipocytes is as an energy reservoir, to be drawn upon through mobilization of free fatty acids and ketone bodies during periods of need. In contrast, brown and beige adipocytes are specialized for heat production mediated by the mitochondrial uncoupling protein UCP1 and powered by the proton gradient across the mitochondrial membrane, in response to cold or feeding (Chouchani et al., 2019). Adipocytes differentiate from mesenchymal precursors, which diverge to produce distinct progenitor populations: Myf5+ progenitors that give rise to brown adipocytes and muscle cells, and Myf5− progenitors that mainly give rise to white and beige adipocytes (Kajimura et al., 2009; Lepper and Fan, 2010; Sanchez-Gurmaches et al., 2012; Seale et al., 2008). This differentiation process occurs at a basal level, and increases during periods of nutritional abundance, as does adipocyte size (Gray and Vidal-Puig, 2007). Although many transcriptional regulators of white, brown, and beige adipocyte differentiation are known, including PPARγ, C/EBP family proteins, KLFs, CREB, Krox20, PRDM16, and ZFP423 (Farmer, 2006; Ghaben and Scherer, 2019; Rosen and MacDougald, 2006; Shapira and Seale, 2019), those that coordinate or distinguish white versus brown adipocyte differentiation are less well understood.
Here we describe a protein with dramatic and non-redundant functions in energy storage identified from a large-scale forward genetic screening in mice. This protein, Ovo like zinc finger 2 (OVOL2), is a member of the Ovo family of zinc finger transcription factors and is highly conserved in invertebrates and vertebrates, including mammals (Kumar et al., 2012). OVOL2 was first cloned as a murine homolog of Drosophila ovo, which is highly expressed in the testis (Masu et al., 1998). Later studies revealed that Ovol2 is involved in neural development (Mackay et al., 2006), vascular angiogenesis (Unezaki et al., 2007) and inhibition of epithelial-mesenchymal transition (EMT) in normal tissue (Lee et al., 2014; Watanabe et al., 2014) and tumors (Bai et al., 2018; Song and Faber, 2018; Wang et al., 2017; Wu et al., 2017). By creating a viable hypomorphic allele of Ovol2 in mice, we determined that OVOL2 restricts white adipocyte differentiation and is necessary for brown adipogenesis and thermogenesis.
Results
The boh phenotype
A phenotype observed among third-generation (G3) C57BL/6J mice heterozygous or homozygous for mutations induced by N-ethyl-N-nitrosourea (ENU), termed boh (Figure 1A), was characterized by increased body weight first detected at 10 weeks of age (Figure 1B) and approximately 20% increased at 12 weeks of age (Figure 1C). Heterozygous and homozygous boh mice were born at expected Mendelian frequencies and survived into adulthood. Magnetic resonance spectroscopy (MRS) showed that boh/boh mice had an extremely high fat weight and low lean weight; indeed, higher than the comparatively small increase in total body weight at this age (Figures 1C–1E) would suggest. Approximately 556% increase in fat weight (Figure 1D) was accompanied by a 20% reduction in lean weight compared to wild type (WT) littermates (Figure 1E). Necropsy revealed that adipose tissue beds of boh/boh mice were increased in size relative to those in WT littermates, including interscapular brown adipose tissue (iBAT), epididymal white adipose tissue (eWAT) and inguinal white adipose tissue (iWAT) (Figures 1F and S1A–S1C). An enlargement of both iBAT and the outside covering WAT was associated with a “hump” and a hairless region on the backs of boh/boh mice (Figures 1A and 1F). Hematoxylin and eosin (H&E) staining revealed enlarged adipocytes, indicative of hypertrophy (Figures 1G–1L, S1D, and S1E). In addition to the increased adipocyte size, plotting of adipocyte volume versus adipose tissue weight showed that boh/boh WAT contained an increased number of adipocytes compared to WT WAT, indicative of hyperplasia (Figures S1F and S1G). At 12 weeks of age, fasting blood glucose levels were comparable between boh/boh mice and WT littermates, while fasting insulin levels were dramatically increased in boh/boh mice (Figures 1M and 1N). Glucose intolerance (Figure 1O) and insulin resistance (Figure 1P) were both observed in 12-week-old boh/boh mice. Interestingly, fasting blood glucose (Figure S1H), fasting insulin levels (Figure S1I), glucose tolerance (Figure S1J), and insulin tolerance (Figure S1K) were normal in 5-week-old boh/boh mice when body weight was not increased. Presumably as a result of increased adiposity, boh/boh mice had increased leptin in the serum (Figure 1Q). Interestingly, while 12-week-old boh/boh mice had increased fasting cholesterol levels (Figure 1R), no significant differences in the fasting triglyceride levels were observed (Figure 1S). In addition, 16-week-old boh/boh mice had large, pallid livers and significantly increased body weight (Figures 1T–1V); H&E staining and Oil Red O (ORO) staining of liver sections showed an abundance of stored lipid (Figures 1W–1Z). Transmission electron microscope (TEM) images of liver sections showed “adipocyte-like” abnormal hepatocytes, each containing a single large lipid droplet (Figures S1L and S1M).
Figure 1. The boh phenotype.
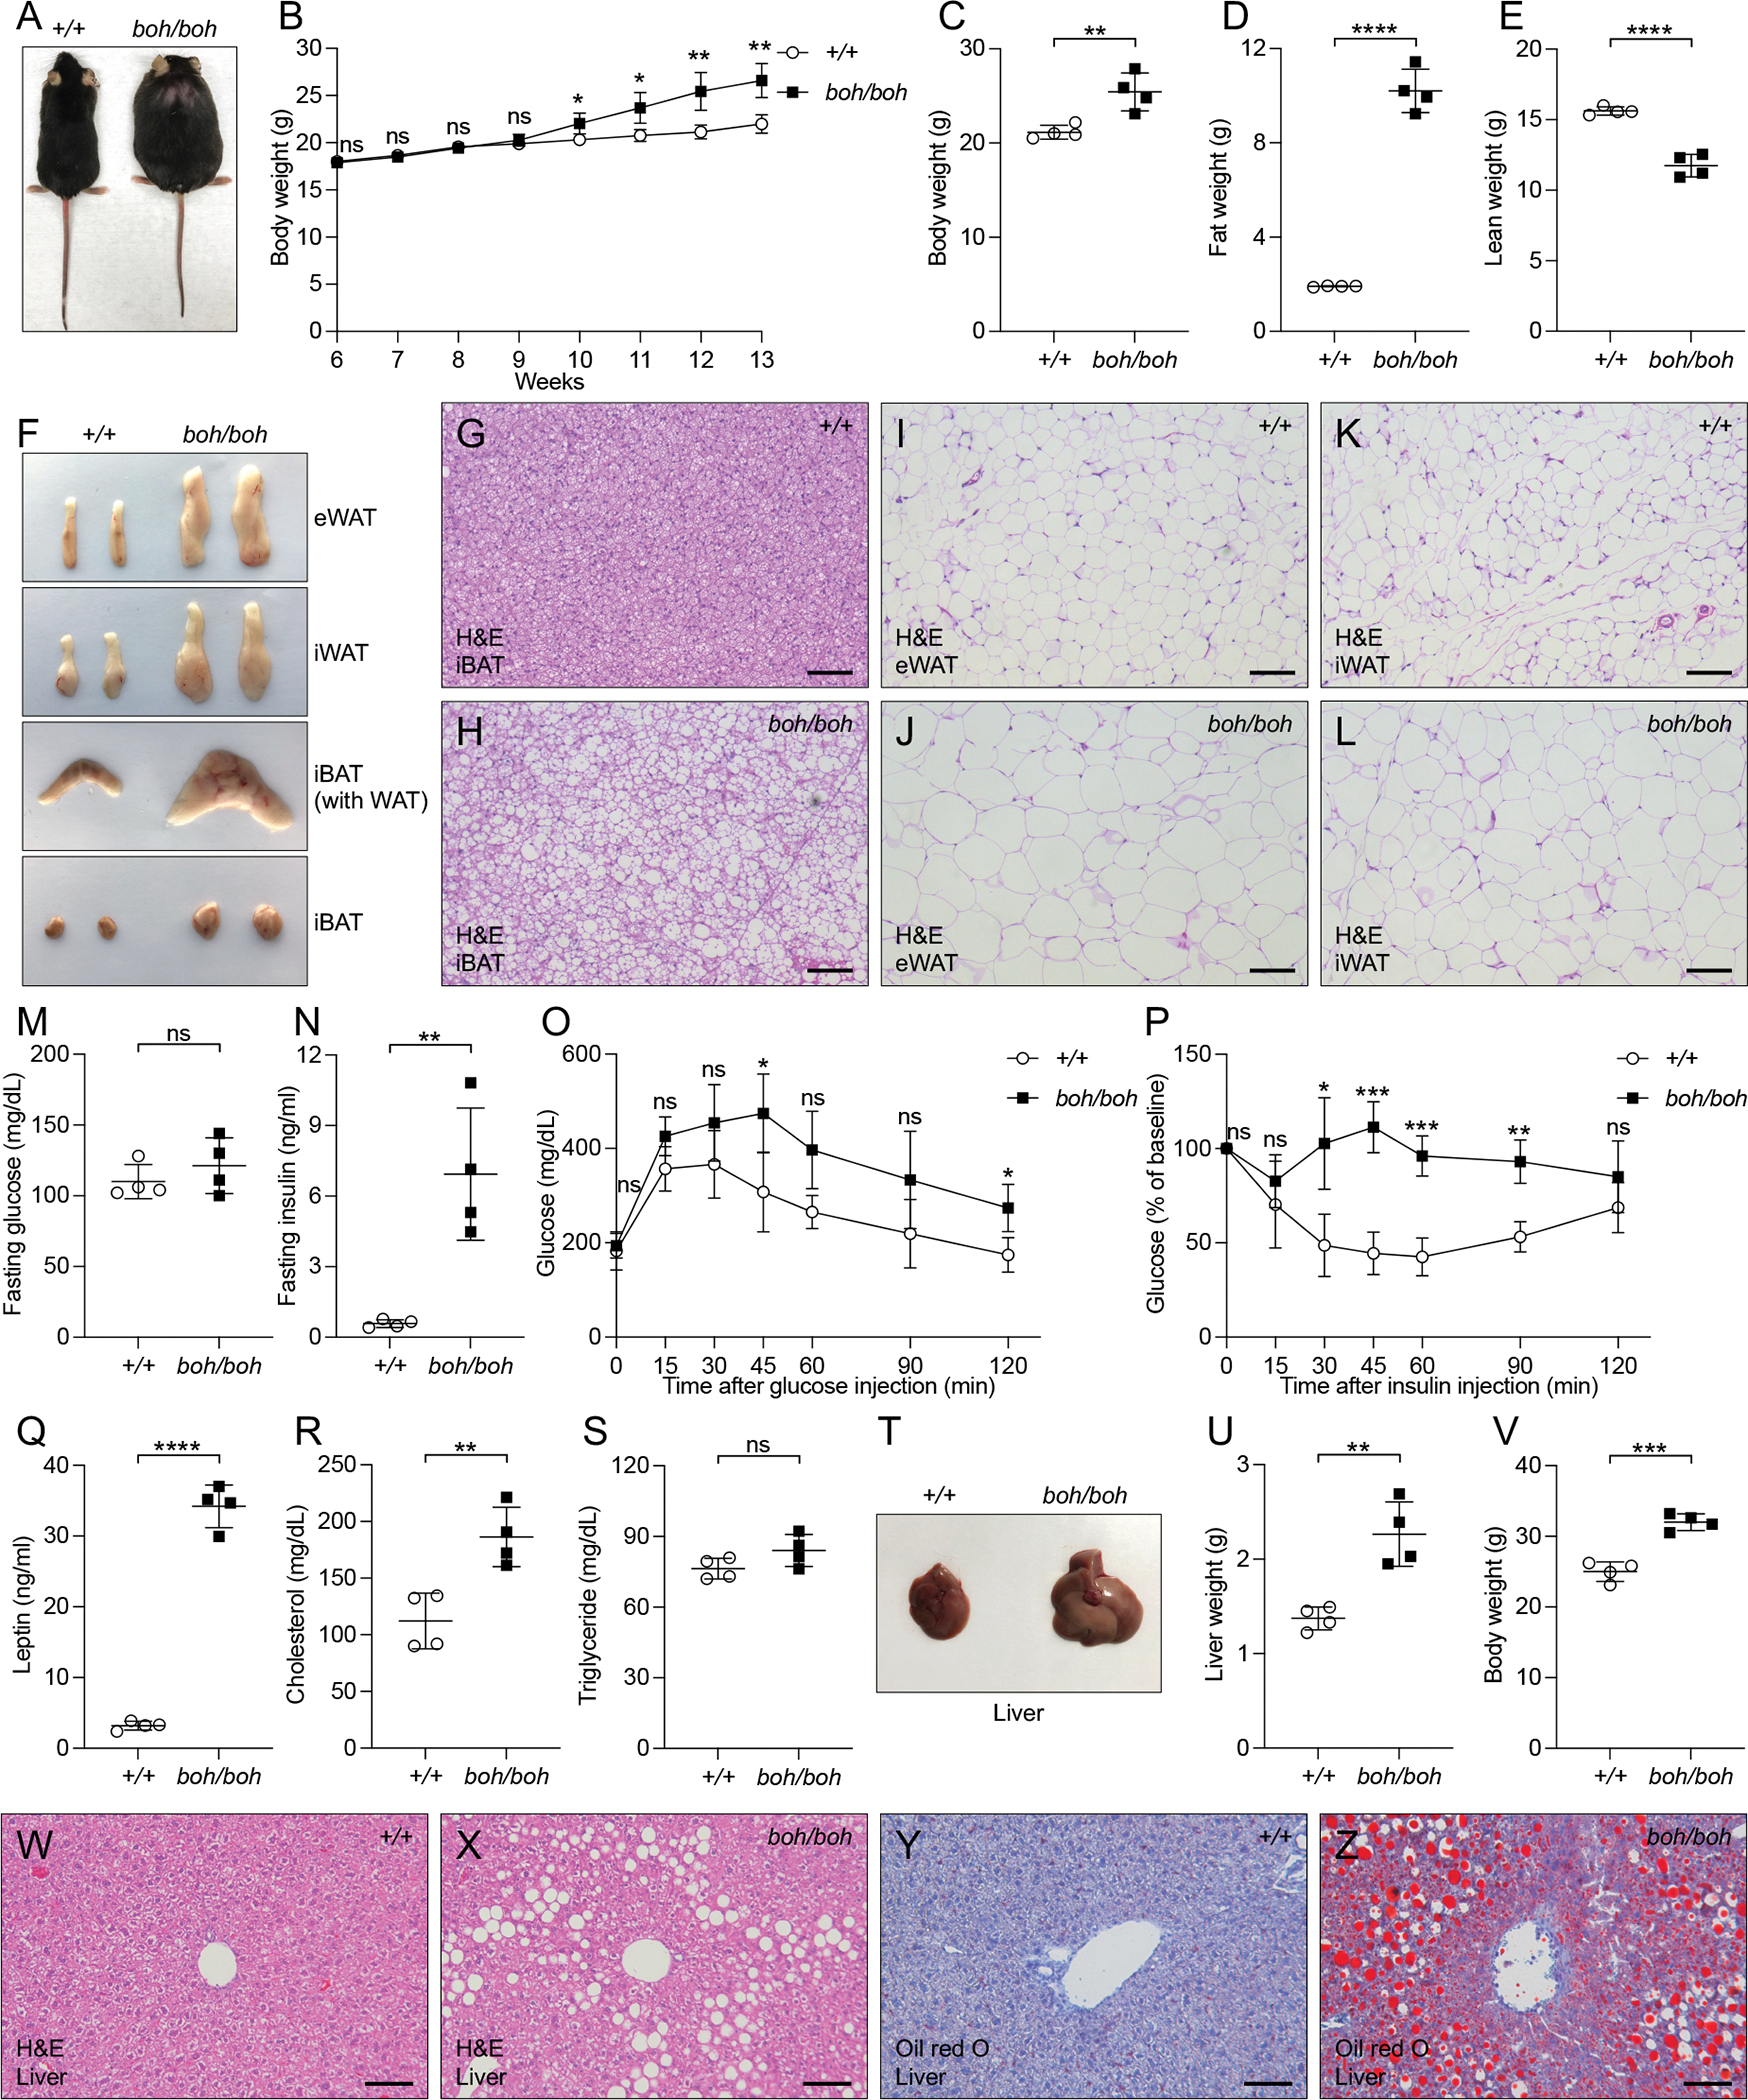
(A) Photograph of a male boh homozygote (boh/boh) and WT (+/+) littermate at 24 weeks of age.
(B) Growth curve of male homozygous boh mice (n=4) and WT littermates (n=4) from 6 weeks to 13 weeks of age.
(C-E) Body weight (C), fat weight (D), and lean weight (E) of 12-week-old male mice.
(F) Representative photographs of eWAT, iWAT, iBAT with WAT, and iBAT from 16-week-old male mice.
(G-L) H&E staining of sections from different adipose tissues of 16-week-old male mice. Scale bar: 100 μm.
(M and N) Serum glucose (M) and insulin (N) in 12-week-old male mice after a 6-h fast.
(O) Glucose tolerance test. Blood glucose was measured at indicated times after i.p. glucose injection in 12-week-old male mice (n=4).
(P) Insulin tolerance test. Blood glucose was measured at indicated times after i.p. insulin injection in 12-week-old male mice (n=4). The baseline blood glucose levels (0 min) of boh/boh and WT littermates were 160 ± 29 mg/dL and 170 ± 26 mg/dL, respectively.
(Q-S) Serum leptin (Q), cholesterol (R), and triglyceride (S) in 12-week-old male mice after a 6-h fast.
(T) Representative photographs of liver from 16-week-old male mice.
(U-V) Liver weight (U) and body weight (V) of 16-week-old male mice.
(W-Z) Liver sections of 16-week-old male mice stained with H&E (W and X) and Oil Red O (Y and Z). Scale bar: 100 μm.
Data are presented as means ± SD. P values were determined by Student’s t test. P values are denoted by * P ≤ 0.05; ** P ≤ 0.01; *** P ≤ 0.001; **** P ≤ 0.0001; ns, not significant with P > 0.05. Data points represent individual mice (C-E, M, N, Q-S, U, and V). Data are representative of two independent experiments.
See also Figure S1.
The boh phenotype is caused by an Ovol2 mutation
The boh phenotype was mapped as a quantitative trait. A total of 92 G3 mice were weighed, and weights were scaled with respect to age and sex (Figure 2A). Automated mapping (Wang et al., 2015b) implicated a missense allele of Ovo like zinc finger 2 (Ovol2) as the causative mutation, displaying strongest linkage in a recessive model of inheritance (P=1.086×10⁻¹²) (Figures 2A and 2B). The boh mutation was a single nucleotide transition from G to A, causing substitution of a tyrosine for a highly conserved cysteine at position 120 (C120Y) in OVOL2 isoform A (OVOL2-A) and position 87 (C87Y) in the shorter OVOL2 isoform B (OVOL2-B), within the first zinc finger domain of both isoforms (Figures 2C and S2A). Overexpression of the WT and boh mutant forms of OVOL2 in 293T cells revealed a similar expression level by immunoblot, suggesting that the boh mutation does not affect the stability of OVOL2 protein (Figure 2D).
Figure 2. Mutations in Ovol2 cause the boh phenotype.

(A) Scaled body weight phenotypic data plotted vs. genotype at the Ovol2 mutation site. Each data point represents one mouse. Mean (μ) and SD (σ) are indicated.
(B) Manhattan plot showing P values calculated using a recessive model of inheritance. The −Log10 P values (y axis) are plotted vs. the chromosomal positions of 39 mutations (x axis) identified in the G1 founder of the pedigree. Horizontal dark red and pink lines represent thresholds of P = 0.05 with or without Bonferroni correction, respectively.
(C) Protein domains of mouse OVOL2 274-aa isoform A and 241-aa isoform B. The boh mutation is a cysteine to tyrosine substitution at position 120 (C120Y) in OVOL2-A and position 87 (C87Y) in the shorter OVOL2-B.
(D) Immunoblots of lysates of 293T cells expressing HA-tagged WT OVOL2-A, OVOL2-B or OVOL2-Aboh, OVOL2-Bboh. Gapdh was used as a loading control.
(E) Relative Ovol2 mRNA level in fat and SVF isolated from different adipose tissues of 8-week-old male WT mice (mRNA level was normalized to Polr2a).
(F) Growth curve of male Ovol2boh/− mice (n=4) and WT littermates (n=4) from 6 weeks to 13 weeks of age.
(G-I) Body weight (G), fat weight (H), and lean weight (I) of 12-week-old mice.
(J and K) Serum glucose (J) and insulin (K) in 12-week-old male mice after a 6-h fast.
(L) Glucose tolerance test. Blood glucose was measured at indicated times after i.p. glucose injection in 12-week-old male mice (n=4).
(M) Insulin tolerance test. Blood glucose was measured at indicated times after i.p. insulin injection in 12-week-old male mice (n=4). The baseline blood glucose levels (0 min) of Ovol2boh/− and WT littermates were 208 ± 11 mg/dL and 204 ± 18 mg/dL, respectively.
(N-P) Serum leptin (N), cholesterol (O), and triglyceride (P) in 12-week-old male mice after a 6-h fast.
Data are presented as means ± SD. P values were determined by Student’s t test. P values are denoted by * P ≤ 0.05; ** P ≤ 0.01; *** P ≤ 0.001; **** P ≤ 0.0001; ns, not significant with P > 0.05. Data points represent individual mice (A, G-K, N-P). Data are representative of two independent experiments (D-P) or one experiment (A and B).
See also Figure S2.
Ovol2 is highly expressed in the testis (Masu et al., 1998). Although the expression of Ovol2 is low in adipose tissues compared to testis, it is detectable and furthermore, a relatively higher expression level of Ovol2 was detected in the stromal vascular fraction (SVF) than in fat cells themselves (Figure 2E). In addition, SVF isolated from eWAT and iWAT expressed more Ovol2 compared with SVF from iBAT (Figure 2E). The expression of Ovol2 mRNA was increased in the iWAT of boh/boh mice, suggesting possible feedback regulation of Ovol2 transcription (Figure S2B). By CRISPR/Cas9 gene targeting, a null allele of Ovol2 was made. No phenotype was apparent in heterozygotes for the null allele (Ovol2+/−). The Ovol2−/− genotype caused fully penetrant embryonic lethality as previously reported (Mackay et al., 2006; Unezaki et al., 2007). However, compound heterozygotes with the boh allele and a null allele of Ovol2 (Ovol2boh/−) were viable and displayed all aspects of the boh phenotype (Figures 2F–2P and S2C–S2W). Ovol2boh/− mice had increased body weight beginning at 9 weeks of age (Figure 2F), when body weights of homozygous boh mice were still normal (Figure 1B). At 12 weeks of age, Ovol2boh/− mice had overall stronger phenotypes than Ovol2boh/boh mice. These data are consistent with the interpretation that the boh allele confers a viable hypomorphic effect.
Obesity in OVOL2 deficient mice develops with normal food intake and decreased energy expenditure
Food intake of Ovol2boh/boh and Ovol2boh/− mice was monitored beginning at 6 weeks of age (Figures 3A–3D). No significant differences in food intake were found between Ovol2boh/boh mice and WT littermates before 10 weeks of age (Figure 3A), when body weight was also similar (Figure 1B). Beginning at 10 weeks of age, increased body weight of Ovol2boh/boh mice was accompanied by slightly increased food intake per mouse per day (Figure 3A); however, the cumulative food intake until 13 weeks of age was not significantly different from that of WT mice (Figure 3B). No significant differences in food intake were found between Ovol2boh/− mice and WT littermates before 9 weeks of age (Figure 3C), when body weight was also similar (Figure 2F). Beginning at 9 weeks of age, significantly increased body weight of Ovol2boh/− mice was accompanied by significantly increased food intake per mouse per day (Figure 3C), and the cumulative food intake of Ovol2boh/− mice was also significantly increased (Figure 3D). To check if the increased food intake was the cause of the obesity in OVOL2 deficient mice, Ovol2boh/boh mice were pair-fed with the same amount of food as WT littermate mice beginning at 7 weeks of age when there were no differences in body weight, fat weight, and lean weight (Figures 3E–3G). Four weeks after pair-feeding, Ovol2boh/boh mice had gained significantly more fat weight than WT littermate mice (Figure 3F), suggesting a contribution of factors other than increased food intake to the obesity in OVOL2 deficient mice. Indeed, metabolic cage experiments revealed that Ovol2boh/boh mice had decreased energy expenditure during the dark phase of the light cycle (Figures 3H and 3I). In addition, Ovol2boh/boh mice had slightly increased respiratory exchange ratio (RER) (Figure 3J) during the light phase, suggesting a decreased use of lipid in the energy production. No consistent change of activities between Ovol2boh/boh mice and WT littermate mice could be determined. Ovol2boh/boh mice had slightly increased central fine movement (Figure 3K) during the dark phase with no change in central ambulatory movement (Figure 3L). Ovol2boh/boh mice also presented decreased peripheral fine and ambulatory movement during the dark phase and slightly increased peripheral fine and ambulatory movement during the light phase (Figures 3M and 3N). Together, these data suggest that decreased energy expenditure might contribute to the development of the boh obese phenotype.
Figure 3. Obesity in OVOL2 deficient mice develops with normal food intake and decreased energy expenditure.
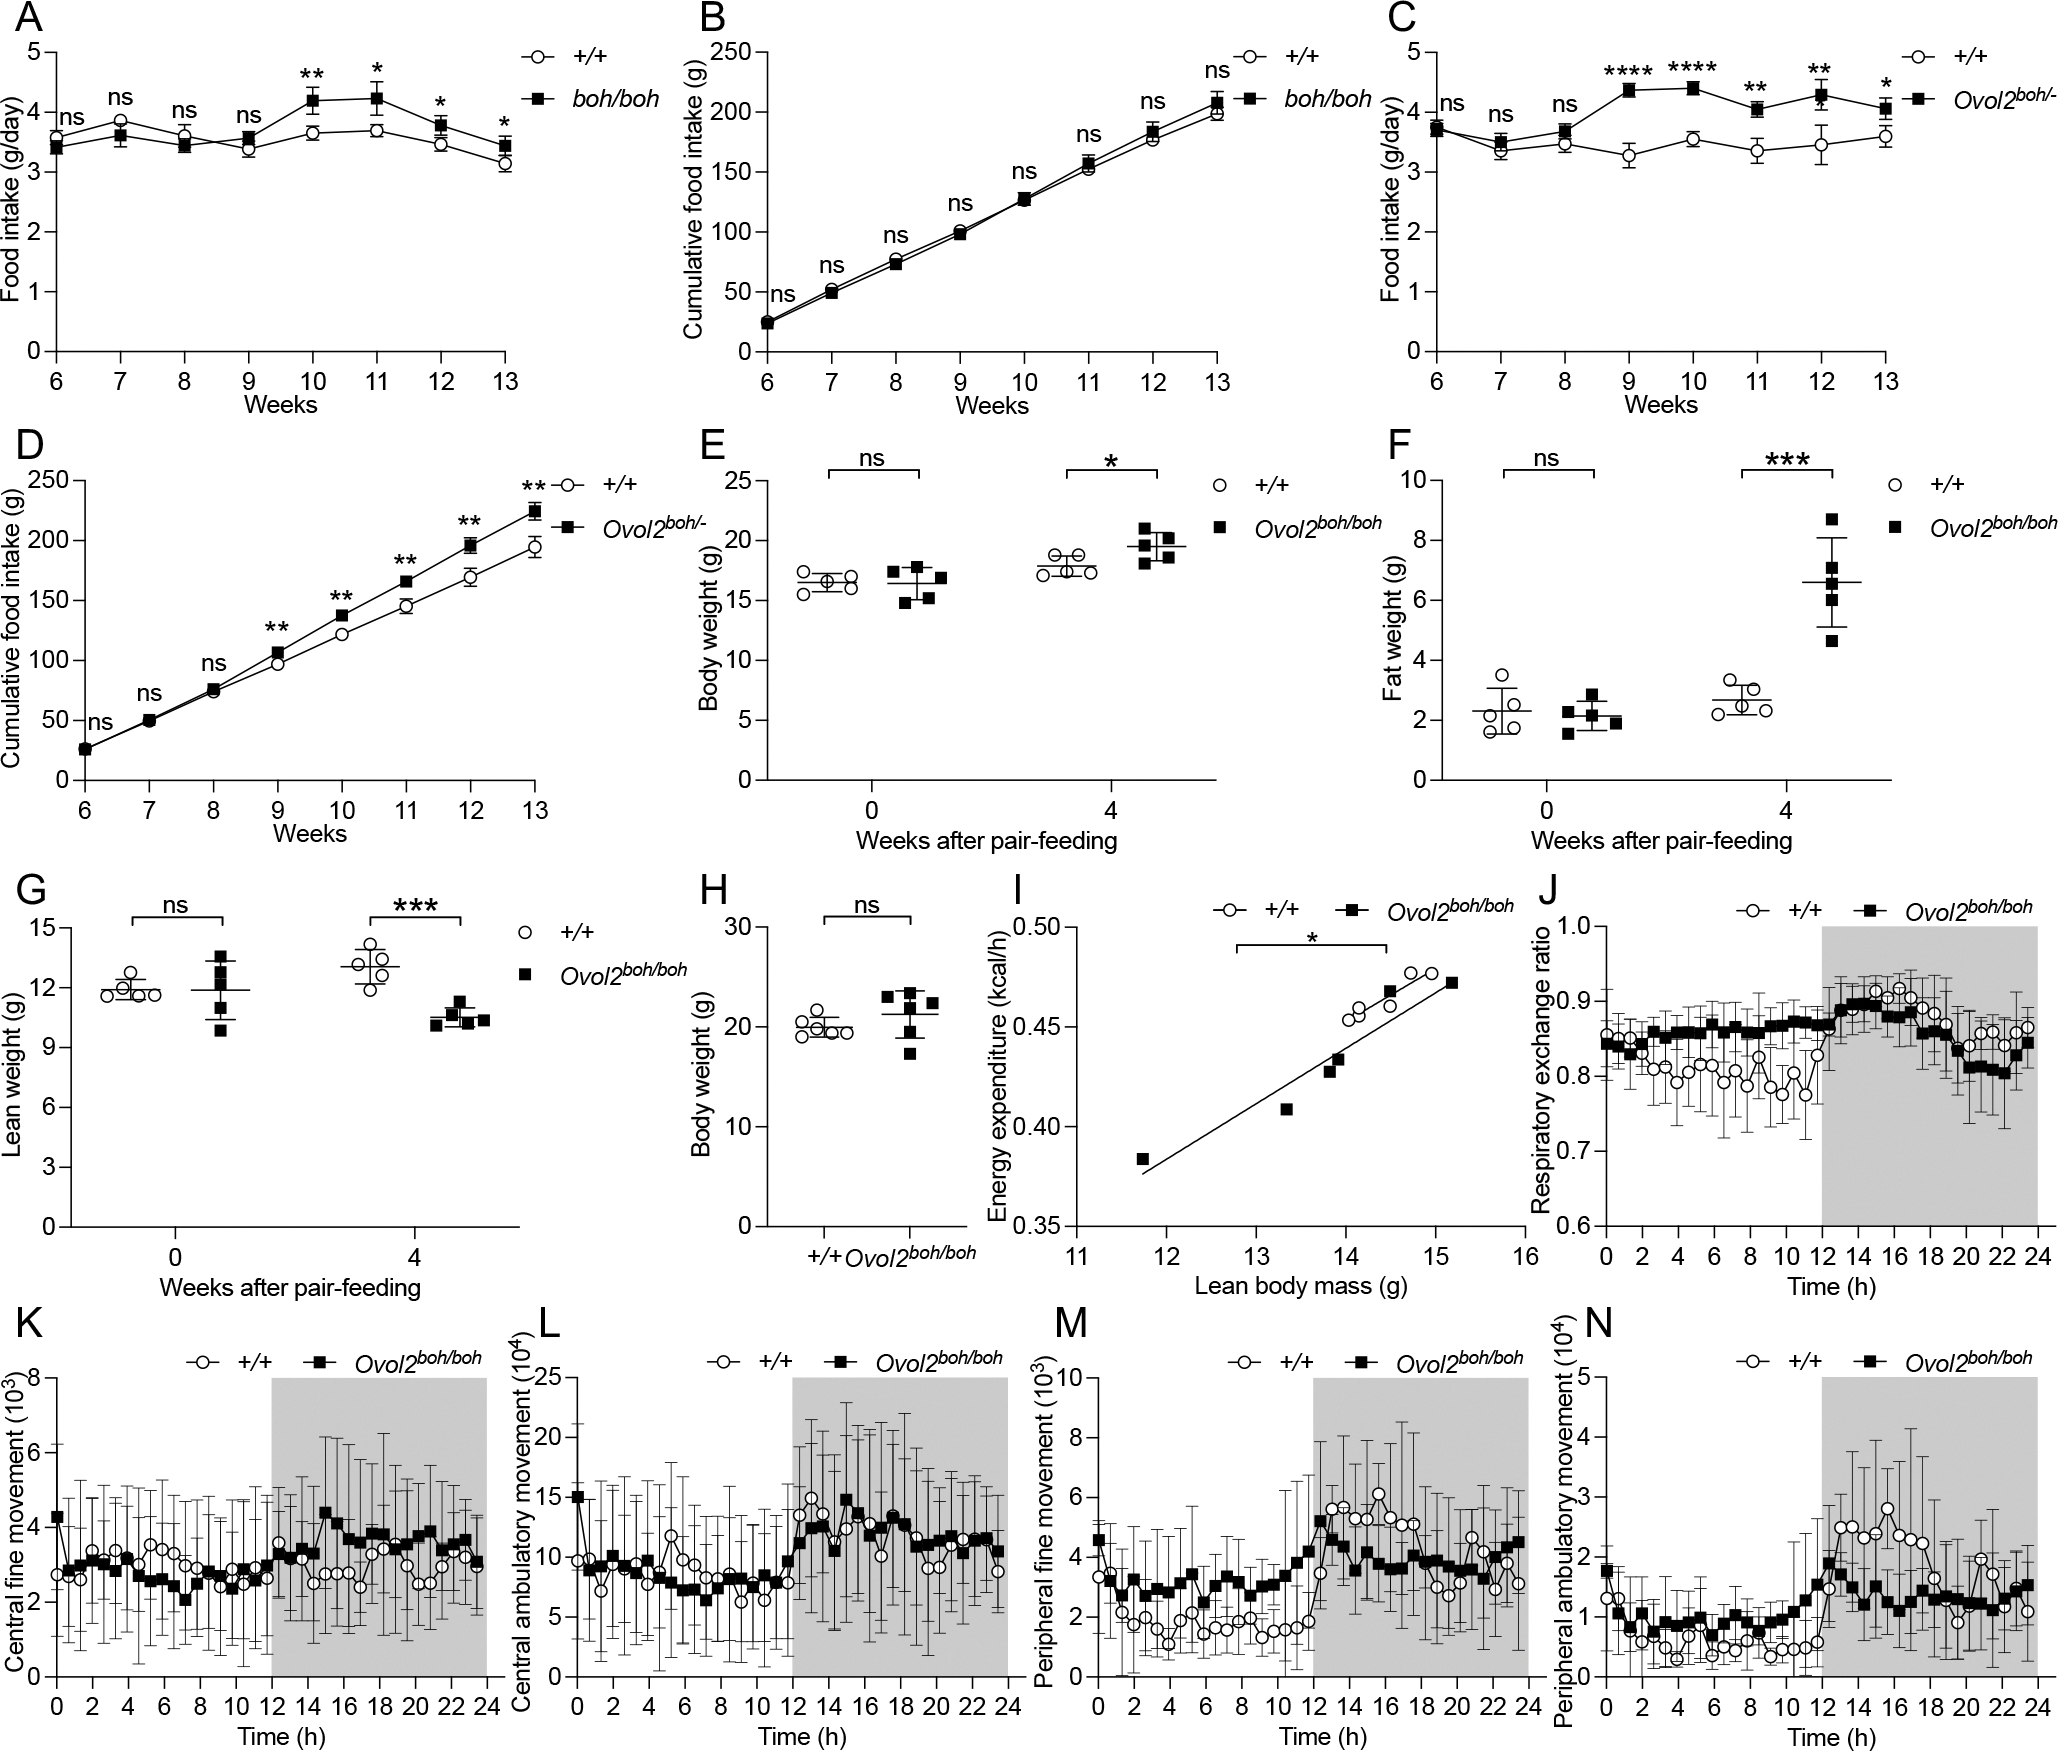
(A and B) Food intake of male homozygous boh mice (n=4) and WT littermates (n=4) was monitored from 6 weeks to 13 weeks of age. Average food intake per mouse per day (g/day) (A) or cumulative food intake (g) (B). Body weight data of these mice were presented in Figure 1B.
(C and D) Food intake of male Ovol2boh/− compound heterozygous mice (n=4) and WT littermates (n=4) was monitored from 6 weeks to 13 weeks of age. Average food intake per mouse per day (g/day) (C) or cumulative food intake (D). Body weight data of these mice were presented in Figure 2F.
(E-G) Body weight (E), fat weight (F), and lean weight (G) of homozygous female boh mice and WT littermates before and after pair-feeding since 7 weeks of age.
(H) Body weight of 10-week-old male homozygous boh mice (n=6) and WT littermates (n=6) used for metabolic cage experiments in I-N.
(I-N) Metabolic cage measurements of energy expenditure (I), respiratory exchange ratio (J), central fine movement (K), central ambulatory movement (L), peripheral fine movement (M), and peripheral ambulatory movement (N) of 10-week-old male homozygous boh mice (n=6) and WT littermates (n=6) housed at 23 °C. Dark color indicates dark phase when light was off.
Data are presented as means ± SD. P values were determined by Student’s t test (A-H). A linear correlation with a two-tailed comparison of slope and intercept was calculated and compared between different mouse groups (I). P values are denoted by * P ≤ 0.05; ** P ≤ 0.01; *** P ≤ 0.001; **** P ≤ 0.0001; ns, not significant with P > 0.05. Data points represent individual mice (E-I). Data are representative of two independent experiments.
See also Figure S3.
Obesity of Lepob/ob mice is enhanced by Ovol2boh/boh
Lepob/ob mutant mice (C57BL/6J background) (Ingalls et al., 1950; Zhang et al., 1994) were crossed to Ovol2boh/boh mice and double heterozygotes intercrossed to determine whether homozygosity for both mutations would result in a more severe obesity phenotype than homozygosity for either single mutation. At 16 weeks of age, Lepob/ob; Ovol2+/+ mice displayed a 252% increase in body weight with respect to WT mice. Lep+/+; Ovol2boh/boh mice showed a 163% increase in body weight. Lepob/ob; Ovol2boh/boh mice showed a 285% increase in body weight, significantly more than mice homozygous for either mutation alone (Figure S3A). Similarly, the fat/lean body weight ratio was higher in Lepob/ob; Ovol2boh/boh mice than in either of the single homozygotes (Figure S3B). A significant difference was also observed for total body fat (Figure S3C). However, while Lepob/ob; Ovol2+/+ mice showed increased lean weight, Lep+/+; Ovolboh/boh mice had decreased lean weight, both in comparison to WT mice. The lean weights of Lepob/ob; Ovol2boh/boh mice were comparable to those of WT littermates (Figure S3D). Lepob/ob; Ovol2boh/boh mice also showed elevated levels of fasting blood glucose (Figure S3E), fasting insulin (Figure S3F), fasting triglycerides (Figure S3G), fasting cholesterol (Figure S3H), and liver lipid (Figures S3I–S3P) compared with the single homozygotes. The exacerbated weight, fat, and metabolic phenotypes observed in Lep; Ovol2 double mutant mice compared with either single mutant suggest that leptin and OVOL2 function in distinct signaling pathways to control obesity. Whereas obesity in the classic ob model is caused by increased caloric consumption and reduced energy expenditure, Ovol2boh/− and Ovol2boh/boh mice show at worse a mild increase in food intake over their WT littermates, which did not fully account for the increase in fat and body weight caused by OVOL2 deficiency.
Defective thermogenesis in OVOL2 deficient mice
Since we observed decreased energy expenditure in OVOL2 deficient mice but no reduction in physical activities, we moved on to measure cold tolerance in these animals. When housed at room temperature (23 °C), 16-week-old Ovol2boh/− mice had normal basal core body temperature (Figure 4A). During an acute cold stress experiment (6 °C) in the absence of food, Ovol2boh/− mice failed to maintain their core body temperature as compared with WT littermate control mice (Figure 4A). We noticed a progressive hair loss on the back of both male and female Ovol2boh/boh mice (Figures S4A and S4H) which could reduce the skin insulation. Indeed, H&E staining showed disrupted hair follicles in Ovol2boh/boh mice which was consistent with the progressive hair loss phenotype (Figures S4B–S4G and S4I–S4N). On the other hand, Ovol2boh/boh mice had significantly increased dermal adipose tissues which could provide better insulation against cold (Figures S4B–S4G and S4I–S4N). We shaved both Ovol2boh/− mice and WT littermate mice to eliminate the effect of hair in the acute cold stress experiment (Figure 4B). The core temperature of Ovol2boh/− mice dropped dramatically to 23.5 °C at 45 min while the core temperature of WT littermate mice was maintained at 32.7 °C (Figure 4B). These data suggest that although the boh mutation clearly affects the development of hair follicles, the reduction in hair growth is not solely responsible for the cold intolerance of OVOL2 deficient mice. Moreover, the increased dermal adipose tissue in Ovol2boh/boh mice is insufficient for these animals to maintain a normal body temperature under acute cold exposure.
Figure 4. OVOL2 deficient mice are cold intolerant.
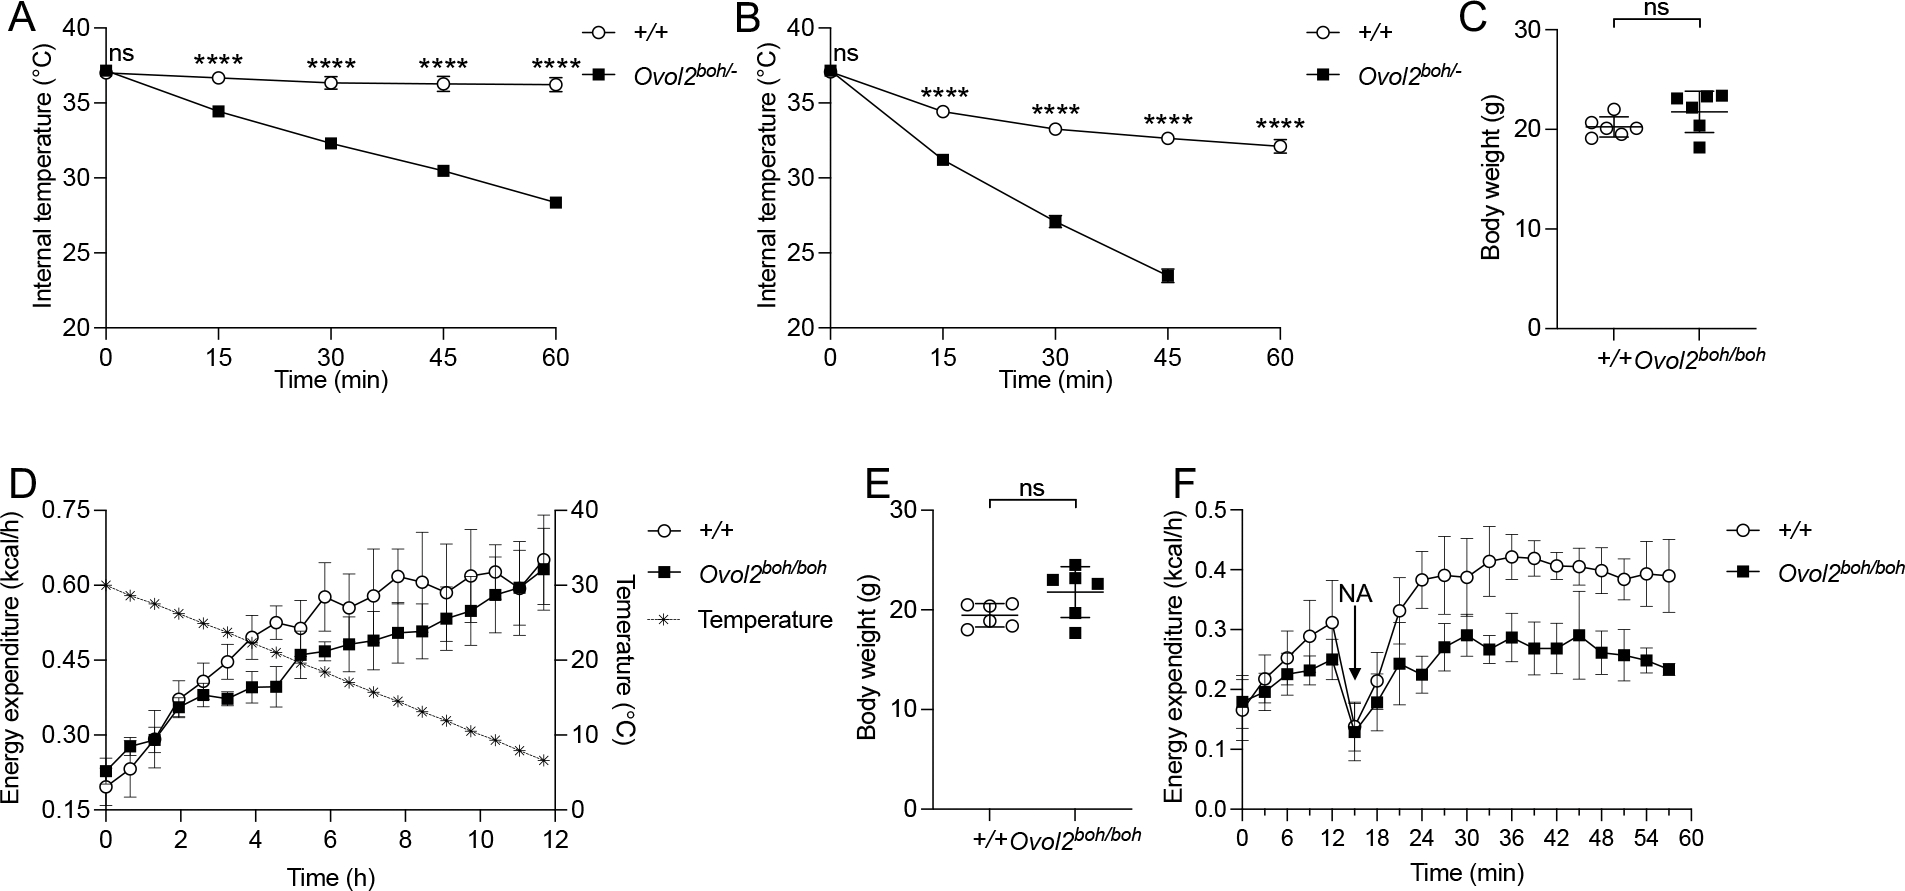
(A) Internal temperature of 16-week-old female mice housed at cold environment in the absence of food (n=4 WT, 3 Ovol2boh/−).
(B) Internal temperature of shaved 16-week-old female mice housed at cold environment in the absence of food (n=4 WT, 3 Ovol2boh/−).
(C) Body weight of 10-week-old male Ovol2boh/boh mice (n=6) and WT littermates (n=6) used for metabolic cage experiments in D.
(D) Metabolic cage measurement of energy expenditure of 10-week-old male Ovol2boh/boh mice (n=6) and WT littermates (n=6) when housing temperature decreased from 30 °C to 6 °C within 12 h.
(E) Body weight of 10-week-old male Ovol2boh/boh mice (n=6) and WT littermates (n=6) used for metabolic cage experiments in F.
(F) Metabolic cage measurement of energy expenditure of 10-week-old male Ovol2boh/− mice (n=6) and WT littermates (n=6) before and after NA injection.
Data are presented as means ± SD. P values were determined by Student’s t test. P values are denoted by **** P ≤ 0.0001; ns, not significant with P > 0.05. Data points represent individual mice (C and E). Data are representative of two independent experiments.
See also Figure S4.
When the housing temperature was decreased from 30 °C to 6 °C within a 12 h period, Ovol2boh/boh mice increased their energy expenditure similarly to WT mice for the first 2 h but then expended less energy than WT littermate mice for the remainder of the experiment (Figures 4C and 4D). This finding suggested that as the temperature fell below the lower limit of the thermoneutral zone (~28°C), mechanisms by which WT mice perform thermogenesis fail in Ovol2boh/boh mice. In addition to cold, we monitored energy expenditure as an indication of thermogenesis induced by noradrenaline (NA), a nonselective agonist of adrenergic receptors and an established inducer of BAT-dependent thermogenesis (Figures 4E and 4F). As shown in Figure 4F, NA injection increased energy expenditure in WT mice but barely did so in Ovol2boh/boh mice. Together these data suggest that brown fat function may be compromised in OVOL2 deficient mice.
OVOL2 is essential for brown/beige fat mediated thermogenesis
Compared to the iBAT of WT littermates, the color of iBAT from 16-week-old Ovol2boh/boh and Ovol2boh/− mice appeared abnormally white (Figures 1F and S2C). H&E staining revealed that adipocytes within Ovol2boh/boh and Ovol2boh/− iBAT were heterogeneous in size, with many containing a large unilocular lipid droplet (Figures 1G, 1H, S2D, and S2E), suggesting the function of brown fat might be compromised. Immunohistochemical staining of UCP1 in iBAT of Ovol2boh/− mice showed that UCP1 appeared to be absent from the larger adipocytes containing unilocular lipid droplets, while the smaller adipocytes with multilocular lipid droplets were positive for UCP1 expression (Figures 5A and 5B). Beige adipocytes were visible as a cluster of UCP1 positive cells in the iWAT of WT mice (Figure 5C), but no UCP1 positive beige adipocytes were found in the iWAT of Ovol2boh/− mice (Figure 5D). Consistent with the histological analysis, quantification of Ucp1, Prdm16, Cidea, and Ppargc1a by real-time PCR showed a reduction of these brown/beige cell markers in iBAT of 16-week-old Ovol2boh/− mice (Figure 5E), as well as in iWAT, where absolute levels of these mRNAs were lower than in iBAT (Figure 5F). To directly examine energy metabolism in vitro, we used Seahorse XF system to measure the oxygen consumption rate (OCR) of isolated brown adipose tissues. As shown in Figure 5G, OVOL2 deficient brown adipose tissues had a decreased OCR for all test conditions (ATP-linked, maximal, and non-mitochondrial) compared with WT brown adipose tissues. Moreover, addition of NA in the medium further increased OCR in WT brown adipose tissues, but not in OVOL2 deficient brown adipose tissues (Figure 5G). The reduced OCR in all conditions suggested a reduced number of mitochondria. Indeed, the iBAT of 16-week-old Ovol2boh/− mice had decreased protein levels of different mitochondrial markers, including outermembrane protein (TOM20), innermembrane proteins (UCP1 and COX IV), and intermembrane proteins (AIF and OPA1) (Figure 5H). Lipolysis of WAT plays an important role in fueling thermogenesis of BAT. We checked the WAT lipolysis by stimulating tissue explants with CL316,243, an agonist of β3-adrenergic receptors. Consistent with the defective thermogenesis observed in OVOL2 deficient mice, the overall rate of WAT lipolysis in 16-week-old Ovol2boh/− mice was decreased as indicated by increased EC50 (+/+, 4.575 ng/ul; Ovol2boh/−, 8.753 ng/ul) and decreased maximum rate (+/+, 0.4735 mg/g; Ovol2boh/−, 0.1975 mg/g) (Figure 5I).
Figure 5. OVOL2 is essential for thermogenic gene expression in brown/beige fat.
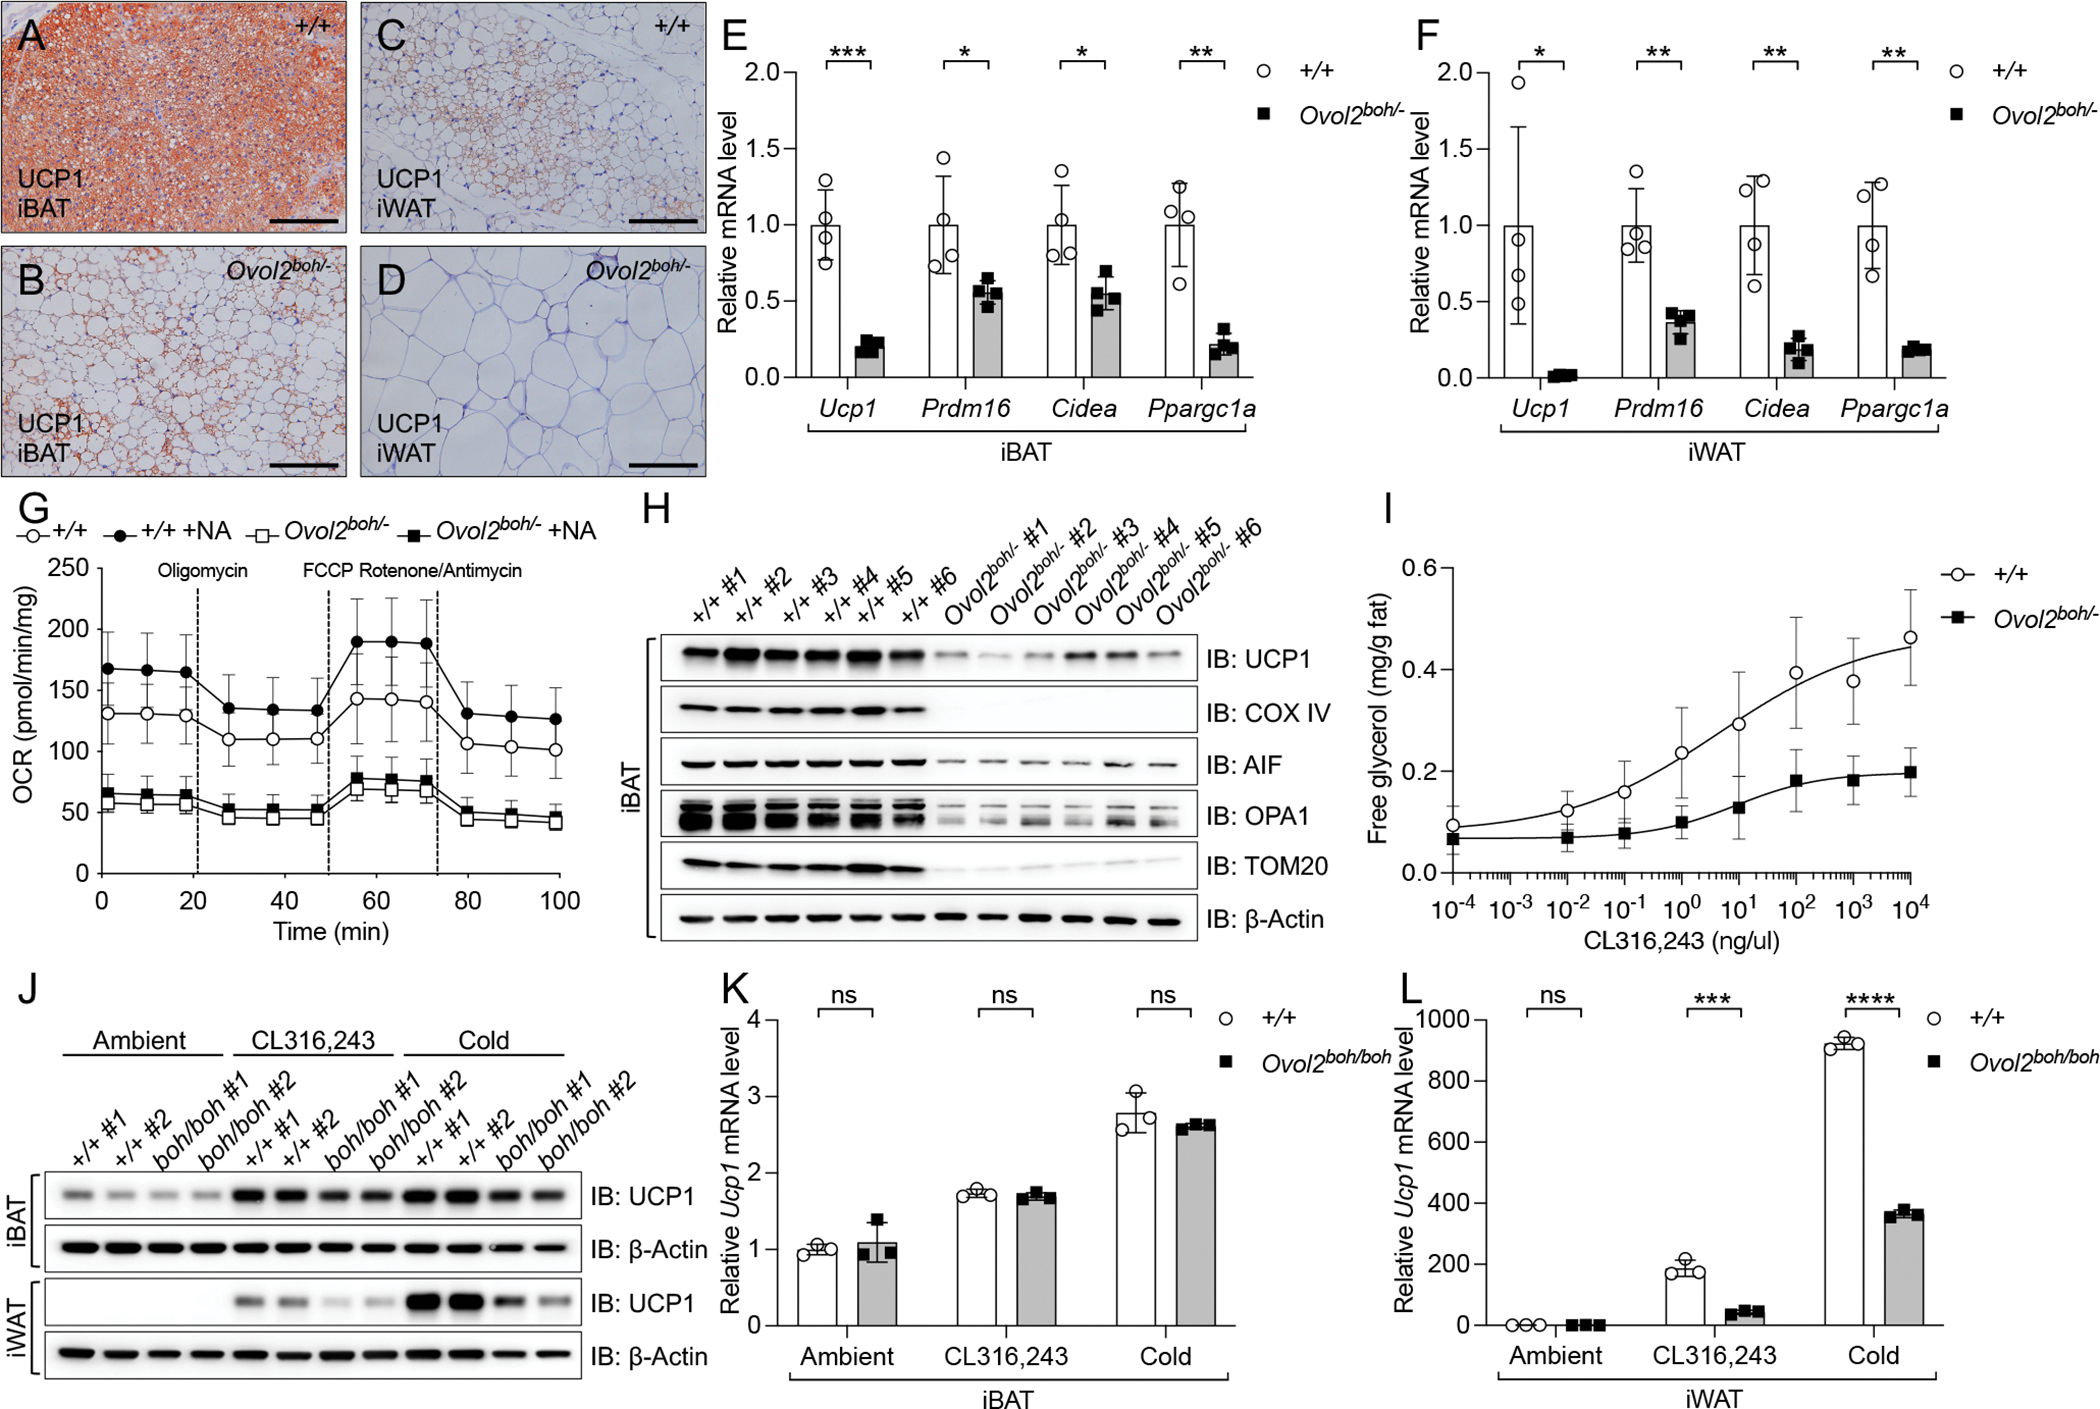
(A-D) UCP1 staining of sections from iBAT and iWAT of 16-week-old male mice. Scale bar: 100 μm.
(E and F) Relative mRNA level of thermogenic genes in iBAT (E) and iWAT (F) of 16-week-old female mice (mRNA level was normalized to Polr2a and shown as fold change to WT controls).
(G) Seahorse measurement of oxygen consumption rate (OCR) of isolated brown adipose tissues from 10-week-old mice (n=5) treated with different conditions in vitro. OCR value was normalized with tissue weight.
(H) Immunoblots of lysates of iBAT of 10-week-old Ovol2boh/− mice (n=6) and WT littermates (n=6).
(I) Free glycerol released in the medium of iWAT explants isolated from 16-week-old Ovol2boh/− mice (n=6) and WT littermates (n=6) 1 h after stimulation with different concentrations of CL316,243.
(J) Immunoblots of lysates of iBAT and iWAT of 5-week-old female mice (n=2 each group) treated with different conditions for 10 days.
(K and L) Relative Ucp1 mRNA level in iBAT (K) and iWAT (L) of 5-week-old female mice treated with different conditions for 10 days (mRNA level was normalized to Polr2a and shown as fold change to WT controls at ambient temperature).
Data are presented as means ± SD. P values were determined by Student’s t test. P values are denoted by * P ≤ 0.05; ** P ≤ 0.01; *** P ≤ 0.001; **** P ≤ 0.0001; ns, not significant with P > 0.05. Data points represent individual mice (E, F, K, and L). Data are representative of two independent experiments (A-I) or one experiment (J-L).
See also Figure S5.
Because obesity of Ovol2boh/boh and Ovol2boh/− mice develops after 9 weeks of age and progresses with age, we examined thermogenic gene expression and resistance to cold stress in 5-week-old Ovol2boh/boh mice, which had similar body weight, fat weight, and lean weight as WT littermates (Figures S5D–S5F). At 5 weeks of age, Ovol2boh/boh iBAT and iWAT showed slightly reduced expression levels of thermogenic genes compared to iBAT and iWAT from WT littermates, but this was not statistically significant (Figures S5A and S5B); tolerance to acute cold stress was similar in 5-week-old Ovol2boh/boh and WT mice (Figure S5C). After chronic (10 days) cold stress or treatment with CL316,243, Ovol2boh/boh and WT mice had similar body weights and lean weight percentages, and showed similar reductions in fat weight percentages (Figures S5G–S5I). UCP1 mRNA and protein were upregulated similarly in Ovol2boh/boh and WT iBAT in response to both treatments (Figures 5J and 5K), but this response was reduced in iWAT of Ovol2boh/boh mice compared to WT mice (Figures 5J and 5L). These data suggest that while perception of cold is preserved in 5-week-old Ovol2boh/boh mice, their ability to induce browning of WAT is impaired in response to chronic stimuli. Together, these data suggest that reduced formation and functionality of brown and beige adipocytes resulted in a defect of thermogenesis in OVOL2 deficient mice.
OVOL2 directly interacts with C/EBPα
To investigate the mechanisms by which OVOL2 regulates adipocytes, we used mass spectrometry to analyze proteins that immunoprecipitated with 3xFlag tagged OVOL2-A (3xFlag-OVOL2-A) from differentiated 3T3-L1 adipocytes (Figure S6A). Several OVOL2 specific interacting proteins were identified, among which C/EBPα was the top candidate (Figure S6B). OVOL2 interacted with C/EBPα when expressed in 293T cells (Figure 6A). In vitro GST pull-down experiments supported a direct interaction between OVOL2 and C/EBPα (Figure 6B). Interestingly, OVOL2 specifically interacted with C/EBPα among other C/EBP family proteins (Figure S6C). We also examined the subcellular localization of Flag tagged OVOL2 (Flag-OVOL2) and HA tagged C/EBPα in undifferentiated 3T3-L1 pre-adipocytes (Day 0) (Figure 6C). Both OVOL2 and C/EBPα alone showed specific nuclear localization (Figure 6C). A majority of OVOL2 and C/EBPα co-localized in the nuclei when these two proteins were co-expressed in 3T3-L1 pre-adipocytes (Figure 6C). Further mapping experiments revealed the C-terminal zinc finger domains of OVOL2, and C-terminal basic leucine zipper (bZIP) domains of C/EBPα were required for their interaction (Figures 6D–6F). Compared to WT OVOL2, the mutant OVOL2boh protein (C120Y) had a reduced interaction with C/EBPα (Figure 6G). Collectively, these data demonstrate that C/EBPα interacts with OVOL2, and that this interaction is disrupted by the boh mutation.
Figure 6. OVOL2 interacts with C/EBPα to repress adipogenesis.
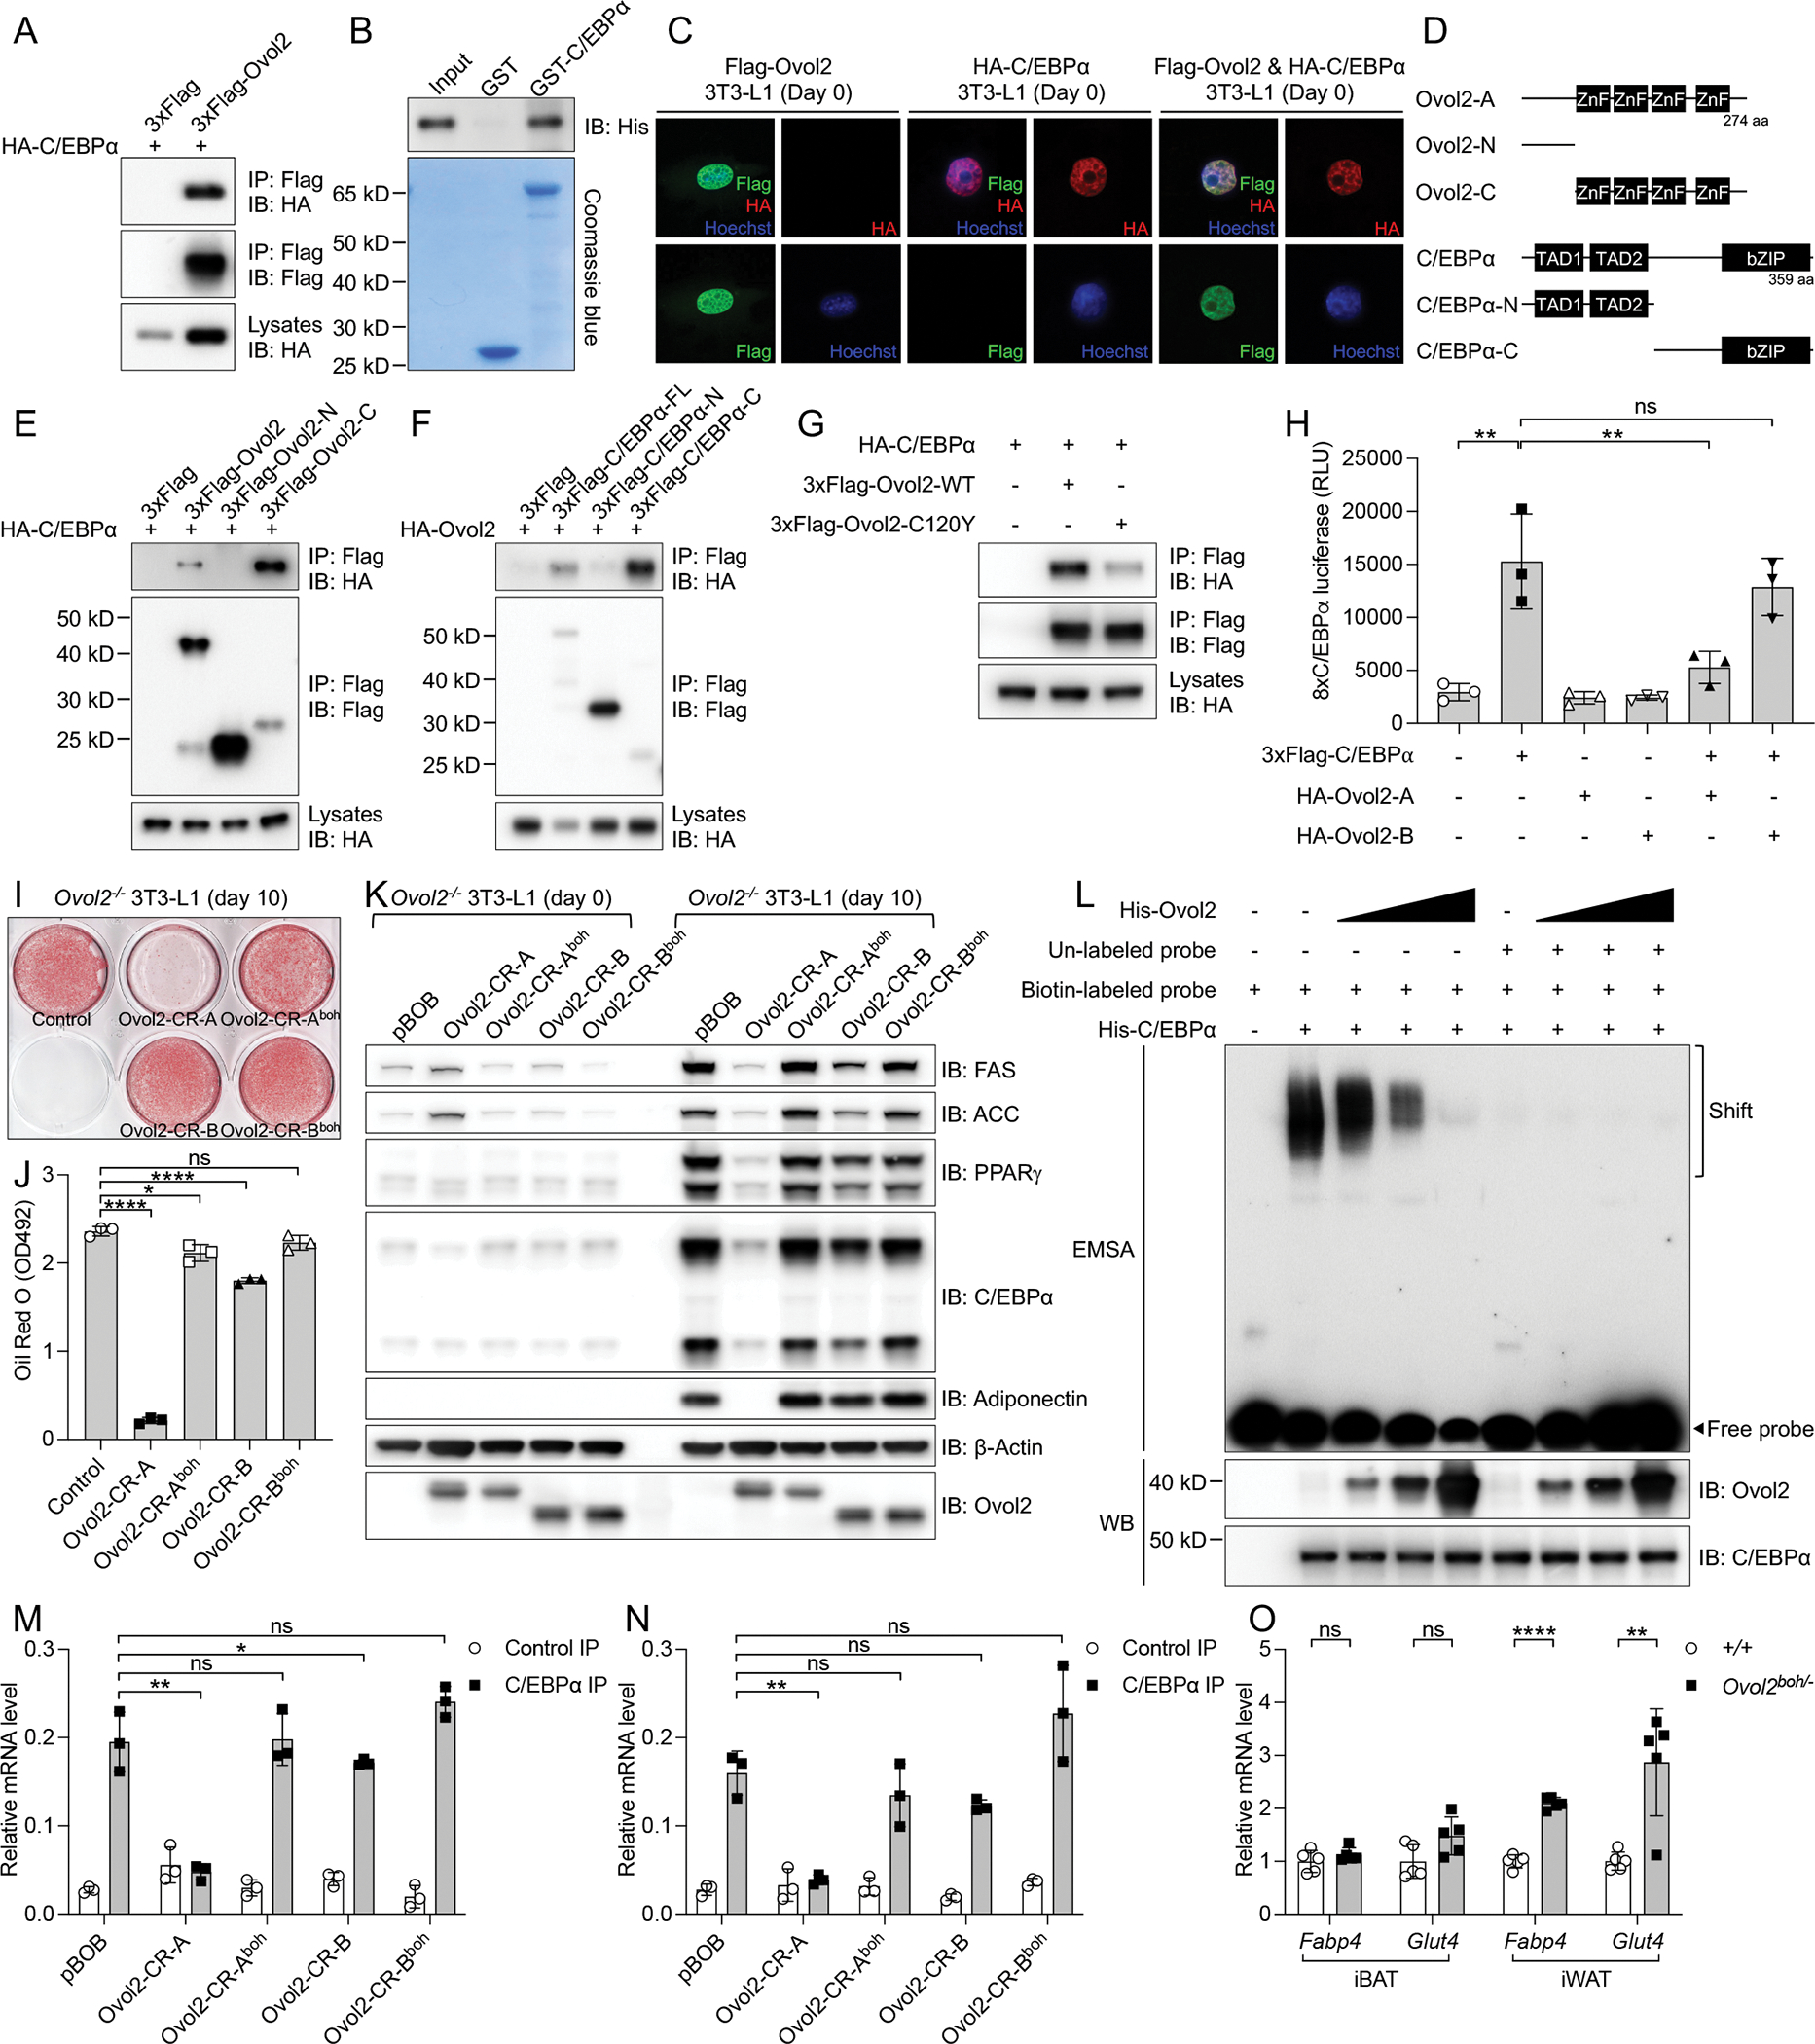
(A) Immunoblot analysis of immunoprecipitates (Top and Middle) or lysates (Bottom) of 293T cells expressing HA-tagged C/EBPα and 3xFLAG-tagged OVOL2.
(B) Purified HIS-tagged OVOL2 was incubated with GST or GST-tagged C/EBPα. After GST pull-down, bound protein was analyzed by HIS immunoblot (Top). The amounts of GST and GST-C/EBPα were visualized by Coomassie blue staining (Bottom).
(C) Undifferentiated 3T3-L1 cells expressing FLAG-tagged OVOL2, HA-tagged C/EBPα, and co-expression of FLAG-tagged OVOL2 and HA-tagged C/EBPα proteins were immunostained with FLAG (green) antibody, HA (red) antibody, and Hoechst (blue) to visualize nuclei.
(D) Protein domains of mouse OVOL2, C/EBPα and truncated forms for mapping the protein interaction region.
(E) Immunoblot analysis of immunoprecipitates (Top and Middle) or lysates (Bottom) of 293T cells expressing HA-tagged C/EBPα and 3xFLAG-tagged full-length or truncated OVOL2.
(F) Immunoblot analysis of immunoprecipitates (Top and Middle) or lysates (Bottom) of 293T cells expressing HA-tagged OVOL2 and 3xFLAG-tagged full-length or truncated C/EBPα.
(G) Immunoblot analysis of immunoprecipitates (Top and Middle) or lysates (Bottom) of 293T cells expressing HA-tagged C/EBPα and 3xFLAG-tagged WT or boh mutant (C120Y) OVOL2.
(H) Luciferase activities of a 8xC/EBPα reporter with overexpression of different plasmids.
(I) Oil Red O staining of fully differentiated Ovol2 KO 3T3-L1 adipocytes expressing WT or boh mutant OVOL2.
(J) Quantification of Oil Red O staining by measurement of OD at 492nm (n=3).
(K) Immunoblots of lysates of undifferentiated or fully differentiated Ovol2 KO 3T3-L1 cells expressing different OVOL2 proteins.
(L) EMSA assay (Top) to measure the DNA binding activity of purified His-C/EBPα in the presence of different dosages of His-OVOL2 protein. DNA probe was labeled with biotin for streptavidin-HRP visualization. EMSA samples were also analyzed by Western Blot (WB) to detect OVOL2 protein (Middle) and C/EBPα protein (Bottom).
(M and N) C/EBPα ChIP assay of fully differentiated Ovol2 KO 3T3-L1 adipocytes expressing WT or boh mutant OVOL2. Two classic C/EBPα transcriptional targets (Fabp4 and Glut4) were detected by real-time PCR.
(O) Relative mRNA level of Fabp4 and Glut4 in iBAT and iWAT of 16-week-old female mice (mRNA level was normalized to Polr2a and shown as fold change to WT controls).
Data are presented as means ± SD. P values were determined by Student’s t test (O) or one-way ANOVA with Tukey’s multiple comparison test (H, J, M, and N). P values are denoted by * P ≤ 0.05; ** P ≤ 0.01; **** P ≤ 0.0001; ns, not significant with P > 0.05. Data points represent individual mice (O). Data are representative of two independent experiments.
See also Figure S6.
OVOL2 suppresses adipogenesis through inhibition of the transcriptional activity of C/EBPα
The C/EBPα binding ability of OVOL2 suggested a potential regulatory role of OVOL2 towards C/EBPα as a transcription factor. In a luciferase reporter system with 8 copies (8x) of C/EBPα binding motifs, HA tagged WT OVOL2-A (HA-Ovol2-A) significantly reduced 8xC/EBPα luciferase activity, while HA-OVOL2-B had no such inhibition (Figure 6H). C/EBPα is one of the major transcriptional activators during adipogenesis. We used the mouse 3T3-L1 cell line as a well-established cultured adipocyte system to study adipogenesis in vitro. To better test the roles of two different OVOL2 isoforms (OVOL2-A, OVOL2-B) and OVOL2boh mutants, we generated Ovol2 KO 3T3-L1 cells by CRISPR/Cas9 targeting and then re-introduced CRISPR resistant (CR) transgenes encoding WT OVOL2 or OVOL2boh versions of both isoforms. Although both WT and boh mutant OVOL2 proteins were expressed at similar levels (Figure 6K), when expressed throughout the differentiation period of 3T3-L1 cells (days 0–10), WT OVOL2-A dramatically inhibited adipogenesis as revealed by decreased Oil Red O staining and expression of mature adipocyte markers, while the boh mutant OVOL2-A had no such effect (Figures 6I–6K). Compared with OVOL2-A, OVOL2-B had a weak inhibitory effect (Figures 6I–6K). Notably, human OVOL2-A and OVOL2-B showed a similar trend of inhibition when overexpressed in primary human subcutaneous adipocytes, as indicated by decreased adipogenic gene expression (Figures S6D–S6F). Since OVOL2 interacted with the C-terminal portion of C/EBPα containing the bZIP domain (Figures 6D–6F), we hypothesized that OVOL2 binding occupies the DNA binding region of C/EBPα and thus inhibits the function of C/EBPα as an active transcription factor. Electrophoretic mobility shift assay (EMSA) showed that purified His-OVOL2 protein inhibited the binding of His-C/EBPα protein to a biotin-labeled DNA probe containing a classic C/EBPα binding motif (Figure 6L). Moreover, chromatin immunoprecipitation (ChIP) assay revealed that WT OVOL2 but not OVOL2boh inhibited the binding of C/EBPα to the promoter region of C/EBPα target genes Fabp4 and Glut4 in 3T3-L1 cells (Figures 6M and 6N). In Ovol2boh/− mice where there was no inhibition by OVOL2, the expression levels of Fabp4 and Glut4 were significantly increased in iWAT but not in iBAT (Figure 6O). Taken together, these findings indicate that OVOL2 blocks adipogenesis through direct inhibition of the transcriptional effects of C/EBPα.
Adipocyte-specific transgenic expression of OVOL2 reduces high-fat diet-induced obesity
The elevated fat weight of OVOL2 deficient mice (Ovol2boh/boh or Ovol2boh/−) was due to both adipocyte hypertrophy and hyperplasia (Figures S1D–S1G and S2M–S2P), and we sought to determine the effect of Ovol2 overexpression using a tetracycline responsive element (TRE)-driven Ovol2 transgene (TRE-Ovol2) (Figure 7A). An adiponectin promoter-driven reverse tetracycline-dependent transcriptional activator (Apn-rtTA) (Sun et al., 2012) was also used (Figure 7A). In the presence of doxycycline (Dox), rtTA binds TRE and activates Ovol2 expression (Figure 7A). We tested four TRE-Ovol2 founder lines with Apn-rtTA drivers after 4 weeks of high fat diet and Dox (HFD-Dox) feeding, and selected TG line #38015 because it showed the highest inducible TRE-Ovol2-derived mRNA (Figure S7A) and protein levels (Figure S7B) in iBAT, eWAT, and iWAT, but not in liver. 6-week-old mice expressing TRE-Ovol2 and Apn-rtTA transgenes were fed HFD-Dox for 12 weeks (Figure 7A) to induce adipocyte specific Ovol2 expression (Figure 7B). Before HFD-Dox feeding, the body weights of TRE-Ovol2; Apn-rtTA mice and Apn-rtTA littermates were similar. However, after 12 weeks HFD-Dox feeding, the body weights of TRE-Ovol2; Apn-rtTA mice averaged 22% lower than those of Apn-rtTA littermates (Figures 7C and 7D). MRS showed that TRE-Ovol2; Apn-rtTA mice had reduced ratios of fat to lean weight (Figure 7E) compared with Apn-rtTA littermates, which resulted from a 40% average reduction in absolute fat weight (Figure 7F) but no change in lean weight (Figure 7G). Necropsy revealed that adipose tissue beds (eWAT, iWAT, and iBAT) of TRE-Ovol2; Apn-rtTA mice were decreased in size relative to those in Apn-rtTA littermates (Figures 7H and S7C–S7E). H&E staining revealed slightly reduced size of adipocytes from iBAT and iWAT, but not from eWAT (Figures 7I–7N and S7F–S7G). Plotting of adipocyte volume to adipose tissue weight showed fewer adipocytes from iWAT and eWAT in TRE-Ovol2; Apn-rttA mice (Figures S7H and S7I). In addition to the decreased obesity, adipocyte-specific OVOL2 expression reduced both fasting glucose (Figure 7O) and insulin levels (Figure 7P). Presumably due to decreased adiposity, TRE-Ovol2; Apn-rtTA mice had less leptin in the serum (Figure 7Q). Adipocyte-specific OVOL2 overexpression also reduced fasting cholesterol levels (Figure 7R), while no significant differences in the fasting triglyceride levels were observed (Figure 7S). HFD-Dox induced large, pallid fatty livers in Apn-rtTA control mice whereas TRE-Ovol2; Apn-rtTA mice had smaller, reddish livers, with decreased lipid storage based on H&E and Oil Red O staining (Figures S7J–S7N). TRE-Ovol2; Apn-rtTA mice had increased energy expenditure at 23 °C (Figures 7T and 7U) with no change in RER and physical activities (Figures 7V and S7O–S7R). When the housing temperature decreased from 30 °C to 6 °C within a 12 h period, TRE-Ovol2; Apn-rtTA mice increased energy expenditure to a greater extent compared with Apn-rtTA control mice (Figures 7W and 7X). Moreover, both UCP1 protein level detected by immunohistochemical staining (Figure 7Y) and Ucp1 mRNA level (Figure 7Z) were increased in BAT from TRE-Ovol2; Apn-rtTA mice. These findings indicate that OVOL2 overexpression in adipocytes limits high fat diet-induced obesity and adiposity in mice.
Figure 7. OVOL2 overexpression in adipocyte reduces HFD-induced obesity in mice.
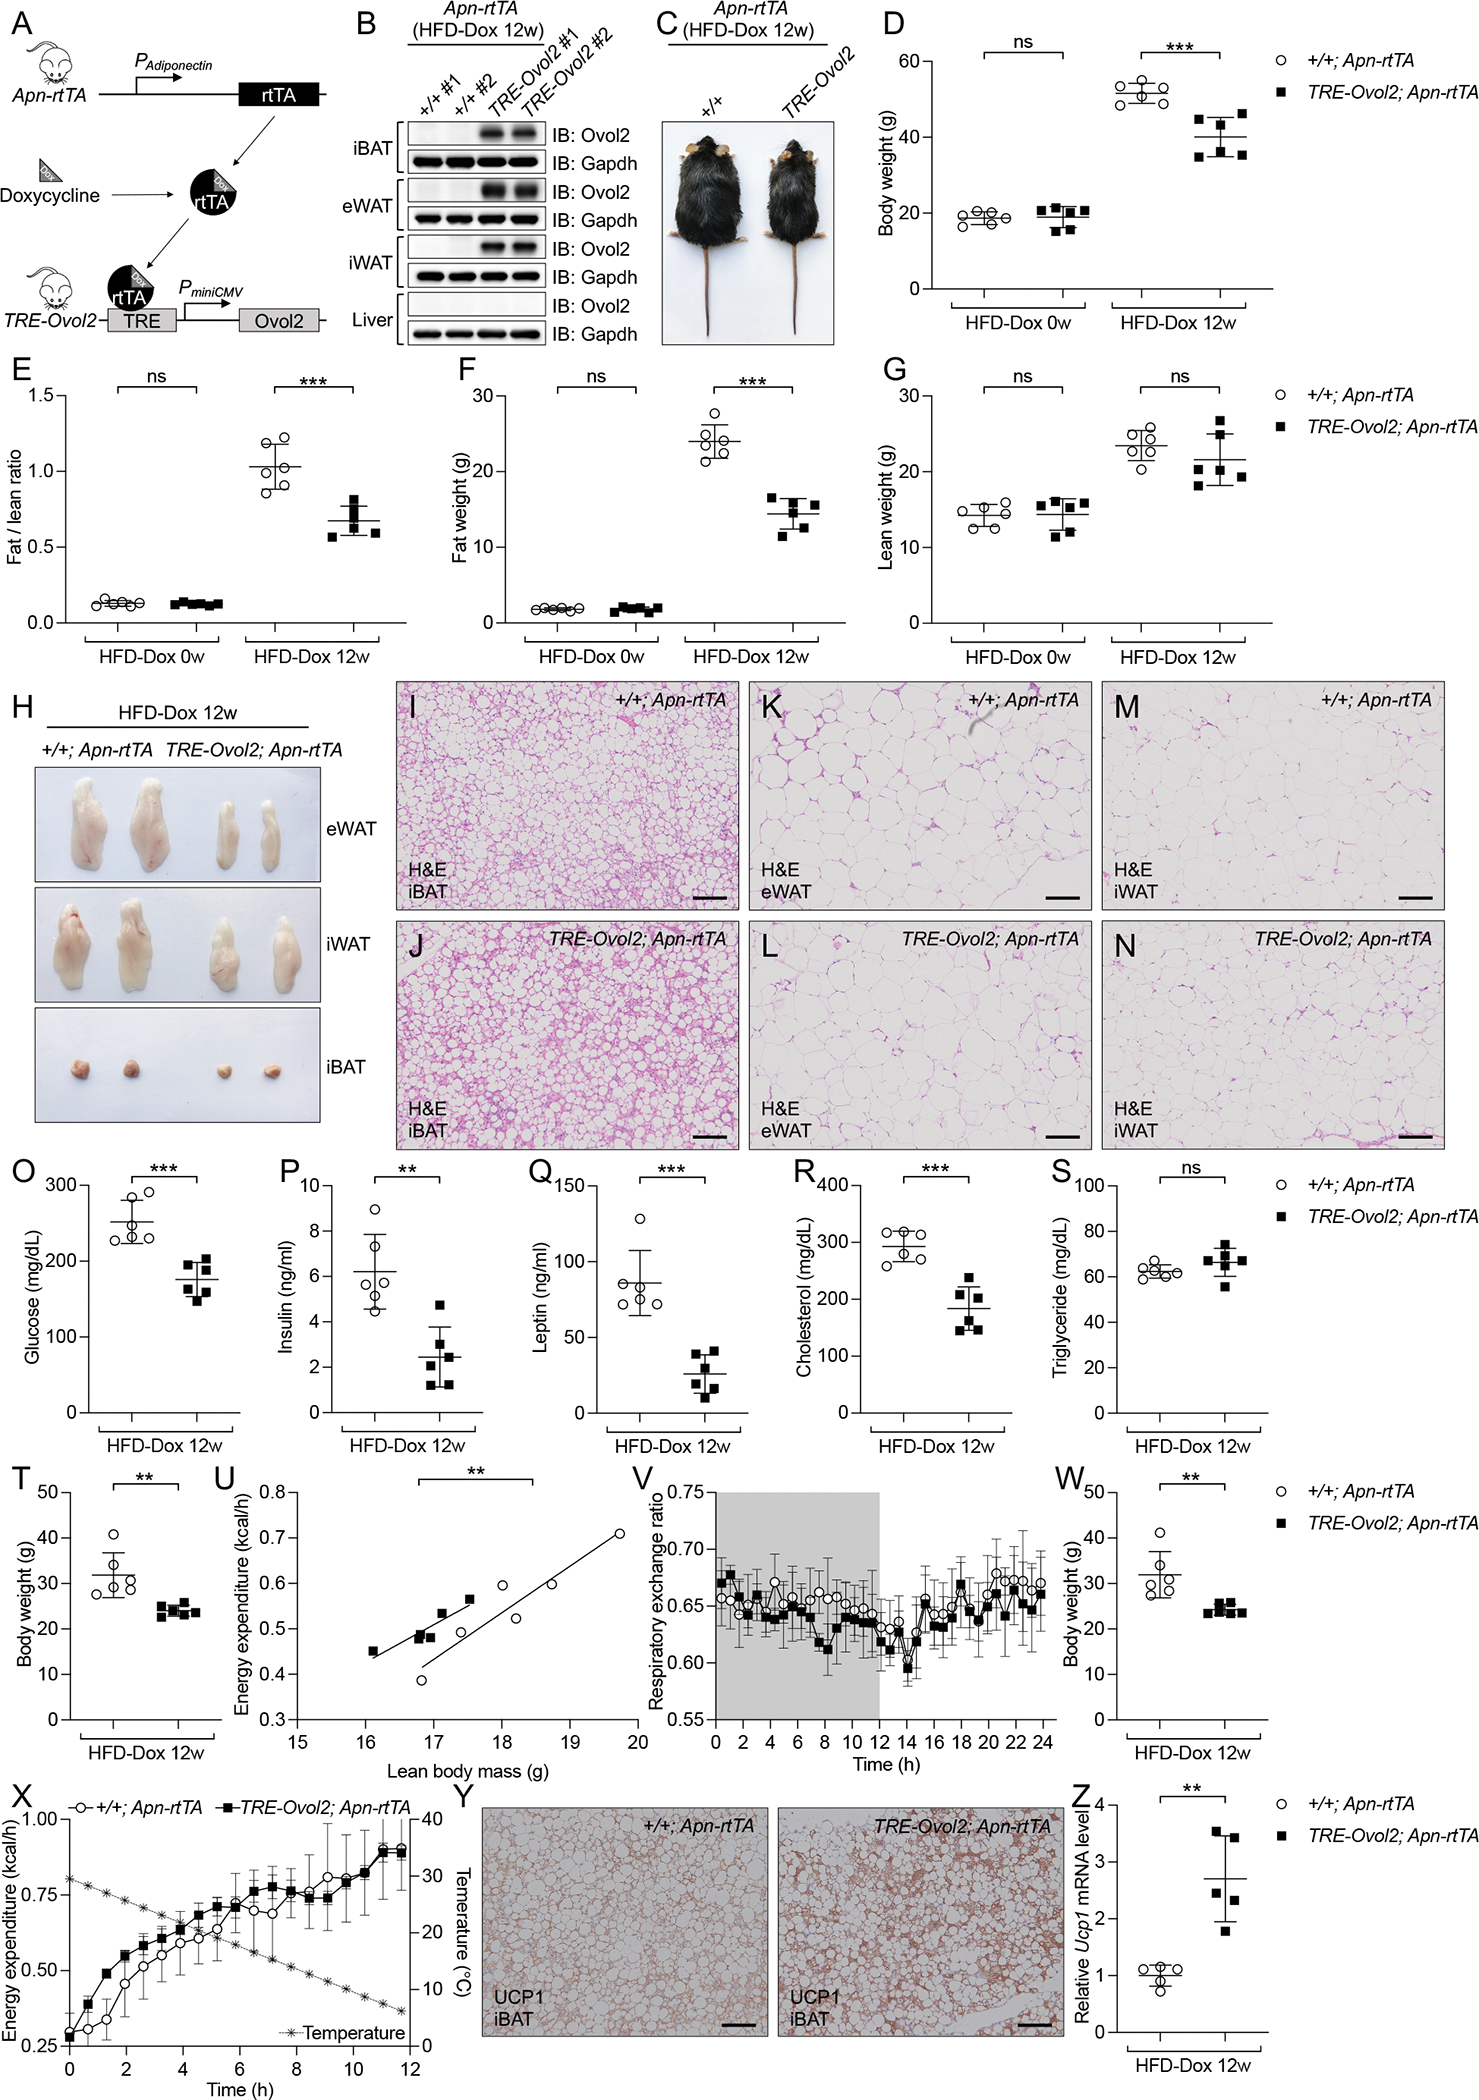
(A) Generation of adipocyte-specific OVOL2 expression mouse model induced by doxycycline and experimental design of TRE-Ovol2; Apn-rtTA mice feeding with HFD and doxycycline.
(B) Immunoblots of lysates of two TRE-Ovol2; Apn-rtTA mice and two Apn-rtTA littermates under HFD-Dox feeding for 12 weeks.
(C) Photograph of a male TRE-Ovol2; Apn-rtTA mice and Apn-rtTA littermate under HFD-Dox feeding for 12 weeks.
(D-G) Body weight (D), fat to lean weight ratio (E), fat weight (F), and lean weight (G) of mice under HFD-Dox feeding for 12 weeks.
(H) Representative photographs of eWAT, iWAT, and iBAT from mice under HFD-Dox feeding for 12 weeks.
(I-N) H&E staining of sections from different adipose tissues of male mice under HFD-Dox feeding for 12 weeks.
(O-S) Serum glucose (O), insulin (P), leptin (Q), cholesterol (R), and triglyceride (S) in 12 weeks HFD-Dox feeding mice after a 6-h fast.
(T) Body weight of 18-week-old mice fed HFD-Dox chow for 12 weeks (n=6) used for metabolic cage experiments in U and V.
(U and V) Metabolic cage measurement of energy expenditure (U) and respiratory exchange ratio (V) by 18-week-old mice fed HFD-Dox chow for 12 weeks (n=6) and housed at 23 °C. Dark color indicates dark phase when light was off.
(W) Body weight of 18-week-old mice fed HFD-Dox chow for 12 weeks (n=6) used for metabolic cage experiments in X.
(X) Metabolic cage measurement of energy expenditure by 18-week-old mice fed HFD-Dox chow for 12 weeks (n=6) and housed at 30 °C. Dark color indicates dark phase when light was off.
(Y) UCP1 staining of sections from iBAT of 18-week-old mice fed HFD-Dox chow for 12 weeks. Scale bar: 100 μm.
(Z) Relative Ucp1 mRNA level in iBAT of 18-week-old mice fed HFD-Dox chow for 12 weeks (mRNA level was normalized to Polr2a).
Data are presented as means ± SD. P values were determined by Student’s t test (D-G, O-T, W, and Z). A linear correlation with a two-tailed comparison of slope and intercept was calculated and compared between different mouse groups (U). P values are denoted by ** P ≤ 0.01; *** P ≤ 0.001; **** P ≤ 0.0001; ns, not significant with P > 0.05. Data points represent individual mice (D-G, O-U, W, and Z). Data are representative of two independent experiments (B-G, O-S, Z) or one experiment (H-N, T-Y).
See also Figure S7.
Discussion
Here we have shown that OVOL2 inhibits adipogenesis in vivo and in cultured cells. Adipogenesis is controlled by several key transcription factors, including PPARγ and C/EBPα, which drive the expression of hundreds of adipogenic genes (Rosen et al., 2002; Wu et al., 1999). By directly interacting with the bZIP domains of C/EBPα, OVOL2 limits the DNA binding and transactivation ability of C/EBPα. Thus, Ovol2boh/boh or Ovol2boh/− mice possessed enlarged adipose tissue beds containing elevated numbers of cells, and mice developed increased fat at the expense of lean tissue, insulin resistance, and diabetes. Consistent with this, adipose-specific overexpression of OVOL2 reduced HFD-induced obesity, fat weight gain, and levels of glucose and insulin in the blood. In addition, the livers of transgenic TRE-Ovol2; Apn-rtTA mice fed HFD-Dox appeared to contain less fat than those of control mice on the same diet. This phenotype may be an indirect effect resulting from the absence, under conditions of OVOL2 overexpression, of adipocyte hypertrophy and hyperplasia, which cause increased circulating free fatty acids that are taken up by the liver.
In addition and somewhat paradoxically, we found that OVOL2 is necessary for the development of brown adipocytes, and 16-week-old Ovol2boh/boh or Ovol2boh/− mice displayed reduced expression of brown adipocyte markers (both the quantity of cells expressing them [Figures 5A and 5B] and their expression levels [Figure 5E]), which resulted in impaired thermogenesis after acute cold stress. Moreover, thermogenesis was also impaired in Ovol2boh/− mice in response to NA treatment, indicating defective brown fat function. In 5-week-old non-obese Ovol2boh/boh mice, brown adipocyte marker expression was relatively normal and acute cold stress was well tolerated.
The fact that acute cold tolerance was normal but that iWAT Ucp1 expression induced by chronic cold stress was impaired at this age may indicate that longer term adaptations involving changes in gene expression programs are affected in Ovol2boh/boh mice, whereas acute functions of those brown adipocytes that exist in Ovol2boh/boh mice are intact. The ambient temperature of our vivarium provides a chronic cold stress that results in a defective brown and beige adipose tissues as mice become old. The defective thermogenesis causes the initial energy imbalance in OVOL2 deficient mice which became obese since 9–10 weeks of age. We hypothesize that the increased body weight caused by reduced energy expenditure leads to a proportional increase in food intake, which exacerbates in a feed forward manner the weight gain in OVOL2 deficient mice. Asprosin is secreted by adipocytes and stimulates feeding (Duerrschmid et al., 2017), and this orexigenic hormone or others like it may link the increases in adipose tissue and food consumption in OVOL2 deficient mice. Consistent with the hypothesis, we noted that all observed phenotypes were age-dependent and progressive, with mice less than 6 weeks of age being phenotypically normal. A recent study has suggested the importance of C/EBPα in white adipogenesis in adult mice (Wang et al., 2015a), and it is possible that this age dependent effect also contributes to the progressive phenotype in Ovol2boh/boh and Ovol2boh/− mice.
We have shown that OVOL2 functions as an inhibitor of C/EBPα, explaining the hyperplasia of WAT in OVOL2 deficient mice. Yet we also find that OVOL2 plays a positive role in BAT development that we do not fully understand. Brown and white adipocytes are believed to develop from distinct progenitors, and it remains possible that OVOL2 performs different functions in these two lineages. In Myf5− progenitors of white adipocytes, OVOL2 may restrict the activity of C/EBPα as described above; this would be consistent with published evidence that C/EBPα regulates white but not brown adipose tissue differentiation in vivo (Linhart et al., 2001; Wang et al., 1995; Yang et al., 2005). Myf5+ progenitors give rise to both muscle progenitor cells and brown adipocytes (Kajimura et al., 2009; Seale et al., 2008), in which Myf5 and Pax7 must be downregulated to drive the brown adipocyte fate (An et al., 2017; Buckingham and Relaix, 2015). Because OVOL2 is known to function as a transcriptional repressor (Watanabe et al., 2014), a possibility is that OVOL2 functions to repress Myf5 and/or Pax7, thereby promoting brown adipocyte differentiation. Finally, we noted that a significant fraction of adipocytes within brown adipose tissue beds show a resemblance to white adipocytes in terms of size and the presence of a single large lipid droplet, suggesting the possibility that OVOL2 may preferentially inhibit white adipogenesis and promote brown adipogenesis.
Mouse OVOL2 protein is 83% identical to human OVOL2; highly similar homologs are also found in other vertebrates. The similar inhibition by human OVOL2 of adipogenic genes suggests the role of OVOL2 in body weight maintenance is likely conserved in humans. Interestingly, three SNPs (rs16978956, P value=3×10⁻⁹; rs7274963, P value=2×10⁻⁹; rs2228273, P value=6×10⁻¹⁴) in ZNF133, a gene ~300 kb from OVOL2, were strongly associated with BMI (Akiyama et al., 2017; Turcot et al., 2018), although their effects on OVOL2 are not known. We reasoned that the lack of SNPs in OVOL2 might be due to the critical role of OVOL2 during embryonic development. Considering the similar process of brown/beige thermogenesis and C/BEPα mediated adipogenesis between mice and humans, our findings are very likely relevant in humans. By expending excess energy stores, the activation of brown adipocytes has been proposed as a therapy for obesity. Because OVOL2 may promote the brown adipocyte fate while simultaneously limiting adipocyte differentiation in general, agonist activation may be useful for this purpose. In addition, OVOL2 may limit adipocyte differentiation as it occurs in response to chronic overfeeding. The regulation of OVOL2 activity therefore emerges as a topic for further inquiry.
Limitations of study
This study demonstrates that OVOL2 deficient mice are cold intolerant with a defect of brown adipose tissue contributing to reduced nonshivering thermogenesis. We cannot exclude the possibility that muscle mediated shivering thermogenesis is also affected by OVOL2 deficiency. Our study reveals dual roles of OVOL2 in brown and white adipose tissue development and function. The contribution of these two adipose tissues to boh obesity is limited by the whole-body KO or mutant mice used in our study and remains incompletely understood. To corroborate and extend these findings and to rule out thermogenic mechanisms outside of brown adipose tissues, future works will involve tissue/cell type specific Ovol2 deletion. Although we found C/EBPα as an OVOL2 interacting protein in white adipocytes, we do not fully understand the role of OVOL2 in brown adipose tissues. The mechanism of OVOL2 in promoting brown adipocyte development and/or function is an area we are actively investigating.
STAR Methods
Resource Availability
Lead Contact
Further information and requests for reagents may be directed to and will be fulfilled by the Lead Contact, Zhao Zhang (Zhao.Zhang@UTSouthwestern.edu).
Materials Availability
All unique reagents generated in this study are available from the Lead Contact with a completed Materials Transfer Agreement.
Data and Code Availability
All data generated in this study are available in the main text and supplementary information. Original western blot images and analyzed data are available as Data S1.
This paper does not report original code.
Any additional information required to reanalyze the data reported in this paper is available from the lead contact upon request.
Experimental Model and Subject Details
Mice
C57BL/6J mice (stock# 000664) and the ob strain (B6.Cg-Lepob/J, stock# 000632) were purchased from The Jackson Laboratory. The boh strain (C57BL/6J-Ovol2boh) was generated by ENU mutagenesis and is described at http://mutagenetix.utsouthwestern.edu. Heterozygous Ovol2 knockout (Ovol2+/−) mice were generated in our laboratory using the CRISPR/Cas9 system as described previously (Ran et al., 2013) with the Ovol2 small base-pairing guide RNA (sgRNA). Compound heterozygous mice for the boh allele and the null allele (Ovol2boh/−) were generated by breeding. The TRE-Ovol2 transgenic mice were generated in our laboratory using standard techniques. The Apn-rtTA transgenic mice were kindly provided by Dr. Philipp Scherer (University of Texas Southwestern Medical Center). TRE-Ovol2; Apn-rtTA mice were generated by breeding hemizygous TRE-Ovol2 mice with homozygous Apn-rtTA mice. Both male and female mice from 5 weeks to 24 weeks of age were used in the study. Sexes and ages of the mice are specified in the description of each experiment and included in the figure legends of the corresponding experiments. Littermate controls were used in the study and are specified in the results and the figure legends. All mice were fed standard chow diet (2016 Teklad Global 16% Protein Rodent Diet) except mice with diet-induced obesity, which were fed with high-fat diet (60 kcal% fat) with 625mg Doxycycline/kg (D11051103, Research Diets) from 6 weeks of age. All mice were housed at room temperature (23°C) unless indicated. Mice were observed daily to ensure good health status. Mice were maintained at the University of Texas Southwestern Medical Center and studies were performed in accordance with institutionally approved protocols. All experiments in this study were approved by the University of Texas Southwestern Medical Center Institutional Animal Care and Use Committee.
Cell Culture, Transfection, and Infection
The 293T cells were purchased from American Type Culture Collection (ATCC) and grown at 37 °C in DMEM (Life Technologies)/10% (vol/vol) FBS (ATCC)/antibiotics (Life Technologies) in 5% CO2. Transfection of plasmids was carried out using Lipofectamine 2000 (Life Technologies) according to the manufacturer’s instructions. Cells were harvested between 36 and 48 h posttransfection. The primary human subcutaneous pre-adipocytes were purchased from ATCC and maintained/differentiated with the standard medium purchased from ATCC. The 3T3-L1 cells were purchased from ATCC and grown at 37 °C in DMEM (Life Technologies)/10% (vol/vol) calf serum (ATCC)/antibiotics (Life Technologies) in 5% CO2. Infections of 3T3-L1 cells and primary human subcutaneous pre-adipocytes were carried out using a 3rd generation lentiviral system packaged in 293T cells. The Ovol2 KO 3T3-L1 cells were generated with sgRNA constructed in pLentiCRISPR-v2 vector. Isolation and separation of murine primary adipocytes from different adipose tissues (iBAT, eWAT, and iWAT) was performed as previously described (Viswanadha and Londos, 2008).
Method Details
Metabolic Analysis of Mice
Mice were fasted for 6 h (7:00 AM–1:00 PM) for glucose tolerance tests (GTT) and insulin tolerance tests (ITT). Blood glucose was tested with the AlphaTRAK glucometer and test strips. After the measurement of the first blood glucose, the GTT was initiated by i.p. injection with 10% glucose solution (1 g/kg; Sigma-Aldrich) and blood glucose was measured at set time points over the next 2 h. The ITT was initiated by i.p. injection with human insulin (0.75 U/kg; Sigma-Aldrich) and blood glucose was measured at set time points over the next 2 h. MRS of live mice was measured by EchoMRI Body Composition Analyzers with default settings. Internal temperatures of mice were obtained through implanting a temperature transponder (IPTT-300) under the skin, and measured with a portable reader (DAS-8007-IUS, BioMedic Data Systems). For acute cold exposure, mice were singly housed in 6 °C cold chambers in the absence of food, and body temperature was measured at the indicated time points. For exposure to decreasing temperature, mice that were housed long-term at 23°C were moved to temperature controlled chambers and the temperature was acutely increased to 30°C and then decreased incrementally to 6°C over 12 h. For chronic cold exposure, mice were singly housed in 6 °C cold chambers with free access to food for a total of 10 days. CL316,243 was i.p. injected at the dose of 1 mg/kg body weight daily for a total of 10 days. Metabolic cage measurement was performed on TSE PhenoMaster system. Mice were acclimatized for 5 days in metabolic cages before the actual measurement. NA (A9512, Sigma-Aldrich) was i.p injected at a dose of 1 mg/kg body weight.
Serum Chemistries and ELISA
Mice were fasted for 6 h (7:00 AM–1:00 PM) for all blood sample collections. ELISA kits were used to measure insulin (Crystal Chem) and leptin (Crystal Chem) in the serum according to the manufacturer’s instructions. Triglyceride was measured with Infinity Triglycerides Liquid Stable Reagent (Thermo Fisher Scientific). Matrix Plus Chemistry Reference Kit (Verichem Laboratories) was used as the standard for triglyceride measurement. Cholesterol was measured with Infinity Cholesterol Liquid Stable Reagent (Thermo Fisher Scientific). Matrix Plus Cholesterol Reference Kit (Verichem Laboratories) was used as the standard for cholesterol measurement.
Immunohistochemistry and Immunostaining
Samples for routine histology and special stains were harvested from anesthetized mice and fixed according to standard procedures (Sheehan and Hrapchak, 1980; Woods and Ellis, 1996) with modifications for tissue size and stains. Samples for routine Hematoxylin and Eosin (H&E) staining and UCP1 staining were fixed for 48 h in 10% (vol/vol) neutral-buffered formalin and stored briefly in 50% (vol/vol) ethanol, and samples for Oil Red O (ORO) staining were fixed in methanol-free 4% (vol/vol) paraformaldehyde for 48 h before equilibration in 18% (wt/vol) sucrose. Subsequent paraffin processing and embedding (H&E, UCP1) and cryoembedding (ORO) were carried out, and sections were cut on a rotary microtome and cryostat, respectively. The resulting sections were stained for routine histopathological evaluation by regressive H&E on a Sakura Finetek DRS-601 robotic staining system using Leica SelecTech reagents (hematoxylin 560 and alcoholic eosin Y 515). The resulting sections were stained for UCP1 with a rabbit polyclonal antibody (Abcam, ab10983) at 1:600 dilution. ORO staining was performed manually according to established protocols. For immunostaining, 3T3-L1 cells cultured in chambers were washed with PBS and fixed in freshly made 4% (vol/vol) formaldehyde in PBS buffer at room temperature for 10 min, then washed again with PBS, treated with PBST [PBS and 0.25% (vol/vol) Triton X-100] for permeabilization, and blocked with PBSA [PBS and 1% (wt/vol) BSA] for 15 min. Cells were incubated with primary antibody diluted in PBSA overnight at 4 °C, then washed with PBS and incubated with secondary antibody diluted in PBSA for 30 min at room temperature, and finally mounted in mounting medium (Life Technologies).
Adipocyte Differentiation and Oil Red O Staining
For adipocyte differentiation, 2-d post-confluent cells (day 0) were treated with 293T grown medium containing 10 μg/mL insulin, 1 μM dexamethasone, and 0.5 mM IBMX (all from Sigma-Aldrich). On day 2, cells were changed to medium containing 10 μg/mL insulin (Sigma-Aldrich). From day 4, cells were maintained in growth medium, which was changed every other day. 3T3-L1 cells were fully differentiated and harvested at day 10. Oil Red O staining was performed with a lipid staining kit (BioVision) and quantified by measuring optical density at 492 nm (OD492).
Luciferase, Seahorse, and Lipolysis Assay
8xC/EBPα luciferase reporter assay was performed with a Steady-Glo Luciferase Assay System (E2510, Promega). For Seahorse analysis, freshly isolated adipose tissues were weighed and cut into small pieces and incubated in a Seahorse XFe24 islet capture microplate. Seahorse analysis was performed on a XFe24 Analyzer (Agilent) with the following concentrations of different compounds: oligomycin (20 μM), FCCP (80 μM), rotenone (30 μM), and antimycin-A (1 μM). For lipolysis assay, fresh isolated adipose tissues were weighed and incubated at 37 °C in low glucose DMEM (Life Technologies)/4% (wt/vol) Fatty acid free BSA (Sigma-Aldrich) in 5% CO2 with different concentration of CL316,243 for 1 h. After incubation, free glycerol content of the medium was determined using Free Glycerol Reagent (F6428, Sigma-Aldrich) and glycerol standard solutions (Sigma-Aldrich).
Sample Preparation, Immunoprecipitation, GST Pull-down, and Western Blot Analysis
For regular western blot analysis, cells were harvested in 1× NuPAGE LDS sample buffer (Life Technologies) with 2.5% (vol/vol) 2-mercaptoethanol (Sigma-Aldrich). For regular immunoprecipitation, cells were lysed in Nonidet P-40 lysis buffer [50 mM Tris-Cl, pH 8.0, 0.1 M NaCl, 10 mM sodium fluoride, 1 mM sodium vanadate, 1% (vol/vol) Nonidet P-40, 10% (vol/vol) glycerol, 1.5 mM EDTA, and Protease Inhibitor Mixture] for 30 min at 4 °C. After centrifugation, lysates were incubated with Flag antibody-conjugated beads for 2 h at 4 °C. Beads were washed three times with 1 mL of Nonidet P-40 lysis buffer and then eluted with 3xFlag peptides for 30 min at 4 °C. For immunoprecipitation for mass spectrometric analysis, the procedure was almost the same except for the increased cell number and lysis time. Mass spectrometric analysis was performed as previously described (Zhang et al., 2016). GST fusion proteins were produced in Escherichia coli BL21 and purified with glutathione agarose beads (GE Healthcare). His fusion proteins were produced in Escherichia coli BL21 and purified with Ni-NTA agarose beads (QIAGEN). GST fusion protein-loaded beads were incubated with eluted His fusion proteins in GST pull-down buffer [20 mM Tris-Cl, pH 8.0, 200 mM NaCl, 1 mM EDTA, 0.5% (vol/vol) Nonidet P-40, and PMSF] at 4 °C for 1 h. The beads were washed three times with GST pull-down buffer, followed by western blot analysis. In a typical Western blot, samples were resolved by NuPAGE 4–12% (wt/vol) Bis-Tris gels (Thermo Fisher Scientific), transferred to NC membranes (Bio-Rad), blotted with the primary antibody at 4 °C overnight and the secondary antibody for 1 h at room temperature, and then visualized by chemiluminescent substrate (Thermo Fisher Scientific).
RNA Isolation, Reverse Transcription, and RT-qPCR
Tissue samples or cells were lysed in TRIzol (Invitrogen) for RNA isolation following a standard protocol, and 1 μg of RNA was used for reverse transcription by SuperScript III First-Strand Synthesis SuperMix (Life Technologies). RT-qPCR was performed with ABI StepOnePlus with Powerup SYBR Green Master Mix (Life Technologies). The 2−ΔΔCt method was used for relative quantification. The primer pairs used in RT-qPCR are listed in Table S1.
EMSA and ChIP Assay
EMSA was carried out using LightShift Chemiluminescent EMSA Kit (Thermo Fisher Scientific) according to the manufacturer’s instructions. The sequence of C/EBPα target DNA is 5’-AAGCTGCAGATTGCGCAATCTGCAGCTT-3’. Target DNA was synthesized as single-stranded DNA with biotin labeling on the 5’ end, and then boiled and slowly cooled down to form double-stranded DNA for use in EMSA. In brief, the following components were mixed in 20 μL binding reactions: ultrapure water, binding buffer (1x), poly (dI-dC) (50 ng/μL), unlabeled target DNA (4 pmol), purified proteins, and biotin-labeled target DNA (20 fmol). After incubation at room temperature for 20 min, 5 μL 5x loading buffer was added to each 20 μL binding reaction. Samples were loaded into a 6% DNA retardation gel (Invitrogen) for electrophoresis and then transferred to a nylon membrane for UV crosslinking and biotin-labeled DNA detection by chemiluminescence. ChIP was carried out using SimpleChIP Plus Enzymatic Chromatin IP Kit (Cell Signaling Technology) according to the manufacturer’s instructions. In brief, fully differentiated 3T3-L1 adipocytes were fixed with formaldehyde and nuclei pellets were digested with nuclease. Control mouse IgG and mouse anti-Flag IgG were used for IP reactions. After washes, chromatin was eluted from the beads and crosslinks were reversed. DNA was purified with spin columns and analyzed by real-time PCR. The primer pairs used here are listed in Table S1.
Quantification and Statistical Analysis
Data are presented as mean ± SD in all graphs depicting error bars. The statistical significance of differences between experimental groups was determined by Student’s t test or one-way ANOVA with Tukey’s multiple comparison test using GraphPad Prism 9. The quantification of size and number of adipocytes was adapted from (Parlee et al., 2014). Image J 1.53k was used to analyze adipose histology images. A linear correlation with a two-tailed comparison of slope and intercept was calculated and compared between different mouse groups. No statistical method was used to determine whether the data met assumptions of the statistical approach.
Supplementary Material
Data S1. Unprocessed data underlying the display items in the manuscript, related to Figures 1–7 and S1–S7.
KEY RESOURCES TABLE.
| REAGENT or RESOURCE | SOURCE | IDENTIFIER |
|---|---|---|
| Antibodies | ||
| Anti-UCP1 | Abcam | ab10983; RRID: AB_2241462 |
| Anti-HA | Sigma-Aldrich | H9658; RRID: AB_260092 |
| Anti-Flag | Sigma-Aldrich | P2983; RRID: AB_439685 |
| Anti-His | Sigma-Aldrich | H1029; RRID: AB_260015 |
| Anti-Ovol2 | Thermo Fisher Scientific | PA5-41619; RRID: AB_2605752 |
| Anti-Gapdh | Cell Signaling Technology | 5174; RRID: AB_10622025 |
| Anti-β-Actin | Cell Signaling Technology | 8457; RRID: AB_10950489 |
| Anti-PPARγ | Cell Signaling Technology | 2435; RRID: AB_2166051 |
| Anti-C/EBPα | Cell Signaling Technology | 8178; RRID: AB_11178517 |
| Anti-FAS | Cell Signaling Technology | 3180; RRID: AB_2100796 |
| Anti-ACC | Cell Signaling Technology | 3676; RRID: AB_2219397 |
| Anti-UCP1 | Cell Signaling Technology | 14670; RRID: AB_2687530 |
| Anti-OPA1 | Cell Signaling Technology | 80471; RRID: AB_2734117 |
| Anti-TOM20 | Cell Signaling Technology | 42406; RRID: AB_2687663 |
| Anti-COX IV | Cell Signaling Technology | 4850; RRID: AB_2085424 |
| Anti-Adiponectin | Cell Signaling Technology | 2789; RRID: AB_2221630 |
| Bacterial and Virus Strains | ||
| E. coli BL21 (DE3) | Thermo Fisher Scientific | C600003 |
| Chemicals, Peptides, and Recombinant Proteins | ||
| HFD-Dox | Research Diets | D11051103 |
| Insulin | Sigma-Aldrich | I9278 |
| CL316,243 | Sigma-Aldrich | C5976 |
| Dexamethasone | Sigma-Aldrich | D4902 |
| IBMX | Sigma-Aldrich | I7018 |
| Glutathione Sepharose 4B | GE Healthcare | 17075601 |
| Ni-NTA Agarose | QIAGEN | 30210 |
| 3xFlag Peptide | Sigma-Aldrich | F4799 |
| Norepinephrine | Sigma-Aldrich | A9512 |
| Critical Commercial Assays | ||
| Insulin ELISA Kit | Crystal Chem | 90080 |
| Leptin ELISA Kit | Crystal Chem | 90030 |
| Triglycerides Liquid Stable Reagent | Thermo Fisher Scientific | TR22421 |
| Cholesterol Liquid Stable Reagent | Thermo Fisher Scientific | TR13421 |
| Steady-Glo Luciferase Assay System | Promega | E2510 |
| LightShift Chemiluminescent EMSA Kit | Thermo Fisher Scientific | 20148 |
| SimpleChIP Plus Enzymatic Chromatin IP Kit | Cell Signaling Technology | 9005 |
| Deposited Data | ||
| Data S1 | This paper | Unprocessed source data underlying all blots and graphs |
| Experimental Models: Cell Lines | ||
| 293T | ATCC | CRL-3216 |
| 3T3-L1 | ATCC | CL-173 |
| Human pre-adipocytes | ATCC | PCS-210-010 |
| Experimental Models: Organisms/Strains | ||
| Mouse: C57BL/6J | The Jackson Laboratory | 000664 |
| Mouse: B6.Cg-Lepob/J | The Jackson Laboratory | 000632 |
| Mouse: C57BL/6J-Ovol2boh | This paper | N/A |
| Mouse: C57BL/6J-Ovol2+/− | This paper | N/A |
| Mouse: TRE-Ovol2 | This paper | N/A |
| Mouse: Apn-rtTA | Sun et al., 2012 | N/A |
| Oligonucleotides | ||
| sgRNA targeting sequence: Ovol2 KO mice: AGAGTTGTCGCATGTGCCGG | This paper | N/A |
| sgRNA targeting sequence: Ovol2 KO cells #1: CACGACGCCCAAGGCACCGA | This paper | N/A |
| sgRNA targeting sequence: Ovol2 KO cells #2: GAAGACTGCCGCAGCGACGG | This paper | N/A |
| Primers used for quantitative PCR | Table S1 in this paper | N/A |
| Software and Algorithms | ||
| GraphPad Prism 9 | GraphPad Software | https://www.graphpad.com |
| Image J | NIH Image J | https://imagej.nih.gov/ij/index.html |
Highlights.
A viable hypomorphic allele of Ovol2 (Ovol2boh, p.C120Y) causes obesity in mice
Obesity in Ovol2boh/boh develops with no hyperphagia and reduced energy expenditure
OVOL2 deficient mice are cold intolerant with defective brown/beige adipose tissues
OVOL2 inhibits transcriptional activity of C/EBPα and suppresses white adipogenesis
Acknowledgments
We thank the Metabolic Phenotyping, Histo Pathology, Mass Spectrometry, and Transgenic Cores of the University of Texas Southwestern Medical Center for providing excellent services. We thank Dr. Philipp Scherer and Dr. Yu An at the University of Texas Southwestern Medical Center for providing Apn-rtTA mice and helping with Seahorse analysis. This work was supported by National Institutes of Health K99 DK115766 (Z.Z.), R00 DK115766 (Z.Z.), R01 AI125581 (B.B.), and U19 AI100627 (B.B.), and the Lyda Hill foundation (B.B.).
Footnotes
Declaration of Interests
Z.Z., L.S. and B.B. are inventors on a patent related to these findings. The other authors declare no competing interests.
Publisher's Disclaimer: This is a PDF file of an unedited manuscript that has been accepted for publication. As a service to our customers we are providing this early version of the manuscript. The manuscript will undergo copyediting, typesetting, and review of the resulting proof before it is published in its final form. Please note that during the production process errors may be discovered which could affect the content, and all legal disclaimers that apply to the journal pertain.
References
- Akiyama M, Okada Y, Kanai M, Takahashi A, Momozawa Y, Ikeda M, Iwata N, Ikegawa S, Hirata M, Matsuda K, et al. (2017). Genome-wide association study identifies 112 new loci for body mass index in the Japanese population. Nat Genet 49, 1458–1467. 10.1038/ng.3951. [DOI] [PubMed] [Google Scholar]
- An Y, Wang G, Diao Y, Long Y, Fu X, Weng M, Zhou L, Sun K, Cheung TH, Ip NY, et al. (2017). A Molecular Switch Regulating Cell Fate Choice between Muscle Progenitor Cells and Brown Adipocytes. Dev Cell 41, 382–391 e385. 10.1016/j.devcel.2017.04.012. [DOI] [PubMed] [Google Scholar]
- Bai R, Kusama K, Nakamura K, Sakurai T, Kimura K, Ideta A, Aoyagi Y, and Imakawa K (2018). Down-regulation of transcription factor OVOL2 contributes to epithelial-mesenchymal transition in a noninvasive type of trophoblast implantation to the maternal endometrium. FASEB J, fj201701131RR. 10.1096/fj.201701131RR. [DOI] [PubMed] [Google Scholar]
- Buckingham M, and Relaix F (2015). PAX3 and PAX7 as upstream regulators of myogenesis. Semin Cell Dev Biol 44, 115–125. 10.1016/j.semcdb.2015.09.017. [DOI] [PubMed] [Google Scholar]
- Chouchani ET, Kazak L, and Spiegelman BM (2019). New Advances in Adaptive Thermogenesis: UCP1 and Beyond. Cell Metab 29, 27–37. 10.1016/j.cmet.2018.11.002. [DOI] [PubMed] [Google Scholar]
- Duerrschmid C, He Y, Wang C, Li C, Bournat JC, Romere C, Saha PK, Lee ME, Phillips KJ, Jain M, et al. (2017). Asprosin is a centrally acting orexigenic hormone. Nat Med 23, 1444–1453. 10.1038/nm.4432. [DOI] [PMC free article] [PubMed] [Google Scholar]
- Farmer SR (2006). Transcriptional control of adipocyte formation. Cell Metab 4, 263–273. 10.1016/j.cmet.2006.07.001. [DOI] [PMC free article] [PubMed] [Google Scholar]
- Ghaben AL, and Scherer PE (2019). Adipogenesis and metabolic health. Nat Rev Mol Cell Biol 20, 242–258. 10.1038/s41580-018-0093-z. [DOI] [PubMed] [Google Scholar]
- Gray SL, and Vidal-Puig AJ (2007). Adipose tissue expandability in the maintenance of metabolic homeostasis. Nutr Rev 65, S7–12. 10.1111/j.1753-4887.2007.tb00331.x. [DOI] [PubMed] [Google Scholar]
- Ingalls AM, Dickie MM, and Snell GD (1950). Obese, a new mutation in the house mouse. J Hered 41, 317–318. 10.1093/oxfordjournals.jhered.a106073. [DOI] [PubMed] [Google Scholar]
- Kajimura S, Seale P, Kubota K, Lunsford E, Frangioni JV, Gygi SP, and Spiegelman BM (2009). Initiation of myoblast to brown fat switch by a PRDM16-C/EBP-beta transcriptional complex. Nature 460, 1154–1158. 10.1038/nature08262. [DOI] [PMC free article] [PubMed] [Google Scholar]
- Kumar A, Bhandari A, Sinha R, Sardar P, Sushma M, Goyal P, Goswami C, and Grapputo A (2012). Molecular phylogeny of OVOL genes illustrates a conserved C2H2 zinc finger domain coupled by hypervariable unstructured regions. PLoS One 7, e39399. 10.1371/journal.pone.0039399. [DOI] [PMC free article] [PubMed] [Google Scholar]
- Lee B, Villarreal-Ponce A, Fallahi M, Ovadia J, Sun P, Yu QC, Ito S, Sinha S, Nie Q, and Dai X (2014). Transcriptional mechanisms link epithelial plasticity to adhesion and differentiation of epidermal progenitor cells. Dev Cell 29, 47–58. 10.1016/j.devcel.2014.03.005. [DOI] [PMC free article] [PubMed] [Google Scholar]
- Lepper C, and Fan CM (2010). Inducible lineage tracing of Pax7-descendant cells reveals embryonic origin of adult satellite cells. Genesis 48, 424–436. 10.1002/dvg.20630. [DOI] [PMC free article] [PubMed] [Google Scholar]
- Linhart HG, Ishimura-Oka K, DeMayo F, Kibe T, Repka D, Poindexter B, Bick RJ, and Darlington GJ (2001). C/EBPalpha is required for differentiation of white, but not brown, adipose tissue. Proc Natl Acad Sci U S A 98, 12532–12537. 10.1073/pnas.211416898. [DOI] [PMC free article] [PubMed] [Google Scholar]
- Mackay DR, Hu M, Li B, Rheaume C, and Dai X (2006). The mouse Ovol2 gene is required for cranial neural tube development. Dev Biol 291, 38–52. 10.1016/j.ydbio.2005.12.003. [DOI] [PMC free article] [PubMed] [Google Scholar]
- Masu Y, Ikeda S, Okuda-Ashitaka E, Sato E, and Ito S (1998). Expression of murine novel zinc finger proteins highly homologous to Drosophila ovo gene product in testis. FEBS Lett 421, 224–228. [DOI] [PubMed] [Google Scholar]
- Parlee SD, Lentz SI, Mori H, and MacDougald OA (2014). Quantifying size and number of adipocytes in adipose tissue. Methods Enzymol 537, 93–122. 10.1016/B978-0-12-411619-1.00006-9. [DOI] [PMC free article] [PubMed] [Google Scholar]
- Ran FA, Hsu PD, Wright J, Agarwala V, Scott DA, and Zhang F (2013). Genome engineering using the CRISPR-Cas9 system. Nat Protoc 8, 2281–2308. 10.1038/nprot.2013.143. [DOI] [PMC free article] [PubMed] [Google Scholar]
- Rosen ED, Hsu CH, Wang X, Sakai S, Freeman MW, Gonzalez FJ, and Spiegelman BM (2002). C/EBPalpha induces adipogenesis through PPARgamma: a unified pathway. Genes Dev 16, 22–26. 10.1101/gad.948702. [DOI] [PMC free article] [PubMed] [Google Scholar]
- Rosen ED, and MacDougald OA (2006). Adipocyte differentiation from the inside out. Nat Rev Mol Cell Biol 7, 885–896. 10.1038/nrm2066. [DOI] [PubMed] [Google Scholar]
- Sanchez-Gurmaches J, Hung CM, Sparks CA, Tang Y, Li H, and Guertin DA (2012). PTEN loss in the Myf5 lineage redistributes body fat and reveals subsets of white adipocytes that arise from Myf5 precursors. Cell Metab 16, 348–362. 10.1016/j.cmet.2012.08.003. [DOI] [PMC free article] [PubMed] [Google Scholar]
- Seale P, Bjork B, Yang W, Kajimura S, Chin S, Kuang S, Scime A, Devarakonda S, Conroe HM, Erdjument-Bromage H, et al. (2008). PRDM16 controls a brown fat/skeletal muscle switch. Nature 454, 961–967. 10.1038/nature07182. [DOI] [PMC free article] [PubMed] [Google Scholar]
- Shapira SN, and Seale P (2019). Transcriptional Control of Brown and Beige Fat Development and Function. Obesity (Silver Spring) 27, 13–21. 10.1002/oby.22334. [DOI] [PMC free article] [PubMed] [Google Scholar]
- Sheehan DC, and Hrapchak BB (1980). Theory and Practice of Histotechnology, 2 Edition (Battelle Press; ). [Google Scholar]
- Song KA, and Faber AC (2018). OVOL2 in metastasis prevention in NPC. Theranostics 8, 2242–2244. 10.7150/thno.25181. [DOI] [PMC free article] [PubMed] [Google Scholar]
- Sun K, Wernstedt Asterholm I, Kusminski CM, Bueno AC, Wang ZV, Pollard JW, Brekken RA, and Scherer PE (2012). Dichotomous effects of VEGF-A on adipose tissue dysfunction. Proc Natl Acad Sci U S A 109, 5874–5879. 10.1073/pnas.1200447109. [DOI] [PMC free article] [PubMed] [Google Scholar]
- Turcot V, Lu Y, Highland HM, Schurmann C, Justice AE, Fine RS, Bradfield JP, Esko T, Giri A, Graff M, et al. (2018). Protein-altering variants associated with body mass index implicate pathways that control energy intake and expenditure in obesity. Nat Genet 50, 26–41. 10.1038/s41588-017-0011-x. [DOI] [PMC free article] [PubMed] [Google Scholar]
- Unezaki S, Horai R, Sudo K, Iwakura Y, and Ito S (2007). Ovol2/Movo, a homologue of Drosophila ovo, is required for angiogenesis, heart formation and placental development in mice. Genes Cells 12, 773–785. 10.1111/j.1365-2443.2007.01084.x. [DOI] [PubMed] [Google Scholar]
- Viswanadha S, and Londos C (2008). Determination of lipolysis in isolated primary adipocytes. Methods Mol Biol 456, 299–306. 10.1007/978-1-59745-245-8_22. [DOI] [PubMed] [Google Scholar]
- Wang ND, Finegold MJ, Bradley A, Ou CN, Abdelsayed SV, Wilde MD, Taylor LR, Wilson DR, and Darlington GJ (1995). Impaired energy homeostasis in C/EBP alpha knockout mice. Science 269, 1108–1112. [DOI] [PubMed] [Google Scholar]
- Wang QA, Tao C, Jiang L, Shao M, Ye R, Zhu Y, Gordillo R, Ali A, Lian Y, Holland WL, et al. (2015a). Distinct regulatory mechanisms governing embryonic versus adult adipocyte maturation. Nat Cell Biol 17, 1099–1111. 10.1038/ncb3217. [DOI] [PMC free article] [PubMed] [Google Scholar]
- Wang T, Zhan X, Bu CH, Lyon S, Pratt D, Hildebrand S, Choi JH, Zhang Z, Zeng M, Wang KW, et al. (2015b). Real-time resolution of point mutations that cause phenovariance in mice. Proc Natl Acad Sci U S A 112, E440–449. 10.1073/pnas.1423216112. [DOI] [PMC free article] [PubMed] [Google Scholar]
- Wang ZH, Li Z, Hu M, Yang QJ, Yan S, Wu RS, Li BA, and Guo M (2017). Ovol2 gene inhibits the Epithelial-to-Mesenchymal Transition in lung adenocarcinoma by transcriptionally repressing Twist1. Gene 600, 1–8. 10.1016/j.gene.2016.11.034. [DOI] [PubMed] [Google Scholar]
- Watanabe K, Villarreal-Ponce A, Sun P, Salmans ML, Fallahi M, Andersen B, and Dai X (2014). Mammary morphogenesis and regeneration require the inhibition of EMT at terminal end buds by Ovol2 transcriptional repressor. Dev Cell 29, 59–74. 10.1016/j.devcel.2014.03.006. [DOI] [PMC free article] [PubMed] [Google Scholar]
- Woods AE, and Ellis RC (1996). Laboratory Histopathology, A Complete Reference (Churchill Livingston Press; ). [Google Scholar]
- Wu RS, Hong JJ, Wu JF, Yan S, Wu D, Liu N, Liu QF, Wu QW, Xie YY, Liu YJ, et al. (2017). OVOL2 antagonizes TGF-beta signaling to regulate epithelial to mesenchymal transition during mammary tumor metastasis. Oncotarget 8, 39401–39416. 10.18632/oncotarget.17031. [DOI] [PMC free article] [PubMed] [Google Scholar]
- Wu Z, Rosen ED, Brun R, Hauser S, Adelmant G, Troy AE, McKeon C, Darlington GJ, and Spiegelman BM (1999). Cross-regulation of C/EBP alpha and PPAR gamma controls the transcriptional pathway of adipogenesis and insulin sensitivity. Mol Cell 3, 151–158. [DOI] [PubMed] [Google Scholar]
- Yang J, Croniger CM, Lekstrom-Himes J, Zhang P, Fenyus M, Tenen DG, Darlington GJ, and Hanson RW (2005). Metabolic response of mice to a postnatal ablation of CCAAT/enhancer-binding protein alpha. J Biol Chem 280, 38689–38699. 10.1074/jbc.M503486200. [DOI] [PubMed] [Google Scholar]
- Zhang Y, Proenca R, Maffei M, Barone M, Leopold L, and Friedman JM (1994). Positional cloning of the mouse obese gene and its human homologue. Nature 372, 425–432. 10.1038/372425a0. [DOI] [PubMed] [Google Scholar]
- Zhang Z, Turer E, Li X, Zhan X, Choi M, Tang M, Press A, Smith SR, Divoux A, Moresco EM, and Beutler B (2016). Insulin resistance and diabetes caused by genetic or diet-induced KBTBD2 deficiency in mice. Proc Natl Acad Sci U S A 113, E6418–e6426. 10.1073/pnas.1614467113. [DOI] [PMC free article] [PubMed] [Google Scholar]
Associated Data
This section collects any data citations, data availability statements, or supplementary materials included in this article.
Supplementary Materials
Data S1. Unprocessed data underlying the display items in the manuscript, related to Figures 1–7 and S1–S7.
Data Availability Statement
All data generated in this study are available in the main text and supplementary information. Original western blot images and analyzed data are available as Data S1.
This paper does not report original code.
Any additional information required to reanalyze the data reported in this paper is available from the lead contact upon request.