

Abstract
T-cell immunotherapy has demonstrated remarkable clinical outcomes in certain hematologic malignancies. However, efficacy in solid tumors has been suboptimal, partially due to the hostile tumor microenvironment comprised of immune inhibitory molecules. One such suppressive agent abundantly expressed in solid tumors is Fas ligand (FasL), which can trigger apoptosis of Fas-expressing effector cells like T cells and natural killer (NK) cells. To alleviate this FasL-induced suppression of tumor-specific immune cells in solid tumors, we describe here the development of a Fas decoy that is secreted by engineered cells upon activation and sequesters the ligand, preventing it from engaging with Fas on the surface of effector cells. We further improved the immune-stimulatory effects of this approach by creating a Fas decoy and IL-15 cytokine fusion protein, which enhanced the persistence and antitumor activity of decoy-engineered as well as bystander chimeric-antigen receptor (CAR) T cells in xenograft models of pancreatic cancer. Our data indicate that secreted Fas decoys can augment the efficacy of both adoptively transferred and endogenous tumor-specific effector cells in FasL-expressing solid tumors.
Keywords: Cancer immunotherapy, Adoptive T cell therapy, Chimeric Antigen Receptor, CAR T cells
Introduction
Chimeric-antigen receptor (CAR)-modified T cells have demonstrated remarkable clinical success in treating hematologic malignancies. However, extension to solid tumors has been more challenging due to many factors including the hostile tumor microenvironment (TME), which is replete with suppressive cells and molecules that limit effector T-cell function [1, 2]. One such suppressive molecule is Fas ligand (FasL), which is expressed by a range of TME cells including tumor cells, tumor endothelium, myeloid-derived suppressor cells (MDSCs), tumor-associated macrophages (TAMs), regulatory T cells (Tregs), and cancer-associated fibroblasts (CAFs) [3–8]. Upon engagement with its endogenous receptor Fas (expressed by activated T cells), FasL induces apoptotic cell death [3–8].
Under normal physiological conditions, Fas/FasL signaling plays a crucial role in regulating normal immune function, including T-cell homeostasis, and establishing immune privilege. For example, contraction of the expanded population of antigen-specific T cells following resolution of an immune response against a viral infection is partially mediated by FasL-induced apoptosis [9]. Similarly, FasL, expressed in tissues of testes, ovary, and cornea, induces apoptotic death of infiltrating T cells and helps maintain the immune privilege of these organs [10]. However, some tumors exploit this pathway as a mechanism to evade immune-mediated elimination. In preclinical studies, Zhu et al. demonstrated that FasL-expressing polymorphonuclear (PMN)-MDSCs found in TiRP melanoma tumors induced apoptotic cell death of tumor-infiltrating lymphocytes (TILs), an effect that was alleviated by blocking Fas/FasL engagement [6]. Similarly, Lakins and colleagues showed that CAFs and other stromal cells recruited to the tumor site in mice engrafted with B16.OVA melanoma tumors could induce OVA-specific CD8+ T-cell death via the Fas/FasL signaling pathway [7]. Finally, elevated levels of FasL have been detected in various solid tumors including bladder, breast, cervical, colon, gastric, and pancreatic cancers, and sarcoma, and correlated with disease progression, increased metastasis, and poor overall survival [11–14]. For instance, Zietz and colleagues reported that FasL was detected in >70% of 40 angiosarcomas analyzed, and high-level expression correlated with decreased numbers of CD8+ TILs and inferior patient survival [15].
Given the detrimental impact of tumor-derived FasL on both endogenous and adoptively transferred antitumor immunity, we sought to protect effector T cells by engineering them to express a secreted Fas decoy molecule (FD). This molecule was designed (a) to be produced upon T-cell engagement with cognate antigen at the tumor site and (b) to shield both transgenic and bystander (nonmodified) tumor-specific cells, including TILs and NK cells, from FasL-induced cell death. Using pancreatic cancer models, we demonstrate enhanced T-cell expansion and sustained effector function of FD-engineered T cells in vitro and in vivo. Furthermore, incorporating the pro-proliferative cytokine IL-15 to produce a Fas decoy and IL-15 fusion protein (FD+15) strengthened the antitumor response by simultaneously shielding the apoptotic signal of FasL and promoting T-cell growth and survival.
Our strategy of protecting engineered as well as endogenous bystander effector cells from tumor FasL–mediated immunosuppression could enhance their persistence in the TME, resulting in a more pronounced antitumor response. However, this approach does not address the potential for immune evasion by the tumor due to heterogeneous antigen expression, which is another major hurdle in targeting solid tumors using cell therapies.
Materials and Methods
Donors and cell lines
Peripheral blood for T-cell generation was obtained from nine healthy volunteers after obtaining written informed consent on a protocol approved by the Baylor College of Medicine Institutional Review Board in accordance with the Declaration of Helsinki, The Belmont Report, and the U.S. Common Rule. Immediately after blood was drawn, peripheral blood mononuclear cells (PBMCs) were isolated by density gradient centrifugation using Lymphoprep (Serumwerk Bernburg AG for Alere Technologies AS, Oslo, Norway, catalog no. 1114544). 293T, K562, CAPAN-1, CFPAC-1, ASPC-1, DU145, PC-3, MCF-7, MDA-MB-448, LAN-1, and NK-92 were obtained from the American Type Culture Collection (Rockville, MD) between year 2012 and 2014 and passages between 8 and 24 were used in the experiments. 293T, CAPAN-1, CFPAC-1, ASPC-1, DU145, PC-3 were cultured in complete IMDM medium – Iscove’s Modified Dulbecco’s Medium (IMDM, Gibco BRL Life Technologies, Inc., Gaithersburg, MD, catalog no. 12440–046) supplemented with 10% heat-inactivated fetal bovine serum (FBS) (Hyclone, Waltham, MA, catalog no. SH30088.02HI) and 2 mM GlutaMAX (Gibco BRL Life Technologies, Inc., Gaithersburg, MD, catalog no. 35050–061). K562 and LAN-1 were cultured in RPMI 1640 medium (Cytiva-Hyclone,Marlborough, MA, catalog no. SH30096.01) supplemented with 10% heat-inactivated FBS and 2 mM GlutaMAX. NK-92 cells were cultured in RPMI 1640 medium supplemented with 10% heat-inactivated FBS, 2 mM GlutaMAX, and 50 IU/mL IL-2. MCF-7 and MDA-MB-448 were cultured in DMEM medium (Cytiva-Hyclone, Marlborough, MA, catalog no. SH30081.01) supplemented with 10% heat-inactivated FBS and 2 mM GlutaMAX. All cell lines were maintained in a humidified incubator containing 5% carbon dioxide (CO2) at 37°C. Mycoplasma testing was performed on cell culture supernatants using MycoAlert Mycoplasma Detection Kit (Lonza, Rockland, ME, Catalog no. LT07–418) and all cell lines were confirmed to be negative for mycoplasma. The identity of all cell lines was validated by Short Tandem Repeat (STR) Profiling, performed by University of Arizona Genetics Core or MD Anderson Cancer Center Cytogenetics and Cell Authentication Core.
Generation of retroviral constructs and retroviral supernatant
We previously synthesized a human, codon-optimized, second-generation CAR with specificity against prostate stem cell antigen (PSCA) by cloning published scFv sequences (clone 2B3) [16, 17] in-frame with the IgG2-CH3 domain (spacer), CD28 co-stimulatory domain, and the zeta (ζ) chain of the T-cell receptor (TCR) CD3 complex in an SFG retroviral backbone (Supplementary Figure S1A) [18]. The SFG retroviral vector was provided by Dr. Cliona Rooney and was originally received from Dr. Richard Mulligan [19]. We also previously constructed a second-generation mucin 1 (MUC1)-specific CAR containing 41BB as a costimulatory domain (Supplementary Figure S1B) [20].
To generate the Fas decoy (FD) vector, we used DNA 2.0 to design (ATUM, Menlo Park, CA) a codon-optimized sequence encoding the signal peptide and extracellular domain of the human Fas (CD95) protein (amino acids 1–173) with the restriction sites Xho1 and Sph1 incorporated up and downstream, respectively (Supplementary Table S1); this was custom synthesized by Integrated DNA Technologies (IDT, Coralville, IA). The FD DNA insert was incorporated into an SFG retroviral vector that contained the fluorescent marker mOrange linked by an IRES sequence downstream of the insertion site.
To generate the FD+15 construct, a codon-optimized sequence encoding IL-15 was linked to the C-terminus of the FD sequence using a G-S linker. Similarly, to generate the FΔ+15 vector in which the IL-15 component was functional, but the decoy was defective through the incorporation of two amino acid substitution (R86S and R87S) mutations previously published to abrogate binding to FasL [21]. DNA sequences of all constructs are included in Supplementary Table S1.
Constructs encoding PSCA antigen, click beetle green luciferase CBG99 [22], and a previously described firefly luciferase mutant Akaluc [23] were generated by incorporating synthesized linear DNA fragments (IDT, Coralville, IA) encoding these proteins into an SFG retroviral vector backbone upstream of GFP tag linked by an IRES sequence.
Retroviral supernatant for all constructs was generated by transfection of 293T cells, as described previously [24]. Briefly, 3.5×10⁶ 293T cells were plated in 100 mm tissue culture treated dishes (BD Biosciences, Bedford, MA) in 10 mL complete IMDM medium. A day later, cells were transfected with PegPam-e, RDF, and the DNA construct loaded into GeneJuice Transfection Reagent (Millipore, Burlington, MA, catalog no. 70967) [25]. Retroviral vector for GFP-Firefly luciferase (GFP_FFLuc) has been described previously [26]. All virus supernatants were collected at 48 and 72 hrs, pooled together, sterile filtered using 0.2μm filters (Pall Corporation, Port Washington, NY, catalog no. 4652) and stored at −80°C until transduction.
Generation of CAR T cells
To generate CAR T cells, 1×10⁶ PBMCs were plated in each well of a non-tissue culture-treated 24-well plate that had been pre-coated with the CD3-specific antibody OKT3 (1 mg/ml) (Ortho Biotech, Inc., Bridgewater, NJ) and CD28 (1 mg/ml) (Becton Dickinson & Co., Mountain View, CA, catalog no. 555725). Cells were cultured in complete media (RPMI-1640 containing 45% Clicks medium (Irvine Scientific, Inc., Santa Ana, CA, catalog no. 9195), 10% FBS and 2 mM L-GlutaMAX), which was supplemented with recombinant human IL-2 (50 IU/mL, National Institutes of Health, Bethesda, MD) on day 1. On day 3 post OKT3/CD28 T-blast generation, 1 mL of retroviral supernatant was added to a 24-well non-tissue culture-treated plate pre-coated with recombinant fibronectin fragment (FN CH-296; Retronectin; Takara Shuzo, Otsu, Japan, catalog no. T100B) and centrifuged at 2,000G for 90 minutes. OKT3/CD28-activated T cells (0.2 × 10⁶ per mL) were resuspended in complete media supplemented with IL-2 (100 IU/mL) and then added to the wells and centrifuged at 400G for 5 minutes. To generate cells expressing both a CAR and FD, FΔ+15 or FD+15, activated T cells were transduced sequentially, first with the CAR construct (on day 3) and then with either FD, FΔ+15, or FD+15 on day 4. T cells used in the in the in vitro experiments involving live cell bioluminescence imaging or in vivo experiments underwent a third transduction on day 5 with either CBG99, Akaluc, or GFP-FFLuc retroviral supernatant. Transduction efficiency was measured 3 days after the last transduction by flow cytometry.
Transduction of tumor cell lines
We generated CAPAN-1 cell lines that expressed transgenic PSCA to ensure homogeneous antigen expression. To do this, PSCA-GFP retroviral supernatant was plated in a non-tissue culture-treated 24-well plate (1 ml/well), which was pre-coated with FN CH-296. CAPAN-1 cells (0.2×10⁶ per well) were added to the plates and then transferred to a 37°C, 5% CO2 incubator. Transgene expression was analyzed by flow cytometry 1-week post-transduction. Cells were subsequently sorted based on GFP expression to exclude nontransduced tumor cells using a MoFlo flow cytometer (Cytomation, Fort Collins, CO). Sorted cells were cultured for 2 weeks in order to obtain sufficient numbers to prepare a cryopreserved bank for all experiments. GFP expression was assessed by flow cytometer and confirmed to be 100% on the day of cryopreservation. K562 cells expressing PSCA (K562-PSCA) were also generated using the same procedure. 293T cells engineered to produce FD or FD+15 (293T-FD and 293T-FD+15 cells) were generated by transducing 293T cells with the FD or FD+15 vectors and subsequent flow cytometric sorting based on mOrange expression to exclude non-transduced cells. Cells were cultured and cyrobanked after sorting as done for CAPAN-1-PSCA and K562-PSCA cells.
Flow cytometry
The following antibodies were used for T-cell phenotyping: CD3-APC (Beckman Coulter, Indianapolis, IN, catalog no. IM2467U), CD3-FITC (Beckman Coulter, catalog no. 6604625), CD4-Krome Orange (Beckman Coulter, catalog no. A96417), CD8-Pacific Blue (Beckman Coulter, catalog no. A82791), CD69-ECD (Beckman Coulter, catalog no. 6607110), CD45RO-APC (BD Biosciences, San Jose, CA, catalog no. 340438), CCR7-FITC (BD Biosciences, catalog no. 561271), CD25-FITC (BD Biosciences, catalog no. 347643), CD28-PC7 (BD Biosciences, catalog no. 561791), CD95-PC5 (BD Biosciences, catalog no. 561977). PSCA antigen and FasL expression on tumor cells was measured using anti-PSCA (Santa Cruz Biotechnology. Inc., Dallas, TX, catalog no. sc-80654) and anti-human CD178-APC (BD Biosciences, catalog no. 564262), respectively. CAR molecules were detected using Goat anti-human F(ab’)2 antibody conjugated with AlexaFluor647 (Jackson ImmunoResearch Laboratories, Inc., West Grove, PA, catalog no. 109–606-097). Cells were stained with saturating amounts of antibody (~5uL) for 20 min at 4°C, washed (PBS, Sigma-Aldrich, St. Louis, MO, catalog no. D8537), and then acquired on Gallios™ Flow Cytometer (Beckman Coulter Inc., Brea, CA). Analysis was performed using Kaluza® Flow Analysis Software (Beckman Coulter Inc.) version 2.1. General gating strategy used for the analysis of T-cell phenotype is illustrated in Supplementary Figure S2A.
Tumor cells IFNγ exposure assay
1×10⁶ cells for each cell line were seeded in a 24-well plate in 2mL culture media containing 10ug/mL of recombinant human IFNγ (PeproTech US, Cranbury, NJ, catalog no. 300–02). After 24-hr incubation, cells were collected for flow cytometry to assess expression of Fas and FasL. Cells were incubated with the anti-human Fas and anti-human FasL mentioned above, and samples were acquired using Gallios™ Flow Cytometer (Beckman Coulter Inc., Brea, CA). Analysis was performed using Kaluza® Flow Analysis Software (Beckman Coulter Inc.) version 2.1.
51Chromium-release assay
The cytotoxicity and specificity of engineered T cells was evaluated in a standard 4–6 hr 51Cr-release assay, using E:T ratios of 40:1, 20:1, 10:1, and 5:1. Effector T cells were co-incubated in triplicate with target cells (293T, CAPAN-1, and CFPAC-1) labeled with 51Cr (Perkin Elmer, catalog no. NEZ030005MC) in a V-bottomed 96-well plate. At the end of the incubation period at 37°C and 5% CO2, supernatants were harvested, and radioactivity counted using a Perkin Elmer 2470 Automatic Gamma Counter. The percentage of specific lysis was calculated as follows: % specific cytotoxicity = [experimental release (cpm) − spontaneous release (cpm)] / [maximum release (cpm) − spontaneous release (cpm)] × 100.
T-cell stimulation assay
To measure T-cell expansion upon antigen stimulation, 1×10⁶ T cells were cultured with 1×10⁶ irradiated K562-PSCA or CAPAN-1-PSCA in the absence of exogenous cytokines for six days. Tumor cells were irradiated (100Gy) to halt their expansion using Rad Source RS2000 Biological X-Ray Irradiator (Rad Source Technologies, Buford, GA) before placing them in culture with T cells. Wildtype K562 cells, which do not express PSCA, were used as control (non-stimulated condition). T-cell counts were obtained by flow cytometer–based quantification – all cells in the wells were collected, labeled with a CD3-APC antibody to distinguish T cells from tumor cells, mixed with CountBright™ Absolute Counting Beads (Invitrogen, Eugene, OR, catalog no. C36950) and 7-AAD (BD Biosciences, catalog no. 51–68981E) to exclude dead cells. Absolute T-cell counts were calculated according to CountBright™ beads manufacturer’s recommended protocol. Sample acquisition was done using the Gallios flow cytometer and was halted at 2,500 beads. Data analysis was performed in Kaluza® Flow Analysis Software version 2.1.
T-cell polyfunctionality analysis
T cells were stimulated for 5 hrs by co-culturing with irradiated CAPAN-1-PSCA tumor cells at an E:T of 1:4 (1×10⁵ T cells and 4×10⁵ tumor cells). Stimulated T cells were collected and used for IsoPlexis Single-Cell Secretome analysis using kit and protocol from the manufacturer (IsoPlexis United States, Branford, CT, catalog no. 1000–4 PANEL-1001–4). Polyfunctionality was determined by calculating the frequency of T cells that secreted two or more cytokines included in the panel within the fraction of T cells that secreted at least one cytokine upon stimulation.
Measurement of decoy and cytokine production
Transgenic Fas-decoy production was measured by Fas ELISA (R&D Systems, Minneapolis, MN, catalog no. DY326) according to manufacturer’s instructions. Briefly, supernatant samples harvested from T cells activated in 24-well non-TC plates coated with recombinant PSCA antigen (CUSABIO, Houston, TX, catalog no. CSB-YP018840HU) at indicated concentrations or irradiated K562-PSCA cells at indicated E:T. To measure the production of FD+15 fusion molecule, samples were used in soluble Fas and IL-15 ELISAs (R&D Systems, catalog no. DY247) to measure the two components separately. To measure the production of effector cytokines by T cells, supernatant harvested at 48 hrs post-activation by K562-PSCA tumor cells at an E:T of 1:1 (1×10⁶ T cells and 1×10⁶ tumor cells) was used to perform a 13-plex multiplex assay (Millipore Sigma, Danvers, MA, catalog no. HSTCMAG28SPMX13) according to manufacturer’s instructions.
FasL neutralization assays
Interaction of FasL with the FD was measured using an ELISA-based assay. 200ng/mL recombinant FasL (BioLegend, San Diego, CA, catalog no. 589406) was first incubated in different media conditions (fresh IMDM medium, conditioned media obtained from 293T cells, or conditioned media obtained from 293T-FD cells) at 37°C for 1 hour and subsequently used in a FasL ELISA (R&D Systems, catalog no. DY126). Reduced detection of FasL in 293T-FD conditioned media compared to fresh IMDM or 293T conditioned media was considered neutralization due to FD binding.
T-cell viability after overnight incubation in different media conditions containing recombinant FasL was used as functional measure of FasL neutralization. In this assay, recombinant Fas ligand (200 ng/mL) was added to CAR-PSCA T cells resuspended in 293T conditioned medium or 293T-FD conditioned medium. 293T conditioned medium supplemented with the human FasL blocking antibody NOK-2 (BD Biosciences, catalog no. 556375) at a concentration of 1ug/mL was used as an additional control. After overnight (18 hrs) culture at 37°C, T cells were labeled with Annexin V-APC (BD Biosciences, catalog no. 550474) and 7AAD according to manufacturer’s protocol and cell viability was monitored using a Gallios™ flow cytometer and assessed using Kaluza® Flow Analysis Software version 2.1.
Co-culture experiments
T-cell:tumor co-culture experiments were performed to assess the in vitro antitumor activity of T cells. CAPAN-1-PSCA tumor cells (0.25×10⁶ cells) were plated in a 6-well tissue culture treated plates in 3mL of culture medium. A day later, 2.5×10⁴ CAR, CAR.FD, CAR.FΔ+15, or CAR.FD+15-modified T cells were added to tumor cells. For the co-culture experiments involving Fas blockade, the human Fas antibody ZB4 (Millipore Sigma, catalog no. 05–338) was added at 10μM final concentration immediately after adding T cells to the tumor wells. Antitumor activity was monitored on days 3 and/or 6 using a flow cytometer to quantify number of cells. Briefly, all cells in the wells were collected, labeled with a CD3-APC antibody to distinguish T cells from tumor cells, mixed with CountBright™ Absolute Counting Beads and 7-AAD to exclude dead cells. Sample acquisition was done using the Gallios flow cytometer and was halted at 2,500 beads. Absolute numbers for residual viable tumor and T cells were calculated according to CountBright™ beads manufacturer’s recommended protocol. Fold changes in tumor and T cell numbers were then calculated using initial (Day 0) absolute counts as reference for all subsequent time-points. Data analysis was performed in Kaluza® Flow Analysis Software version 2.1. General gating strategy used to analyze the co-culture samples is illustrated in Supplementary Figure S2B.
Luciferase-based cytotoxicity assay
To assess cytotoxicity of effector cells against luciferase-labeled tumor targets, 5×10³ tumor cells were seeded in 96-well white flat bottom tissue-culture treated plates (Corning, NY, USA) in 100μL T-cell medium. 1×10³ effector cells (CAR T cells or NK-92 cells) were added, resuspended in 100μL T-cell medium, for an E:T of 1:5 and a final volume of 200μL per well. Three days later, D-Luciferin (Perkin Elmer, Boston, MA, catalog no. 122799) was added to each well (final concentration of 30μg/mL), plates were incubated for 10 minutes at 37°C, and luminescence signals from residual tumor cells were captured using CLARIOstar microplate reader (BMG LABTECH Inc, Cary, NC). Luminescence signal from non-transduced T cells or non-transduced NK-92 cells were normalized to 100% and used as control conditions to compare other treatment groups.
In vitro decoy bystander activity assay
To assess the bystander activity of the decoy and IL-15 combination (FD+15) on T cells, a transwell-based assay was utilized in which, 5×10⁵ CAR MUC1 T cells were added to the lower chamber of the transwell and in the upper chamber, equal numbers of either CAR PSCA or CAR.FD T cells were stimulated with CAPAN1 tumor cells at E:T of 1:1. Transwell inserts (upper chambers) with 0.4uM pores were used to prevent cell migration while allowing secreted proteins to pass through. To monitor if the FD+15 produced by stimulated CAR.FD+15 cells promoted expansion of CAR MUC1 T cells, T cells in the lower chambers were quantified by Trypan Blue (Gibco, catalog no. 15250061) exclusion after three days of culture.
The bystander effects of FD+15 was measured on NK-92 cells by culturing 1×10⁶ NK-92 cells in RPMI medium, supernatant obtained from unmodified 293T cell cultures, or FD+15-containing supernatant collected from 293T.FD+15 cell cultures in the absence of exogenous cytokines in a 24-well plate. Four days later, cells were quantified by Trypan Blue exclusion.
In vivo studies
To assess the in vivo activity of engineered T cells, 6- to 8-week-old female NSG mice (NOD.Cg-Prkdcscid IL-2rgtm1Wjl/SzJ, Jackson ImmunoResearch Laboratories, Inc., West Grove, PA) were injected with 5×10⁶ CAPAN-1-PSCA cells suspended in 1X PBS subcutaneously (s.c.) in the left flank. Tumor cells were engineered to overexpress PSCA to prevent early tumor-relapse due to outgrowth of antigen-negative tumor cells in order to allow proper follow-up of antitumor T-cell response and persistence. Once the tumor reached a size of approx. 140 mm3 (~4 weeks), animals were injected intravenously (i.v.) with 2×10⁶ GFP-FFLuc+ CAR PSCA, CAR.FD, CAR.FΔ+15 or CAR.FD+15 T cells. Tumor volume was monitored by caliper measurement and calculated using the formula: length × width × width/2. T-cell expansion and persistence was monitored using the IVIS Lumina In vivo Imaging system (Caliper Life Sciences, Hopkinton, MA) 10 minutes after injection (i.p.) with 100ul of D-luciferin (15 mg/mL) and the images were analyzed using Living Image software (Caliper Life Sciences, Hopkinton, MA). Mice were euthanized once the tumor volume reached the protocol limit (1,500 mm3) or in the event of tumor ulcerations that grew >2mm in diameter despite treatment or recurred. Mice were monitored for manifestations of toxicities by research personnel as well as BCM veterinary staff by measuring body weight and visual symptoms of illness (e.g., ruffled coat, hair-loss, and/or skin redness).
To assess the bystander effects of the decoy-producing T cells, 6- to 8-week-old female NSG mice (NOD.Cg-Prkdcscid IL-2rgtm1Wjl/SzJ, Jackson ImmunoResearch Laboratories, Inc., West Grove, PA) were injected with 5×10⁶ wildtype CFPAC-1 cells suspended in 1X PBS s.c. into the left flank. Once the tumor reached a size of approx. 200 mm3 (~4 weeks), animals were injected i.v. with 2×10⁶ CBG99+ CAR MUC1 T cells together with 2×10⁶ Akaluc+ CAR PSCA, or CAR.FD, or CAR.FD+15 T cells. Tumor size was measured by weekly caliper measurement and tumor volume (mm3) was calculated by calipers (length × width × width/2). T-cell expansion and persistence was monitored using the IVIS Lumina In vivo Imaging 10 minutes after i.p. injection with 100 μl of D-luciferin (15 mg/mL) to capture luminescence produced by the bystander (CAR MUC1) T cells. Four hours later, imaging was repeated with an i.p. injection of 100uL solution of 5mM Akalumine-HCL (Tokeoni) (Millipore Sigma, St. Louis, MO, 808350) to capture luminescence of CAR PSCA, CAR.FD, or CAR.FD+15 T cells.
All in vivo analysis was performed using Living Image software (Caliper Life Sciences, Inc., Hopkinton, MA). Experiments were performed according to a protocol approved by Baylor College of Medicine Institutional Animal Care and Use Committee.
Statistical analysis
Results are reported as mean ± SEM unless stated otherwise. All statistical analyses were performed using GraphPad Prism 8.3.0. Statistical significance between/among groups was determined using one-way ANOVA, two-way ANOVA, or unpaired t tests as indicated in the figure legends. P-values less than 0.05 (p < 0.05) were considered statistically significant. p > 0.05 = non-significant (ns); p ≤ 0.05 = *; p ≤ 0.01 = **; p ≤ 0.001 = ***
Data Availability Statement
The data generated in this study are available within the manuscript and its supplementary files or from the corresponding author upon reasonable request.
Results
CAR T cells are susceptible to suppression by tumor-expressed FasL
To target solid tumors expressing PSCA, we had previously engineered a second-generation CAR specific for human PSCA (Supplementary Figure S1A) [18]. In this study, we efficiently transduced T cells from healthy donor PBMCs with gamma retroviral vectors expressing this CAR (Figure 1A). These cells produced specific 51Cr release from PSCA-expressing target cells in short-term (5 hr) isotope release assays; as shown in Figure 1B, antitumor activity against the PSCA+ pancreatic cancer cell lines CAPAN-1 and CFPAC-1 correlating with their PSCA expression levels (Supplementary Figure S3) was observed with minimal activity against PSCA− 293T cells.
Figure 1: CAR T cells are susceptible to suppression by tumor-expressed FasL.
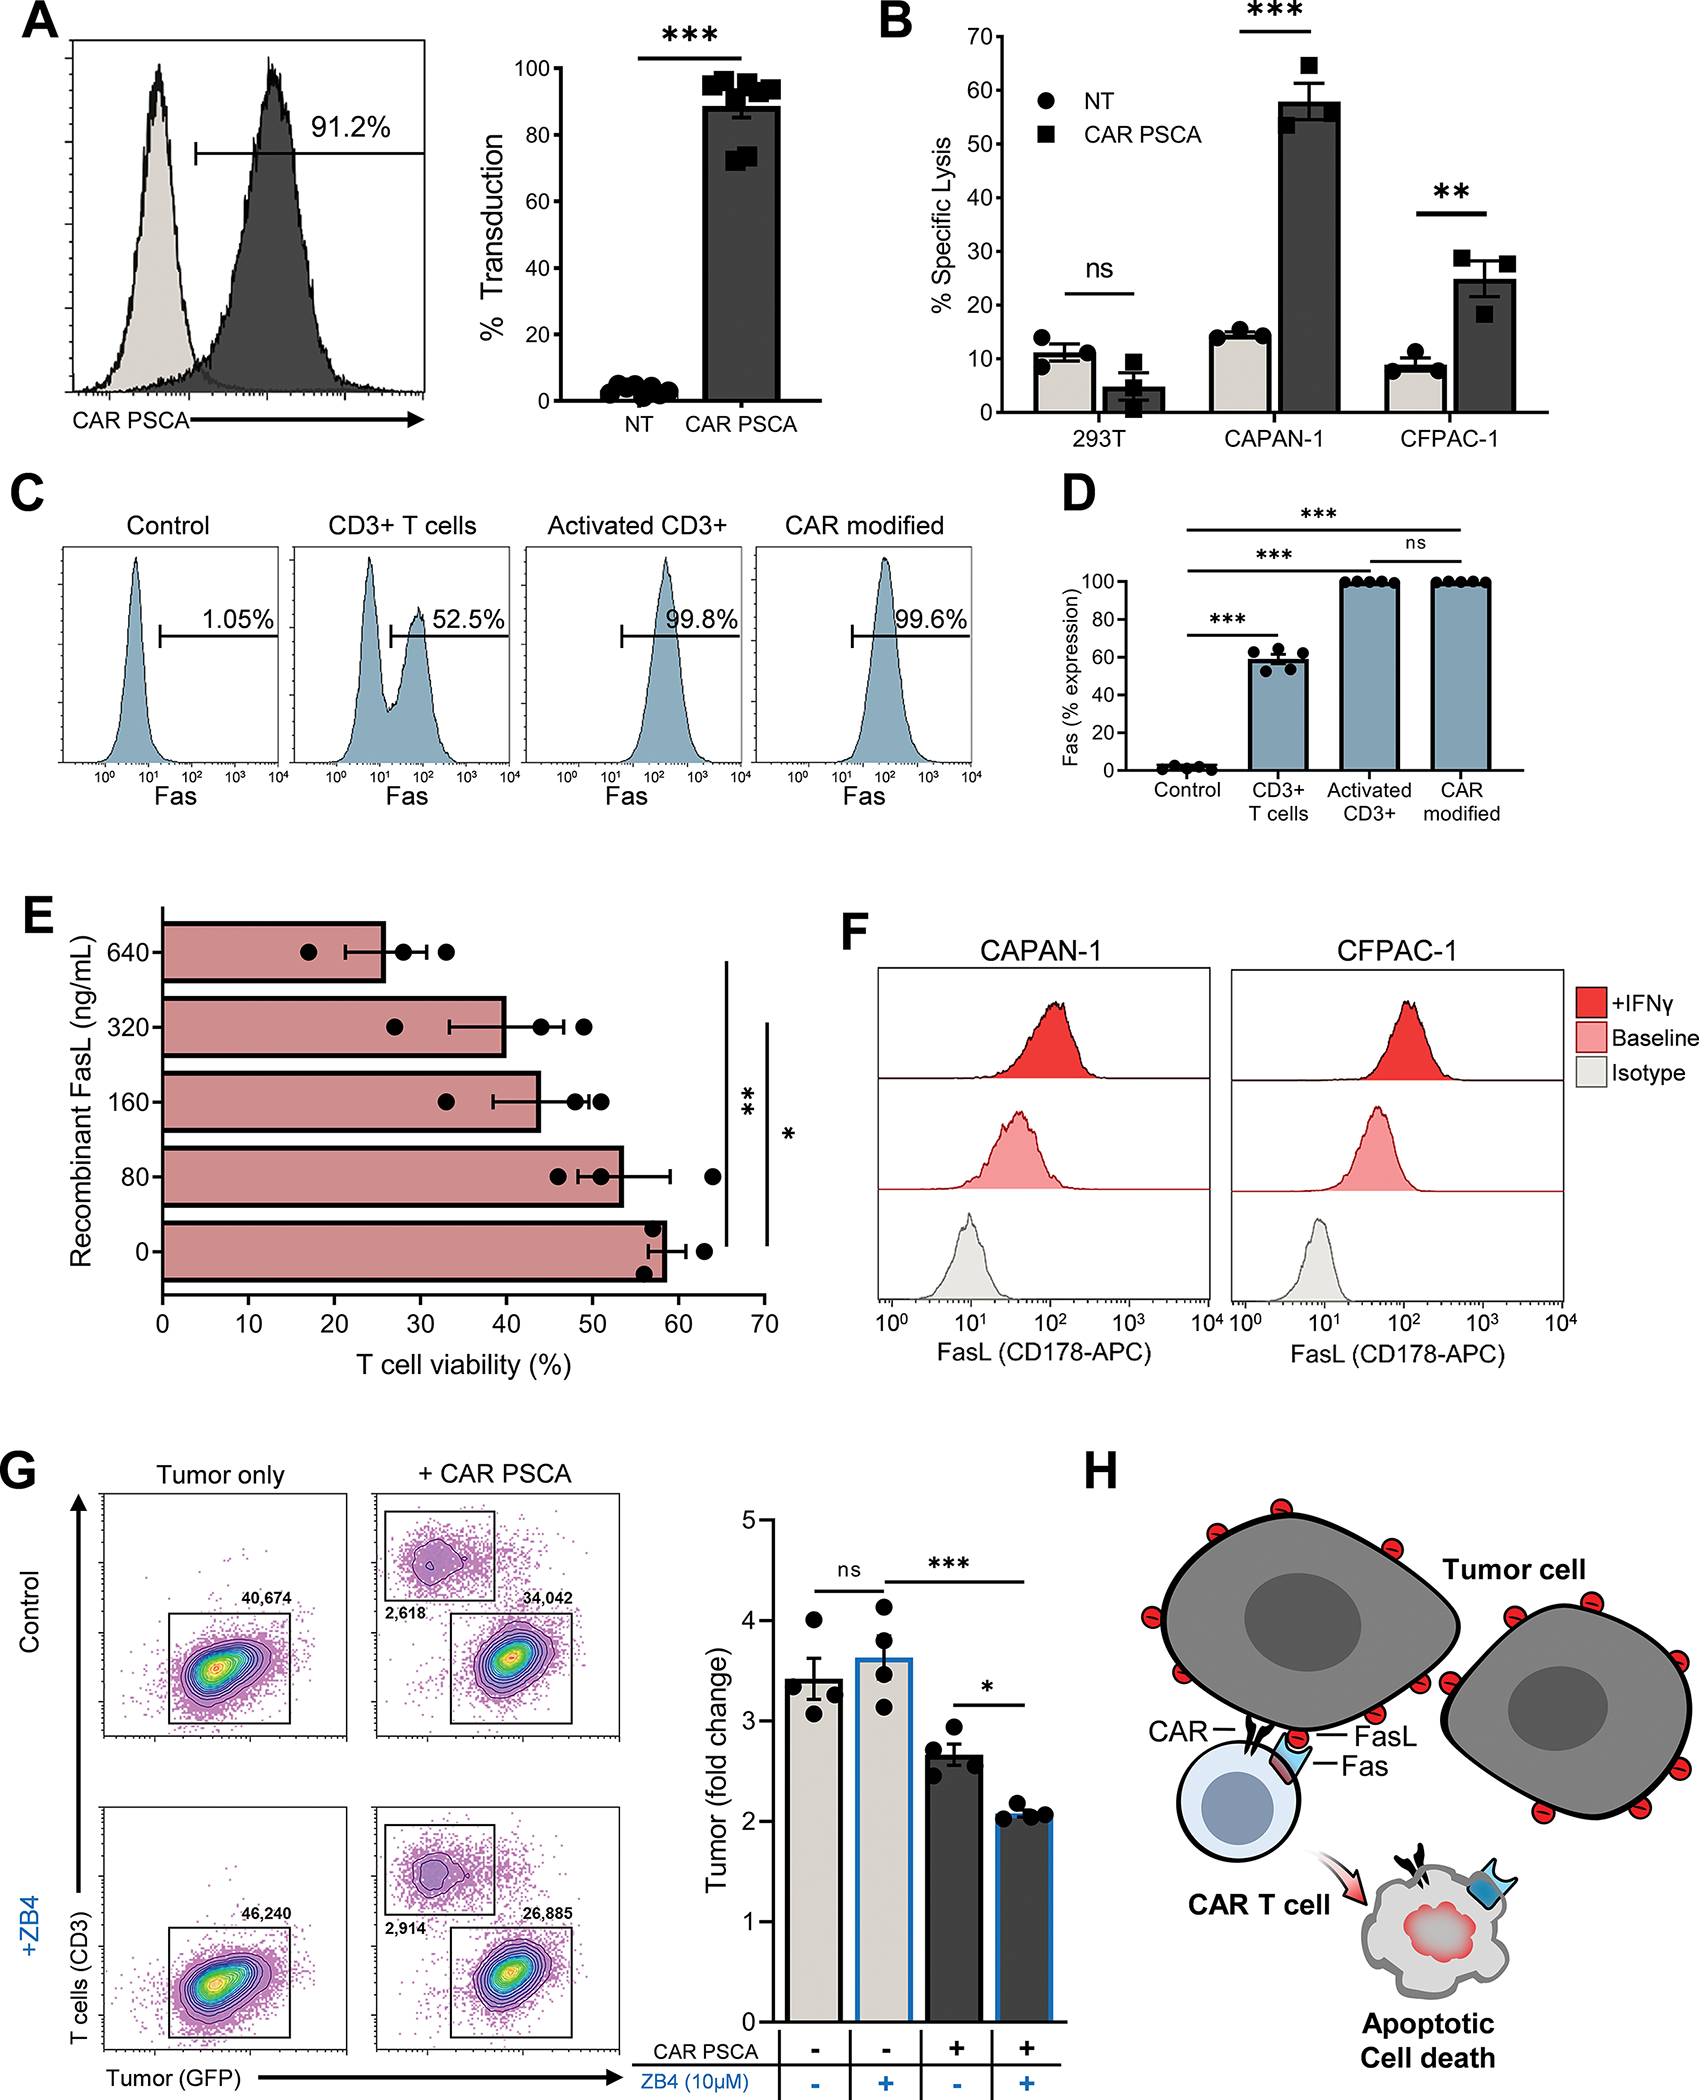
T cells from healthy donor PBMCs were transduced with SFG-based retrovirus engineered to express a second-generation CAR specific for human PSCA. (1A) Transduction efficiency was determined by flow cytometry on day 5 post transduction. Shown in the histogram are data representative of a single donor and in the bar graph are summary data (mean ± SEM, n=8). Statistical significance was calculated using unpaired t test. (1B) Cytolytic activity of non-transduced control T cells (NT) and CAR PSCA T cells (CAR) was tested in a 51Cr-release assay using 5×10³ PSCA− 293T cells and PSCA+ CAPAN-1 and CFPAC-1 pancreatic cancer cells (mean ± SEM, n=3). Statistical difference was calculated using unpaired t test. (1C, D) Expression of Fas (CD95) on T cells at baseline, upon activation, and after CAR transduction was determined by flow cytometry. Expression by T cells from a representative donor (C) and summary data (mean ± SEM, n=5) (D). Significance determined using one-way ANOVA. (1E) The viability of CAR PSCA T cells was determined by flow cytometry using Annexin-V and 7-AAD staining after exposure to the indicated concentrations of recombinant FasL. The % viable cells (Annexin-V−7-AAD−) under each condition is shown (mean ± SEM, n=3). Significance determined using one-way ANOVA. (1F) FasL expression on by CAPAN-1 and CFPAC-1 pancreatic cancer cells lines was assessed by flow cytometry durting normal culture conditions and following 24 hr exposure to IFNγ. Shown in the histograms are data representative of 3 independent analyses. (1G) CAPAN-1 tumor cells engineered to express PSCA-GFP were cultured with CAR PSCA T cells in the absence or presence of a Fas-blocking antibody (ZB4) before analysis by flow cytometry. Shown in the FACS plots are data representative of a single sample and in the bar graph are summary data (mean ± SEM, n=4). Significance determined using one-way ANOVA. (1H) Illustration demonstrating the susceptibility of CAR T cells to suppression by solid tumors via the Fas/FasL signaling axis. p > 0.05 = non-significant (ns); p ≤ 0.05 = *; p ≤ 0.01 = **; p ≤ 0.001 = *** as indicated in the figure panels.
To better understand the potential impact of the Fas/FasL pathway on CAR T cells, we first explored the dynamics of Fas expression during their manufacture. At baseline, approximately half of the unstimulated T cells in freshly isolated donor PBMC expressed Fas (Figure 1C, 1D, and Supplementary Figure S4). Within 24hr of activation with anti-CD3 and anti-CD28, virtually all T cells expressed Fas, and this was maintained for at least 15 days after retroviral transduction (Figure 1C, 1D, and Supplementary Figure S4). Fas upregulation conferred upon T cells sensitivity to FasL-mediated apoptosis, as illustrated in Figure 1E, where CAR T–cell viability (assessed by Annexin-V and 7-AAD staining) decreased upon exposure to increasing concentrations of recombinant FasL. To understand the susceptibility of T cells to FasL expressed by tumor cells, we measured FasL on a range of tumor cell lines including pancreatic (CAPAN-1 and CFPAC-1), prostate, and breast cancer cell lines and found that at baseline, almost all expressed FasL, and this was further upregulated upon IFNγ exposure (Figure 1F and Supplementary Figure S5A). Fas expression on these cell lines was minimal/absent under the same conditions (Supplementary Figure S5B). To test the impact of tumor-expressed FasL on CAR T cells, we performed co-cultures of CAPAN-1-PSCA tumor cells with CAR PSCA T cells in the absence or presence of a Fas-blocking antibody (clone: ZB4, 10uM). Quantification of residual tumor cells 3 days post co-culture revealed improved antitumor activity of CAR PSCA T cells in the presence of the blocking antibody (Figure 1G). Taken together, these data suggest that interactions between Fas on CAR T cells and FasL expressed by tumor cells can suppress effector T cells, resulting in suboptimal tumor control (Figure 1H).
Engineering a soluble Fas decoy receptor to sequester FasL
To protect T cells from FasL-mediated suppression, we developed an FD molecule to prevent Fas engagement (Figure 2A). We designed the FD as a secretable molecule so that it could also potentially block Fas signaling in bystander tumor-specific cells. Our retroviral vector encodes the extracellular portion of Fas linked with mOrange via an IRES sequence to facilitate transgene detection (Figure 2B) and can be co-expressed with the CAR PSCA at high efficiency (Figure 2B, 2C). To evaluate the impact of transgenic FD expression on CAR T cells, we analyzed our cell populations by flow cytometry. This revealed that CAR PSCA and CAR.FD T cells were similar with respect to CD4:CD8 distribution as well as expression of activation markers (e.g., CD69, CD27, and CD28) and memory markers (naïve/undifferentiated, CCR7+CD45RO−, central memory, CCR7+CD45RO+, effector memory, CCR7−CD45RO+, and effector/terminally differentiated, CCR7−CD45RO−) (Figure 2D).
Figure 2: Engineering a soluble Fas decoy receptor to sequester FasL.
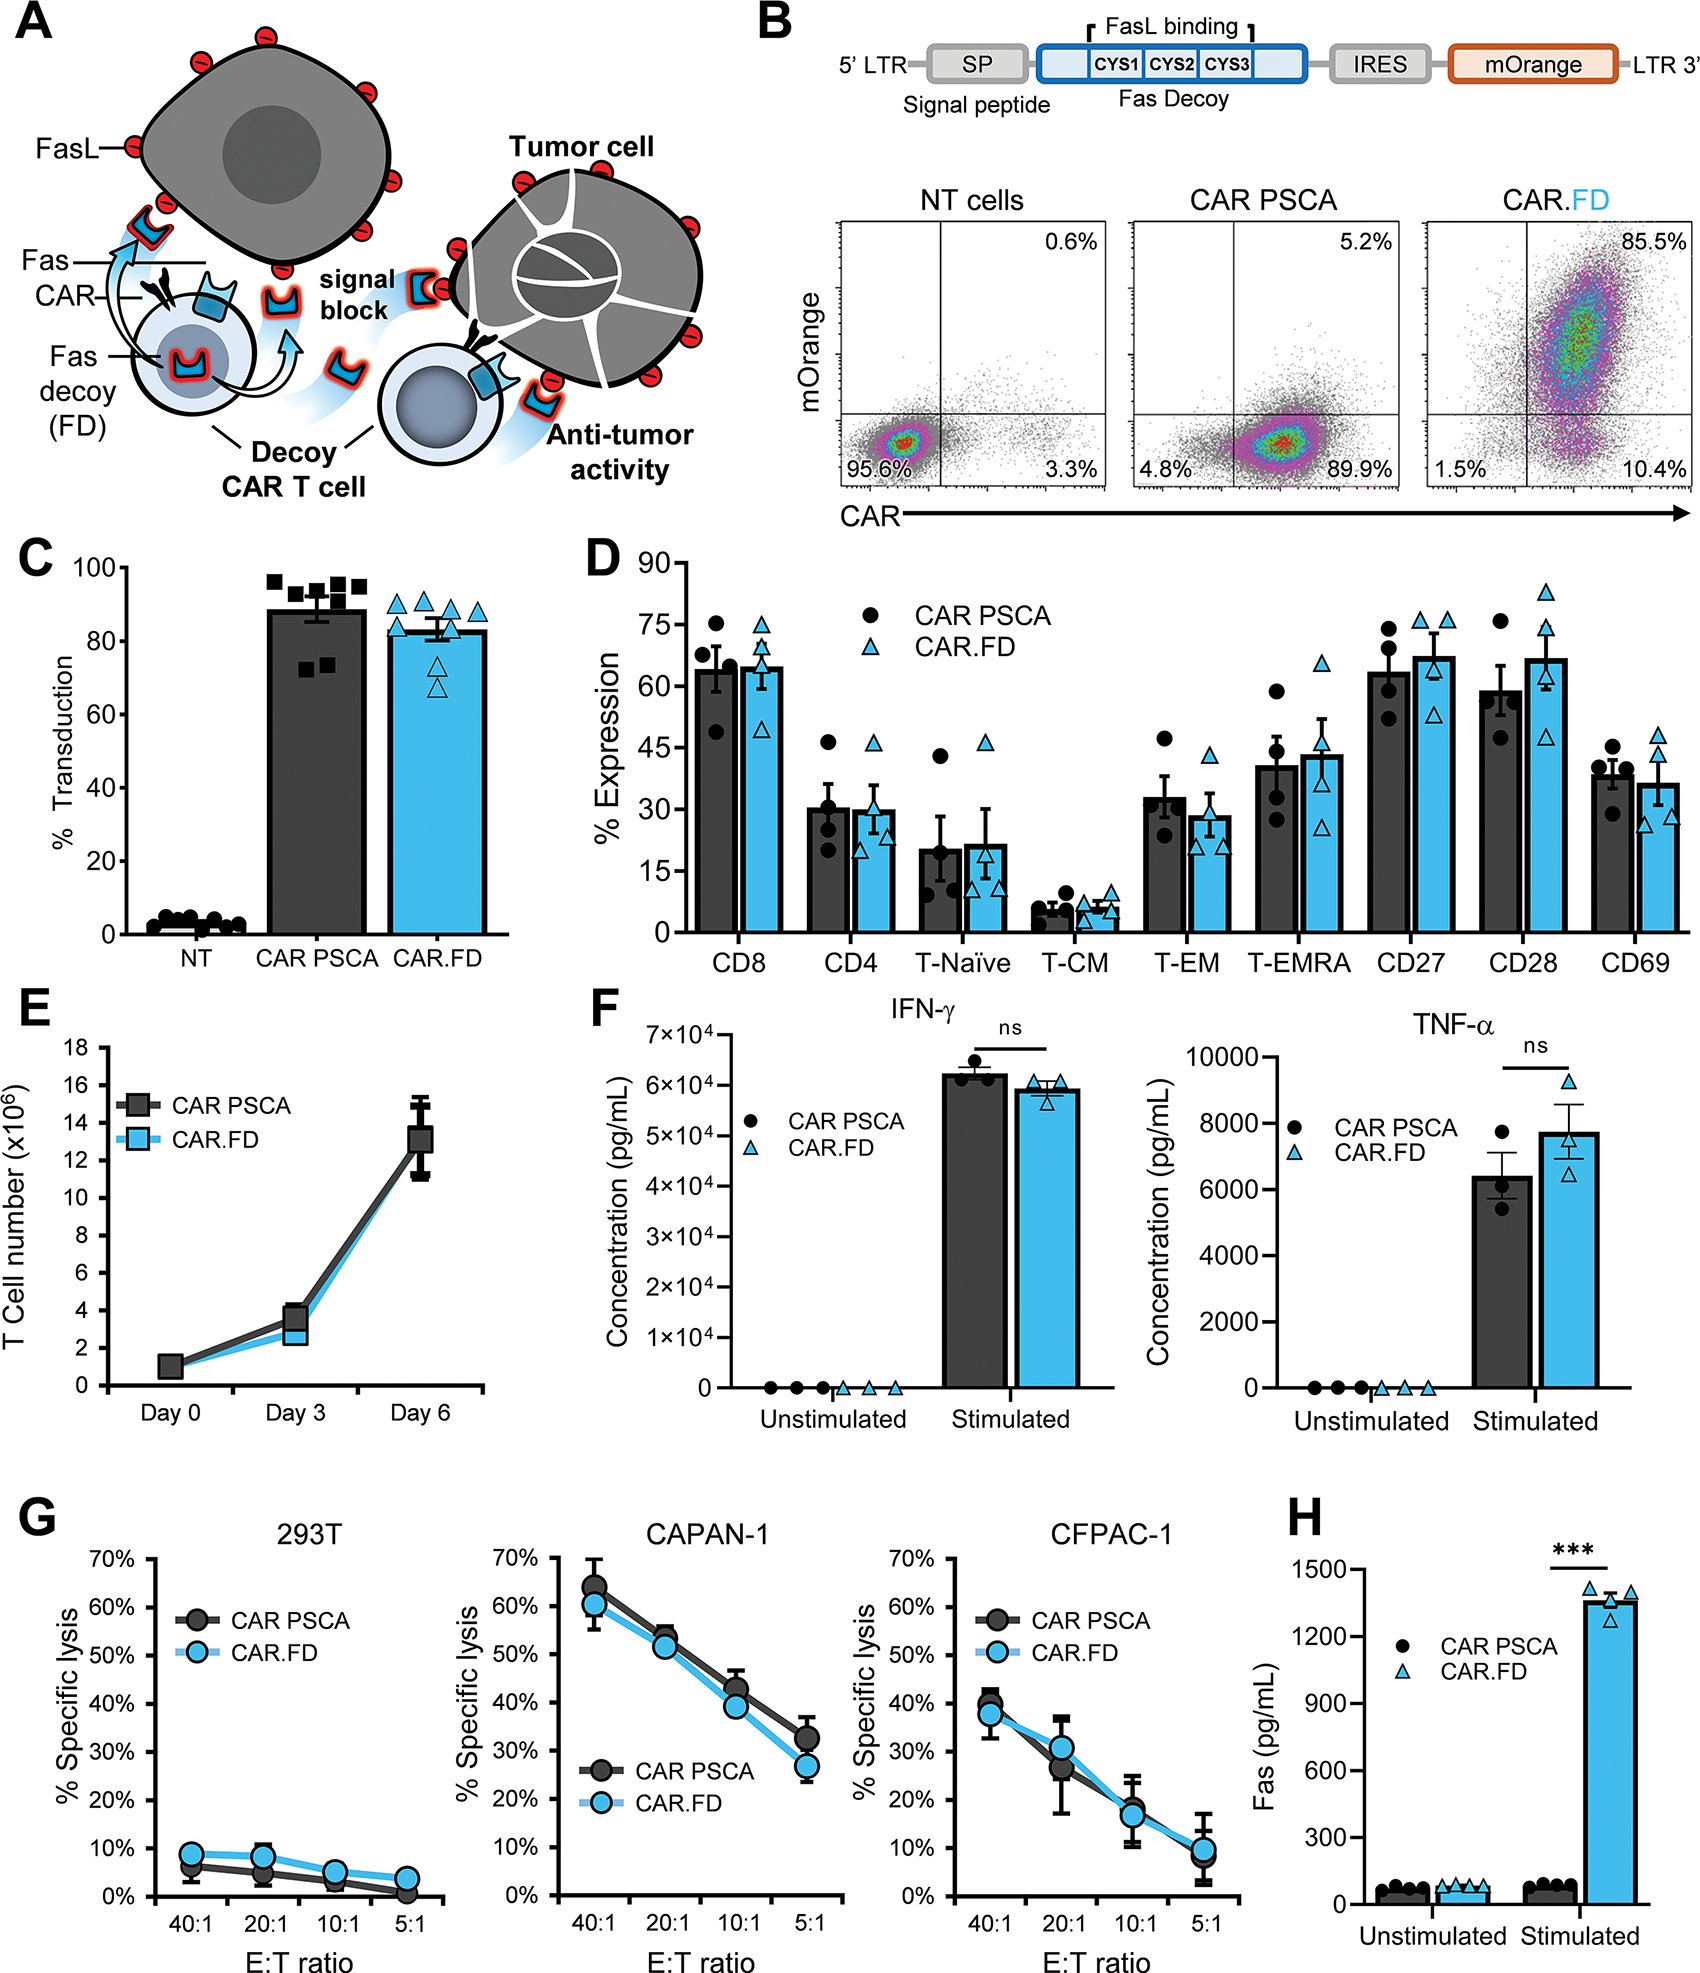
CAR PSCA T cells were engineered to express Fas decoy (FD) by retroviral transduction and used for functional assessments. (2A) Diagram illustrating FD secreted by CAR T cells enhancing T-cell antitumor activity by blocking inhibitory FasL signaling. (2B) FD construct schematic is shown on top and CAR and FD co-expression in T cells from a representative donor assessed by flow cytometry on day 5 post transduction (density plots). (2C) Summary transduction data indicating expression of CAR PSCA and CAR.FD in T cells (mean ± SEM, n=8). (2D) Phenotype of CAR PSCA and CAR.FD T cells was compared 10 days post-transduction by flow cytometry (mean ± SEM, n=3). No significant difference was observed between CAR PSCA and CAR.FD based on unpaired t test. (2E) Expansion of CAR PSCA and CAR.FD T cells stimulated with irradiated K562-PSCA tumor cells was monitored for six days using a flow cytometer (mean ± SEM, n=4). No significant difference was observed between CAR PSCA and CAR.FD based on unpaired t test on days 3 and 6. (2F) Secretion of effector cytokines IFNγ) and TNFα by CAR PSCA and CAR.FD T cells after 48 hour culture with K562 or K562-PSCA cells was measured using a multiplex cytokine assay (mean ± SEM, n=3). No significant difference was observed between CAR PSCA and CAR.FD based on unpaired t test. (2G) Cytolytic function of CAR PSCA and CAR.FD T cells was compared in a chromium release assay using 293T, CAPAN-1, and CFPAC-1 cells as targets at indicated E:T (mean ± SEM, n=3). Unpaired t test indicated no significant difference between CAR PSCA and CAR.FD in tumor killing. (2H) FD secretion by CAR PSCA and CAR.FD T cells in the absence or presence of recombinant PSCA stimulation was measured in supernatant by soluble Fas ELISA 48 hours after culture initiation (mean ± SEM, n=4). Statistical significance was calculated using unpaired t test. p > 0.05 = non-significant (ns); p ≤ 0.05 = *; p ≤ 0.01 = **; p ≤ 0.001 = ***
To assess if FD expression affected cell expansion upon antigen exposure, we stimulated CAR and CAR.FD T cells with irradiated K562 cells engineered to express PSCA (K562-PSCA). We observed no significant difference (p=0.96) in T-cell growth over the course of 6 days (Figure 2E). The two T-cell populations also secreted comparable amounts of effector cytokines IFN-γ and TNF-α upon stimulation with K562-PSCA cells (Figure 2F). In addition, CAR-mediated cytolytic activity to PSCA+ tumor targets CAPAN-1 and CFPAC-1 was not affected by FD expression in a 51Cr-release assay (Figure 2G). Finally, to confirm that CAR.FD cells produced the decoy, T cells were stimulated with plate-bound recombinant PSCA and 48 hrs later supernatant was harvested for Fas quantification by ELISA.
As shown in Figure 2H, CAR.FD T cells produced FD at levels that correlated with the magnitude (Supplementary Figure S6A, S6B) and duration of stimulation (Supplementary Figure S7), indicating that FD is likely to be secreted locally at the tumor site upon antigen stimulation. Although this stimulation-dependency is unusual for transgenes, it was unsurprising based on our prior experience with the vector, which requires T-cell activation for the expression of secreted proteins (e.g., cytokines and chemokines) [27]. We also tested the stability of FD at physiological temperature (37°C) by measuring FD in medium obtained from FD-transduced 293T (293T-FD), which suggested that the half-life of this soluble decoy molecule is approximately 12 days (Supplementary Figure S8). Taken together, these results demonstrate the feasibility of engineering CAR T cells to secrete FD locally in the TME.
FD-engineered T cells exhibit superior function in the presence of FasL
To evaluate the functional characteristics of the decoy and its impact on transgenic T cells we first examined the FasL neutralizing properties of FD using an ELISA-based neutralization assay. As shown in Figure 3A, after 1 hr incubation, detection of recombinant FasL incubated in 293T-FD conditioned medium was significantly reduced compared to incubation in control (293T) supernatant or fresh medium, suggesting sequestration of FasL by the decoy.
Figure 3: Fas decoy-engineered T cells exhibit superior function in the presence of FasL.
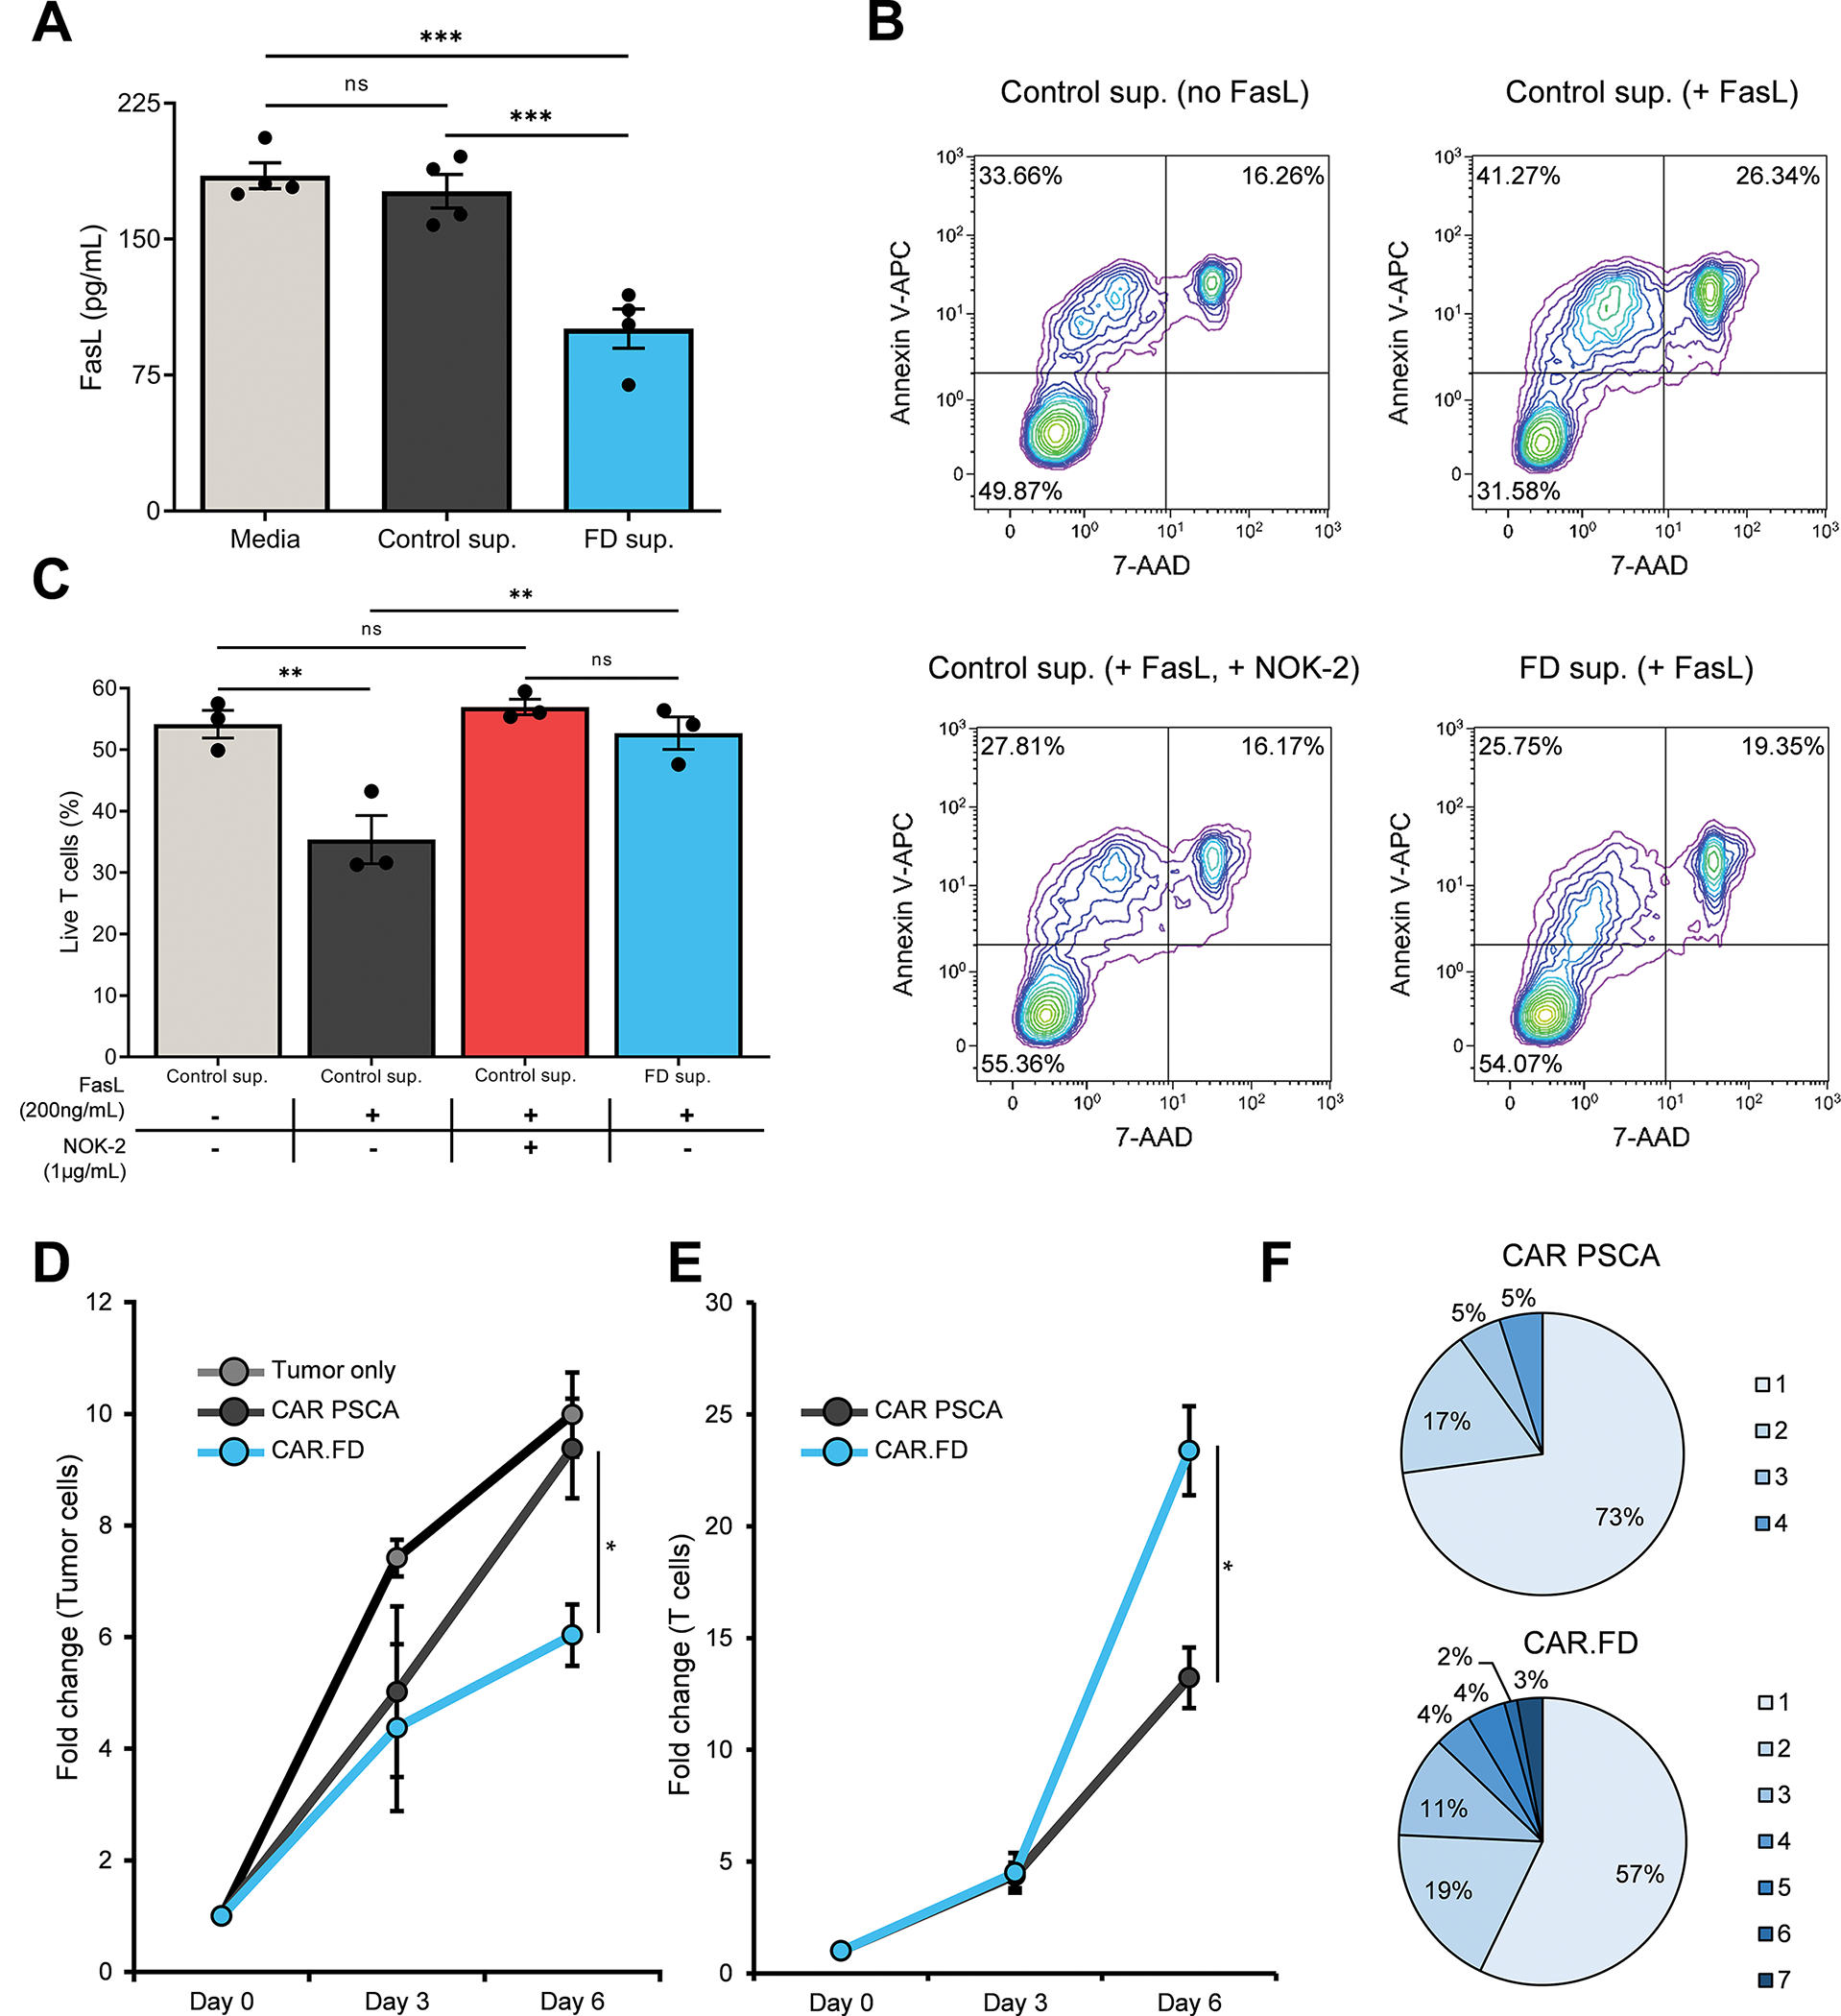
FasL neutralizing and T-cell function enhancing properties of FD were assessed using in vitro immunoassays. (3A) FasL neutralization by FD was measured by incubating recombinant human FasL with fresh media, conditioned media obtained from 233T cells, or conditioned media obtained from 293T-FD cells and subsequently used in a human FasL ELISA (mean ± SEM, n=4). Statistical significance was calculated using one-way ANOVA. (3B, 3C) Suppression of FasL-mediated T-cell apoptosis by FD was assessed by measuring viability of CAR PCSA T cells in different culture conditions – no FD or FasL [Control sup. (no FasL)]; no FD, in presence of recombinant FasL [Control sup. (+ FasL)]; no FD in presence of recombinant FasL and FasL blocking antibody NOK-2 [Control sup. (+ FasL, + NOK-2)]; recombinant FasL in presence of FD [FD sup. (+ FasL)]. T-cell viability was measured by flow cytometry by Annexin V and 7-AAD staining after overnight culture. Flow cytometry plots demonstrating viability of CAR PSCA T cells for a representative donor (3B) and summary data (mean ± SEM, n=3) (3C). Statistical significance was determined using one-way ANOVA. (3D, 3E) Antitumor activity of CAR PSCA and CAR.FD T cells was measured against CAPAN-1-PSCA tumor cells in a co-culture assay (E:T of 1:10) and tumor as well as T-cell numbers were quantified by flow cytometry. Starting cell numbers (Day 0) were used as reference to calculate fold change in cell numbers for all time points. Line graphs demonstrating fold change in tumor cell numbers (3D) and fold change in T cell numbers (mean ± SEM, n=4) (3E). Statistical significance was calculated using unpaired t test. (3F) Pie chart depicting the percentage of polyfunctional (defined as cells producing 2 or more cytokines) CAR PSCA and CAR.FD T cells for a representative donor after 5 hour stimulation with CAPAN-1-PSCA cells (E:T of 1:4). Stimulated T cells were analyzed using IsoPlexis single-cell cytokine assay after stimulation. Numbers next to the pie charts indicate the number of cytokines produced by each fraction of T cells specified in the pie charts. Data representative of three independent donors. p > 0.05 = non-significant (ns); p ≤ 0.05 = *; p ≤ 0.01 = **; p ≤ 0.001 = ***
To investigate if the neutralizing effect of FD was sufficient to protect T cells from FasL-induced apoptotic death, CAR PSCA T cells were cultured with recombinant FasL and either control (293T) or FD-containing supernatant (293T-FD). Control supernatant supplemented with FasL-blocking antibody (NOK-2) was used as an additional control. After 24hr of exposure, cell viability was assessed by Annexin V and 7-AAD staining, which showed that. culture with the decoy-containing supernatant was associated with superior T-cell viability, similar to NOK-2 containing supernatant and supernatant lacking recombinant FasL, whereas viability was markedly reduced in control supernatant containing FasL (Figure 3B, 3C). This improved T-cell survival translated to superior antitumor activity, as measured in a 6-day coculture experiment in which CAPAN-1 tumor cells were mixed with either CAR PSCA or CAR.FD cells at a low E:T (1:10) to recreate the challenging conditions of the TME. As shown in Figure 3D, tumor cells expanded rapidly when left untreated and, although CAR PSCA T cells transiently controlled tumor growth between days 0 and 3, tumor cells eventually -grew rapidly by day 6. In contrast, CAR.FD T cells exhibited enhanced antitumor activity, as indicated by fewer residual tumor cells on day 6. This improved cytolytic activity of CAR.FD cells correlated with their enhanced survival/expansion compared to CAR PSCA T cells (Figure 3E).
As an additional measure of T-cell effector function, we compared the polyfunctionality of CAR PSCA and CAR.FD T cells when stimulated by irradiated CAPAN-1-PSCA tumor cells using an IsoPlexis Single-Cell Secretome assay (Supplementary Figure S9). Stimulated CAR.FD T cells demonstrated a higher degree of polyfunctionality, as indicated by the increased frequency of T cells secreting two or more effector cytokines within the population that secreted at least one cytokine following tumor stimulation (Figure 3F). In summary, these results from our in vitro functional assessment of FD demonstrated that the decoy interacts with and abrogates FasL-induced apoptosis, resulting in improved T-cell survival and antitumor effects upon encounter with FasL-expressing tumors.
IL-15 fusion protein enhances the activity of FD-engineered T cells
To investigate whether incorporating a growth-promoting cytokine signal could further augment the antitumor effects of FD-modified CAR T cells, we developed a new retroviral construct encoding FD and human IL-15 cytokine fusion molecule (FD+15; Figure 4A). CAR PSCA T cells were transduced to express co-express FD+15 at levels comparable to FD alone (Figure 4B, 4C). To assess the effects of FD+15 expression on T cells, we evaluated the phenotype of CAR.FD+15 cells by flow cytometry and found that it was similar to that of T cells expressing CAR only or CAR.FD (Supplementary Figure S10). Effector cytokine production capacity of CAR.FD+15 was also similar to that of CAR PSCA and CAR.FD T cells (Figure Supplementary S11).
Figure 4: Fas decoy and IL-15 fusion protein (FD+15) further enhances T cell activity.
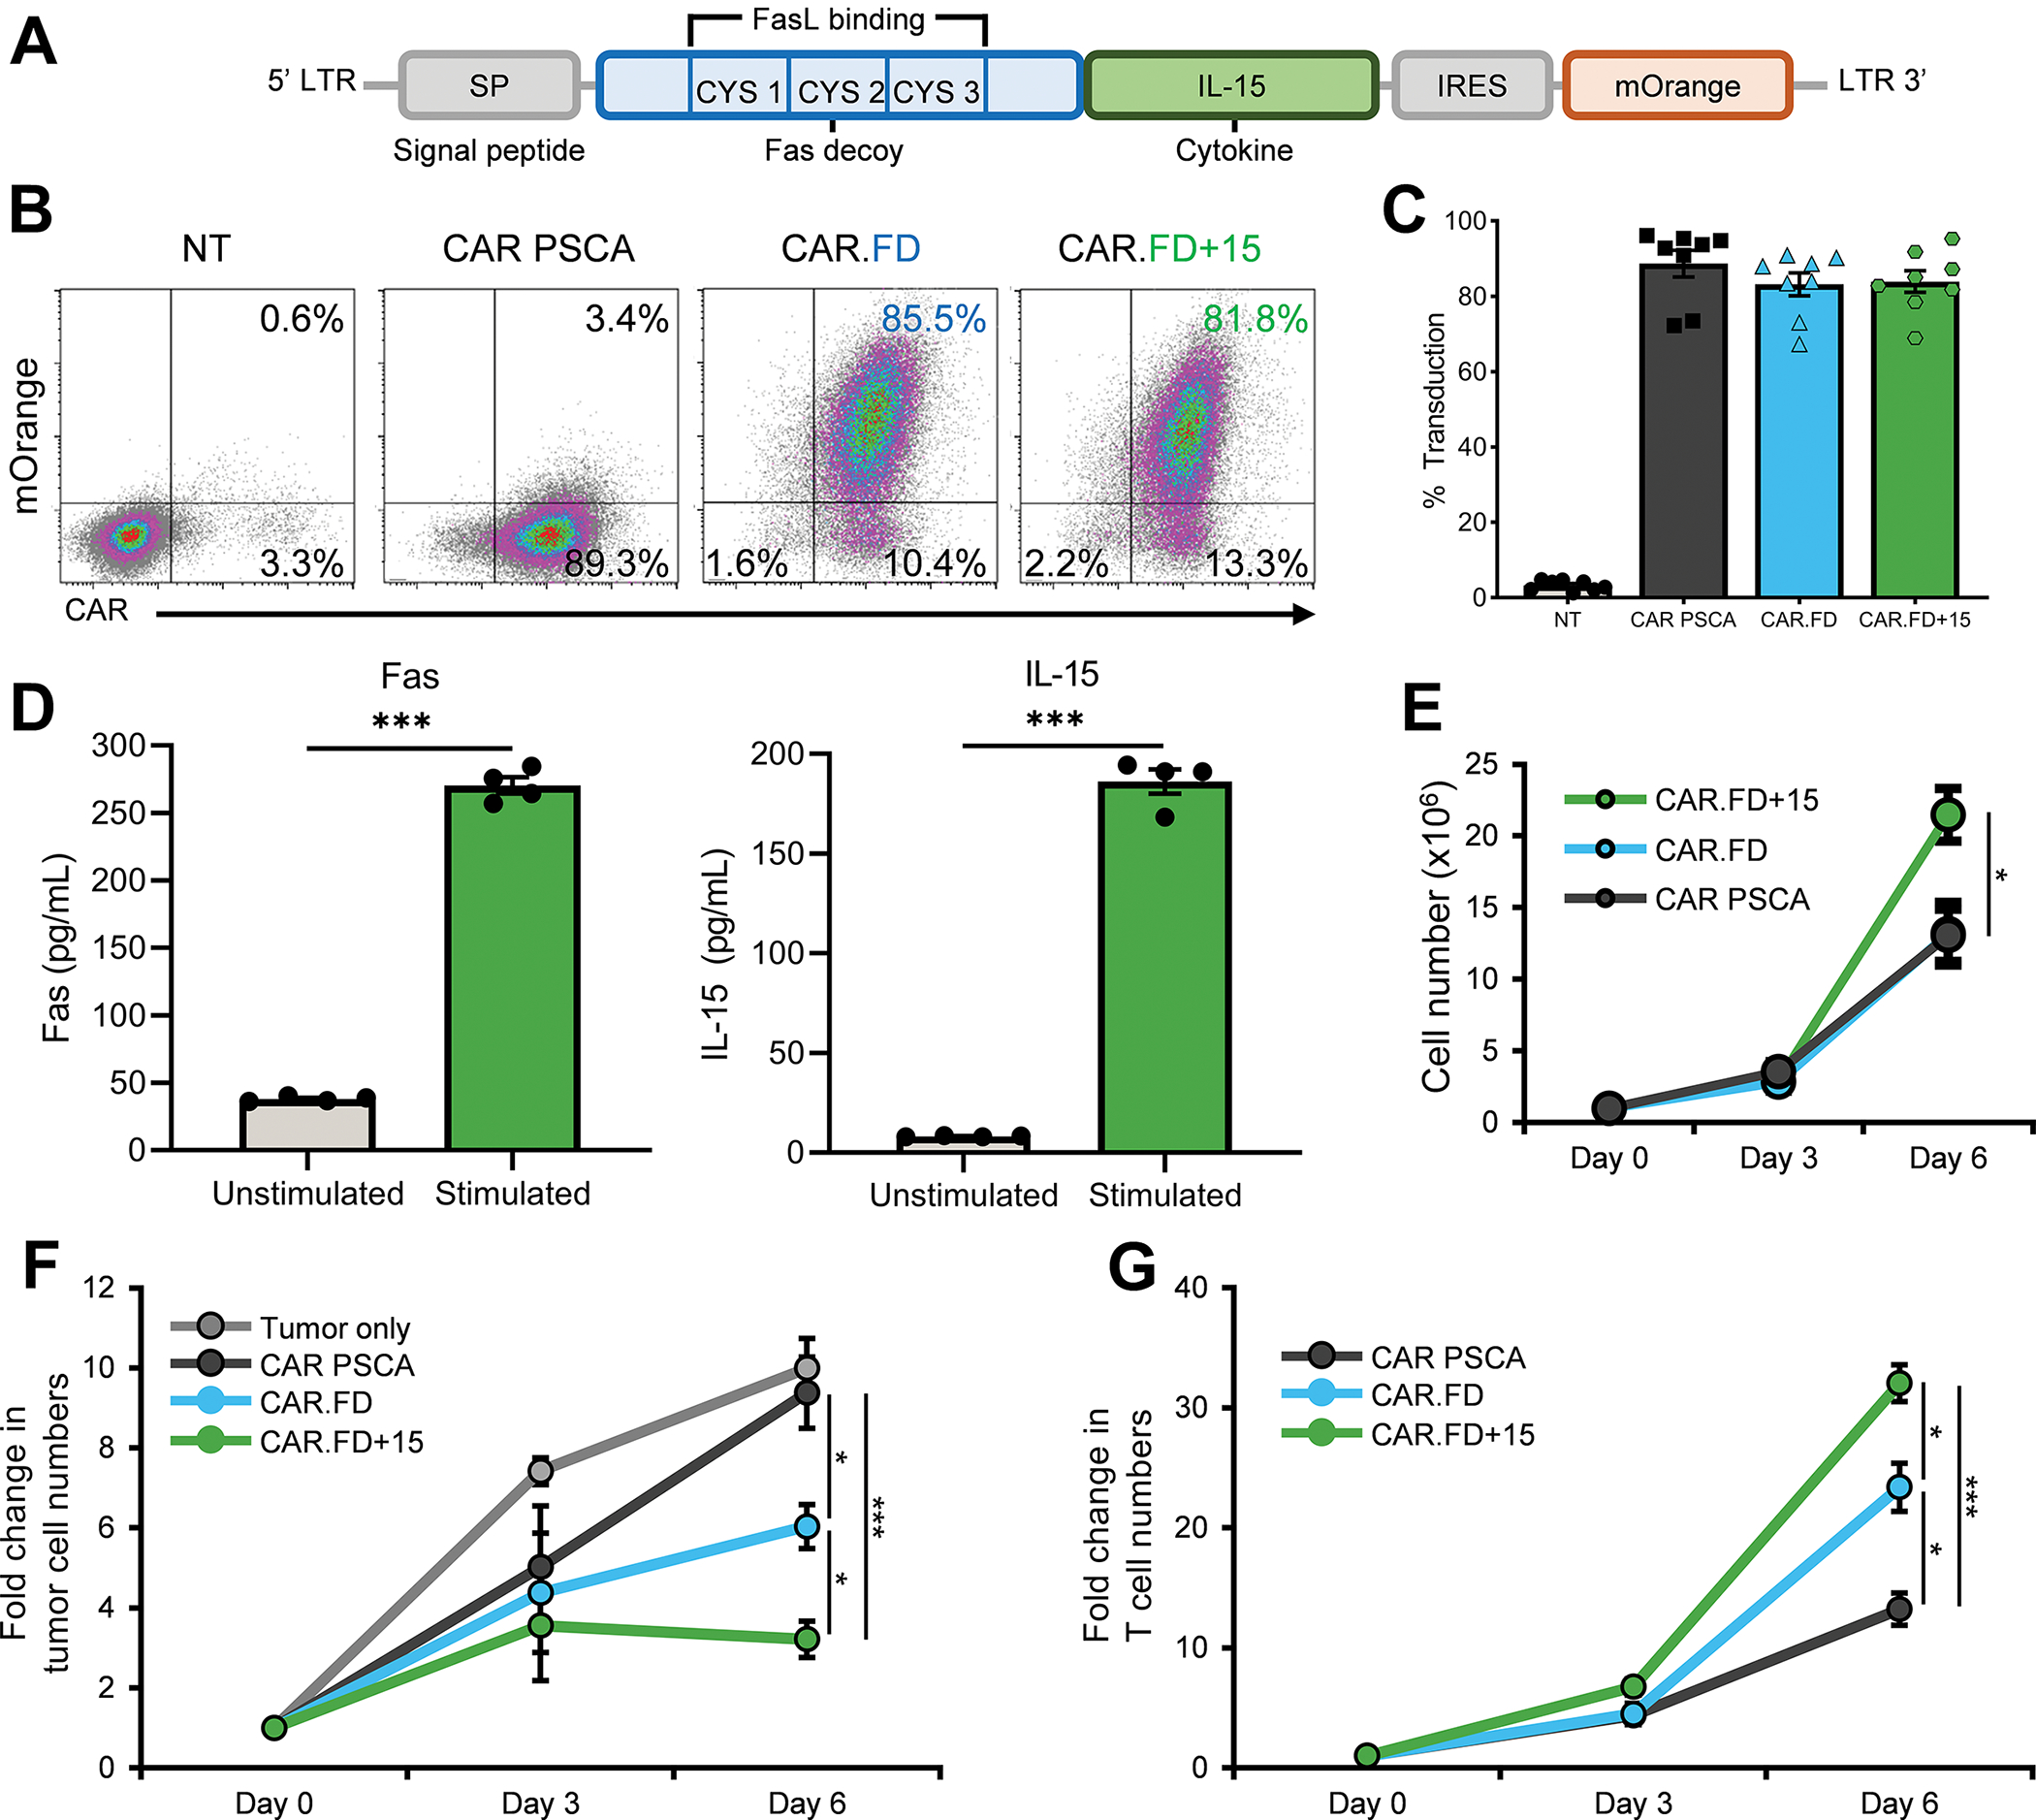
T cells were retrovirally transduced to co-express CAR PSCA and FD+15, and then used in experiments to assess their function. (4A) Schematic diagram illustrating the FD and IL-15 fusion (FD+15) transgene. (4B, 4C) T-cell transduction to assess expression of CAR PSCA, CAR PSCA and FD, or CAR PSCA and FD+15 was measured by flow cytometry 5 days after transduction. Flow cytometry density plots for a representative donor (4B) and summary data indicating expression of the CAR PSCA, CAR.FD, and CAR.FD+15 transgenes (mean ± SEM, n=8) (4C). (4D) Secretion of FD+15 molecule by activated T cells was measured using Fas and IL-15 ELISAs to separately measure the two components of the fusion molecule. Bar graphs demonstrate concentration of Fas and IL-15 in supernatant obtained from CAR.FD+15 T cells cultured in absence or presence of recombinant PSCA (mean ± SEM, n=4). Significance was calculated by unpaired t tests. (4E) Expansion of CAR PSCA, CAR.FD, and CAR.FD+15 T cells stimulated with irradiated K562-PSCA tumor cells was monitored for six days using a flow cytometer (mean ± SEM, n=4). Statistical significance was calculated using one-way ANOVA. (4F, 4G) Antitumor activity of CAR PSCA, CAR.FD, and CAR.FD+15 T cells was measured against CAPAN-1-PSCA tumor cells in a co-culture assay (E:T of 1:10). Tumor as well as T-cell numbers were quantified by flow cytometry. Starting cell numbers (Day 0) were used as reference to calculate fold change in cell numbers for all time points. Graphs illustrate fold change in tumor cell numbers (4F) and T-cell numbers (4G) over time (mean ± SEM, n=4). Statistical significance was calculated using one-way ANOVA. p > 0.05 = non-significant (ns); p ≤ 0.05 = *; p ≤ 0.01 = **; p ≤ 0.001 = ***
To confirm that the fusion molecule was secreted, we collected supernatant from CAR.FD+15 T cells cultured with or without recombinant PSCA antigen for 48 hrs and measured both FD and IL-15 by ELISA. As shown in Figure 4D, T cells secreted both FD and IL-15 upon activation, whereas minimal quantities were detected in the absence of activation. When stimulated with K562-PSCA cells, CAR.FD+15 T cells demonstrated superior expansion compared to CAR PSCA or CAR.FD cells (Figure 4E), likely due to the presence of the IL-15 fusion protein.
To assess if co-expression of FD+15 with the CAR PSCA further enhanced T-cell effector function upon exposure to FasL+ tumor cells, we compared the antitumor activity and expansion of CAR PSCA only, CAR.FD, and CAR.FD+15 engineered cells following co-culture with CAPAN-1 cells (E:T of 1:10). As shown in Figure 4F, tumor cell numbers increased rapidly when left untreated, and CAR PSCA T cells only transiently slowed tumor growth. Although CAR.FD T cells had improved antitumor effects compared to CAR PSCA cells, CAR.FD+15 T cells exhibited the greatest antitumor activity of all treatment conditions. This enhanced tumor-killing activity correlated with superior survival and expansion of CAR.FD+15 T cells compared with both PCSA-CAR and CAR.FD T cells (Figure 4G).
To confirm the efficacy of FD+15 in an additional FasL+ tumor model, we assessed the antitumor activity of our engineered T cells against ASPC-1 pancreatic cancer cells using a luciferase-based cytotoxicity assay. As seen with CAPAN-1, FD and FD+15 expression enhanced the ability of CAR PSCA T cells to kill ASPC-1 cells during a 3-day co-culture at E:T of 1:5 (Supplementary Figure S12A). We also co-expressed the decoys with a CAR MUC1 in T cells and tested their activity against ASPC-1 and MDA-MB-468 (breast cancer) cells using the luciferase cytotoxicity assay. As shown in Supplementary Figure S12B and S12C, CAR MUC1 T cells co-expressing FD eliminated more tumor cells than cells expressing only the CAR MUC1, and this was further improved with FD+15 co-expression.
Lastly, to evaluate if FD was effective in effector cells other than T cells, we expressed FD and FD+15 in NK-92 cells, which have been extensively evaluated in pre-clinical and clinical studies because of their antitumor properties and their potential as an off-the-shelf NK-cell therapy for cancer. As indicated by mOrange expression (Supplementary Figure S13A), we were able to transduce these cells to express FD and FD+15. When co-cultured with ASPC-1 and MDA-MB-468 cells, NK-92 cells expressing FD showed enhanced tumor-killing capacity, which was further strengthened by the expression of FD+15 when tested in the luciferase-based cytotoxicity assay (Supplementary Figure S13B and S13C). Taken together, these results indicate that the FD+15 fusion molecule further potentiates the antitumor activity and survival/expansion of T cells exposed to FasL+ tumors.
FD-engineered CAR T cells demonstrate enhanced in vivo antitumor activity
To assess the in vivo activity of FD-engineered T cells, we utilized a xenograft model of pancreatic cancer in which NSG mice were engrafted with 5×10⁶ CAPAN-1-PSCA cells subcutaneously (s.c.) in the left flank followed by an intravenous injection (i.v.) (single dose) of 2×10⁶ GFP FFLuc-labeled T cells once the tumor reached approximately 140 mm3. An additional cytokine-only control for this experiment included T cells modified with a construct encoding FΔ+15, which is a fusion protein comprised of mutant Fas incapable of binding to FasL and functional IL-15. Cell expansion and persistence were measured by bioluminescence imaging while tumor volume was monitored by caliper measurement (Figure 5A). To assess the safety profile of FD-engineered T cells in vivo, we monitored mouse weight over the course of the experiment and additionally routinely examined animals for evidence of ruffled coat, hair-loss, and/or skin redness. As shown in Figure 5B, mouse weight remained stable in all groups, irrespective of treatment and even during peak T-cell expansion (3–4 weeks post T-cell injection). No other manifestations of toxic side-effects indicated by ruffled coat, hair-loss, and/or skin redness were noted, indicating the safety of the decoy. T cells localized to the tumor within 7 days of infusion in all animals except recipients of non-transduced (NT) T cells, as assessed by bioluminescence imaging (Figure 5C). Compared to the CAR PSCA group, the CAR.FD and CAR.FΔ+15 groups showed improved antitumor activity (Figure 5D, 5E). CAR.FD+15 T cells, which were protected from FasL-induced apoptosis and also received IL-15 cytokine support, exhibited superior expansion and persistence compared to CAR PSCA and CAR.FD Tcells (Figure 5F), and this resulted in the more robust and longer lasting antitumor effects (Figure 5D and 5E). In summary, results from our in vivo study indicate that FD-engineered CAR T cells localize to the tumor and mediate their cytotoxic potential at disease sites without evidence of systemic toxicity. Protection from the tumor FasL via the decoy combined with the growth-promoting effects of IL-15 provided by the FD+15 fusion molecule resulted in greater T-cell proliferation and functional persistence at the tumor leading to the most robust antitumor activity observed in the study.
Figure 5: Decoy engineered CAR T cells demonstrate enhanced in vivo anti-tumor activity.
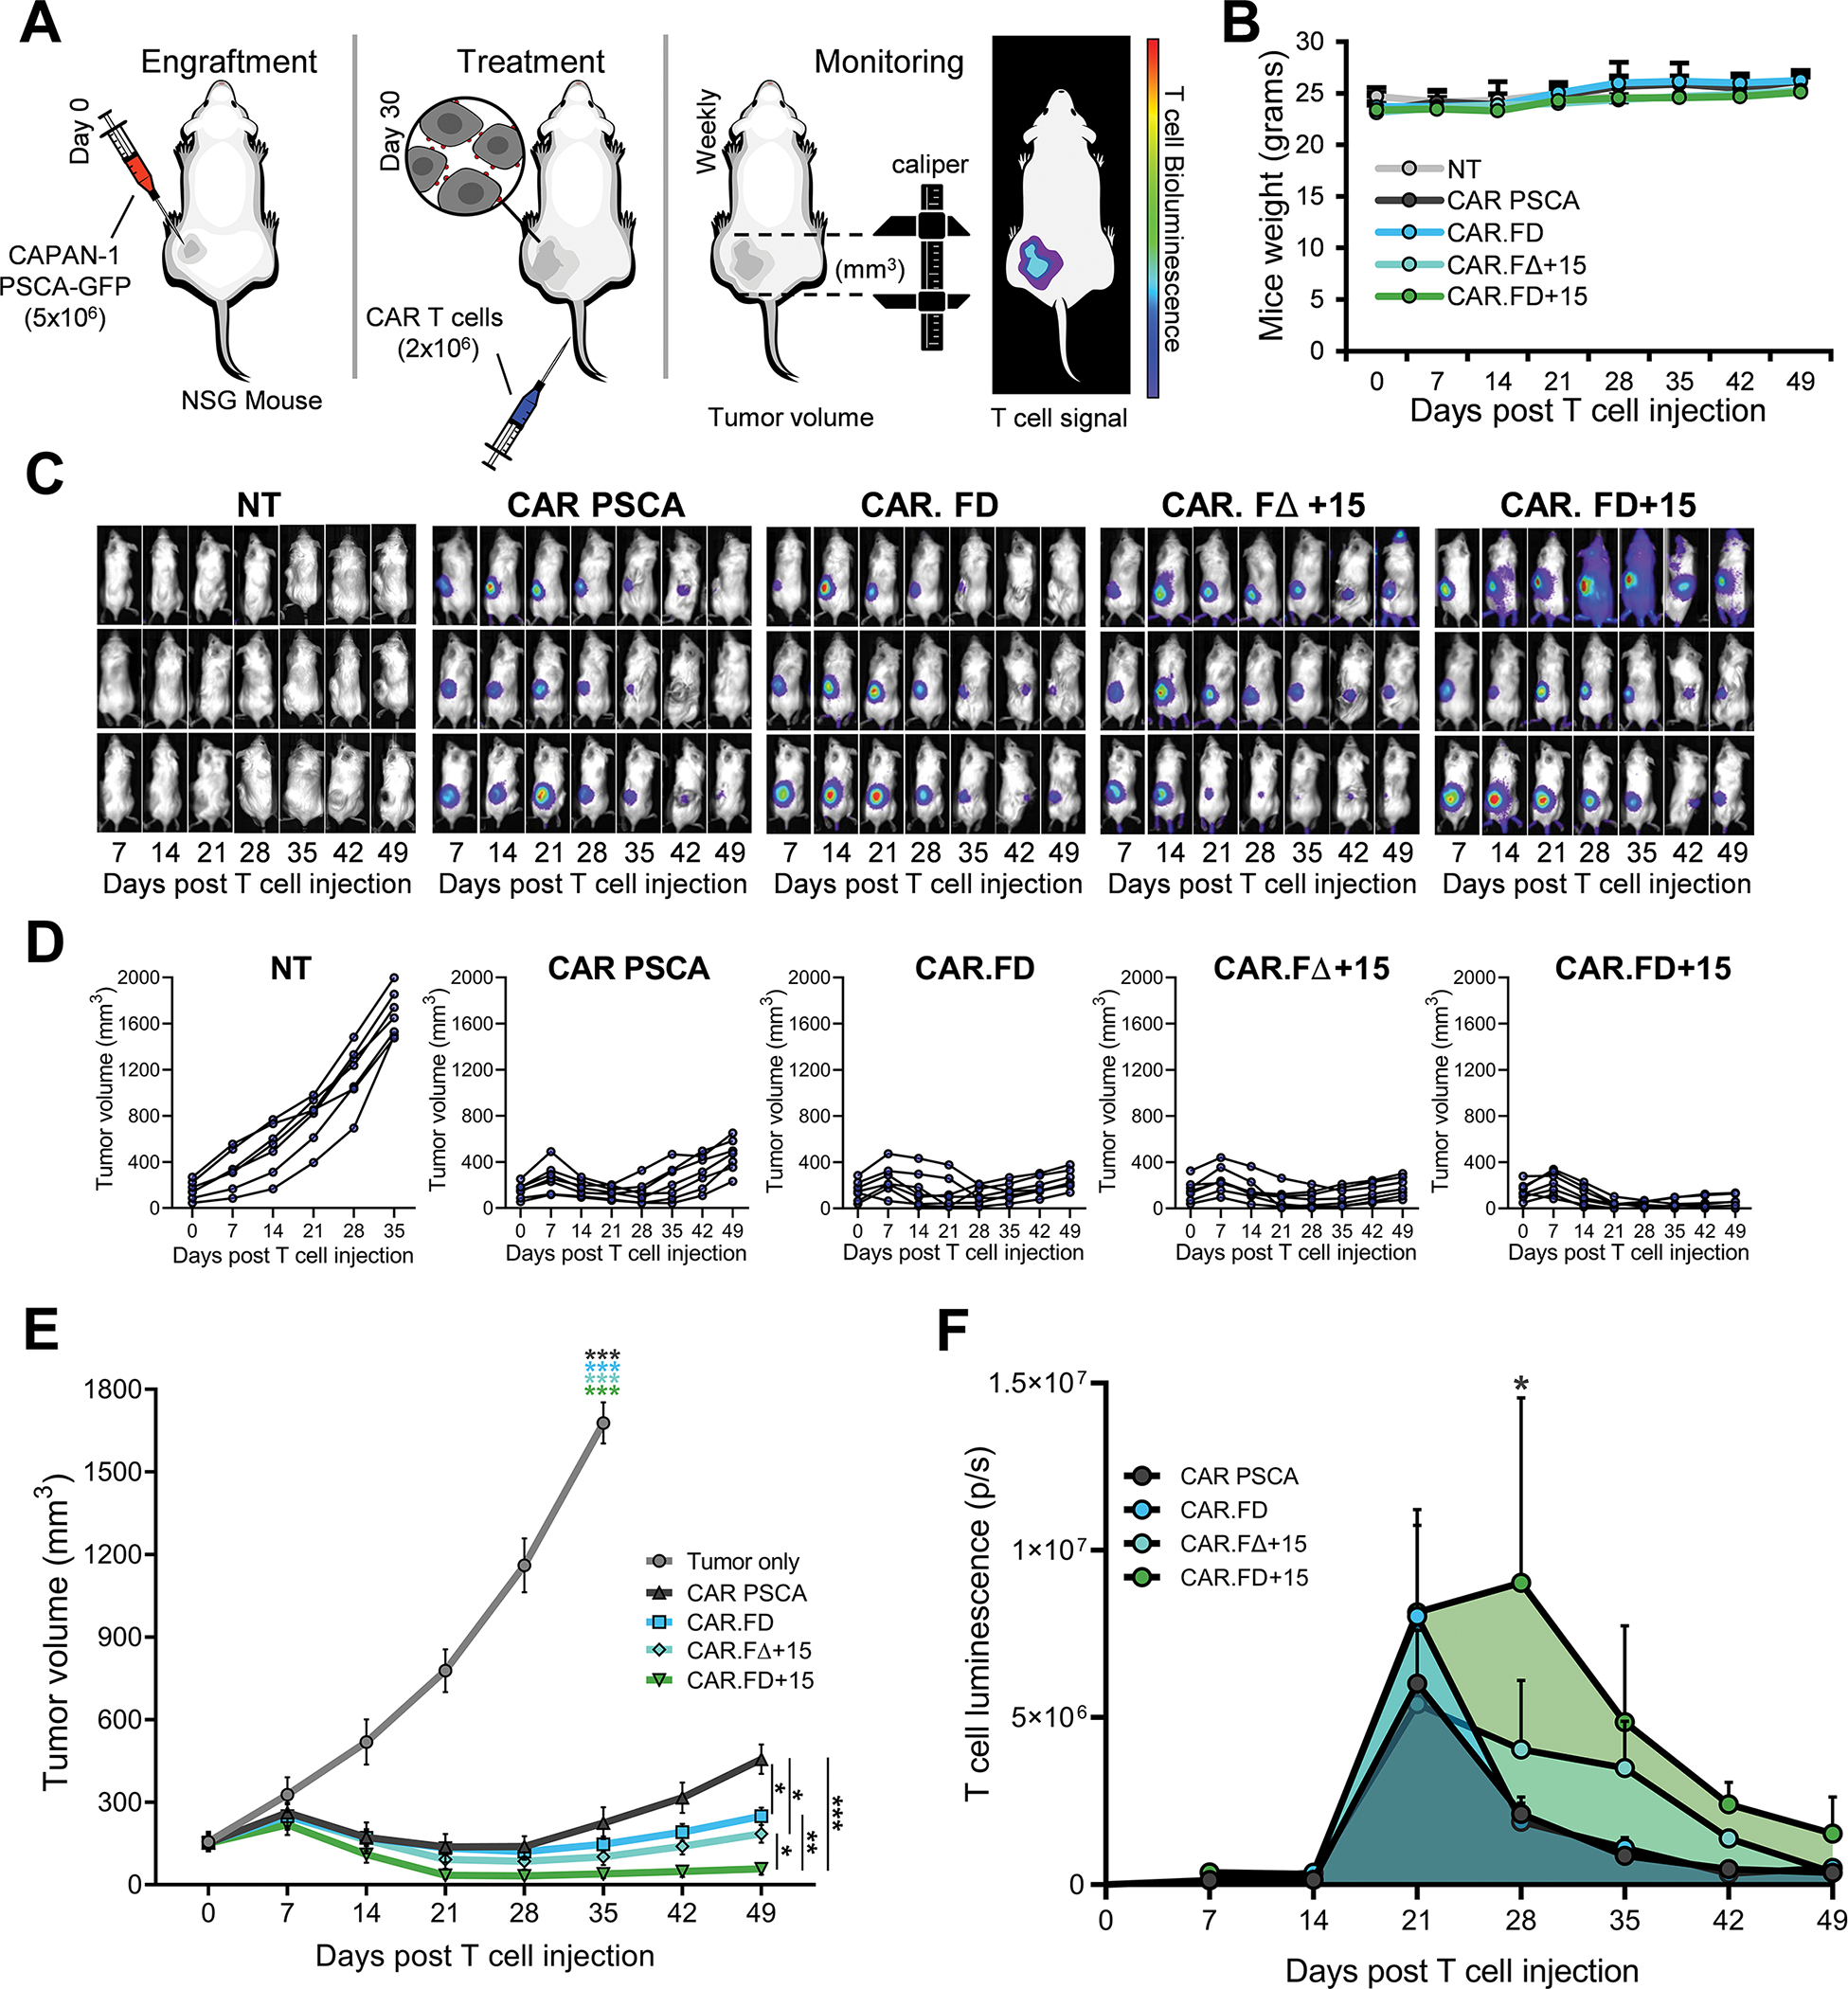
In vivo function of decoy engineered T cells was performed using CAPAN-1 xenograft model in NSG mice. (5A) Schematic representation of the in vivo model for the assessment of the decoy engineered T cells. 5×10⁶ CAPAN-1-PSCA tumor cells were engrafted subcutaneously in NSG mice, which were subsequently (approximately 4 weeks after tumor implantation) treated with i.v. injection of T cells. T cells used in the study were labeled with firefly luciferase to facilitate in vivo imaging. (5B) Change in body weight was used as an indicator of symptoms of toxicity associated with T cell treatment and was monitored in all mice used in the study during (mean ± SEM, n=7 per group). No statistical differences were observed between different treatment groups according to two-way ANOVA. (5C) Representative mice images (3 mice shown) demonstrating localization and expansion of the non-transduced (NT), CAR PSCA, CAR.FD, CAR.FΔ+15, and CAR.FD+15 cells by bioluminescence imaging. (5D, 5E) Tumor volumes were measured using calipers once a week for all mice in the study and reported as measurements for individual animals (5D) and summarized data for each treatment group (mean ± SEM, n=7) (5E). (5F) T-cell expansion and persistence at the tumor was monitored by weekly bioluminescence imaging. Summary of T-cell luminescence at the tumor is demonstrated for each treatment group (mean ± SEM, n=7). Statistical significance between different treatment groups calculated using two-way ANOVA. p > 0.05 = non-significant (ns); p ≤ 0.05 = *; p ≤ 0.01 = **; p ≤ 0.001 = ***
FD-secreting cells promote the effector activity of bystander T cells
To this point, our efforts focused on assessing the impact of FD expression on the transduced CAR T cells. However, the decoy molecule is a secreted compound that may also affect non-engineered bystander cells. To address this potential “bystander benefit”, we first evaluated if FD+15 secreted by CAR.FD+15 T cells could stimulate the growth of CAR MUC1 T cells in a transwell assay in which the CAR MUC1 T cells were in the lower chamber of the transwell and either CAR PSCA T cells or CAR.FD T cells stimulated with CAPAN-1 tumor cells were in the upper chamber (Supplementary Figure S14A). Cell counts of bystander cells from two different donors obtained three days later demonstrated a significantly greater expansion in the wells containing CAR.FD+15 cells stimulated by CAPAN-1 tumor cells in the upper chambers (green bars), compared to the condition with activated CAR-only T cells in the upper chamber (Supplementary Figure S14B and S14C). We also tested the bystander effects of FD+15 on NK-92 cells by culturing them in RPMI media without any supplements, supernatant obtained from non-transduced 293T cells, or supernatant obtained from 293T-FD+15 cells. As shown in Supplementary Figure S15, after a 4-day culture period, a significant increase in the number of NK-92 cells was observed when cultured in 293T-FD+15 supernatant, compared to 293T supernatant, or media, indicating “bystander” stimulation of NK-92 cells by IL-15 in the FD+15.
To evaluate the in vivo “bystander effect” of the decoys, we engrafted NSG mice with the pancreatic cancer cell line CFPAC-1 and subsequently treated these animals with a 1:1 mix (2×106 of each) of CAR MUC1 T cells (which served as bystander cells) and either CAR PSCA, CAR.FD, or CAR.FD+15 T cells. To track the fate of each T cell type in vivo, CAR MUC1 cells were co-transduced with CBG99 and CAR PSCA T cells were labeled with Akaluc and tumor volume was measured by calipers (Figure 6A). T-cell localization at the tumor was seen in all treated animals, with greater overall expansion of CAR PSCA/CAR.FD/CAR.FD+15-expressing cells (right) compared to bystander cells (left) (Figure 6B). The anti-tumor activity CAR MUC1in the animals receiving co-administered CAR.FD surpassed that seen in animals co-injected with CAR PSCA only T cells, and was further improved when the CAR MUC1 T cells were delivered with CAR.FD+15 T cells (Figure 6C). This enhanced antitumor response when co-administering CAR MUC1 T cells with CAR.FD or CAR.FD+15 T cells correlated with the expansion of CAR MUC1 T cells in the tumor (Figure 6B, 6D). These data indicate that bystander cells were protected, which provided enhanced antitumor effects in vivo (Figure 6C, 6E). We ascribe this benefit to enhanced CAR MUC1 T-cell activity since tumors resected 5-weeks post T-cell infusion had fewer residual MUC1+ tumor cells in mice treated with CAR MUC1+CAR.FD and CAR MUC1+CAR.FD+15 treatments vs those treated with CAR MUC1+CAR PSCA or left untreated (Supplementary Figure S16). Taken together, these results support the tumor-localized bystander benefit of the decoy.
Figure 6: Decoy-secreting cells promote the effector activity of bystander T cells.
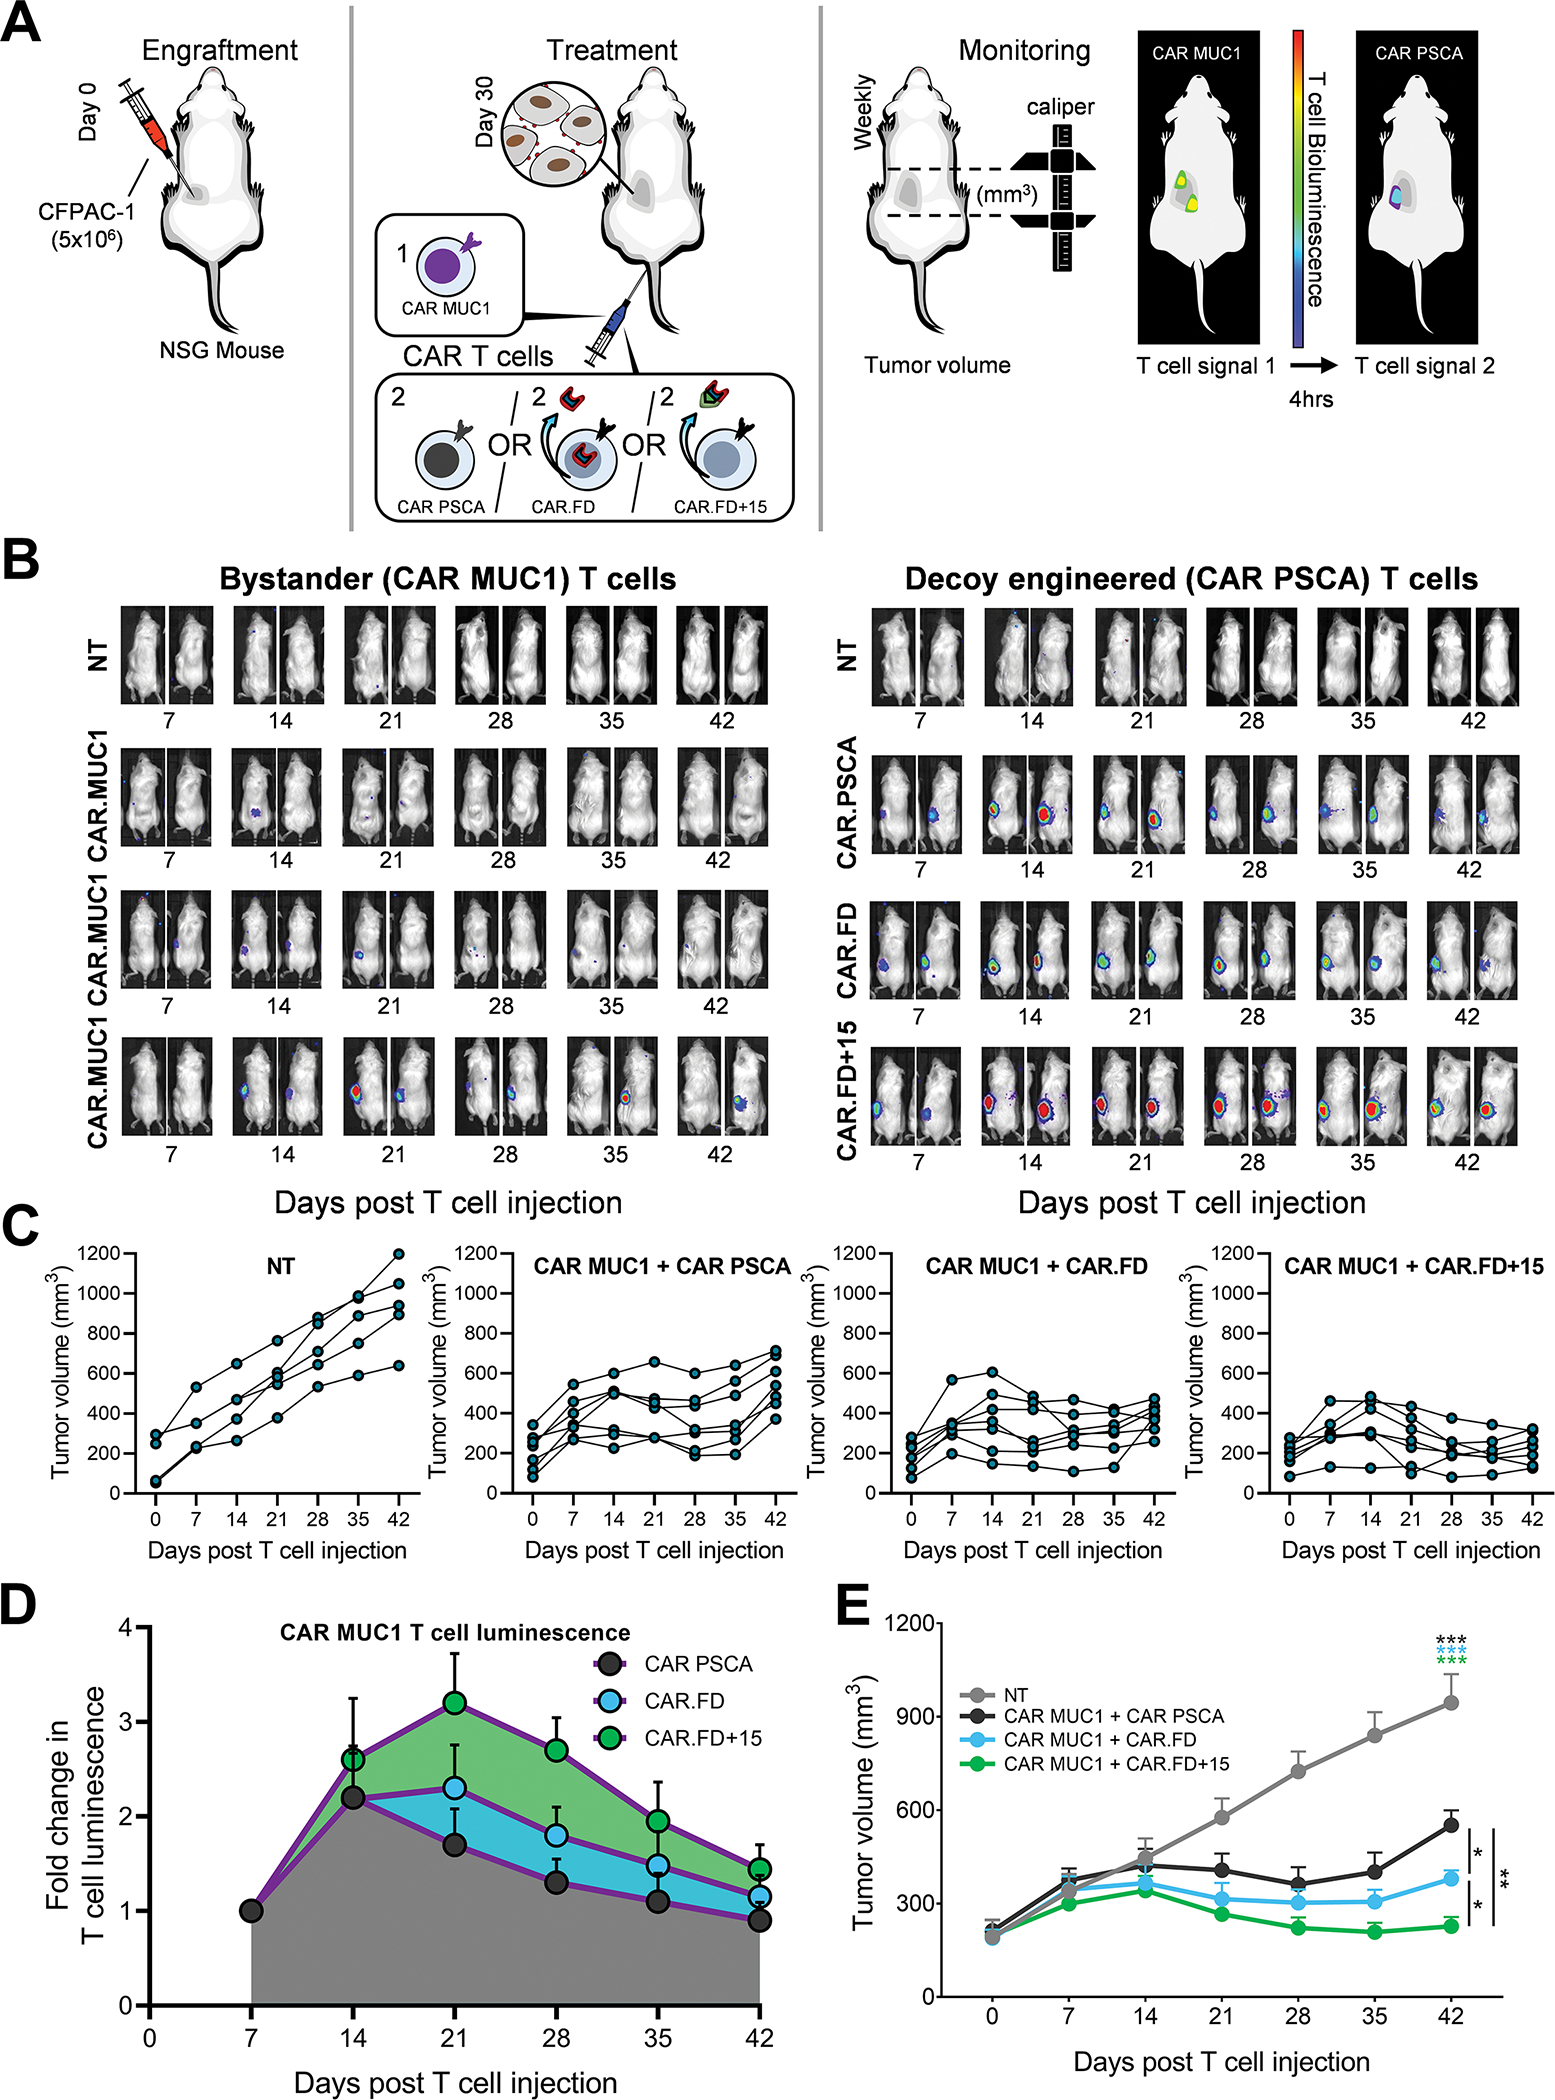
Bystander effects of decoy-engineered T cells was assessed in a CFPAC-1 xenograft tumor model in NSG mice using CAR MUC1 T cells as bystander cells. (6A) Illustration of the in vivo model for the assessment of bystander effects of decoy engineered T cells. NSG mice were engrafted subcutaneously with CFPAC-1 tumor cells and approximately 4 weeks post tumor inoculation, were treated with an i.v. injection of T cells. To facilitate in vivo tracking of both T-cell components administered to mice, CAR MUC1 cells were labeled with CBG99, and CAR PSCA, CAR.FD, and CAR.FD+15 cells were labeled with Akaluc luciferases, respectively. (6B) Bioluminescence images of two representative mice per treatment group demonstrating localization and expansion of indicated T cells by bioluminescence imaging. Bystander CAR MUC1 T cells are depicted on the left and CAR PSCA, CAR.FD, and CAR.FD+15 cells on the right. (6C) Tumor volumes were measured using calipers once a week for all mice in the study and illustrated in the line graphs for individual animals. (6D) Summary of CAR MUC1 T-cell luminescence indicating expansion and persistence of these cells in mice treated with CAR MUC1+CAR PSCA, CAR MUC1+CAR.FD, or CAR MUC1+CAR.FD+15 T cells (mean ± SEM, n=7). (6E) Summary tumor volume for all mice in each treatment group illustrated in 6C (mean ± SEM, n=7). Statistical significance in tumor volumes between different treatment groups calculated using two-way ANOVA. p > 0.05 = non-significant (ns); p ≤ 0.05 = *; p ≤ 0.01 = **; p ≤ 0.001 = ***
Discussion
Redirecting the cellular immune response against cancer by engineering T cells to express CARs with specificities against tumor-associated antigens (TAAs) has resulted in remarkable clinical success, particularly in patients with CD19+ malignancies. Unfortunately, solid tumors have proven more challenging to treat with CAR-engineered T cells due in part to inhibitory mechanisms deployed by the tumor to restrict T-cell persistence and limit T-cell cytolytic function. These mechanisms include upregulation of checkpoint molecules (e.g., PD-L1), production of suppressive cytokines (e.g., IL-4, and TGFβ), and expression of death receptor ligands such as FasL, which is an immunomodulatory molecule that induces apoptotic cell death upon engagement with its receptor Fas, expressed by activated T cells [11, 28–31]. In this study, we have shown the benefit of protecting T cells from tumor-induced FasL-mediated apoptosis using anFD. Using CAR PSCA T cells in a FasL+ pancreatic cancer model system, we demonstrate that co-expression of both the CAR and the decoy produces superior T-cell expansion and antitumor effects both in vitro and in vivo. Additionally, the provision of cytokine support from a bi-functional fusion molecule of FD and IL-15 cytokine further improved T-cell proliferation and persistence, and potentiated antitumor activity in a FasL-rich TME. Finally, we showcase the paracrine immune-enhancing properties of the FD+15 decoy molecule in a second pancreatic tumor (CFPAC-1) model. In this model, we also demonstrate the beneficial effects conferred by the FD+IL-15 to bystander tumor-specific effector T cells.
Given the detrimental impact of tumor-expressed FasL on adoptively transferred T cells, our group and others have previously explored genetic engineering strategies to render T cells resistant to both tumor-FasL and activation-induced cell death (AICD) by ablating Fas in T cells. For example, Dotti and colleagues used siRNA to knock-down Fas to render EBV-specific T cells resistant to EBV-associated lymphoma-expressed FasL and demonstrated enhanced T-cell persistence and antitumor activity [32]. Similarly, Ren et al. applied CRISPR/Cas9 gene-editing to ablate Fas expression by CD19-targeted CAR T cells, resulting in reduced AICD death following exposure to CD19+ K562 chronic myelogenous leukemia tumor cells [33]. However, the major issue with both these strategies is the risk associated with permanently eliminating Fas/FasL signaling in T cells, particularly given the crucial role FasL plays in maintaining T-cell homeostasis [9]. An alternative to ablation is the use of a non-signaling dominant negative receptor (DNR), which acts as a sink for FasL. Indeed, Yamamoto and colleagues explored such a strategy and reported improved persistence and effector function of TCR- and CAR-modified T cells in FasL+ murine melanoma and human xenograft B-cell acute lymphoblastic leukemia models, respectively [30]. Oda et al expanded upon this approach by developing a chimeric “switch” receptor with the incorporation of the 41BB endodomain, thereby allowing T cells to harness and invert the apoptotic FasL signal to one that was costimulatory. This produced pro-survival signaling and metabolic changes in T cells, resulting in enhanced proliferation and antitumor activity in leukemia and pancreatic cancer models [34]. Although these strategies effectively augmented T-cell activity in the TME, each was designed to benefit only the engineered cells and confer no protective advantage to adjacent effector cells. In contrast, our secreted FD was designed to provide not only autocrine protection but also paracrine protection (as illustrated in our CFPAC-1 xenograft model), thereby potentiating the benefit of the strategy.
The TME is replete with cells including TILs, NK cells, and NKT cells whose inherent effector potential is inhibited due to tumor-imposed immunosuppression or exhaustion [35, 36]. Such phenomena have been reported by several groups including Woroniecka et al, who documented high level expression of molecules synonymous with T-cell exhaustion including PD-1, LAG-3, TIGIT, and CD39, as well as diminished production of effector cytokines such as IFN-γ, IL2, and TNFα by human glioblastoma-resident TILs vs matched peripheral blood T cells [37]. TME modulation with recombinant immunostimulatory cytokines and checkpoint inhibitors has been explored to rejuvenate the effector potential of TILs [38–40]. For instance, Klapper et al. demonstrated that administration of high-dose IL-2 produced lymphocytosis in metastatic renal cell carcinoma patients with subsequent durable complete as well as partial responses [41]. Similarly, checkpoint inhibitors that block suppressive molecules like PD-1 and CTLA-4 have also been associated with clinical benefit [42, 43]. For instance, Tumeh et al. reported increased T-cell infiltration and proliferation in metastatic melanoma patients treated with anti–PD-1 therapy, which directly correlated with reduction in tumor size [44]. Although effective in producing clinical responses in patients with certain tumor types (e.g., metastatic melanoma, renal carcinoma, and non-small cell lung cancer), systemic therapies like high-dose IL-2 and checkpoint inhibitors often exhibit non-tumor tropic drug-related adverse effects including thrombocytopenia, liver toxicity, pneumonitis and other autoimmune-like phenomena that can result in patient mortality [45, 46]. Thus, considering the pivotal role endogenous effector cells can play in mediating antitumor responses, we sought to design our decoy to be soluble in order to shield both engineered and bystander cells from FasL-mediated apoptosis. Furthermore, since the soluble decoy molecule is secreted only upon CAR engagement with its target on tumor cells, its benefit is concentrated in the TME, thereby mitigating off-tumor effects. Finally, to augment the proliferation and persistence of both engineered and bystander cells we linked our decoy to IL-15, which is a cytokine known to promote growth and maintenance of effector cells like memory CD8+ T cells and NK cells [47, 48]. Indeed, the additive benefit of both shielding (from FasL) and supporting the proliferation of both engineered and bystander cells can be appreciated in the CFPAC-1 model, where we observed superior antitumor activity with CAR PSCA T cells engineered with FD+15 administered in combination with CAR MUC1 T cells. Although the animal models used in the study allowed us to assess the effects of the decoys in the context of human FasL+ tumors and human CAR T cells, one of limitation is the lack of complete TME components. This incomplete xenograft TME prevented full assessment of the broader effects our decoys could have on additional sources of FasL (e.g., CAFs and TAMs) as well as endogenous tumor-infiltrating effectors (e.g., NK cells and TILs).
The current study focused on the Fas/FasL axis using CAR engineered cells directed to pancreatic cancer-expressed TAAs. However, our platform has the potential to be customized for different types of malignancies and extended to other suppressive molecules in the TME (e.g., PD-L1, TGFβ, and IL-10). This approach could also be adapted to include other stimulatory cytokines like IL-2, IL-7, and IL-21. Additionally, as all adoptively transferred cellular therapies are prone to tumor-driven immunosuppression, our approach could be applied to strengthen the clinical efficacy of a range of cellular therapies beyond CAR T cells such as TIL, cancer/testis antigen (e.g., NY-ESO-1, MAGE, and PRAME)-specific T cells, transgenic TCR T cells, and NK-cell therapies. Finally, one of the pitfalls of adoptively transferred CAR- and TCR-modified T cells is that the engineered cells usually target a single TAA, leading to the risk of tumor immune escape due to antigen loss/modulation, as has been reported in CD19-CAR T-cell recipients, in which >20% of relapses were due to loss of CD19 [49, 50]. Due to its bystander effects, we hypothesize that our decoy strategy can indirectly mitigate the risk of such immune evasion by harnessing the antitumor activity of endogenous effector cells in the TME that can potentially recognize multiple tumor-expressed antigens beyond those recognized by the adoptively transferred cells. However, our strategy is not intended to and does not directly address the challenges posed by heterogeneous nature of TAA expression in solid tumors, particularly immune evasion.
In nature, the Fas/FasL axis is designed to maintain homeostasis of immune effectors such as antigen-specific T cells by limiting hyperactivation and uncontrolled expansion [51]. Thus, any engineering approach to modulate this pathway requires careful consideration, given the risk of systemic toxicity as a result of autonomous T-cell proliferation. Indeed, naturally occurring mutations of FAS have been shown to result in autoimmune lymphoproliferative syndrome (ALPS), which is characterized by uncontrolled lymphoproliferation leading to disorders including hemolytic anemia, thrombocytopenia, and neutropenia [52]. However, in our in vitro as well as in vivo assessment of the FD-engineered T cells, we saw no evidence of autonomous T-cell proliferation. Indeed, both T-cell proliferation and persistence were dependent on the presence of target antigen and upon removal. Moreover, in our in vivo analysis, T cells declined in number gradually with decreasing antigen availability as the tumor shrank. Although our preclinical assessment suggests a positive safety profile, transient expression of the FD+IL-15 via transfection or incorporation of a suicide switch (e.g., inducible caspases) to eliminate engineered T cells in the event of unexpected toxicity could be considered during clinical translation [53].
To summarize, this study demonstrates the feasibility of engineering T cells to express a secreted FD that can enhance CAR T-cell expansion/persistence and antitumor activity when targeting FasL+ tumors. The potency of the engineered CAR T cells was further increased by incorporating IL-15 into the FD, resulting in a Fas decoy and IL-15 fusion molecule, without adversely impacting T-cell phenotype, antigen-specificity, and dependency on the target antigen to sustain T-cell activity. In addition, our soluble decoy strategy exhibits bystander effects and thus, bears the potential to support survival as well as tumor-killing activity of endogenous T and other effector (e.g., NK, NKT, and γδ) cells in the TME.
Supplementary Material
Synopsis.
Tumors expressing FasL can kill antitumor T cells. The enhanced antitumor effects of CAR T cells armed with secreted Fas decoys reported here suggest a way to improve clinical efficacy of cellular therapies in solid tumors.
Acknowledgements
We are thankful to Dr. Malcolm Brenner (project support, scientific advice, and manuscript revision), Dr. Cliona Rooney (project support, scientific advice, and manuscript revision), Dr. Norihiro Watanabe (scientific advice and flow cytometry technical assistance), Walter Mejia (illustrations/schematics and formatting of figures), and Dan Fick (manuscript revision). We also thank the Texas Children’s Hospital Small Animal Imaging Facility, Texas Children’s Hospital Flow Cytometry Core Laboratory, and the shared resources support from the Dan L. Duncan Comprehensive Cancer Center (P30CA125123).
Funding Sources:
National Institutes of Health grant P01 CA094237, National Institutes of Health grant P50 CA126752, National Institutes of Health grant P50 CA186784, National Institutes of Health grant P30 CA125123, American Cancer Society Mentored Research Scholars Grant MRSG-14–197-01–LIB, Cancer Prevention and Research Institute of Texas Scholar Award RR170024, V Foundation for Cancer Research grant T2016–006, Elsa U. Pardee Foundation, Adrienne Helis Malvin Medical Research Foundation
Footnotes
Conflict of interest disclosure:
A.M.L. is a co-founder and equity holder in AlloVir and Marker Therapeutics, and is a consultant for AlloVir. J.V. is the chief scientific officer and chief operating officer at Marker Therapeutics and a board of directors’ member at AlloVir and Marker Therapeutics. P.B., J.V., and A.M.L. have filed a related patent application. H.E.H. has equity in Allovir and Marker Therapeutics, has served on advisory boards for Tessa Therapeutics, Novartis, Gilead, GSK, Kiadis, and Fresh Wind Biotechnologies and received research support from Tessa Therapeutics and Kuur Therapeutics. P.L. is a member of the advisory board for Karyopharm Therapeutics.
Conflict of interest disclosure: A.M.L. is a co-founder and equity holder in AlloVir and Marker Therapeutics, and is a consultant for AlloVir. J.V. is the chief scientific officer and chief operating officer at Marker Therapeutics and a board of directors’ member at AlloVir and Marker Therapeutics. P.B., J.V., and A.M.L. have filed a related patent application. H.E.H. has equity in Allovir and Marker Therapeutics, has served on advisory boards for Tessa Therapeutics, Novartis, Gilead, GSK, Kiadis, and Fresh Wind Biotechnologies and received research support from Tessa Therapeutics and Kuur Therapeutics. P.L. is an advisory board member for Karyopharm Therapeutics.
References
- 1.Hou AJ, Chen LC, and Chen YY, Navigating CAR-T cells through the solid-tumour microenvironment. Nat Rev Drug Discov, 2021. 20(7): p. 531–550. [DOI] [PubMed] [Google Scholar]
- 2.Anderson KG, Stromnes IM, and Greenberg PD, Obstacles Posed by the Tumor Microenvironment to T cell Activity: A Case for Synergistic Therapies. Cancer Cell, 2017. 31(3): p. 311–325. [DOI] [PMC free article] [PubMed] [Google Scholar]
- 3.Yu JS, et al. , Intratumoral T cell subset ratios and Fas ligand expression on brain tumor endothelium. J Neurooncol, 2003. 64(1–2): p. 55–61. [DOI] [PubMed] [Google Scholar]
- 4.Bajou K, et al. , Plasminogen activator inhibitor-1 protects endothelial cells from FasL-mediated apoptosis. Cancer Cell, 2008. 14(4): p. 324–34. [DOI] [PMC free article] [PubMed] [Google Scholar]
- 5.Motz GT, et al. , Tumor endothelium FasL establishes a selective immune barrier promoting tolerance in tumors. Nat Med, 2014. 20(6): p. 607–15. [DOI] [PMC free article] [PubMed] [Google Scholar]
- 6.Zhu J, et al. , Resistance to cancer immunotherapy mediated by apoptosis of tumor-infiltrating lymphocytes. Nat Commun, 2017. 8(1): p. 1404. [DOI] [PMC free article] [PubMed] [Google Scholar]
- 7.Lakins MA, et al. , Cancer-associated fibroblasts induce antigen-specific deletion of CD8 (+) T Cells to protect tumour cells. Nat Commun, 2018. 9(1): p. 948. [DOI] [PMC free article] [PubMed] [Google Scholar]
- 8.Noy R and Pollard JW, Tumor-associated macrophages: from mechanisms to therapy. Immunity, 2014. 41(1): p. 49–61. [DOI] [PMC free article] [PubMed] [Google Scholar]
- 9.Lenardo M, et al. , Mature T lymphocyte apoptosis--immune regulation in a dynamic and unpredictable antigenic environment. Annu Rev Immunol, 1999. 17: p. 221–53. [DOI] [PubMed] [Google Scholar]
- 10.Green DR and Ferguson TA, The role of Fas ligand in immune privilege. Nat Rev Mol Cell Biol, 2001. 2(12): p. 917–24. [DOI] [PubMed] [Google Scholar]
- 11.Peter ME, et al. , The role of CD95 and CD95 ligand in cancer. Cell Death Differ, 2015. 22(4): p. 549–59. [DOI] [PMC free article] [PubMed] [Google Scholar]
- 12.Mizutani Y, et al. , Significance of serum soluble Fas ligand in patients with bladder carcinoma. Cancer, 2001. 92(2): p. 287–93. [DOI] [PubMed] [Google Scholar]
- 13.Shiraki K, et al. , Expression of Fas ligand in liver metastases of human colonic adenocarcinomas. Proc Natl Acad Sci U S A, 1997. 94(12): p. 6420–5. [DOI] [PMC free article] [PubMed] [Google Scholar]
- 14.Bennett MW, et al. , Expression of Fas ligand by human gastric adenocarcinomas: a potential mechanism of immune escape in stomach cancer. Gut, 1999. 44(2): p. 156–62. [DOI] [PMC free article] [PubMed] [Google Scholar]
- 15.Zietz C, et al. , Inverse relation of Fas-ligand and tumor-infiltrating lymphocytes in angiosarcoma: indications of apoptotic tumor counterattack. Am J Pathol, 2001. 159(3): p. 963–70. [DOI] [PMC free article] [PubMed] [Google Scholar]
- 16.Leyton JV, et al. , Humanized radioiodinated minibody for imaging of prostate stem cell antigen-expressing tumors. Clin Cancer Res, 2008. 14(22): p. 7488–96. [DOI] [PMC free article] [PubMed] [Google Scholar]
- 17.Leyton JV, et al. , Engineered humanized diabodies for microPET imaging of prostate stem cell antigen-expressing tumors. Protein Eng Des Sel, 2009. 22(3): p. 209–16. [DOI] [PMC free article] [PubMed] [Google Scholar]
- 18.Watanabe N, et al. , Fine-tuning the CAR spacer improves T-cell potency. Oncoimmunology, 2016. 5(12): p. e1253656. [DOI] [PMC free article] [PubMed] [Google Scholar]
- 19.Riviere I, Brose K, and Mulligan RC, Effects of retroviral vector design on expression of human adenosine deaminase in murine bone marrow transplant recipients engrafted with genetically modified cells. Proc Natl Acad Sci U S A, 1995. 92(15): p. 6733–7. [DOI] [PMC free article] [PubMed] [Google Scholar]
- 20.Bajgain P, et al. , CAR T cell therapy for breast cancer: harnessing the tumor milieu to drive T cell activation. J Immunother Cancer, 2018. 6(1): p. 34. [DOI] [PMC free article] [PubMed] [Google Scholar]
- 21.Starling GC, et al. , Identification of amino acid residues important for ligand binding to Fas. J Exp Med, 1997. 185(8): p. 1487–92. [DOI] [PMC free article] [PubMed] [Google Scholar]
- 22.Mezzanotte L, et al. , Evaluating reporter genes of different luciferases for optimized in vivo bioluminescence imaging of transplanted neural stem cells in the brain. Contrast Media Mol Imaging, 2013. 8(6): p. 505–13. [DOI] [PubMed] [Google Scholar]
- 23.Iwano S, et al. , Single-cell bioluminescence imaging of deep tissue in freely moving animals. Science, 2018. 359(6378): p. 935–939. [DOI] [PubMed] [Google Scholar]
- 24.Leen AM, et al. , Reversal of tumor immune inhibition using a chimeric cytokine receptor. Mol Ther, 2014. 22(6): p. 1211–1220. [DOI] [PMC free article] [PubMed] [Google Scholar]
- 25.Kelly PF, et al. , RD114-pseudotyped oncoretroviral vectors. Biological and physical properties. Ann N Y Acad Sci, 2001. 938: p. 262–76; discussion 276–7. [PubMed] [Google Scholar]
- 26.Vera J, et al. , T lymphocytes redirected against the kappa light chain of human immunoglobulin efficiently kill mature B lymphocyte-derived malignant cells. Blood, 2006. 108(12): p. 3890–7. [DOI] [PMC free article] [PubMed] [Google Scholar]
- 27.Bajgain P, et al. , Abstract 3501: Binary control of CAR-CTL by transgenic IL-7 and IL-7R expression. Cancer Research, 2012. 72(8_Supplement): p. 3501–3501. [Google Scholar]
- 28.Buchbinder EI and Desai A, CTLA-4 and PD-1 Pathways: Similarities, Differences, and Implications of Their Inhibition. Am J Clin Oncol, 2016. 39(1): p. 98–106. [DOI] [PMC free article] [PubMed] [Google Scholar]
- 29.Batlle E and Massague J, Transforming Growth Factor-beta Signaling in Immunity and Cancer. Immunity, 2019. 50(4): p. 924–940. [DOI] [PMC free article] [PubMed] [Google Scholar]
- 30.Yamamoto TN, et al. , T cells genetically engineered to overcome death signaling enhance adoptive cancer immunotherapy. J Clin Invest, 2019. 129(4): p. 1551–1565. [DOI] [PMC free article] [PubMed] [Google Scholar]
- 31.Lyon DE, et al. , Cytokine comparisons between women with breast cancer and women with a negative breast biopsy. Nurs Res, 2008. 57(1): p. 51–8. [DOI] [PMC free article] [PubMed] [Google Scholar]
- 32.Dotti G, et al. , Human cytotoxic T lymphocytes with reduced sensitivity to Fas-induced apoptosis. Blood, 2005. 105(12): p. 4677–84. [DOI] [PMC free article] [PubMed] [Google Scholar]
- 33.Ren J, et al. , A versatile system for rapid multiplex genome-edited CAR T cell generation. Oncotarget, 2017. 8(10): p. 17002–17011. [DOI] [PMC free article] [PubMed] [Google Scholar]
- 34.Oda SK, et al. , A Fas-4–1BB fusion protein converts a death to a pro-survival signal and enhances T cell therapy. J Exp Med, 2020. 217(12). [DOI] [PMC free article] [PubMed] [Google Scholar]
- 35.Jiang Y, Li Y, and Zhu B, T-cell exhaustion in the tumor microenvironment. Cell Death Dis, 2015. 6: p. e1792. [DOI] [PMC free article] [PubMed] [Google Scholar]
- 36.Ben-Shmuel A, Biber G, and Barda-Saad M, Unleashing Natural Killer Cells in the Tumor Microenvironment-The Next Generation of Immunotherapy? Front Immunol, 2020. 11: p. 275. [DOI] [PMC free article] [PubMed] [Google Scholar]
- 37.Woroniecka K, et al. , T-Cell Exhaustion Signatures Vary with Tumor Type and Are Severe in Glioblastoma. Clin Cancer Res, 2018. 24(17): p. 4175–4186. [DOI] [PMC free article] [PubMed] [Google Scholar]
- 38.Devaud C, et al. , Immune modulation of the tumor microenvironment for enhancing cancer immunotherapy. Oncoimmunology, 2013. 2(8): p. e25961. [DOI] [PMC free article] [PubMed] [Google Scholar]
- 39.Pitt JM, et al. , Targeting the tumor microenvironment: removing obstruction to anticancer immune responses and immunotherapy. Ann Oncol, 2016. 27(8): p. 1482–92. [DOI] [PubMed] [Google Scholar]
- 40.Murciano-Goroff YR, Warner AB, and Wolchok JD, The future of cancer immunotherapy: microenvironment-targeting combinations. Cell Res, 2020. 30(6): p. 507–519. [DOI] [PMC free article] [PubMed] [Google Scholar]
- 41.Klapper JA, et al. , High-dose interleukin-2 for the treatment of metastatic renal cell carcinoma : a retrospective analysis of response and survival in patients treated in the surgery branch at the National Cancer Institute between 1986 and 2006. Cancer, 2008. 113(2): p. 293–301. [DOI] [PMC free article] [PubMed] [Google Scholar]
- 42.Schadendorf D, et al. , Pooled Analysis of Long-Term Survival Data From Phase II and Phase III Trials of Ipilimumab in Unresectable or Metastatic Melanoma. J Clin Oncol, 2015. 33(17): p. 1889–94. [DOI] [PMC free article] [PubMed] [Google Scholar]
- 43.Cohen EEW, et al. , Pembrolizumab versus methotrexate, docetaxel, or cetuximab for recurrent or metastatic head-and-neck squamous cell carcinoma (KEYNOTE-040): a randomised, open-label, phase 3 study. Lancet, 2019. 393(10167): p. 156–167. [DOI] [PubMed] [Google Scholar]
- 44.Tumeh PC, et al. , Liver Metastasis and Treatment Outcome with Anti-PD-1 Monoclonal Antibody in Patients with Melanoma and NSCLC. Cancer Immunol Res, 2017. 5(5): p. 417–424. [DOI] [PMC free article] [PubMed] [Google Scholar]
- 45.Rosenberg SA, et al. , Experience with the use of high-dose interleukin-2 in the treatment of 652 cancer patients. Ann Surg, 1989. 210(4): p. 474–84; discussion 484–5. [DOI] [PMC free article] [PubMed] [Google Scholar]
- 46.Martins F, et al. , Adverse effects of immune-checkpoint inhibitors: epidemiology, management and surveillance. Nat Rev Clin Oncol, 2019. 16(9): p. 563–580. [DOI] [PubMed] [Google Scholar]
- 47.Carson WE, et al. , A potential role for interleukin-15 in the regulation of human natural killer cell survival. J Clin Invest, 1997. 99(5): p. 937–43. [DOI] [PMC free article] [PubMed] [Google Scholar]
- 48.Berard M, et al. , IL-15 promotes the survival of naive and memory phenotype CD8+ T cells. J Immunol, 2003. 170(10): p. 5018–26. [DOI] [PubMed] [Google Scholar]
- 49.Ruella M and Maus MV, Catch me if you can: Leukemia Escape after CD19-Directed T Cell Immunotherapies. Comput Struct Biotechnol J, 2016. 14: p. 357–362. [DOI] [PMC free article] [PubMed] [Google Scholar]
- 50.Martino M, et al. , A Review of Clinical Outcomes of CAR T-Cell Therapies for B-Acute Lymphoblastic Leukemia. Int J Mol Sci, 2021. 22(4). [DOI] [PMC free article] [PubMed] [Google Scholar]
- 51.Strasser A, Jost PJ, and Nagata S, The many roles of FAS receptor signaling in the immune system. Immunity, 2009. 30(2): p. 180–92. [DOI] [PMC free article] [PubMed] [Google Scholar]
- 52.Holzelova E, et al. , Autoimmune lymphoproliferative syndrome with somatic Fas mutations. N Engl J Med, 2004. 351(14): p. 1409–18. [DOI] [PubMed] [Google Scholar]
- 53.Di Stasi A, et al. , Inducible apoptosis as a safety switch for adoptive cell therapy. N Engl J Med, 2011. 365(18): p. 1673–83. [DOI] [PMC free article] [PubMed] [Google Scholar]
Associated Data
This section collects any data citations, data availability statements, or supplementary materials included in this article.
Supplementary Materials
Data Availability Statement
The data generated in this study are available within the manuscript and its supplementary files or from the corresponding author upon reasonable request.